|
||||||||||||||||||||||||||||||||||||||||||||||||||||||||||||||||||||||||||||||||||||||||||||||||||||||||||||||||||||||||||||||||||||||||||||||||||||||||||||||||||||||||||||||||||||||||||||||||||||||||||||||||||||||||||||||||||||||||||||||||||||||||||||||||||||||||||||||||||||||||||||||||||||||||||||||||||||||||||
| |
| Phenotypic Information (metabolism pathway, cancer, disease, phenome) |
| |
| |
| Gene-Gene Network Information: Co-Expression Network, Interacting Genes & KEGG |
| |
|


| Gene Summary for NUPL2 |
| Top |
| Phenotypic Information for NUPL2(metabolism pathway, cancer, disease, phenome) |
| Cancer | CGAP: NUPL2 |
| Familial Cancer Database: NUPL2 | |
| * This gene is included in those cancer gene databases. |
|
|
|
|
|
| . | ||||||||||||||||||||||||||||||||||||||||||||||||||||||||||||||||||||||||||||||||||||||||||||||||||||||||||||||||||||||||||||||||||||||||||||||||||||||||||||||||||||||||||||||||||||||||||||||||||||||||||||||||||||||||||||||||||||||||||||||||||||||||||||||||||||||||||||||||||||||||||||||||||||||||||||||||||||
Oncogene 1 | Significant driver gene in | |||||||||||||||||||||||||||||||||||||||||||||||||||||||||||||||||||||||||||||||||||||||||||||||||||||||||||||||||||||||||||||||||||||||||||||||||||||||||||||||||||||||||||||||||||||||||||||||||||||||||||||||||||||||||||||||||||||||||||||||||||||||||||||||||||||||||||||||||||||||||||||||||||||||||||||||||||||||||
| cf) number; DB name 1 Oncogene; http://nar.oxfordjournals.org/content/35/suppl_1/D721.long, 2 Tumor Suppressor gene; https://bioinfo.uth.edu/TSGene/, 3 Cancer Gene Census; http://www.nature.com/nrc/journal/v4/n3/abs/nrc1299.html, 4 CancerGenes; http://nar.oxfordjournals.org/content/35/suppl_1/D721.long, 5 Network of Cancer Gene; http://ncg.kcl.ac.uk/index.php, 1Therapeutic Vulnerabilities in Cancer; http://cbio.mskcc.org/cancergenomics/statius/ |
| REACTOME_METABOLISM_OF_NON_CODING_RNA REACTOME_METABOLISM_OF_RNA REACTOME_METABOLISM_OF_CARBOHYDRATES | |
| OMIM | |
| Orphanet | |
| Disease | KEGG Disease: NUPL2 |
| MedGen: NUPL2 (Human Medical Genetics with Condition) | |
| ClinVar: NUPL2 | |
| Phenotype | MGI: NUPL2 (International Mouse Phenotyping Consortium) |
| PhenomicDB: NUPL2 | |
| Mutations for NUPL2 |
| * Under tables are showing count per each tissue to give us broad intuition about tissue specific mutation patterns.You can go to the detailed page for each mutation database's web site. |
| There's no structural variation information in COSMIC data for this gene. |
| * From mRNA Sanger sequences, Chitars2.0 arranged chimeric transcripts. This table shows NUPL2 related fusion information. |
| ID | Head Gene | Tail Gene | Accession | Gene_a | qStart_a | qEnd_a | Chromosome_a | tStart_a | tEnd_a | Gene_a | qStart_a | qEnd_a | Chromosome_a | tStart_a | tEnd_a |
| CR984678 | NUPL2 | 1 | 484 | 7 | 23221666 | 23226765 | TMC8 | 483 | 772 | 17 | 76137496 | 76137787 | |
| Top |
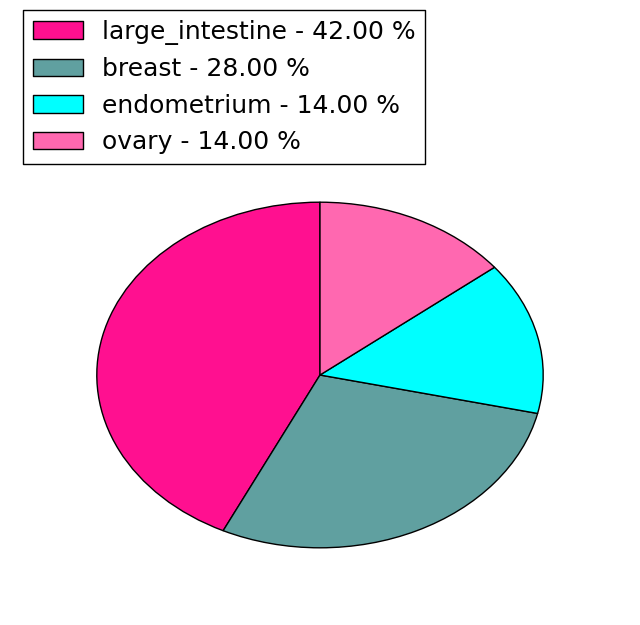
| Mutation type/ Tissue ID | brca | cns | cerv | endome | haematopo | kidn | Lintest | liver | lung | ns | ovary | pancre | prost | skin | stoma | thyro | urina | |||
| Total # sample | 1 | |||||||||||||||||||
| GAIN (# sample) | 1 | |||||||||||||||||||
| LOSS (# sample) |
| cf) Tissue ID; Tissue type (1; Breast, 2; Central_nervous_system, 3; Cervix, 4; Endometrium, 5; Haematopoietic_and_lymphoid_tissue, 6; Kidney, 7; Large_intestine, 8; Liver, 9; Lung, 10; NS, 11; Ovary, 12; Pancreas, 13; Prostate, 14; Skin, 15; Stomach, 16; Thyroid, 17; Urinary_tract) |
| Top |
|
 |
| Top |
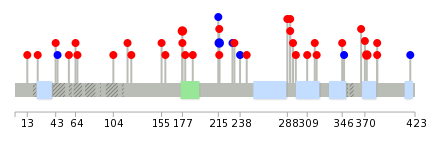
| Stat. for Non-Synonymous SNVs (# total SNVs=36) | (# total SNVs=4) |
 | 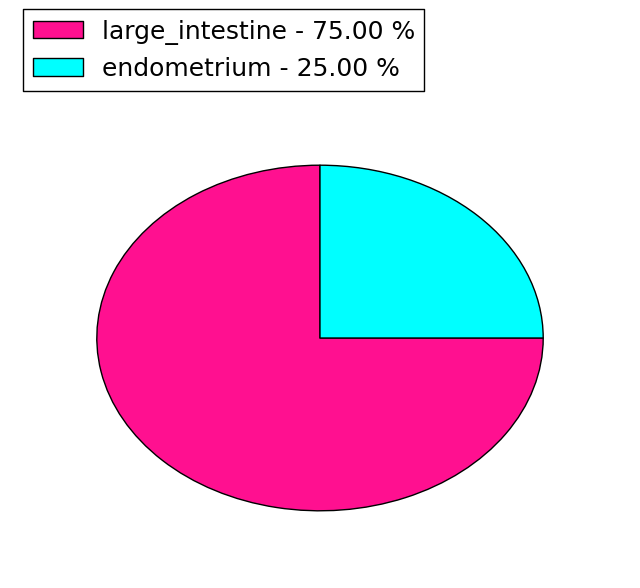 |
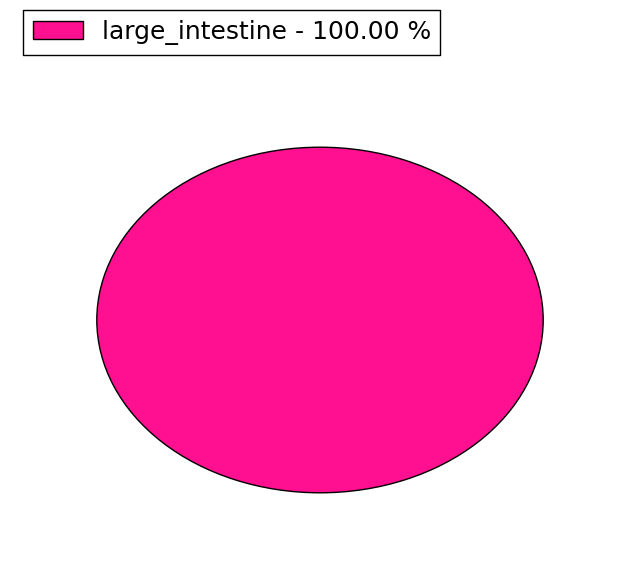
(# total SNVs=2) | (# total SNVs=7) |
 |  |
| Top |
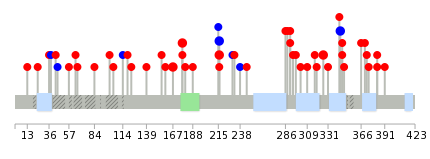
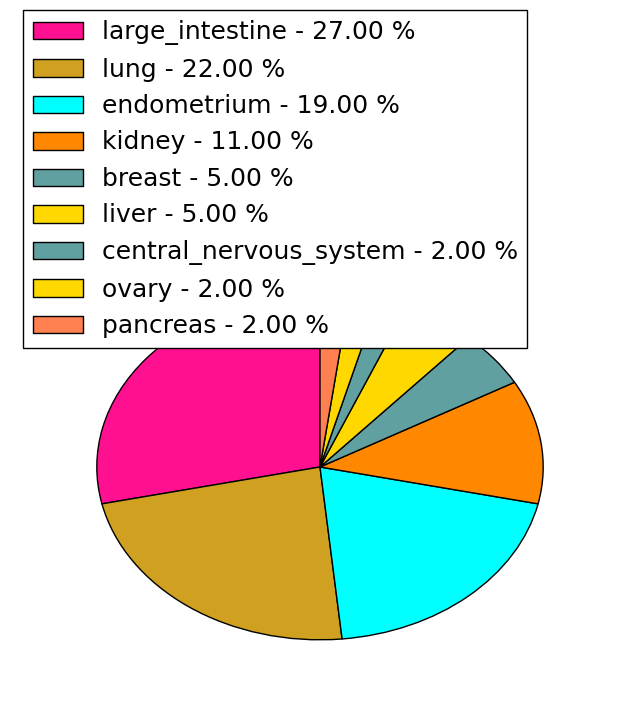
| * When you move the cursor on each content, you can see more deailed mutation information on the Tooltip. Those are primary_site,primary_histology,mutation(aa),pubmedID. |
| GRCh37 position | Mutation(aa) | Unique sampleID count |
| chr7:23221797-23221798 | p.G31_R32insRQQP | 5 |
| chr7:23236306-23236306 | p.S177F | 3 |
| chr7:23240124-23240124 | p.G344G | 2 |
| chr7:23240128-23240128 | p.G346C | 2 |
| chr7:23239114-23239114 | p.P216L | 2 |
| chr7:23239115-23239115 | p.P216P | 2 |
| chr7:23235512-23235512 | p.T167N | 2 |
| chr7:23224773-23224773 | p.G71fs*51 | 2 |
| chr7:23240069-23240069 | p.G326V | 2 |
| chr7:23240239-23240239 | p.D383Y | 2 |
| Top |
|
 |
| Point Mutation/ Tissue ID | 1 | 2 | 3 | 4 | 5 | 6 | 7 | 8 | 9 | 10 | 11 | 12 | 13 | 14 | 15 | 16 | 17 | 18 | 19 | 20 |
| # sample | 3 | 1 | 8 | 1 | 1 | 3 | 3 | 2 | 1 | 4 | 6 | 7 | ||||||||
| # mutation | 3 | 1 | 8 | 1 | 1 | 3 | 3 | 2 | 1 | 3 | 6 | 8 | ||||||||
| nonsynonymous SNV | 3 | 1 | 7 | 1 | 3 | 3 | 2 | 1 | 2 | 3 | 7 | |||||||||
| synonymous SNV | 1 | 1 | 1 | 3 | 1 |
| cf) Tissue ID; Tissue type (1; BLCA[Bladder Urothelial Carcinoma], 2; BRCA[Breast invasive carcinoma], 3; CESC[Cervical squamous cell carcinoma and endocervical adenocarcinoma], 4; COAD[Colon adenocarcinoma], 5; GBM[Glioblastoma multiforme], 6; Glioma Low Grade, 7; HNSC[Head and Neck squamous cell carcinoma], 8; KICH[Kidney Chromophobe], 9; KIRC[Kidney renal clear cell carcinoma], 10; KIRP[Kidney renal papillary cell carcinoma], 11; LAML[Acute Myeloid Leukemia], 12; LUAD[Lung adenocarcinoma], 13; LUSC[Lung squamous cell carcinoma], 14; OV[Ovarian serous cystadenocarcinoma ], 15; PAAD[Pancreatic adenocarcinoma], 16; PRAD[Prostate adenocarcinoma], 17; SKCM[Skin Cutaneous Melanoma], 18:STAD[Stomach adenocarcinoma], 19:THCA[Thyroid carcinoma], 20:UCEC[Uterine Corpus Endometrial Carcinoma]) |
| Top |
| * We represented just top 10 SNVs. When you move the cursor on each content, you can see more deailed mutation information on the Tooltip. Those are primary_site, primary_histology, mutation(aa), pubmedID. |
| Genomic Position | Mutation(aa) | Unique sampleID count |
| chr7:23236306 | p.S177F | 3 |
| chr7:23240207 | p.P216P | 2 |
| chr7:23240239 | p.S372Y | 2 |
| chr7:23239115 | p.D383H | 2 |
| chr7:23224695 | p.N43S | 1 |
| chr7:23240200 | p.S370T | 1 |
| chr7:23236315 | p.R45R | 1 |
| chr7:23239963 | p.S230S | 1 |
| chr7:23224702 | p.V57G | 1 |
| chr7:23236339 | p.G232D | 1 |
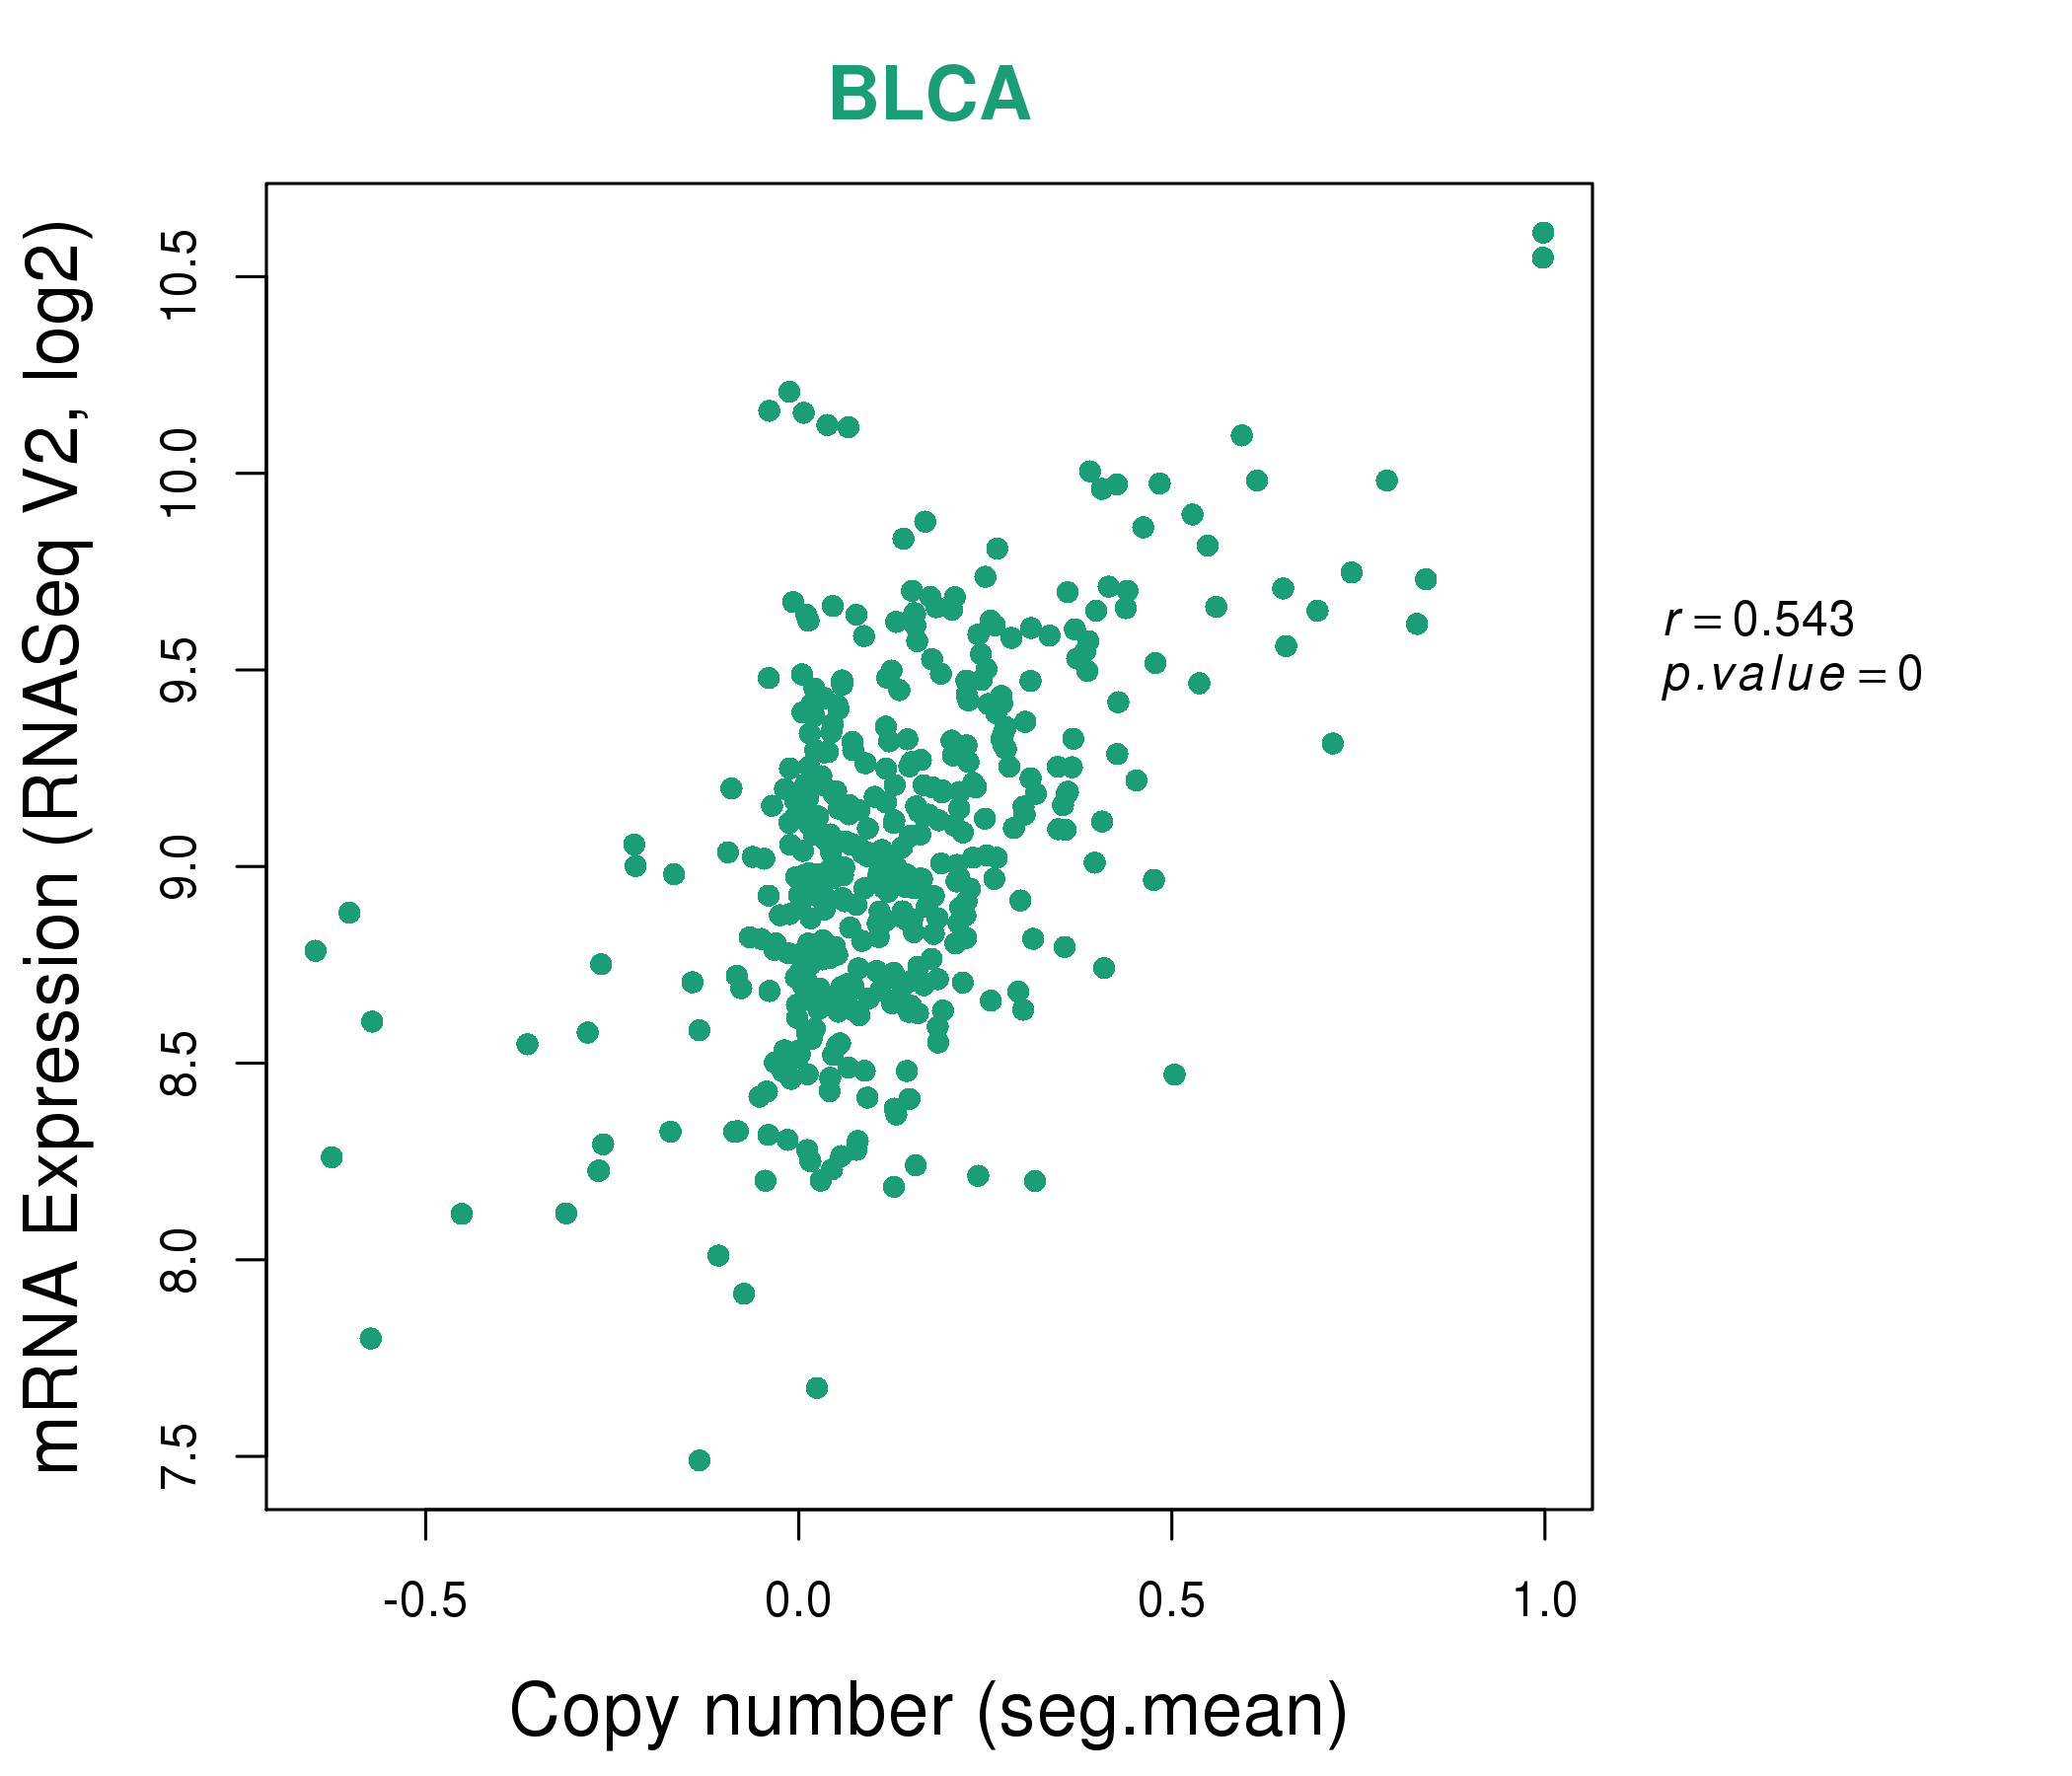
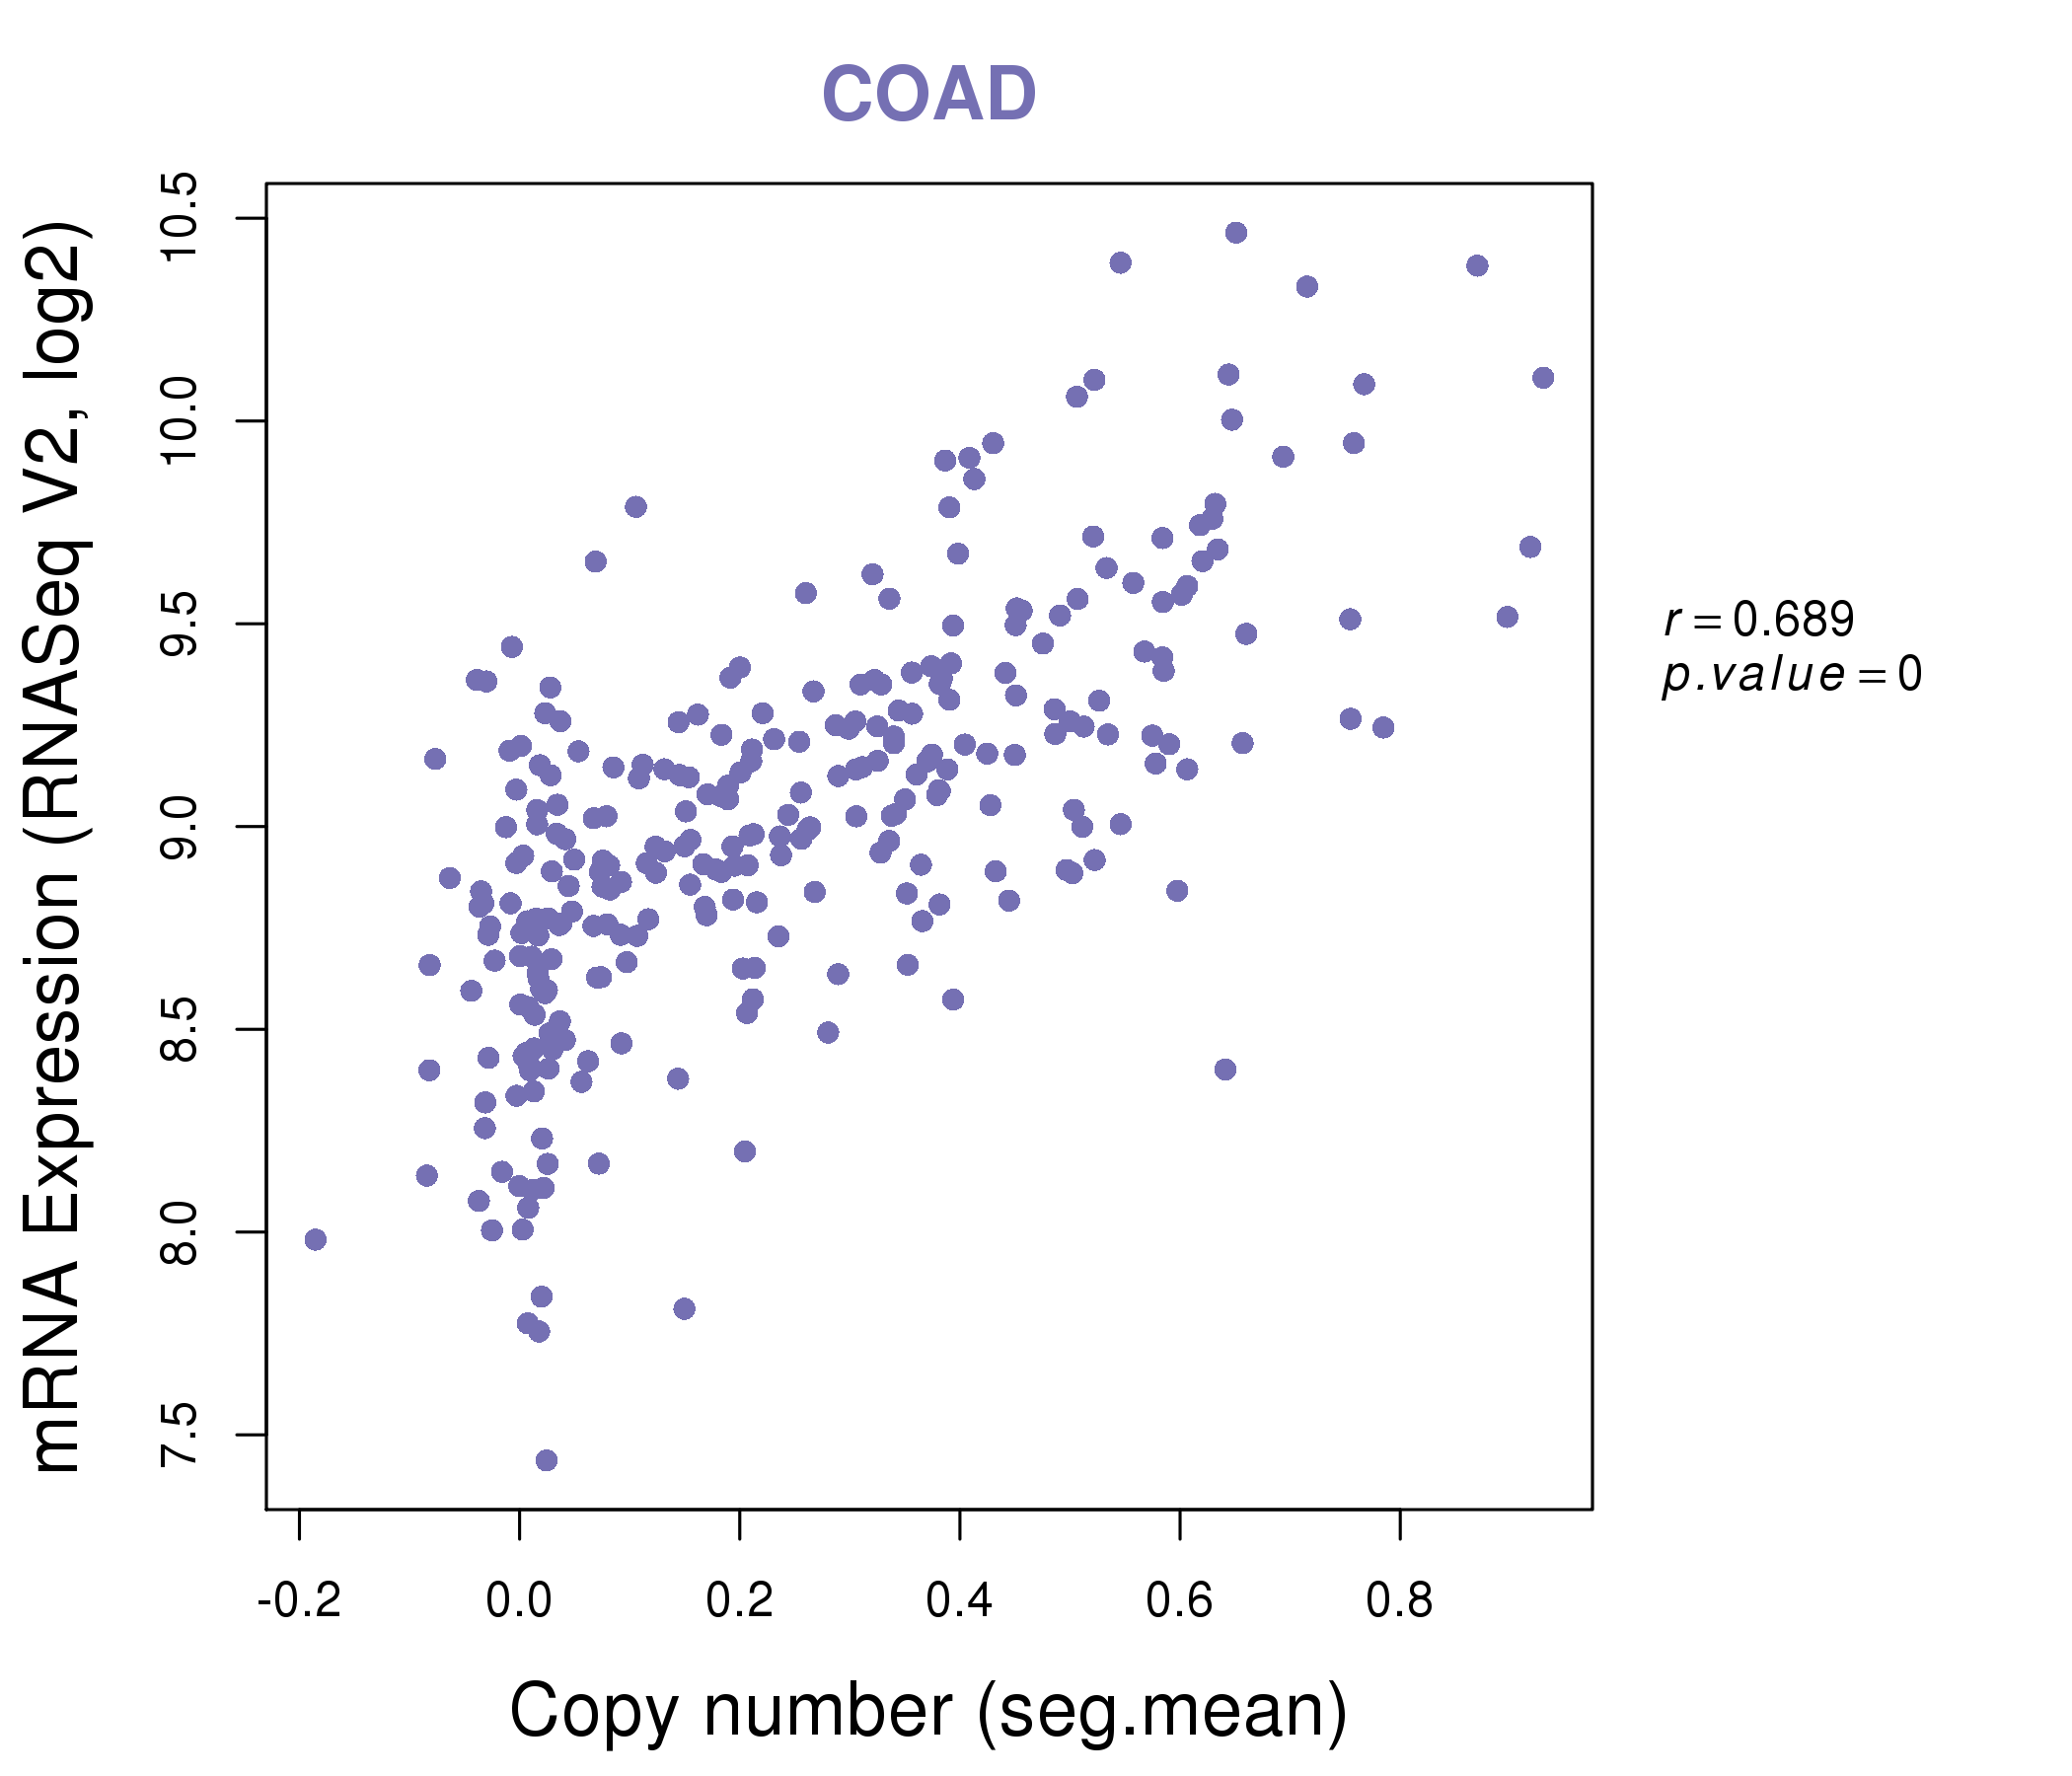
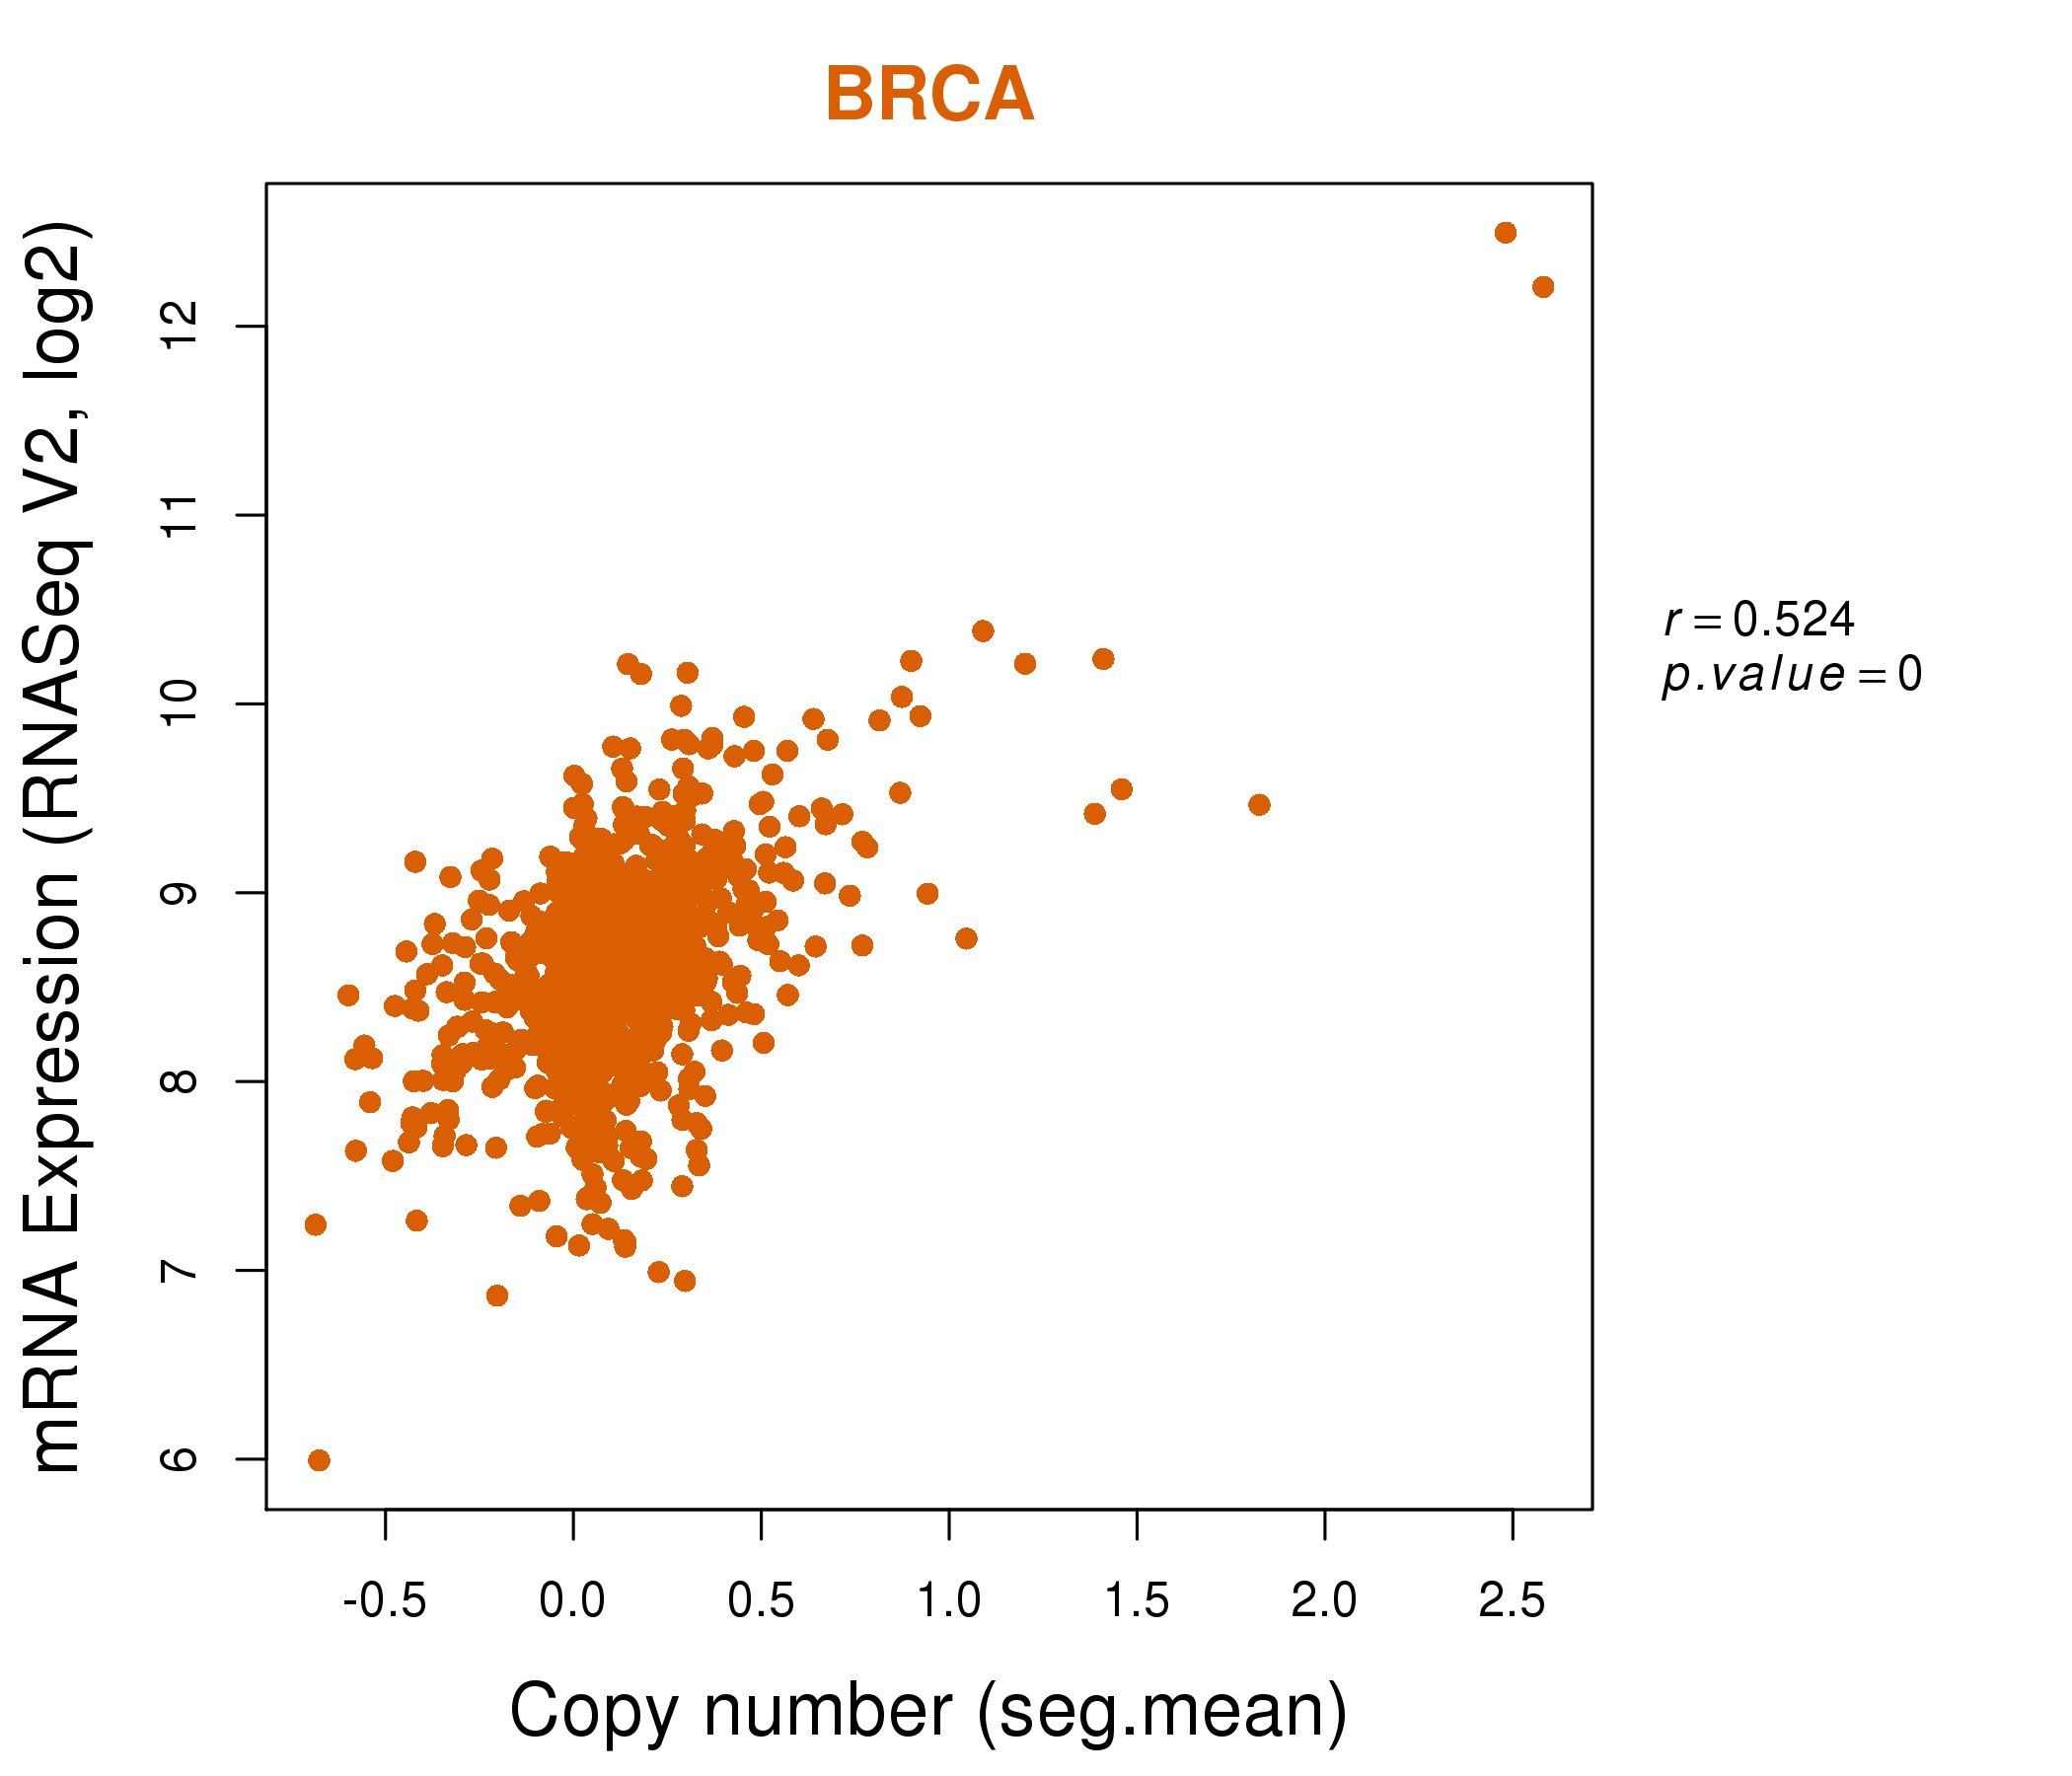
| * Copy number data were extracted from TCGA using R package TCGA-Assembler. The URLs of all public data files on TCGA DCC data server were gathered on Jan-05-2015. Function ProcessCNAData in TCGA-Assembler package was used to obtain gene-level copy number value which is calculated as the average copy number of the genomic region of a gene. |
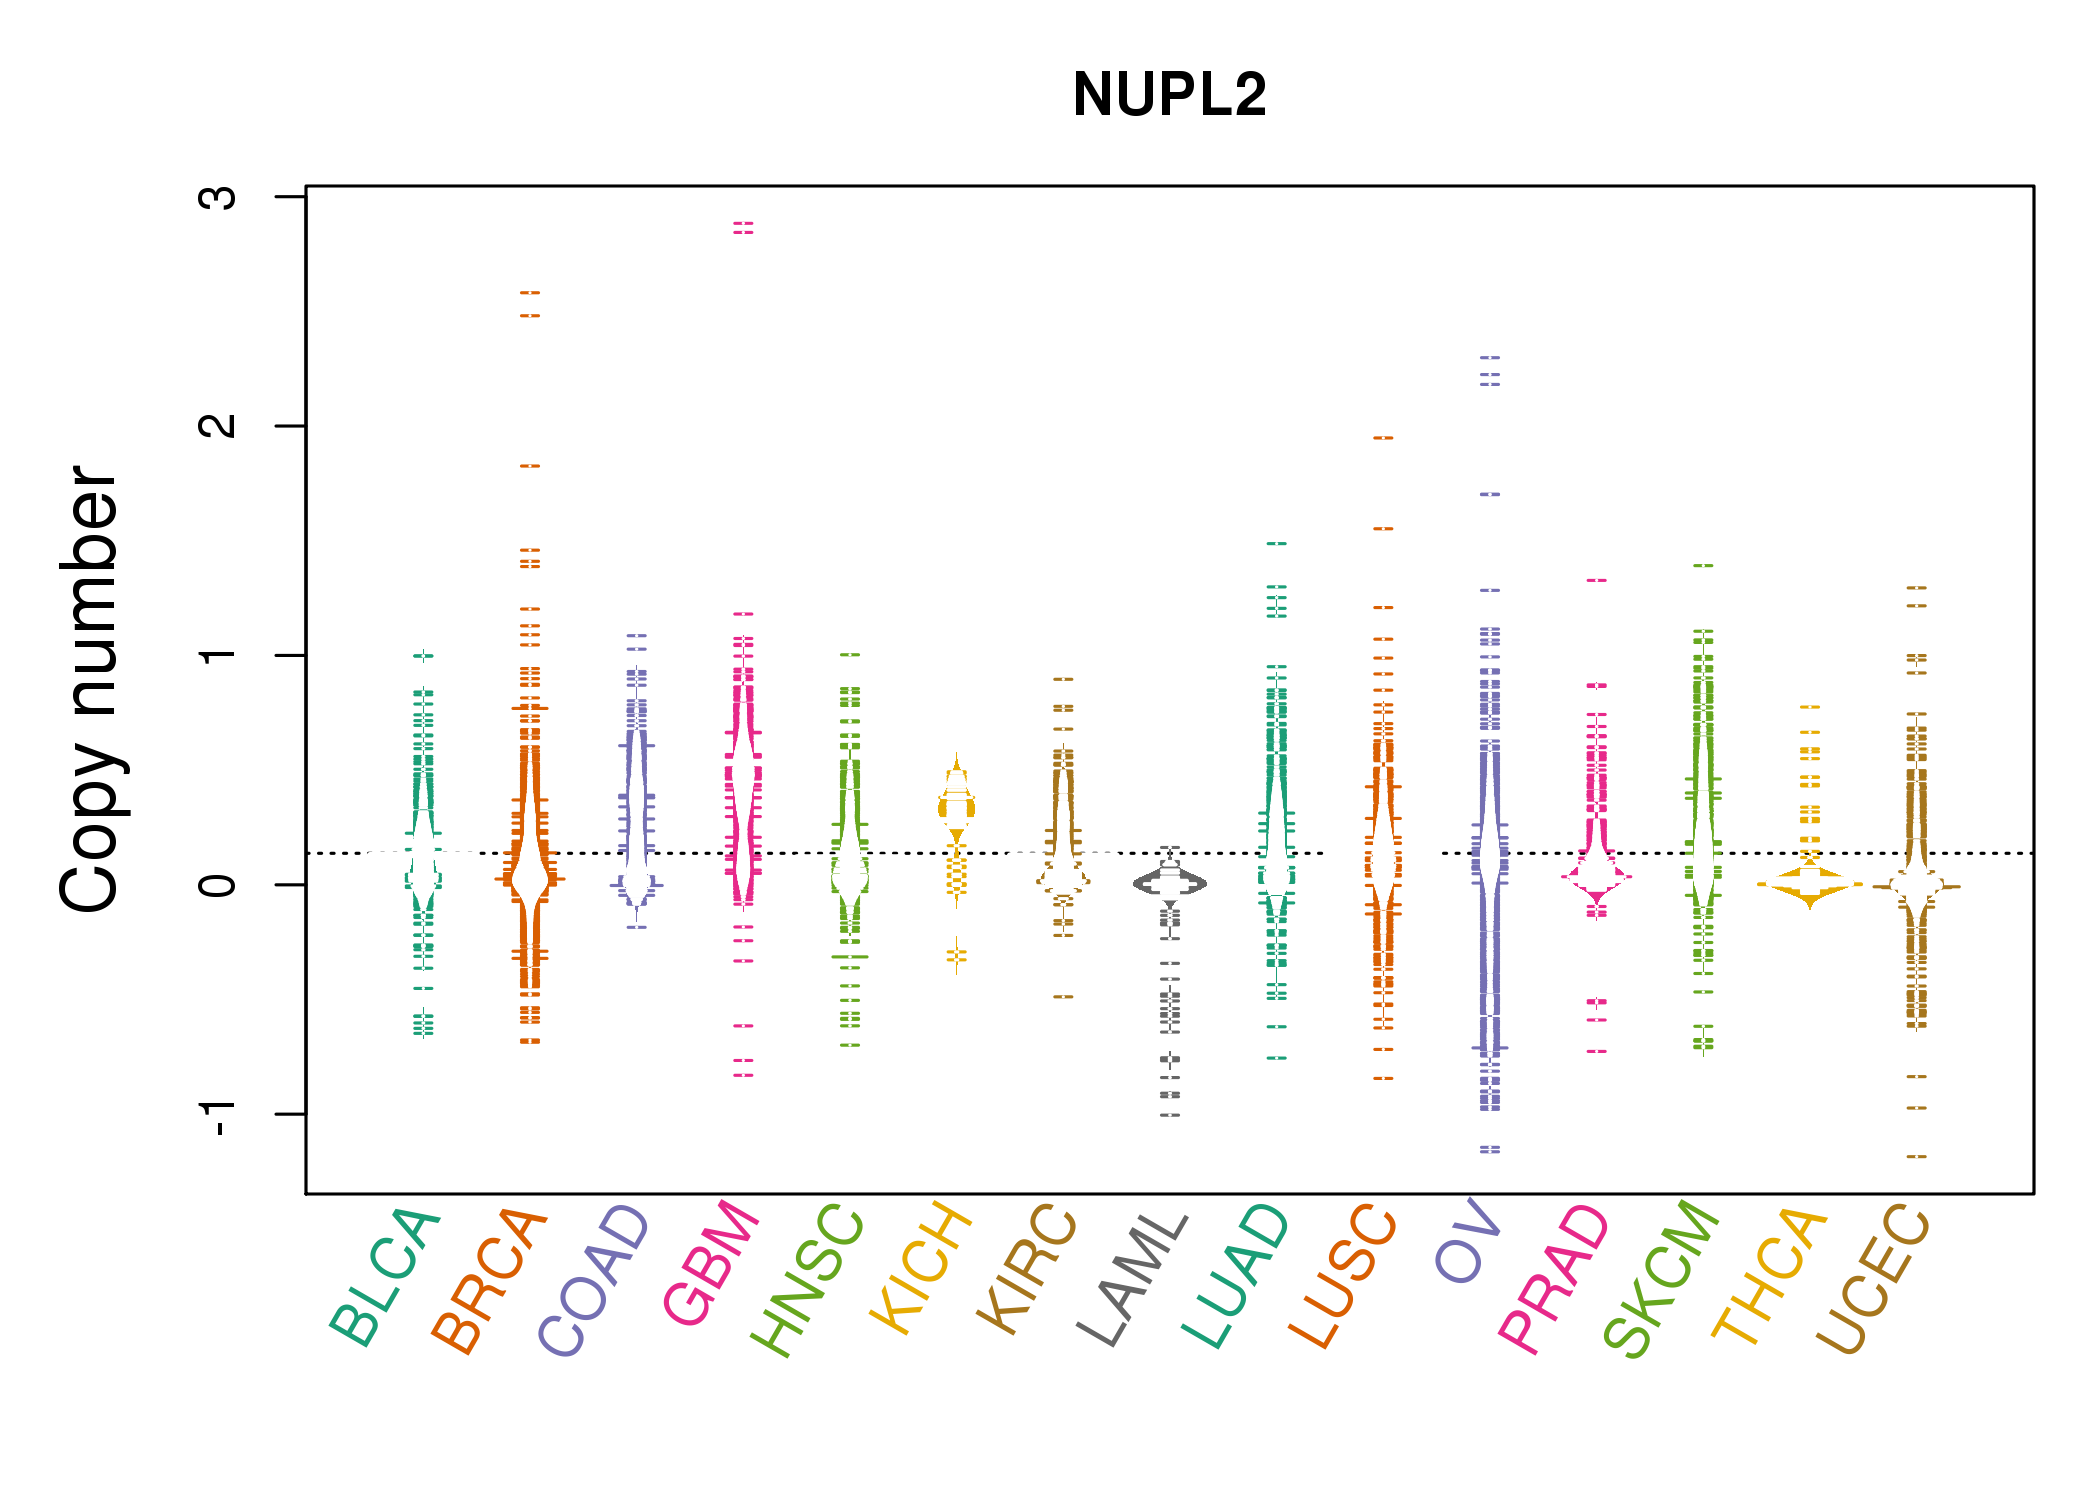 |
| cf) Tissue ID[Tissue type]: BLCA[Bladder Urothelial Carcinoma], BRCA[Breast invasive carcinoma], CESC[Cervical squamous cell carcinoma and endocervical adenocarcinoma], COAD[Colon adenocarcinoma], GBM[Glioblastoma multiforme], Glioma Low Grade, HNSC[Head and Neck squamous cell carcinoma], KICH[Kidney Chromophobe], KIRC[Kidney renal clear cell carcinoma], KIRP[Kidney renal papillary cell carcinoma], LAML[Acute Myeloid Leukemia], LUAD[Lung adenocarcinoma], LUSC[Lung squamous cell carcinoma], OV[Ovarian serous cystadenocarcinoma ], PAAD[Pancreatic adenocarcinoma], PRAD[Prostate adenocarcinoma], SKCM[Skin Cutaneous Melanoma], STAD[Stomach adenocarcinoma], THCA[Thyroid carcinoma], UCEC[Uterine Corpus Endometrial Carcinoma] |
| Top |
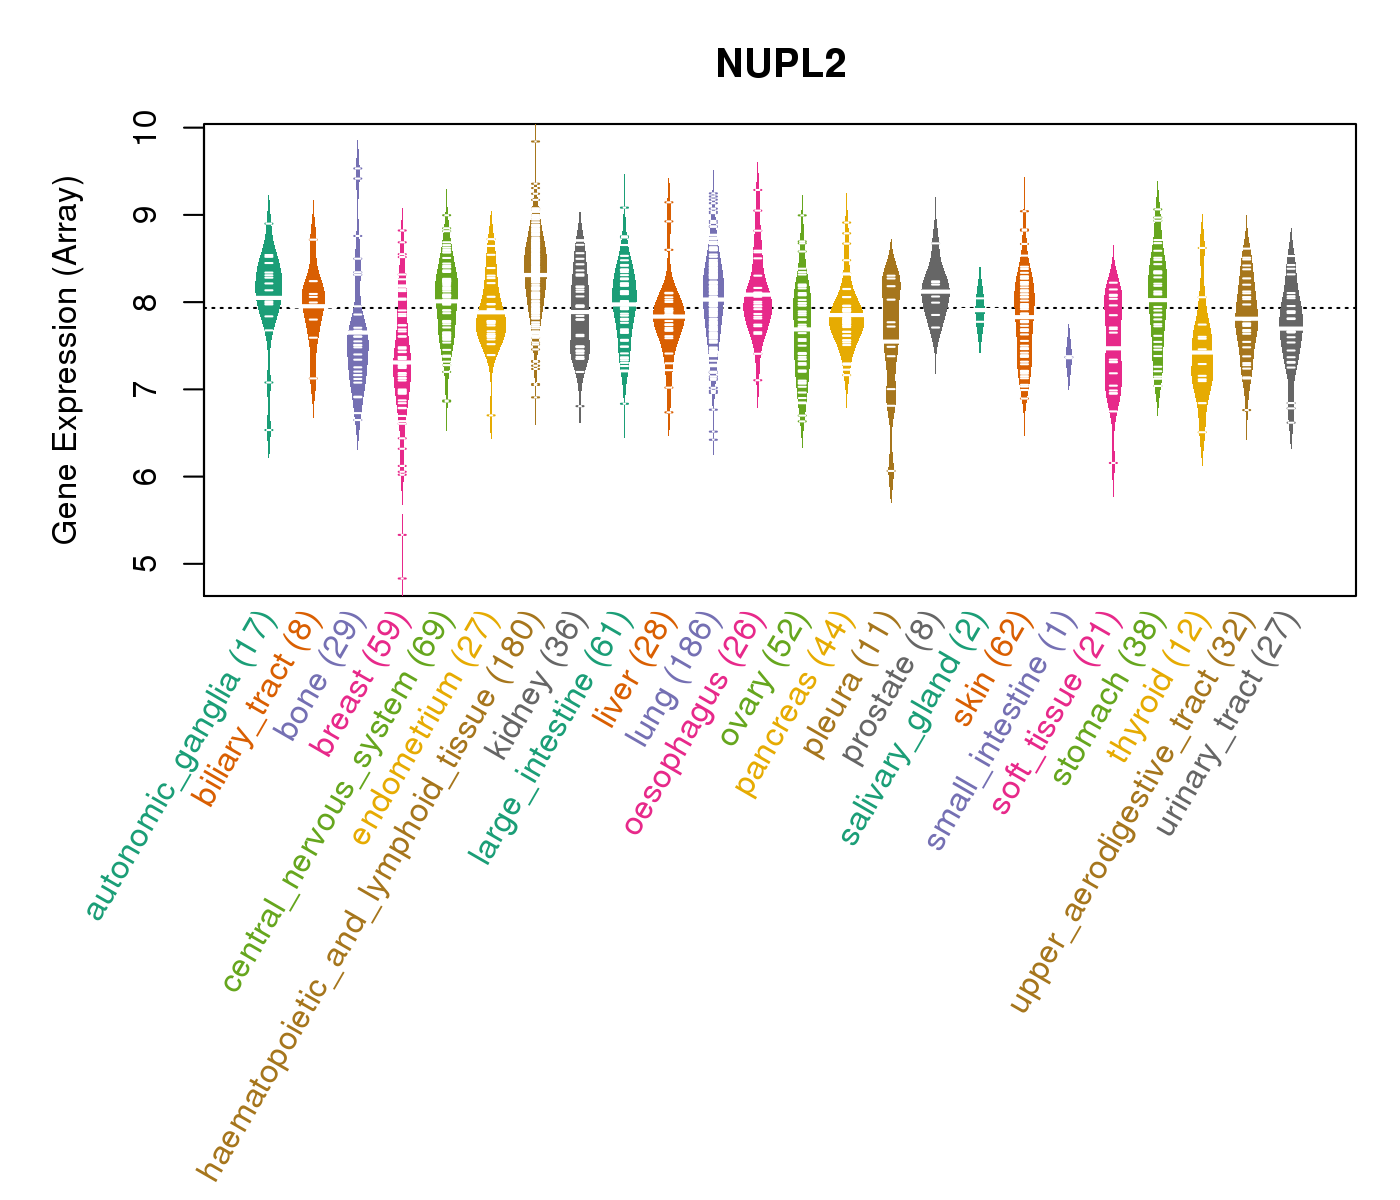
| Gene Expression for NUPL2 |
| * CCLE gene expression data were extracted from CCLE_Expression_Entrez_2012-10-18.res: Gene-centric RMA-normalized mRNA expression data. |
 |
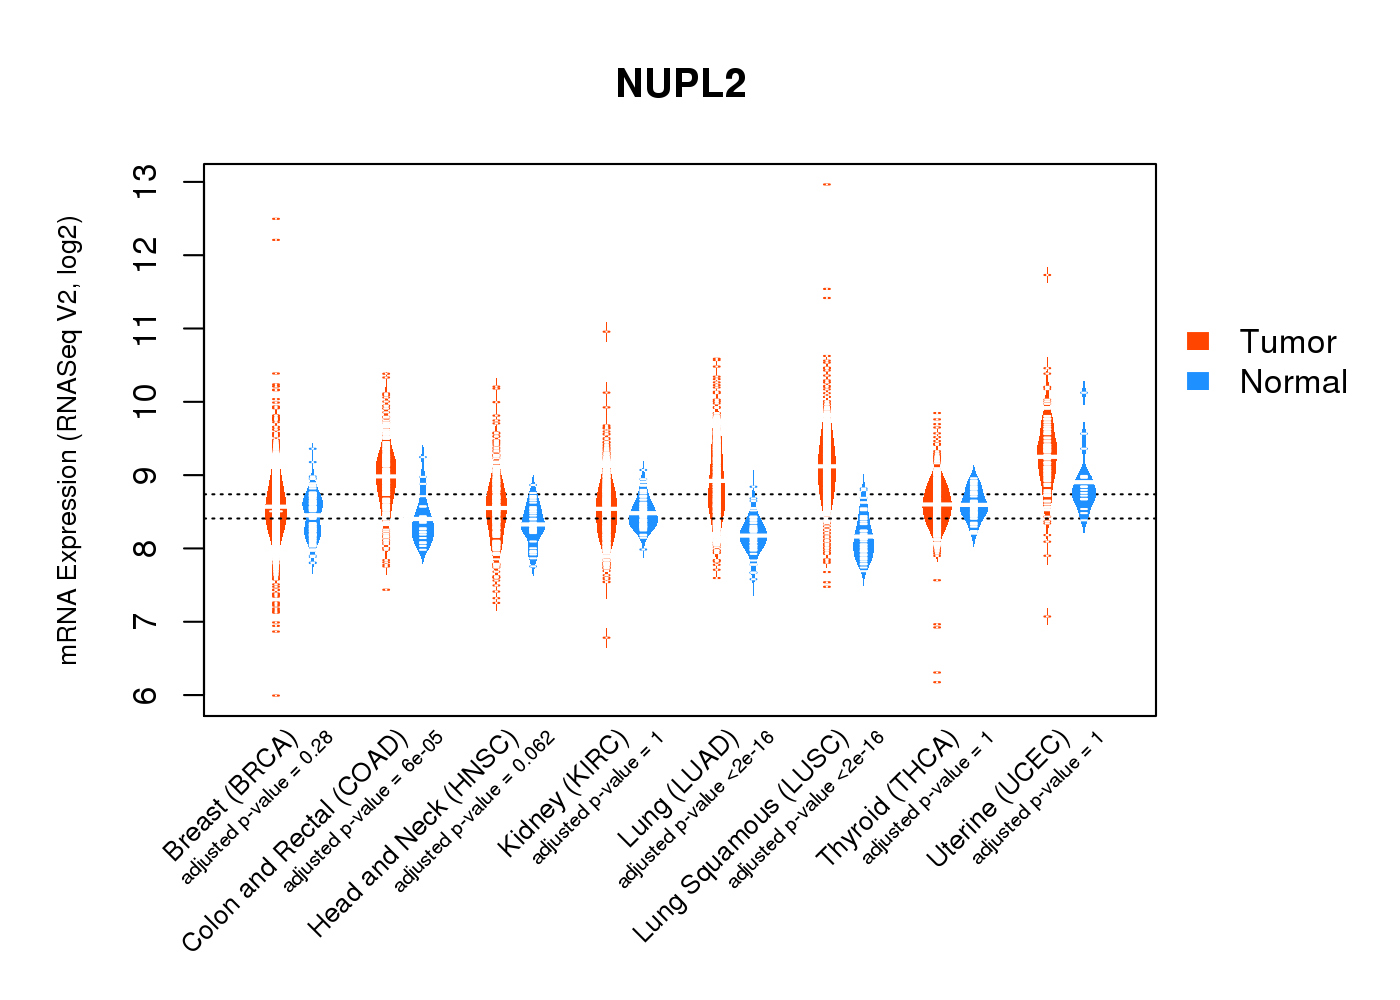
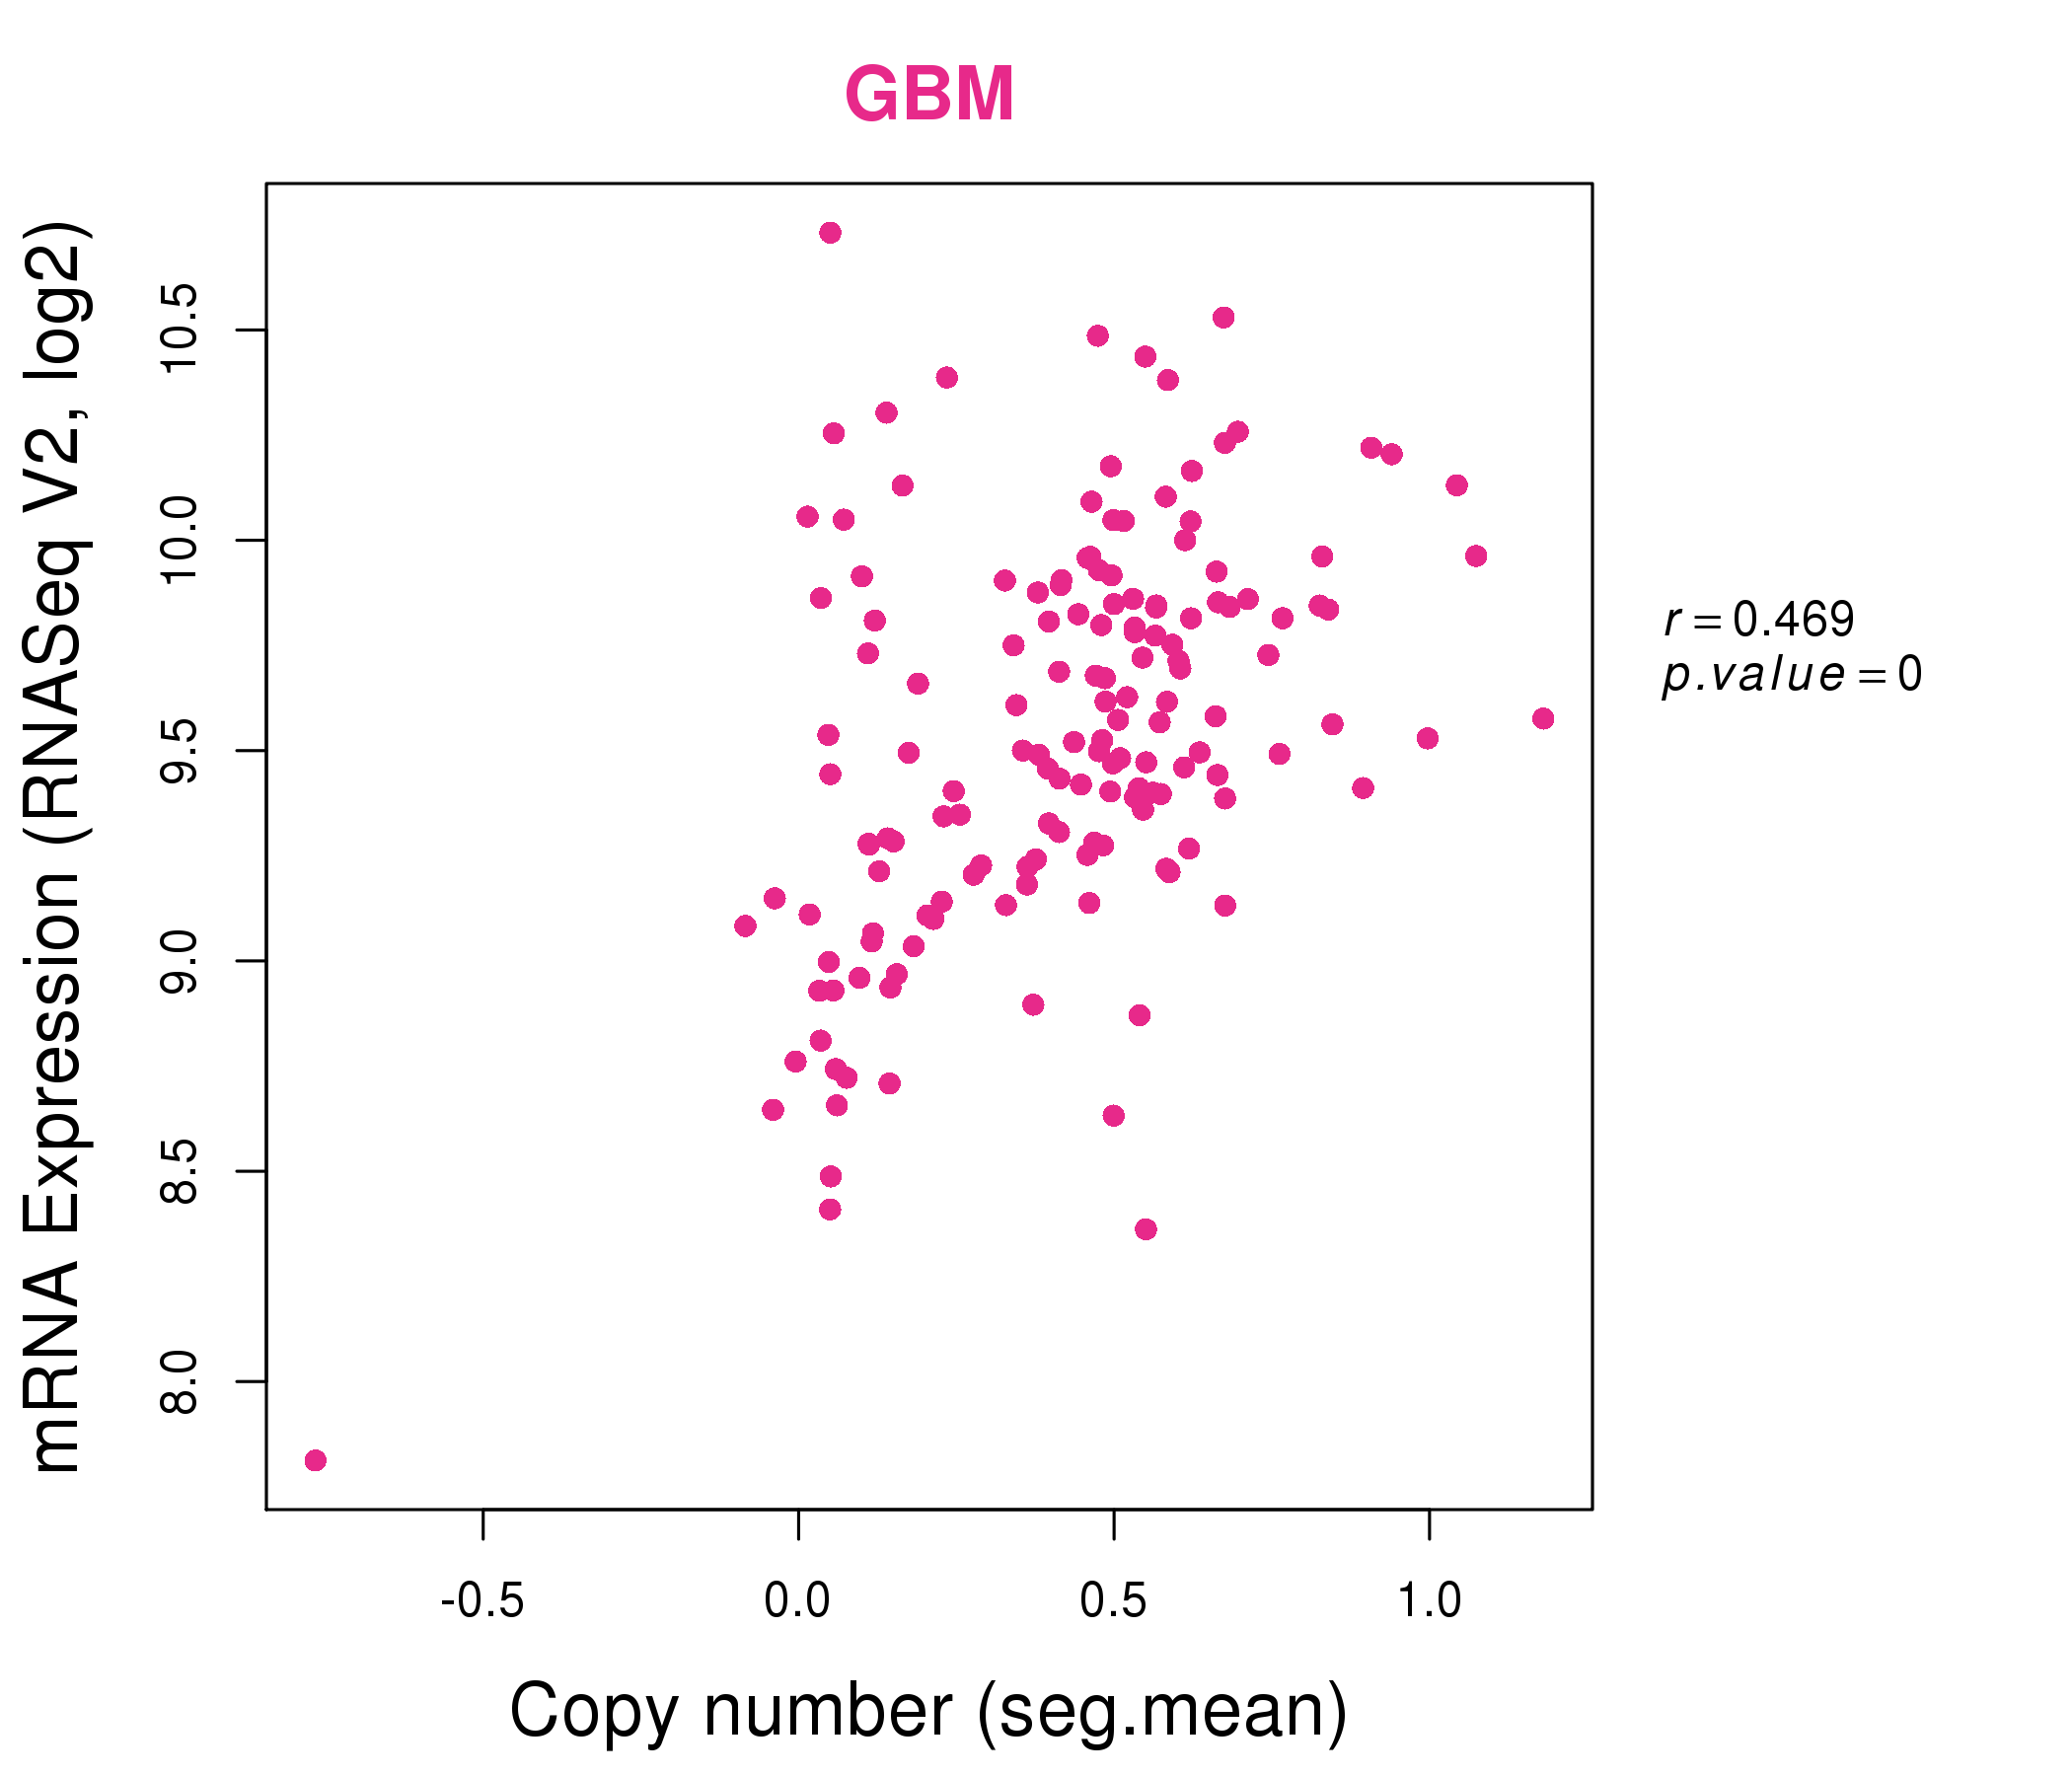
| * Normalized gene expression data of RNASeqV2 was extracted from TCGA using R package TCGA-Assembler. The URLs of all public data files on TCGA DCC data server were gathered at Jan-05-2015. Only eight cancer types have enough normal control samples for differential expression analysis. (t test, adjusted p<0.05 (using Benjamini-Hochberg FDR)) |
 |
| Top |
| * This plots show the correlation between CNV and gene expression. |
: Open all plots for all cancer types
 |
|
 |
|
| Top |
| Gene-Gene Network Information |
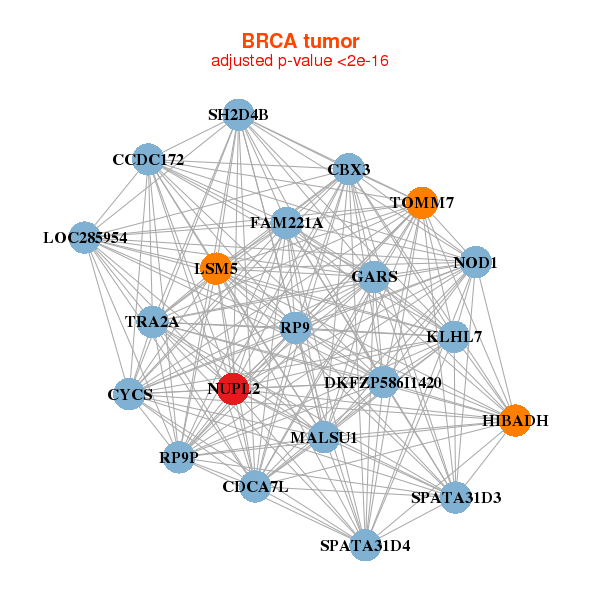
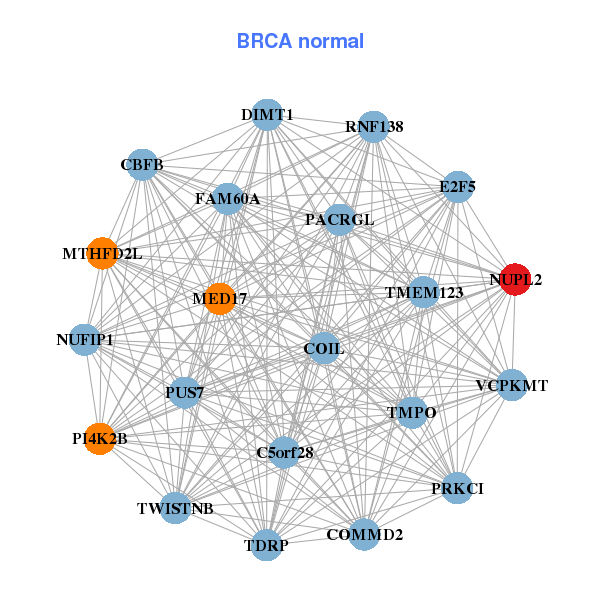
| * Co-Expression network figures were drawn using R package igraph. Only the top 20 genes with the highest correlations were shown. Red circle: input gene, orange circle: cell metabolism gene, sky circle: other gene |
: Open all plots for all cancer types
 |
|
| CCDC172,MALSU1,FAM221A,CBX3,CDCA7L,CYCS,DKFZP586I1420, SPATA31D4,SPATA31D3,GARS,HIBADH,KLHL7,LOC285954,LSM5, NOD1,NUPL2,RP9,RP9P,SH2D4B,TOMM7,TRA2A | VCPKMT,C5orf28,TDRP,CBFB,COIL,COMMD2,DIMT1, E2F5,FAM60A,MED17,MTHFD2L,NUFIP1,NUPL2,PACRGL, PI4K2B,PRKCI,PUS7,RNF138,TMEM123,TMPO,TWISTNB |
 |
|
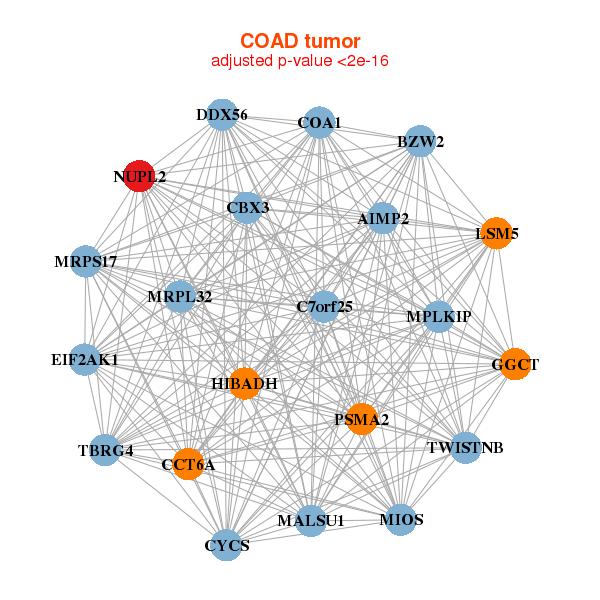
| AIMP2,BZW2,MPLKIP,C7orf25,MALSU1,COA1,CBX3, CCT6A,CYCS,DDX56,EIF2AK1,GGCT,HIBADH,LSM5, MIOS,MRPL32,MRPS17,NUPL2,PSMA2,TBRG4,TWISTNB | ANKRD49,C12orf29,C12orf73,DTD2,C5orf28,TRAPPC13,TRMT13, COMMD10,INTS10,LYRM2,MRPL32,MTHFD2L,NUPL2,PCID2, PDCD2,RPAIN,RPS3A,RPS7,TMEM14B,TMEM223,TRUB1 |
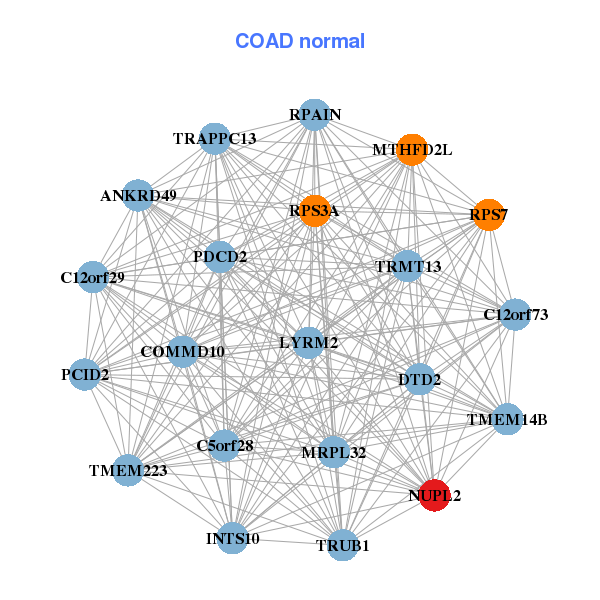
| * Co-Expression network figures were drawn using R package igraph. Only the top 20 genes with the highest correlations were shown. Red circle: input gene, orange circle: cell metabolism gene, sky circle: other gene |
: Open all plots for all cancer types
| Top |
: Open all interacting genes' information including KEGG pathway for all interacting genes from DAVID
| Top |
| Pharmacological Information for NUPL2 |
| There's no related Drug. |
| Top |
| Cross referenced IDs for NUPL2 |
| * We obtained these cross-references from Uniprot database. It covers 150 different DBs, 18 categories. http://www.uniprot.org/help/cross_references_section |
: Open all cross reference information
|
Copyright © 2016-Present - The Univsersity of Texas Health Science Center at Houston @ |