|
|||||||||||||||||||||||||||||||||||||||||||||||||||||||||||||||||||||||||||||||||||||||||||||||||||||||||||||||||||||||||||||||||||||||||||||||||||||||||||||||||||||||||||||||||||||||||||||||||||||||||||||||||||||||||||||||||||||||||||||||||||||||||||||||||||||||||||||||||||||||||||||||||||||||||||||||||||||||||||||||||||||||||||||||||||
| |
| Phenotypic Information (metabolism pathway, cancer, disease, phenome) |
| |
| |
| Gene-Gene Network Information: Co-Expression Network, Interacting Genes & KEGG |
| |
|


| Gene Summary for HIBADH |
| Top |
| Phenotypic Information for HIBADH(metabolism pathway, cancer, disease, phenome) |
| Cancer | CGAP: HIBADH |
| Familial Cancer Database: HIBADH | |
| * This gene is included in those cancer gene databases. |
|
|
|
|
|
| . | |||||||||||||||||||||||||||||||||||||||||||||||||||||||||||||||||||||||||||||||||||||||||||||||||||||||||||||||||||||||||||||||||||||||||||||||||||||||||||||||||||||||||||||||||||||||||||||||||||||||||||||||||||||||||||||||||||||||||||||||||||||||||||||||||||||||||||||||||||||||||||||||||||||||||||||||||||||||||||||||||||||||||||||
Oncogene 1 | Significant driver gene in | ||||||||||||||||||||||||||||||||||||||||||||||||||||||||||||||||||||||||||||||||||||||||||||||||||||||||||||||||||||||||||||||||||||||||||||||||||||||||||||||||||||||||||||||||||||||||||||||||||||||||||||||||||||||||||||||||||||||||||||||||||||||||||||||||||||||||||||||||||||||||||||||||||||||||||||||||||||||||||||||||||||||||||||||||||
| cf) number; DB name 1 Oncogene; http://nar.oxfordjournals.org/content/35/suppl_1/D721.long, 2 Tumor Suppressor gene; https://bioinfo.uth.edu/TSGene/, 3 Cancer Gene Census; http://www.nature.com/nrc/journal/v4/n3/abs/nrc1299.html, 4 CancerGenes; http://nar.oxfordjournals.org/content/35/suppl_1/D721.long, 5 Network of Cancer Gene; http://ncg.kcl.ac.uk/index.php, 1Therapeutic Vulnerabilities in Cancer; http://cbio.mskcc.org/cancergenomics/statius/ |
| REACTOME_METABOLISM_OF_AMINO_ACIDS_AND_DERIVATIVES | |
| OMIM | |
| Orphanet | |
| Disease | KEGG Disease: HIBADH |
| MedGen: HIBADH (Human Medical Genetics with Condition) | |
| ClinVar: HIBADH | |
| Phenotype | MGI: HIBADH (International Mouse Phenotyping Consortium) |
| PhenomicDB: HIBADH | |
| Mutations for HIBADH |
| * Under tables are showing count per each tissue to give us broad intuition about tissue specific mutation patterns.You can go to the detailed page for each mutation database's web site. |
| - Statistics for Tissue and Mutation type | Top |
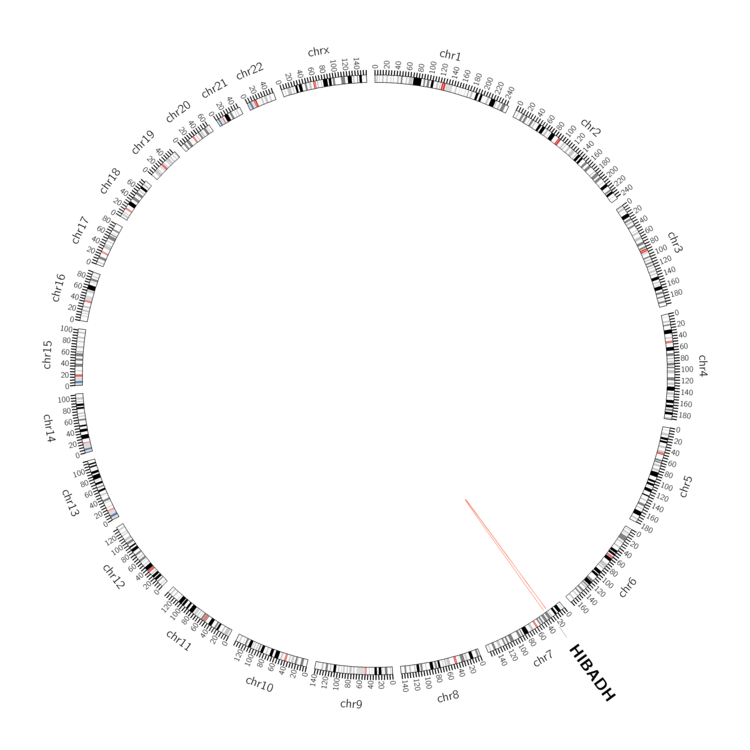 |
| - For Inter-chromosomal Variations |
| There's no inter-chromosomal structural variation. |
| - For Intra-chromosomal Variations |
| * Intra-chromosomal variantions includes 'intrachromosomal amplicon to amplicon', 'intrachromosomal amplicon to non-amplified dna', 'intrachromosomal deletion', 'intrachromosomal fold-back inversion', 'intrachromosomal inversion', 'intrachromosomal tandem duplication', 'Intrachromosomal unknown type', 'intrachromosomal with inverted orientation', 'intrachromosomal with non-inverted orientation'. |
 |
| Sample | Symbol_a | Chr_a | Start_a | End_a | Symbol_b | Chr_b | Start_b | End_b |
| breast | HIBADH | chr7 | 27639557 | 27639557 | chr7 | 32939144 | 32939144 | |
| ovary | HIBADH | chr7 | 27607711 | 27607731 | HIBADH | chr7 | 27594367 | 27594387 |
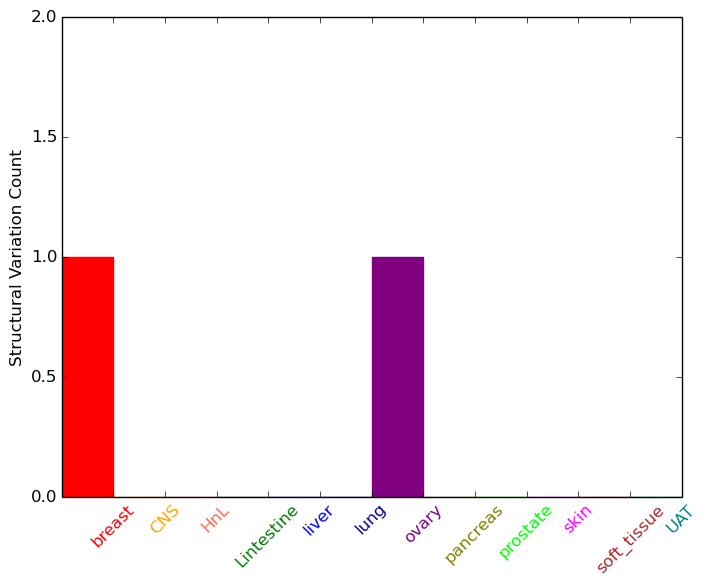
| cf) Tissue number; Tissue name (1;Breast, 2;Central_nervous_system, 3;Haematopoietic_and_lymphoid_tissue, 4;Large_intestine, 5;Liver, 6;Lung, 7;Ovary, 8;Pancreas, 9;Prostate, 10;Skin, 11;Soft_tissue, 12;Upper_aerodigestive_tract) |
| * From mRNA Sanger sequences, Chitars2.0 arranged chimeric transcripts. This table shows HIBADH related fusion information. |
| ID | Head Gene | Tail Gene | Accession | Gene_a | qStart_a | qEnd_a | Chromosome_a | tStart_a | tEnd_a | Gene_a | qStart_a | qEnd_a | Chromosome_a | tStart_a | tEnd_a |
| BQ346350 | HIBADH | 14 | 142 | 7 | 27595618 | 27595747 | MARCH6 | 130 | 217 | 5 | 10411628 | 10414610 | |
| BG003402 | RBM19 | 6 | 136 | 12 | 114315455 | 114315587 | HIBADH | 117 | 439 | 7 | 27693438 | 27693762 | |
| BQ346303 | HIBADH | 14 | 142 | 7 | 27595618 | 27595747 | MARCH6 | 130 | 217 | 5 | 10411628 | 10414610 | |
| Top |
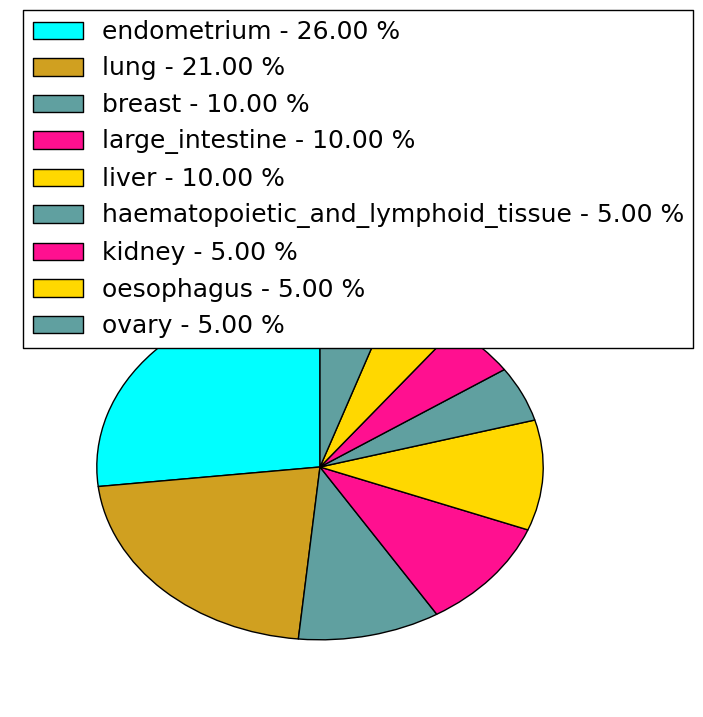
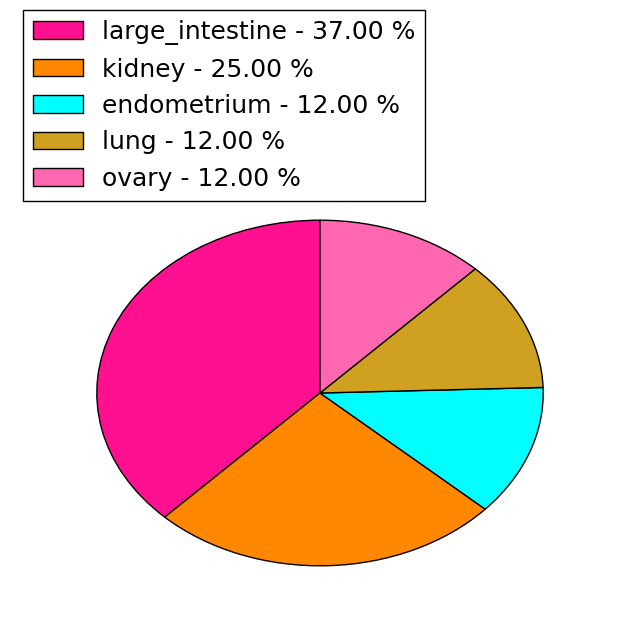
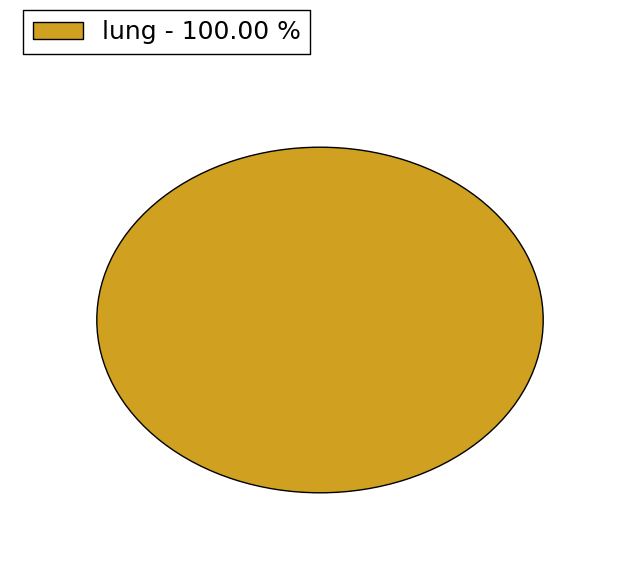
| Mutation type/ Tissue ID | brca | cns | cerv | endome | haematopo | kidn | Lintest | liver | lung | ns | ovary | pancre | prost | skin | stoma | thyro | urina | |||
| Total # sample | 2 | 1 | 4 | 1 | ||||||||||||||||
| GAIN (# sample) | 2 | 1 | 4 | |||||||||||||||||
| LOSS (# sample) | 1 |
| cf) Tissue ID; Tissue type (1; Breast, 2; Central_nervous_system, 3; Cervix, 4; Endometrium, 5; Haematopoietic_and_lymphoid_tissue, 6; Kidney, 7; Large_intestine, 8; Liver, 9; Lung, 10; NS, 11; Ovary, 12; Pancreas, 13; Prostate, 14; Skin, 15; Stomach, 16; Thyroid, 17; Urinary_tract) |
| Top |
|
 |
| Top |
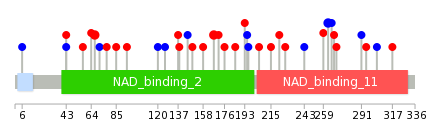
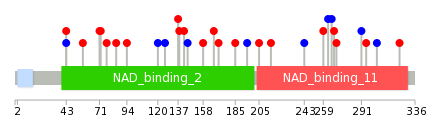
| Stat. for Non-Synonymous SNVs (# total SNVs=19) | (# total SNVs=8) |
 |  |
(# total SNVs=1) | (# total SNVs=0) |
 |
| Top |
| * When you move the cursor on each content, you can see more deailed mutation information on the Tooltip. Those are primary_site,primary_histology,mutation(aa),pubmedID. |
| GRCh37 position | Mutation(aa) | Unique sampleID count |
| chr7:27582704-27582704 | p.R167Q | 2 |
| chr7:27689145-27689145 | p.I67V | 2 |
| chr7:27570874-27570874 | p.V263V | 2 |
| chr7:27672063-27672063 | p.V85A | 1 |
| chr7:27565834-27565834 | p.*337L | 1 |
| chr7:27570934-27570934 | p.I243I | 1 |
| chr7:27689115-27689115 | p.E77Q | 1 |
| chr7:27565894-27565894 | p.G317D | 1 |
| chr7:27577976-27577976 | p.M227V | 1 |
| chr7:27669002-27669002 | p.P158S | 1 |
| Top |
|
 |
| Point Mutation/ Tissue ID | 1 | 2 | 3 | 4 | 5 | 6 | 7 | 8 | 9 | 10 | 11 | 12 | 13 | 14 | 15 | 16 | 17 | 18 | 19 | 20 |
| # sample | 1 | 4 | 1 | 2 | 1 | 1 | 1 | 7 | 4 | 1 | 6 | |||||||||
| # mutation | 1 | 4 | 1 | 2 | 1 | 1 | 1 | 8 | 4 | 1 | 6 | |||||||||
| nonsynonymous SNV | 1 | 2 | 1 | 1 | 1 | 6 | 3 | 5 | ||||||||||||
| synonymous SNV | 2 | 1 | 1 | 1 | 2 | 1 | 1 | 1 |
| cf) Tissue ID; Tissue type (1; BLCA[Bladder Urothelial Carcinoma], 2; BRCA[Breast invasive carcinoma], 3; CESC[Cervical squamous cell carcinoma and endocervical adenocarcinoma], 4; COAD[Colon adenocarcinoma], 5; GBM[Glioblastoma multiforme], 6; Glioma Low Grade, 7; HNSC[Head and Neck squamous cell carcinoma], 8; KICH[Kidney Chromophobe], 9; KIRC[Kidney renal clear cell carcinoma], 10; KIRP[Kidney renal papillary cell carcinoma], 11; LAML[Acute Myeloid Leukemia], 12; LUAD[Lung adenocarcinoma], 13; LUSC[Lung squamous cell carcinoma], 14; OV[Ovarian serous cystadenocarcinoma ], 15; PAAD[Pancreatic adenocarcinoma], 16; PRAD[Prostate adenocarcinoma], 17; SKCM[Skin Cutaneous Melanoma], 18:STAD[Stomach adenocarcinoma], 19:THCA[Thyroid carcinoma], 20:UCEC[Uterine Corpus Endometrial Carcinoma]) |
| Top |
| * We represented just top 10 SNVs. When you move the cursor on each content, you can see more deailed mutation information on the Tooltip. Those are primary_site, primary_histology, mutation(aa), pubmedID. |
| Genomic Position | Mutation(aa) | Unique sampleID count |
| chr7:27565877 | p.S304S | 1 |
| chr7:27582591 | p.K145K | 1 |
| chr7:27671959 | p.E142K | 1 |
| chr7:27565932 | p.S295N | 1 |
| chr7:27582619 | p.A138T | 1 |
| chr7:27672037 | p.D291D | 1 |
| chr7:27565960 | p.P137S | 1 |
| chr7:27582650 | p.A270T | 1 |
| chr7:27672063 | p.G126G | 1 |
| chr7:27565971 | p.P268L | 1 |
| * Copy number data were extracted from TCGA using R package TCGA-Assembler. The URLs of all public data files on TCGA DCC data server were gathered on Jan-05-2015. Function ProcessCNAData in TCGA-Assembler package was used to obtain gene-level copy number value which is calculated as the average copy number of the genomic region of a gene. |
 |
| cf) Tissue ID[Tissue type]: BLCA[Bladder Urothelial Carcinoma], BRCA[Breast invasive carcinoma], CESC[Cervical squamous cell carcinoma and endocervical adenocarcinoma], COAD[Colon adenocarcinoma], GBM[Glioblastoma multiforme], Glioma Low Grade, HNSC[Head and Neck squamous cell carcinoma], KICH[Kidney Chromophobe], KIRC[Kidney renal clear cell carcinoma], KIRP[Kidney renal papillary cell carcinoma], LAML[Acute Myeloid Leukemia], LUAD[Lung adenocarcinoma], LUSC[Lung squamous cell carcinoma], OV[Ovarian serous cystadenocarcinoma ], PAAD[Pancreatic adenocarcinoma], PRAD[Prostate adenocarcinoma], SKCM[Skin Cutaneous Melanoma], STAD[Stomach adenocarcinoma], THCA[Thyroid carcinoma], UCEC[Uterine Corpus Endometrial Carcinoma] |
| Top |
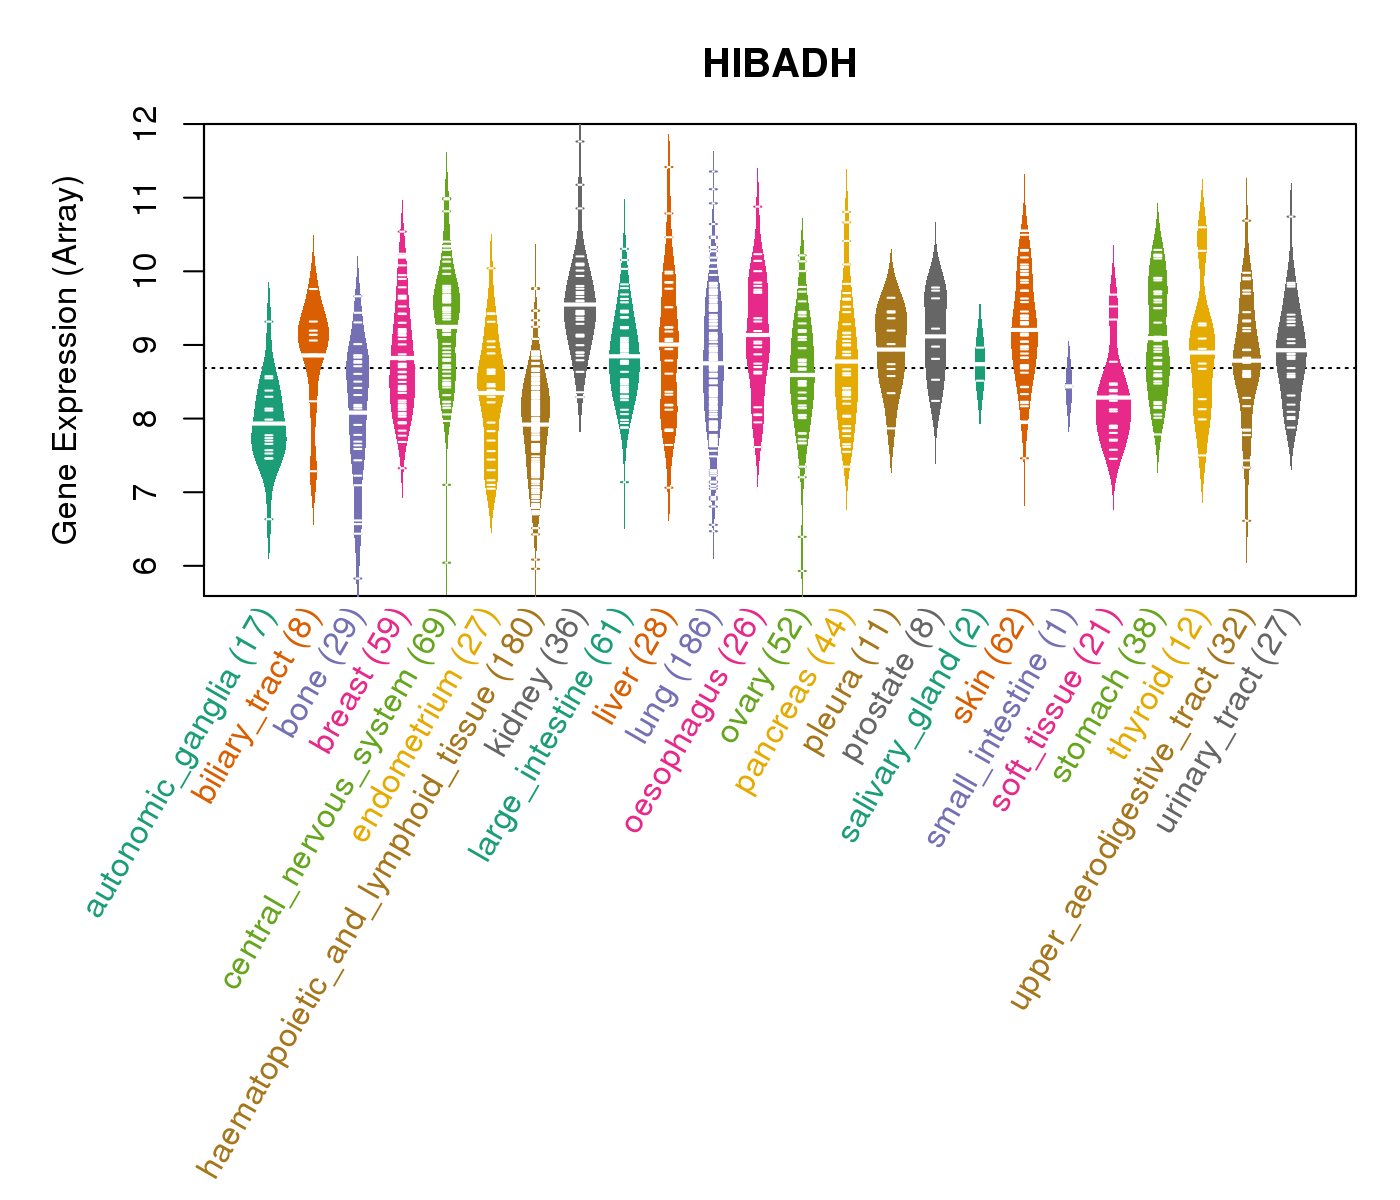
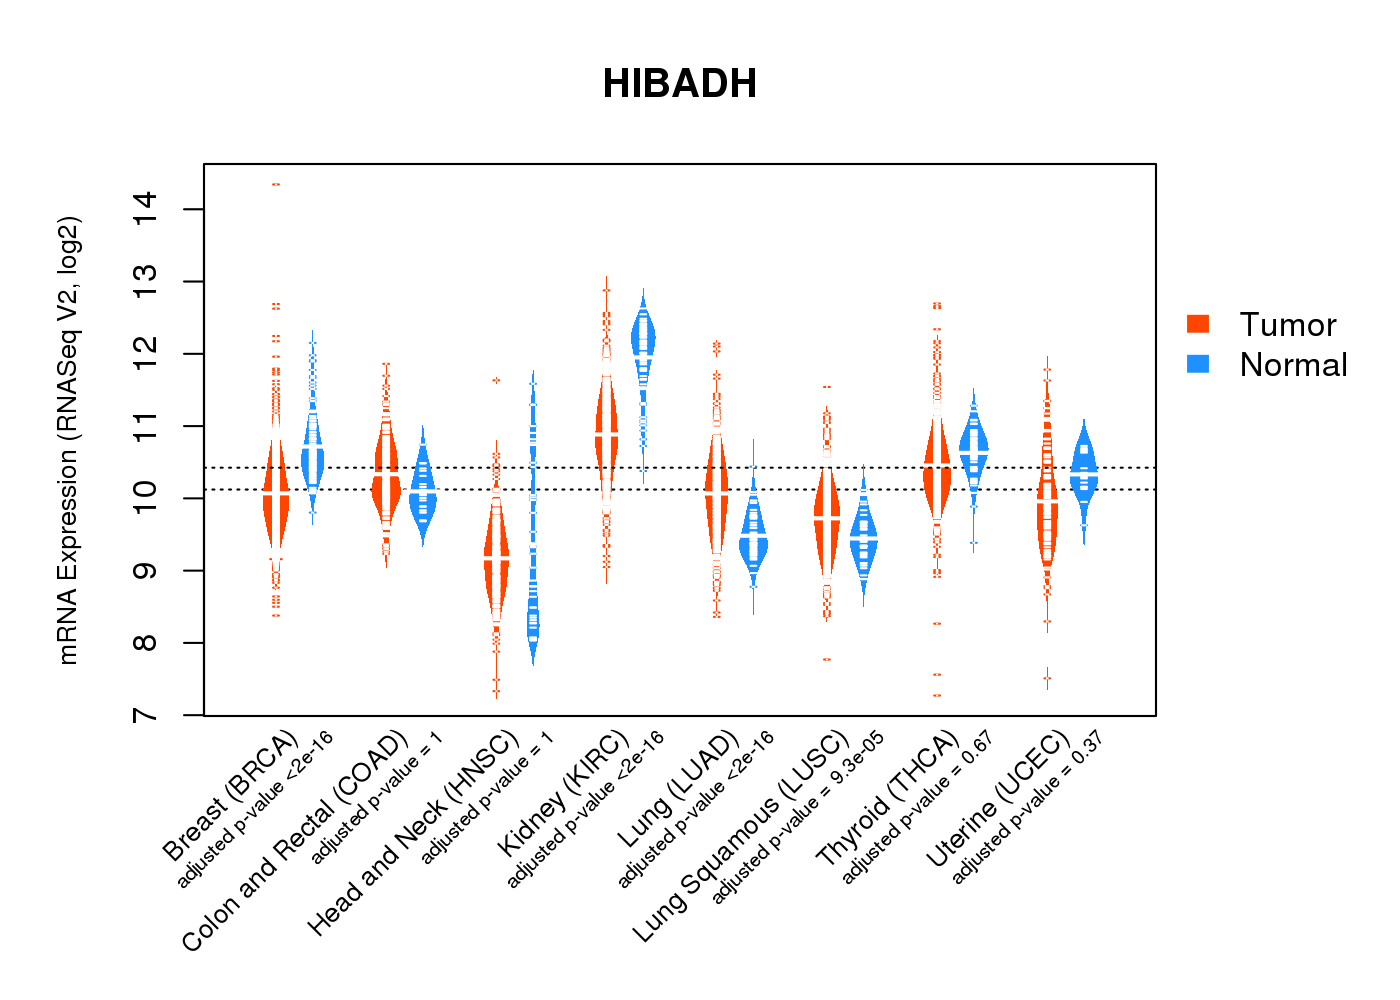
| Gene Expression for HIBADH |
| * CCLE gene expression data were extracted from CCLE_Expression_Entrez_2012-10-18.res: Gene-centric RMA-normalized mRNA expression data. |
 |
| * Normalized gene expression data of RNASeqV2 was extracted from TCGA using R package TCGA-Assembler. The URLs of all public data files on TCGA DCC data server were gathered at Jan-05-2015. Only eight cancer types have enough normal control samples for differential expression analysis. (t test, adjusted p<0.05 (using Benjamini-Hochberg FDR)) |
 |
| Top |
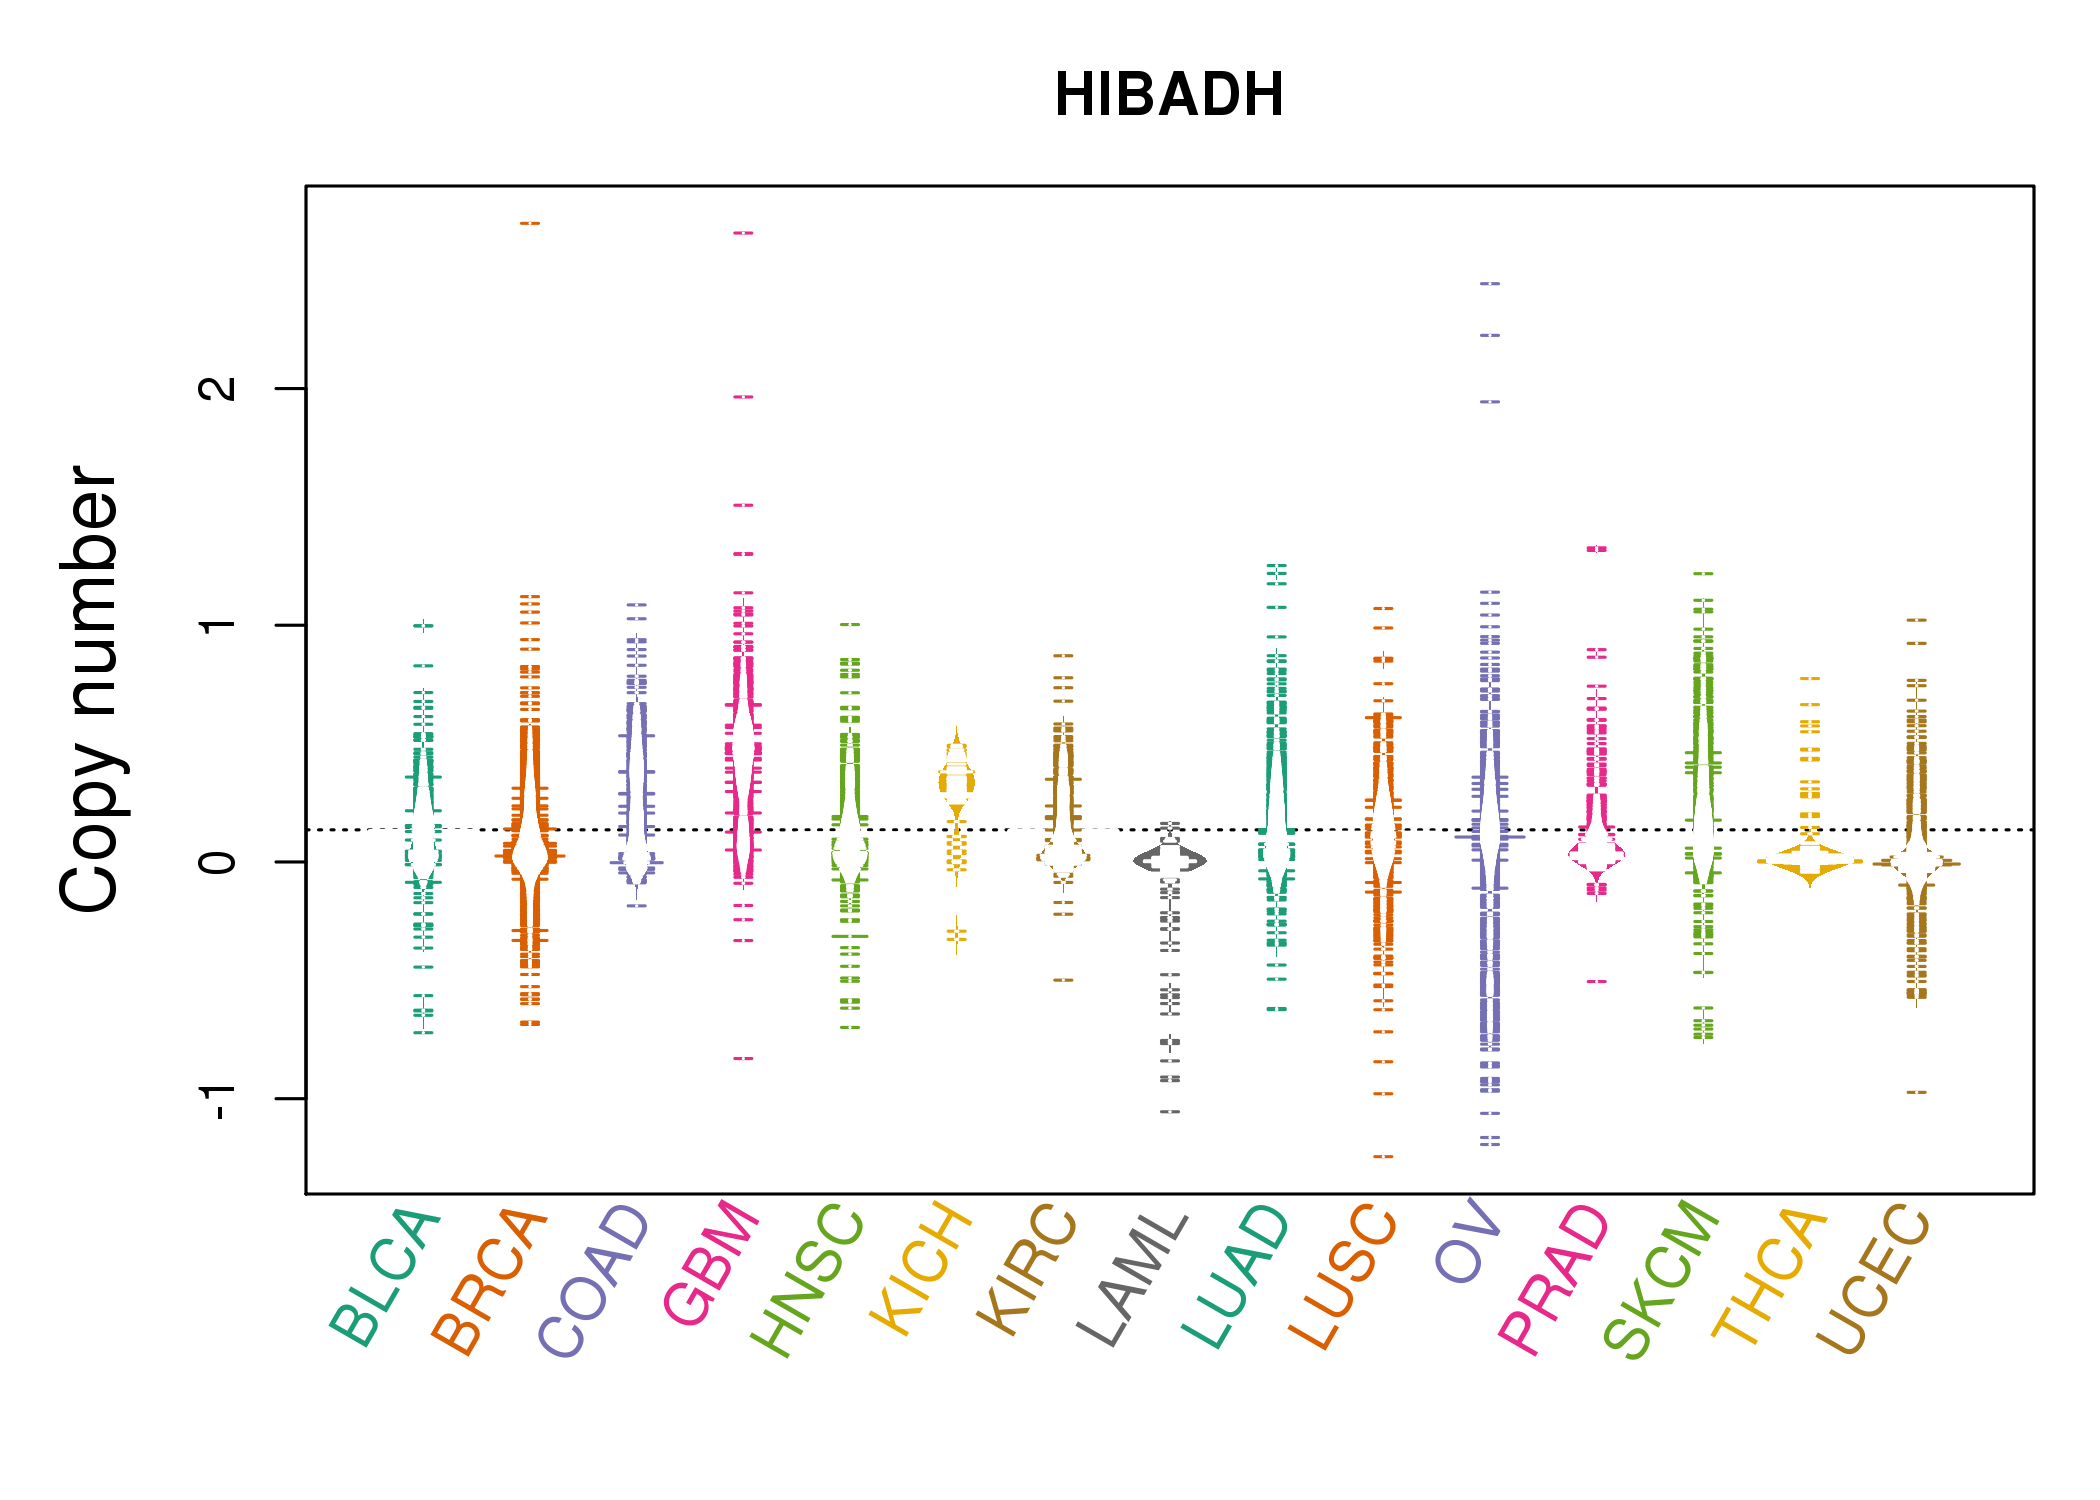
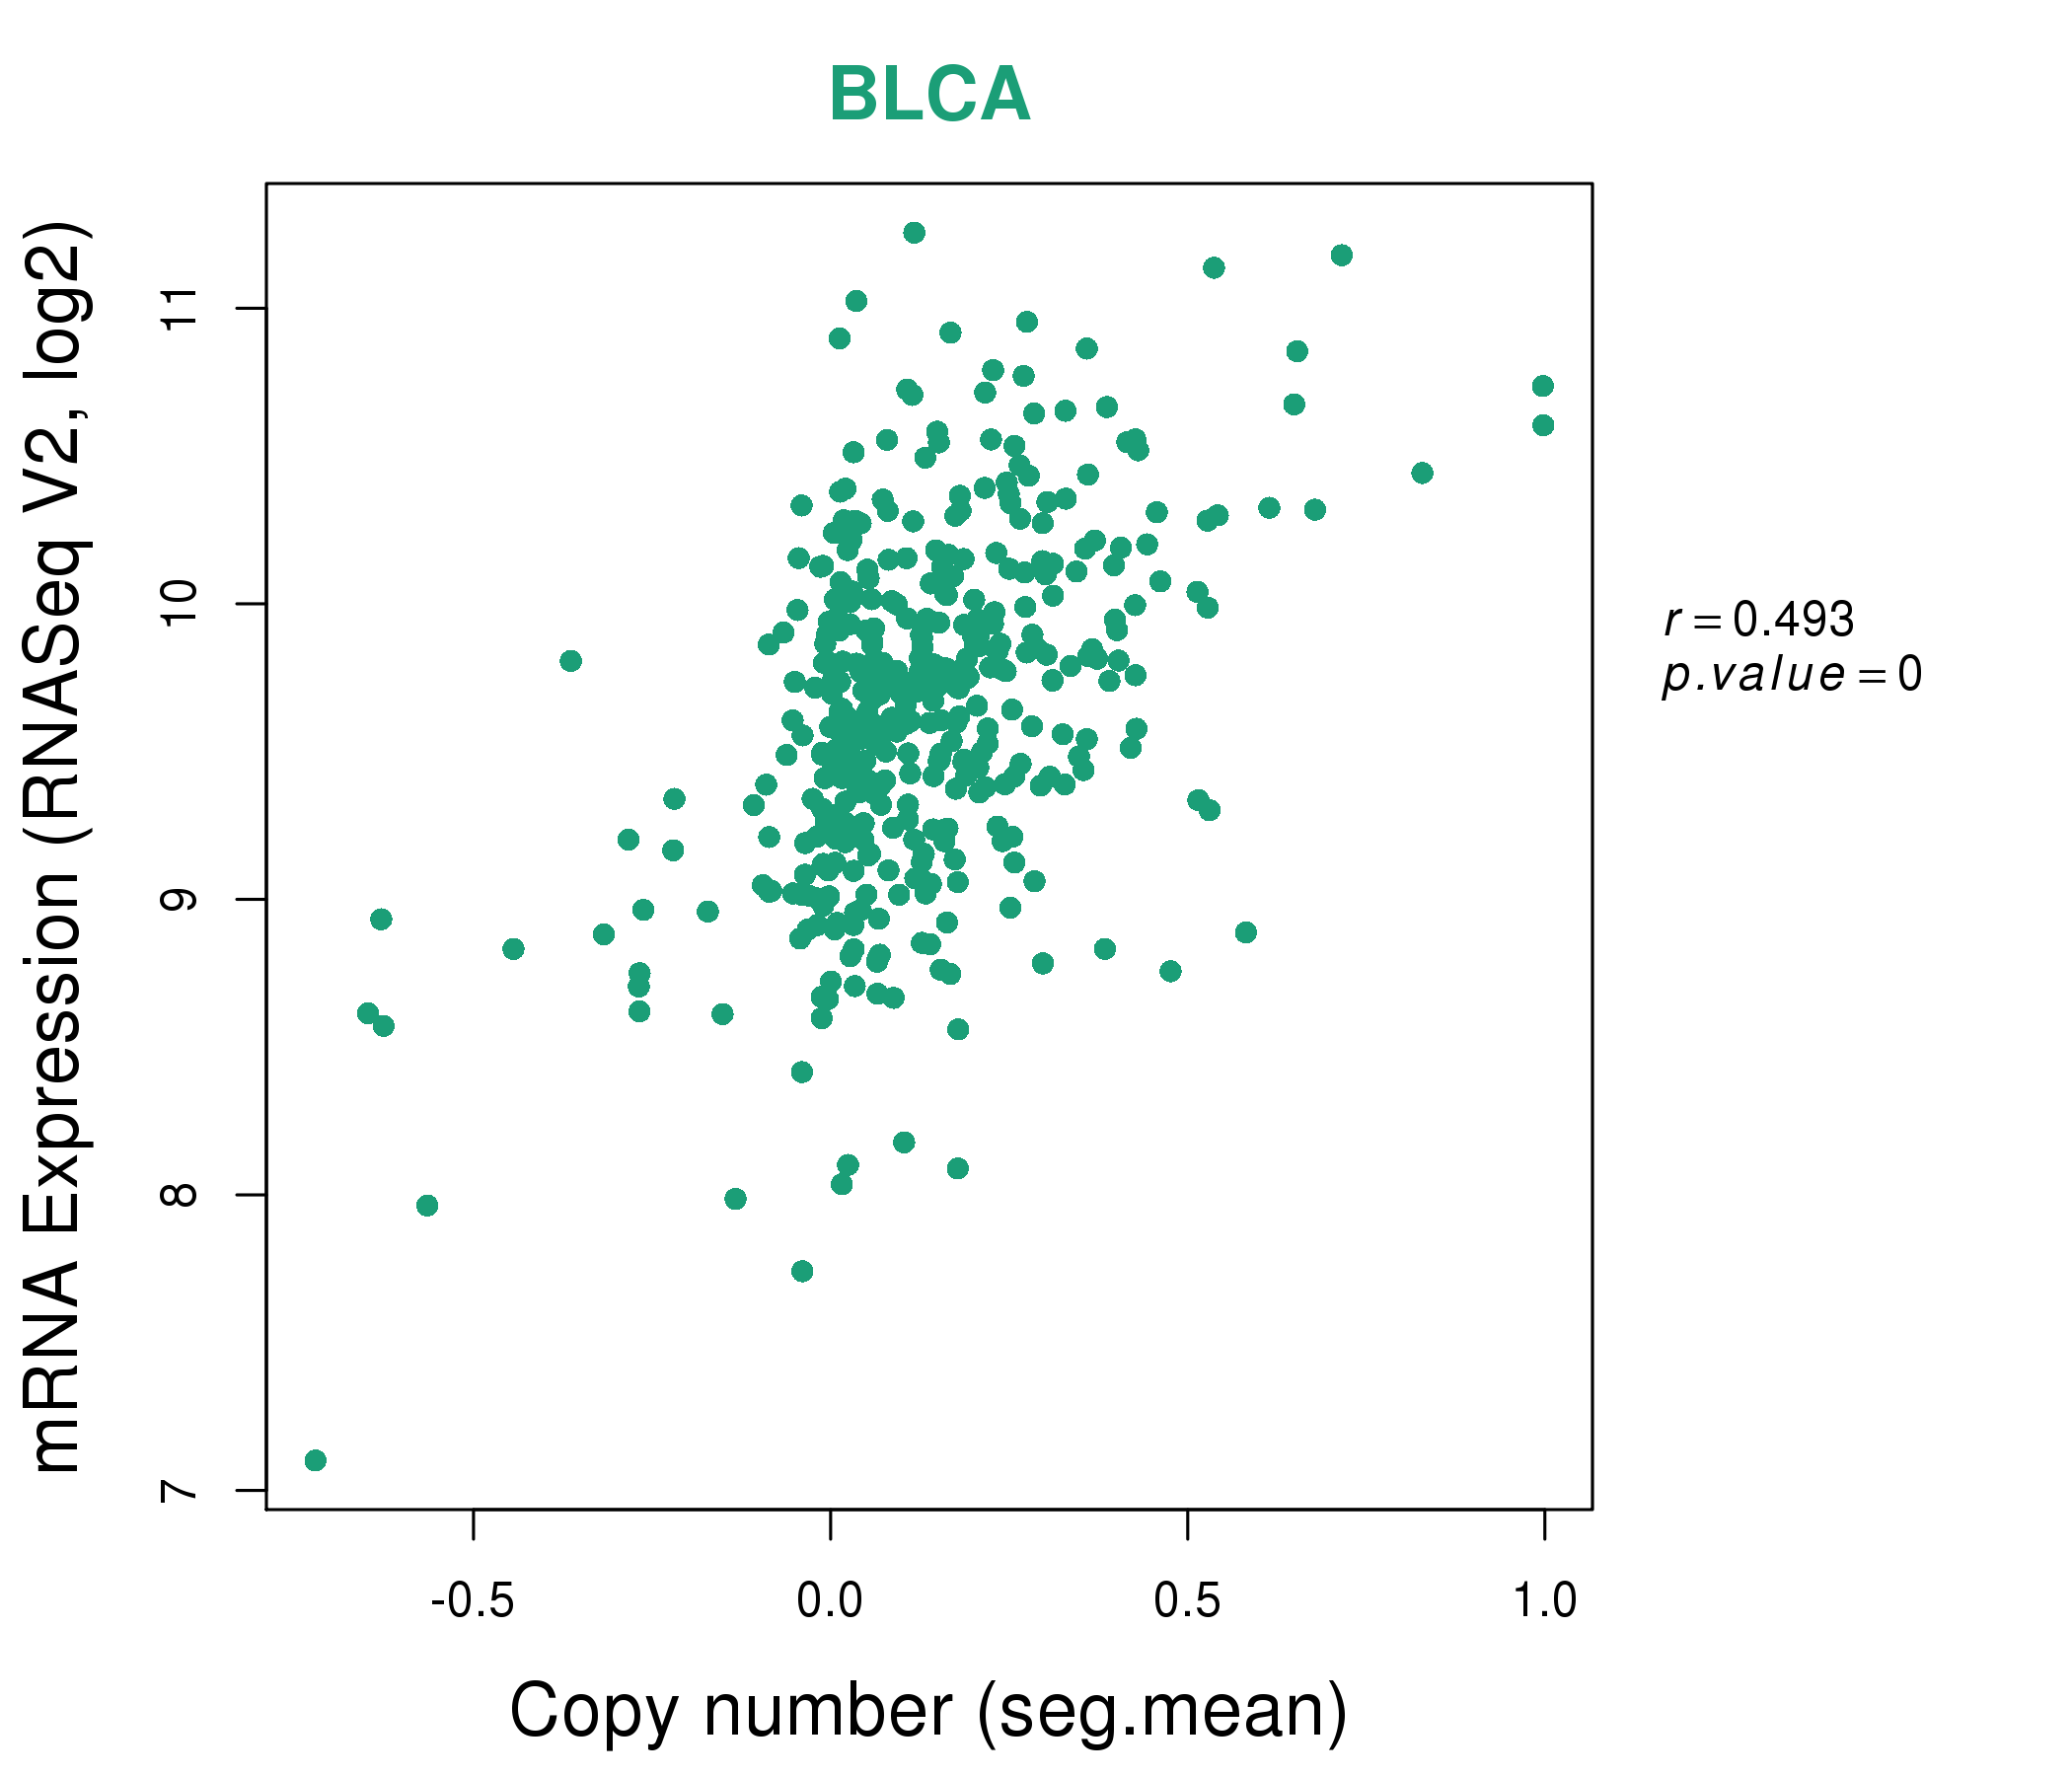
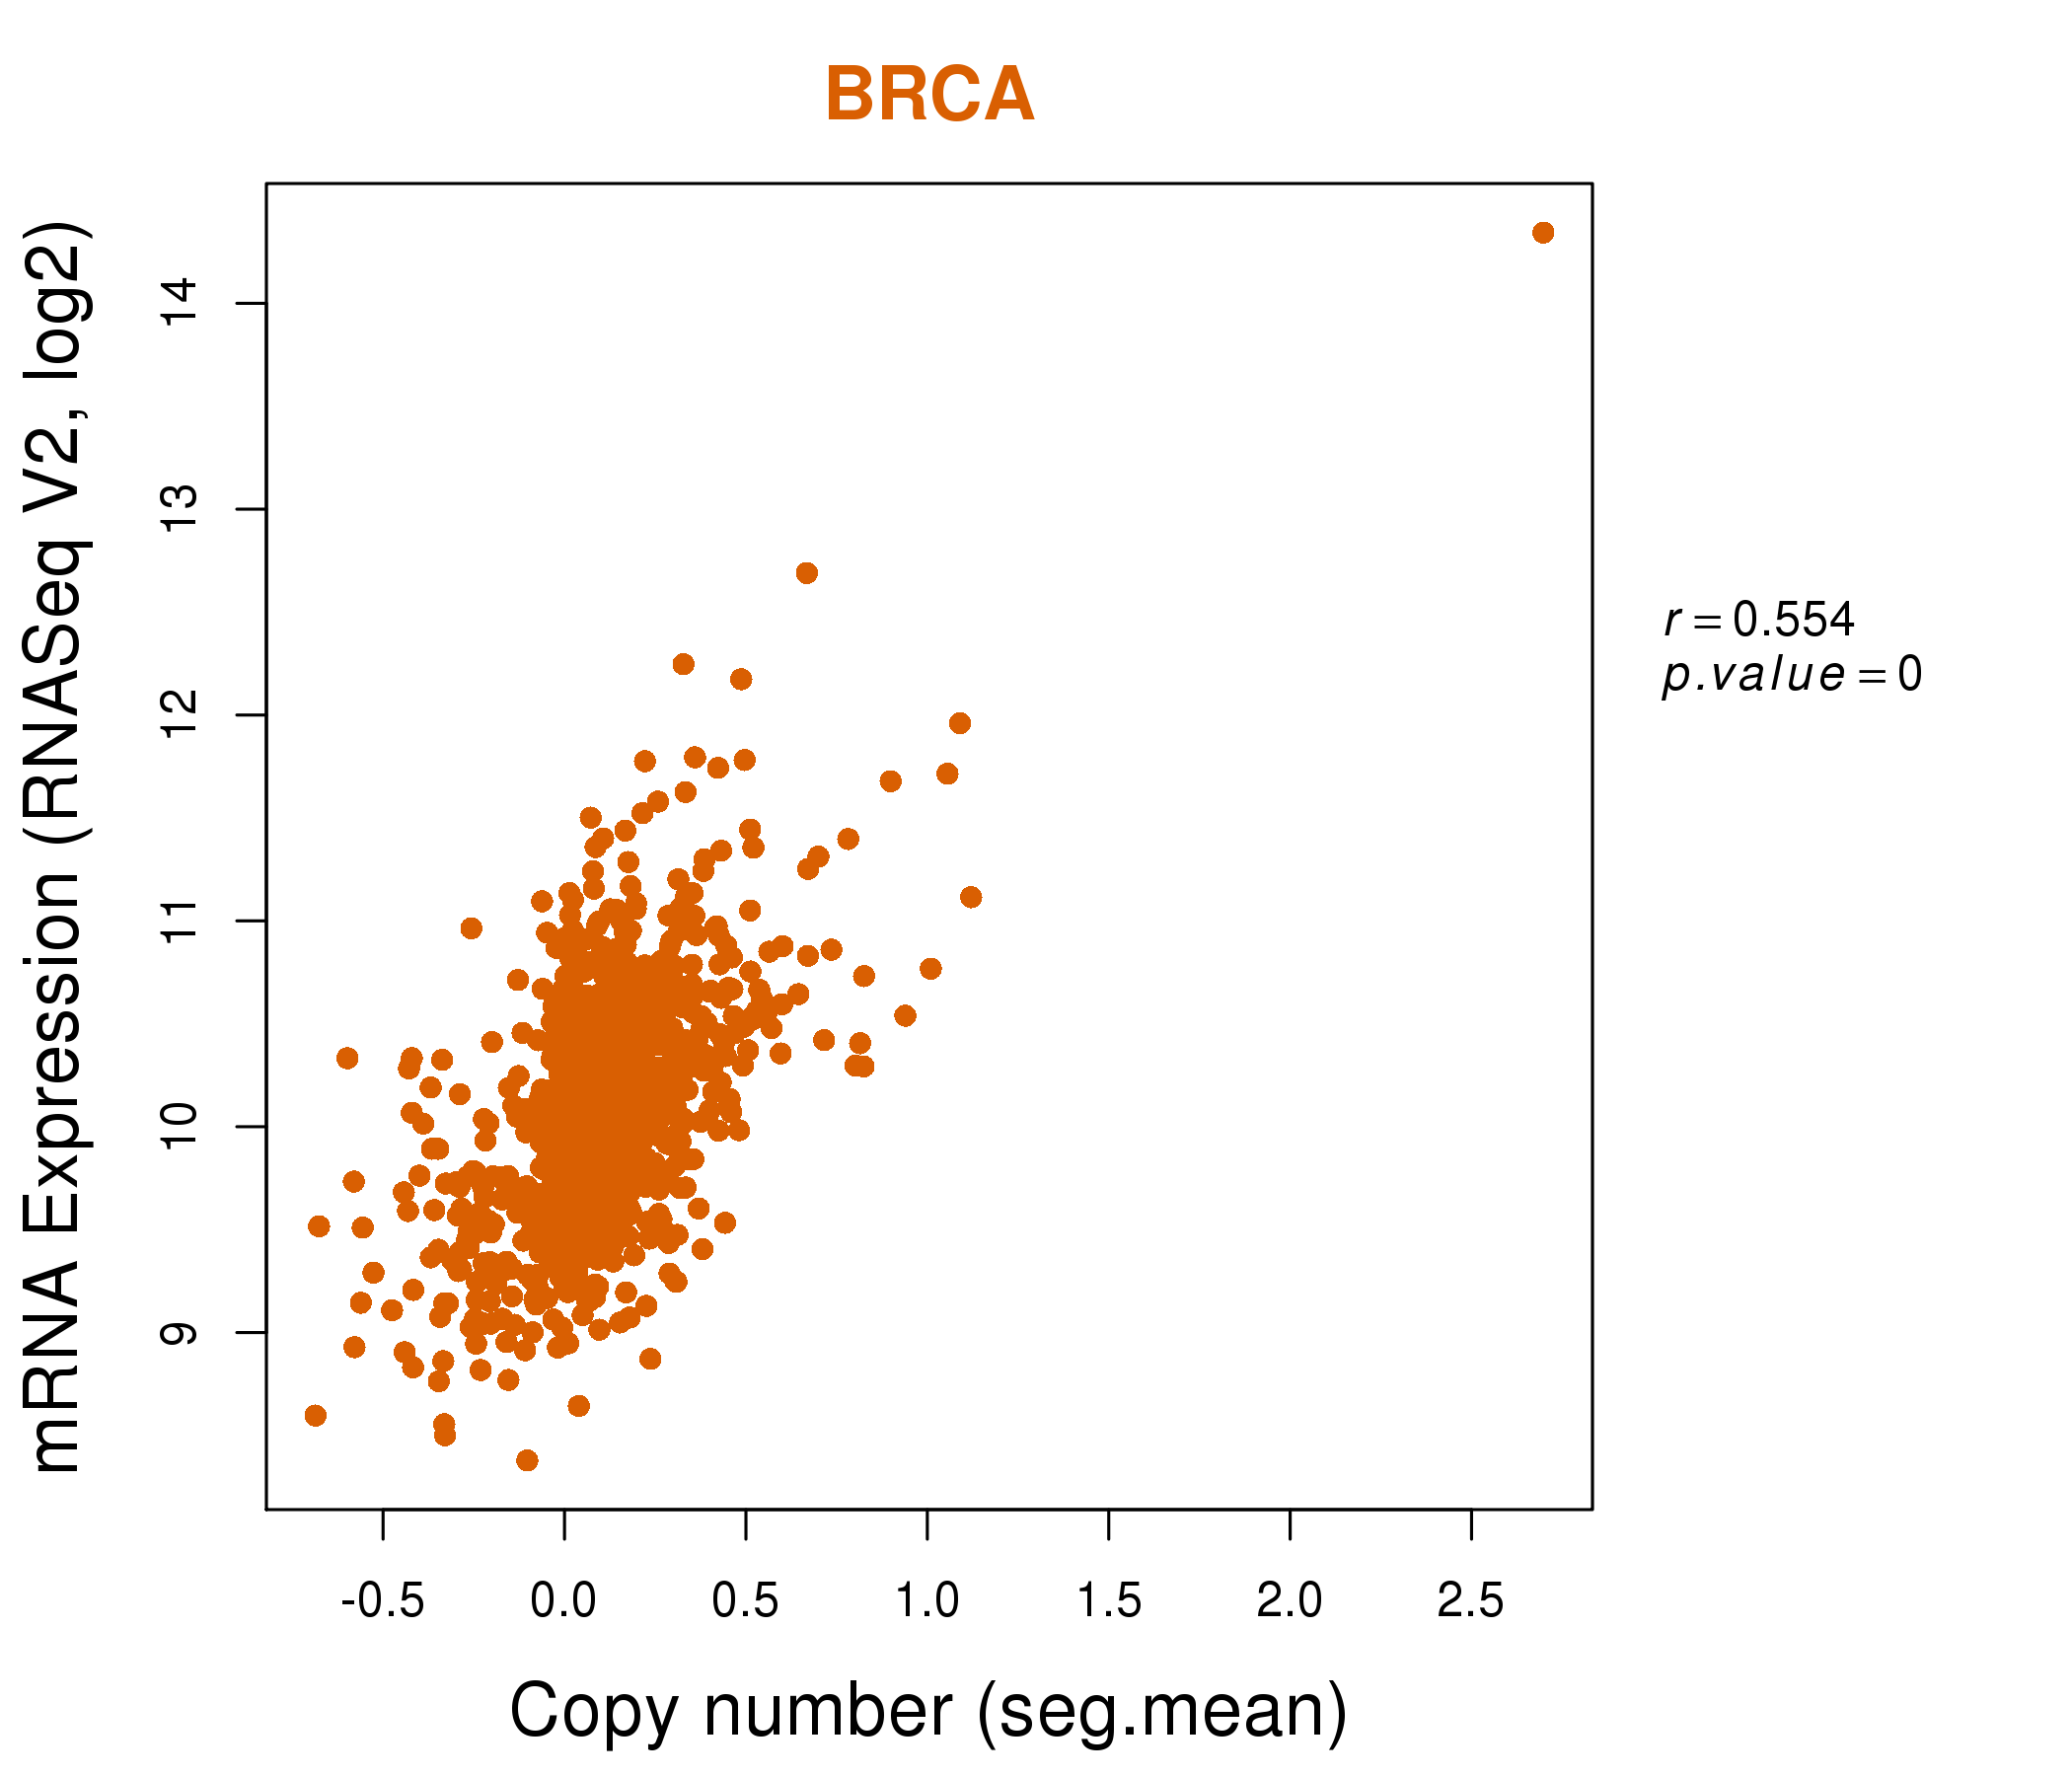
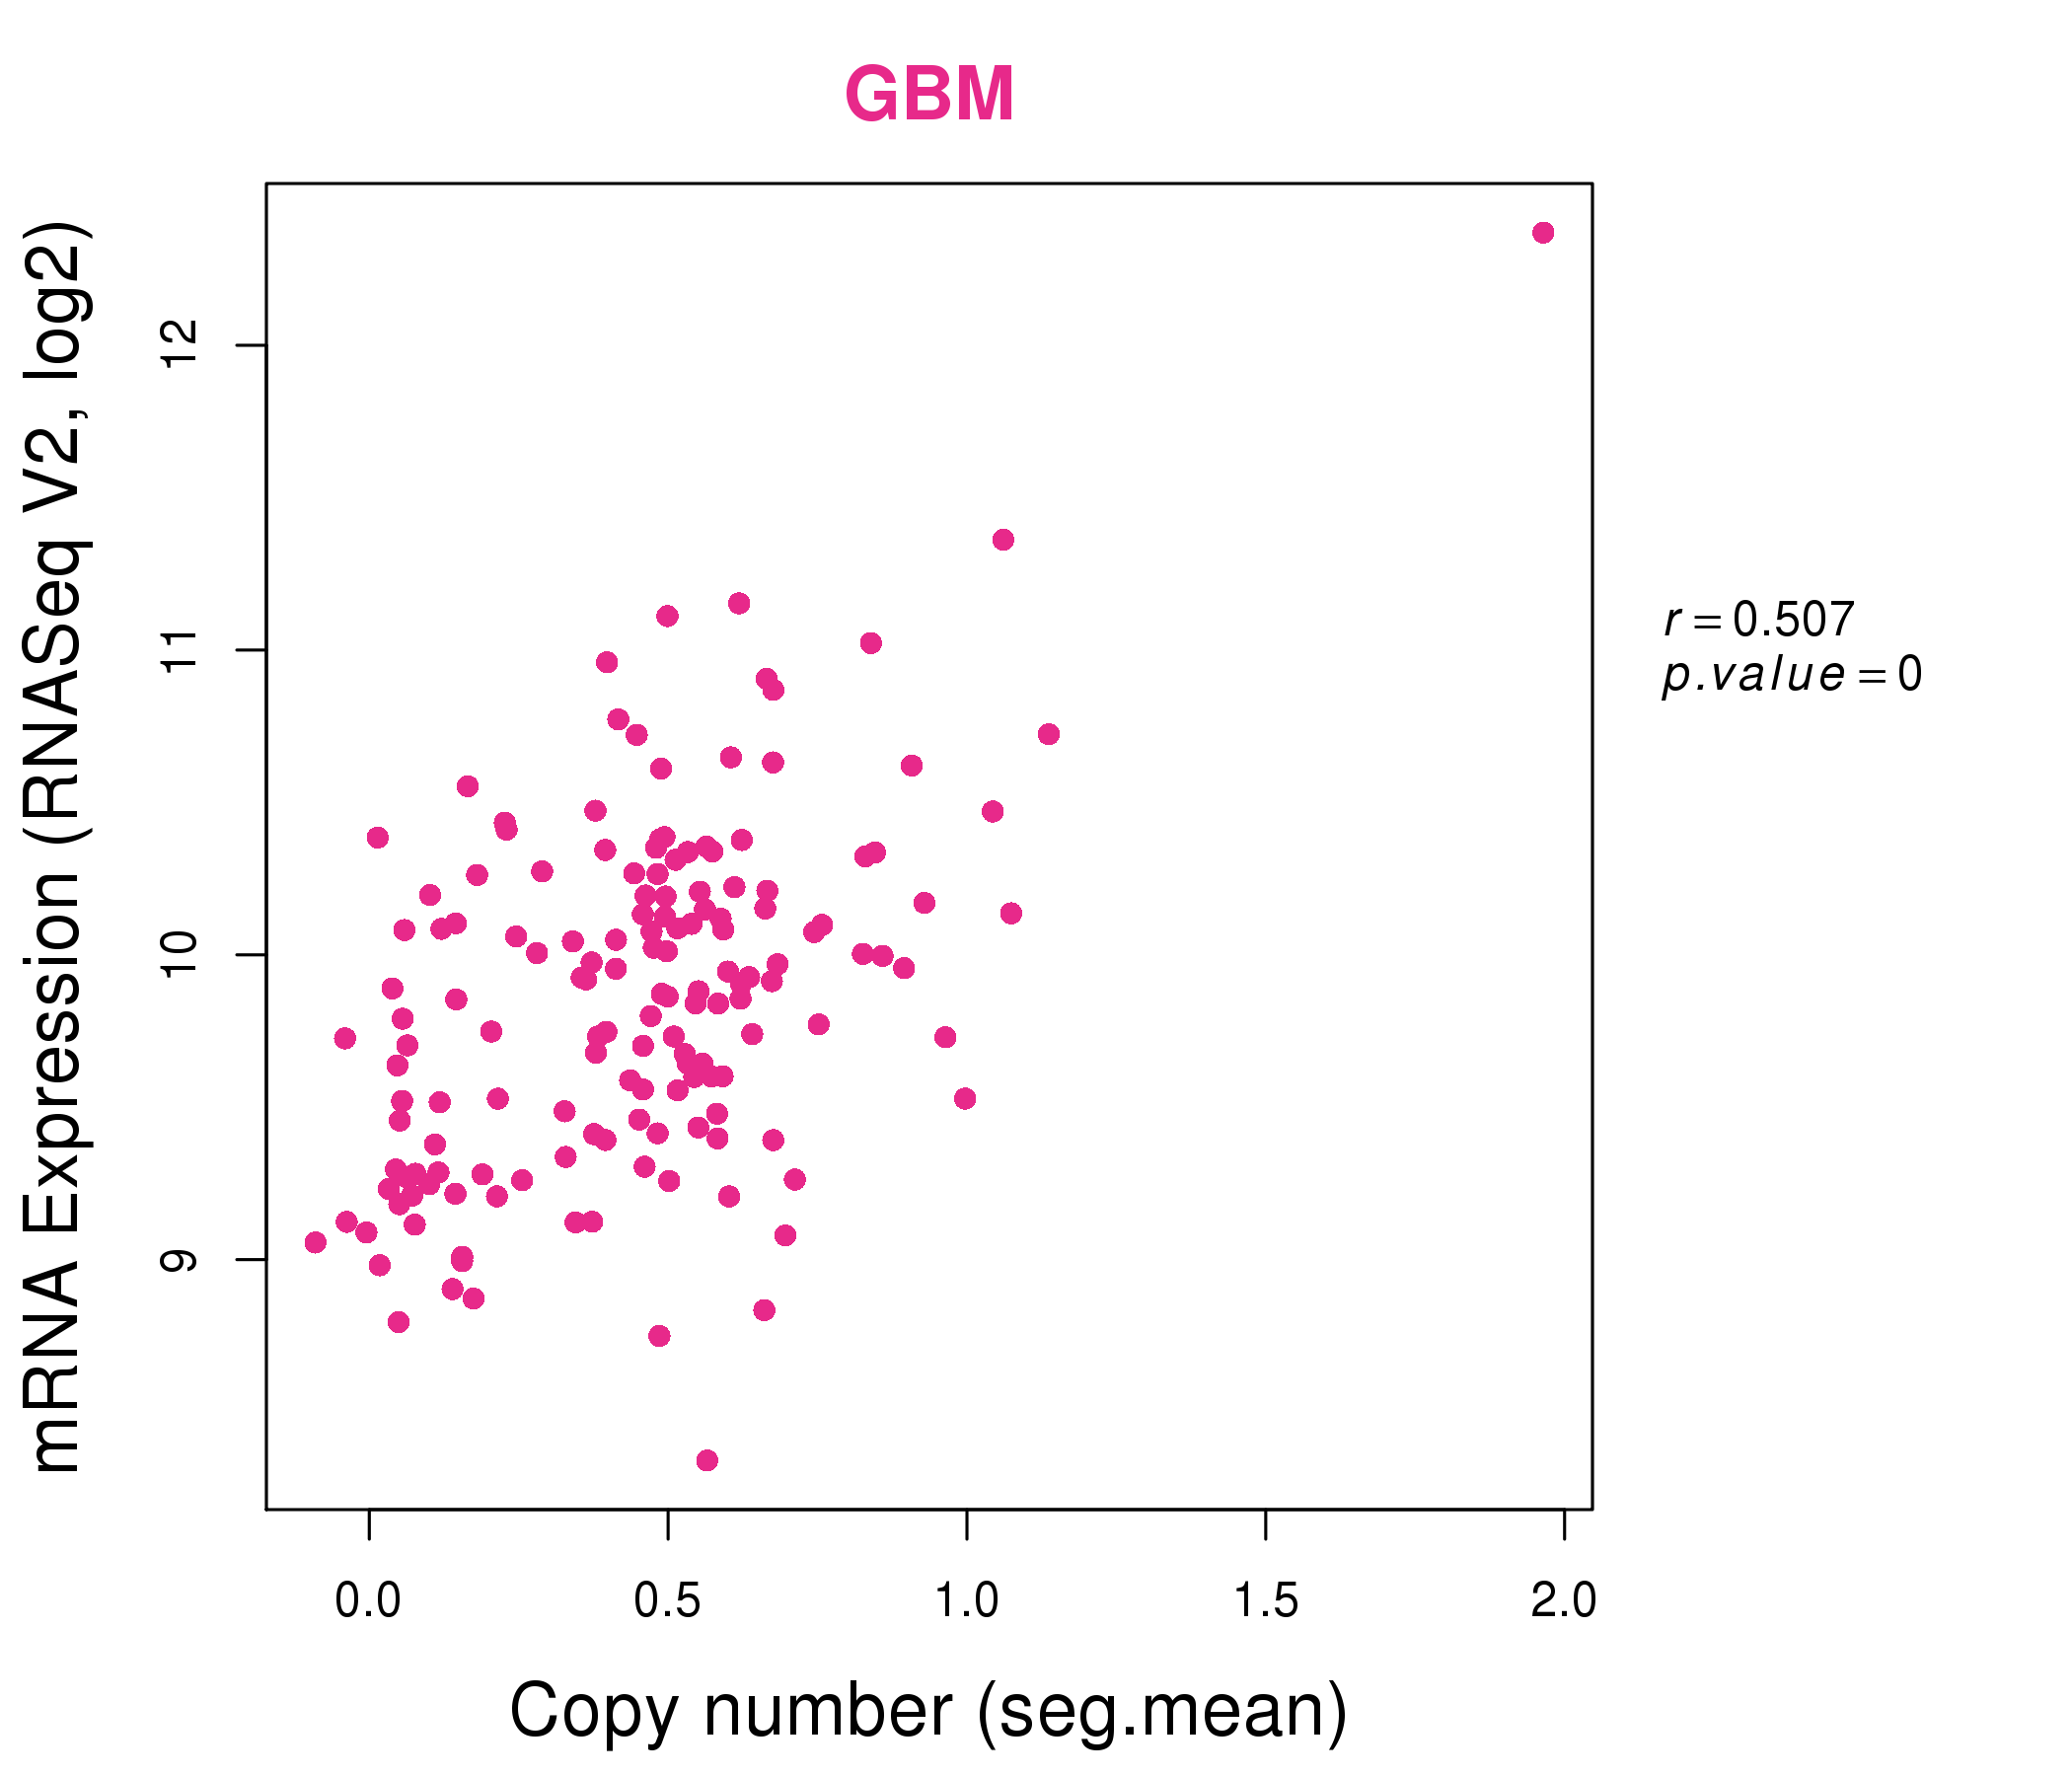
| * This plots show the correlation between CNV and gene expression. |
: Open all plots for all cancer types
 |
|
 |
|
| Top |
| Gene-Gene Network Information |
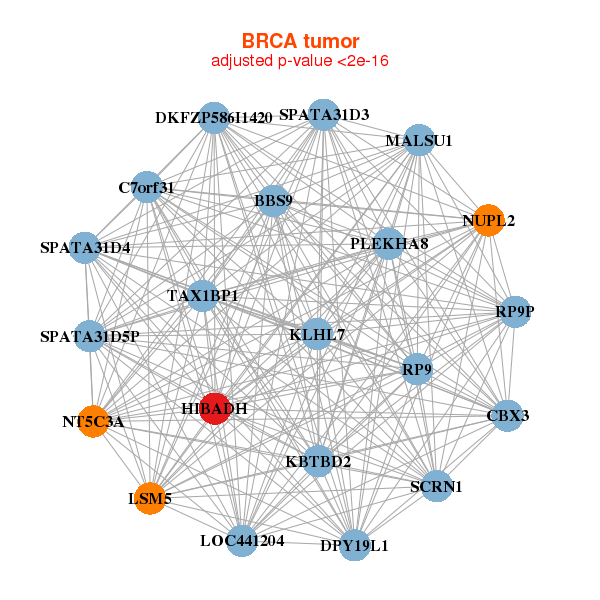
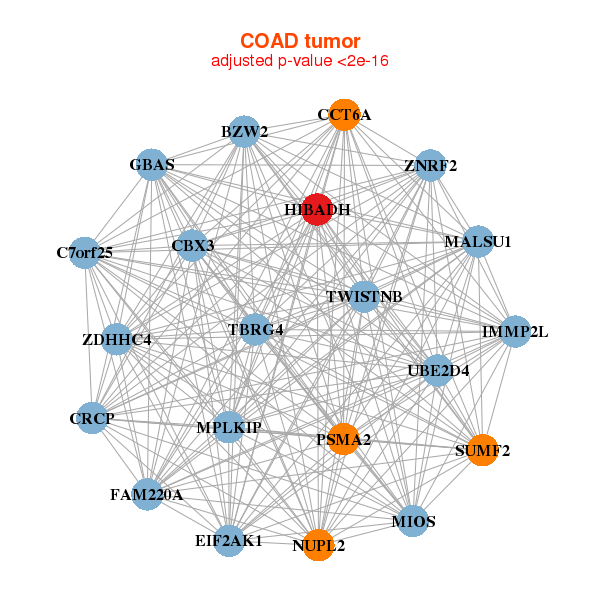
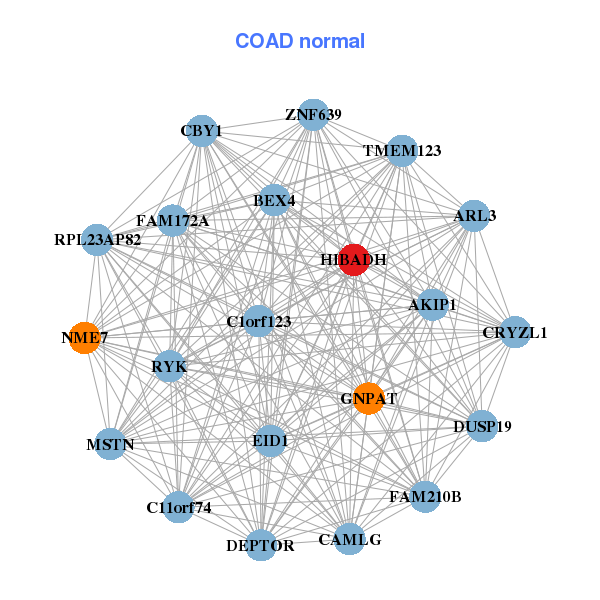
| * Co-Expression network figures were drawn using R package igraph. Only the top 20 genes with the highest correlations were shown. Red circle: input gene, orange circle: cell metabolism gene, sky circle: other gene |
: Open all plots for all cancer types
 |
| ||||
| BBS9,MALSU1,C7orf31,CBX3,DKFZP586I1420,DPY19L1,SPATA31D4, SPATA31D5P,SPATA31D3,HIBADH,KBTBD2,KLHL7,LOC441204,LSM5, NT5C3A,NUPL2,PLEKHA8,RP9,RP9P,SCRN1,TAX1BP1 | ADHFE1,ANKRD46,ATPAF1,BCL2L13,BNIP3,MROH8,CS, DECR1,DLD,ETFA,HIBADH,HSDL2,IARS2,IPO5, KIAA0408,NDUFB5,PFKFB1,RNF157,STRADB,SUCLA2,SUCLG2 | ||||
 |
| ||||
| BZW2,MPLKIP,C7orf25,MALSU1,FAM220A,CBX3,CCT6A, CRCP,EIF2AK1,GBAS,HIBADH,IMMP2L,MIOS,NUPL2, PSMA2,SUMF2,TBRG4,TWISTNB,UBE2D4,ZDHHC4,ZNRF2 | ARL3,BEX4,AKIP1,C11orf74,C1orf123,FAM210B,CAMLG, CBY1,CRYZL1,DEPTOR,DUSP19,EID1,FAM172A,GNPAT, HIBADH,MSTN,NME7,RPL23AP82,RYK,TMEM123,ZNF639 |

| * Co-Expression network figures were drawn using R package igraph. Only the top 20 genes with the highest correlations were shown. Red circle: input gene, orange circle: cell metabolism gene, sky circle: other gene |
: Open all plots for all cancer types
| Top |
: Open all interacting genes' information including KEGG pathway for all interacting genes from DAVID
| Top |
| Pharmacological Information for HIBADH |
| DB Category | DB Name | DB's ID and Url link |
| * Gene Centered Interaction Network. |
 |
| * Drug Centered Interaction Network. |
| DrugBank ID | Target Name | Drug Groups | Generic Name | Drug Centered Network | Drug Structure |
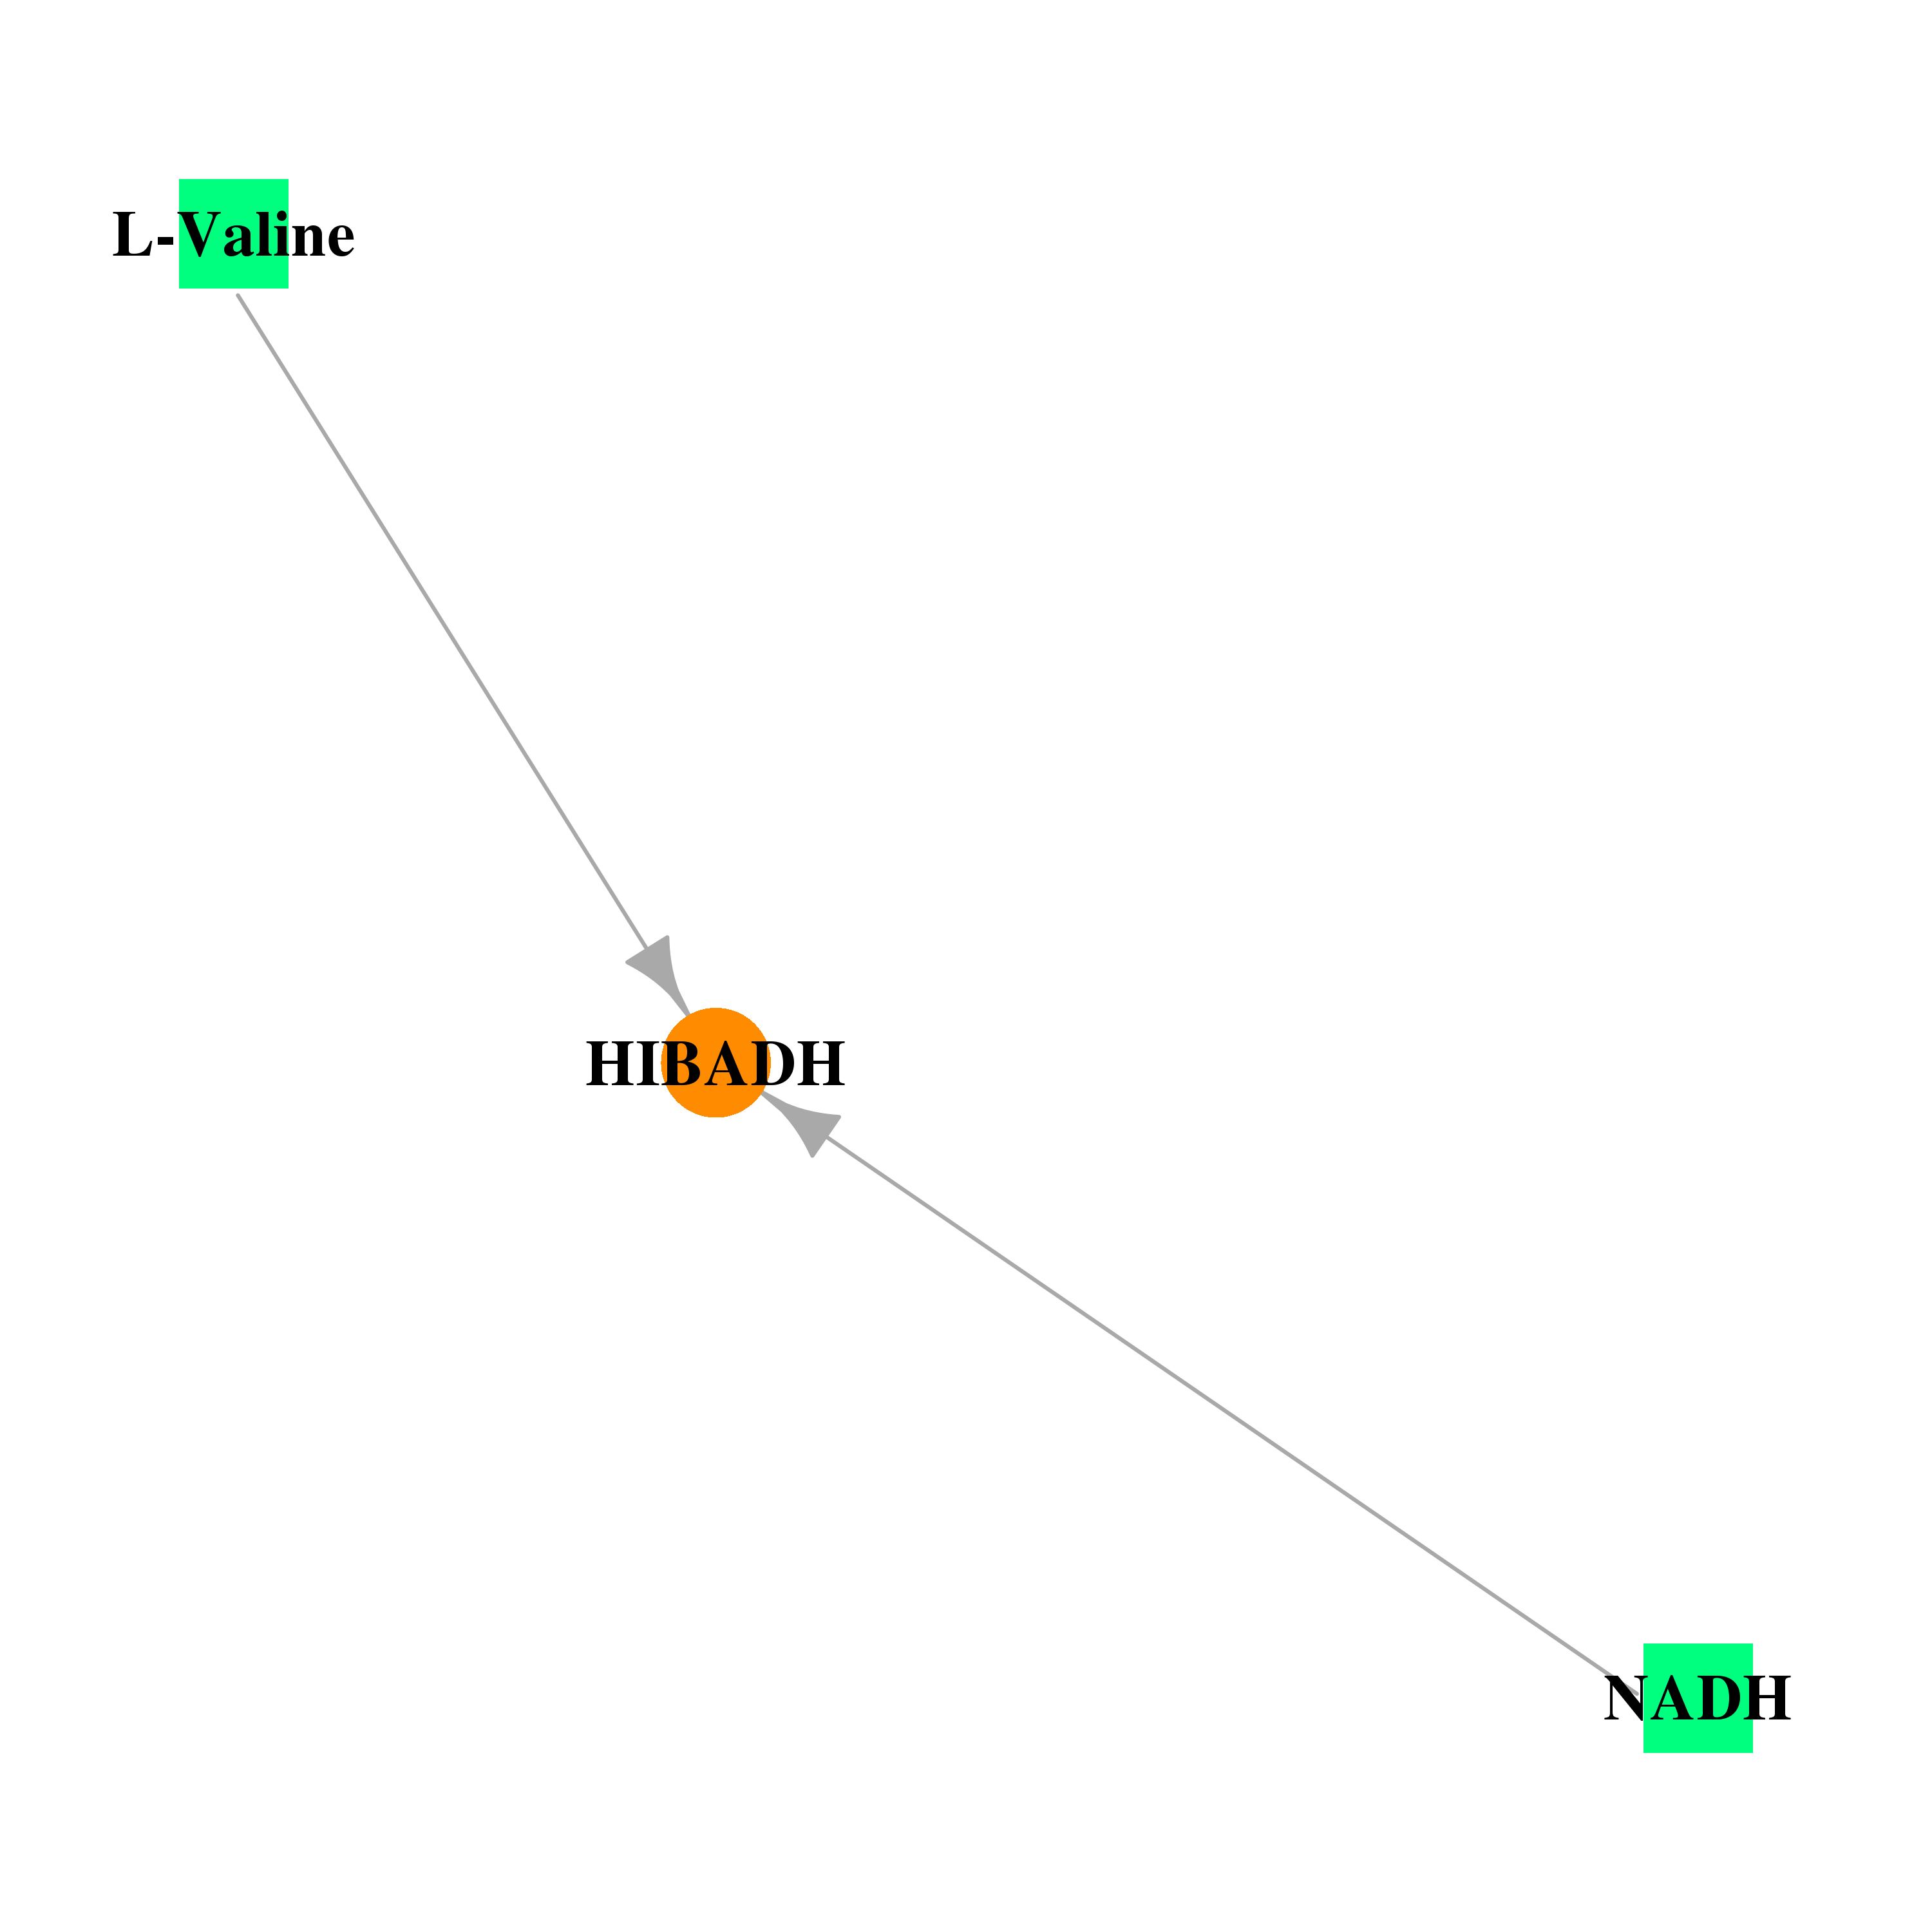
| DB00157 | 3-hydroxyisobutyrate dehydrogenase | approved; nutraceutical | NADH |  |  |
| DB00161 | 3-hydroxyisobutyrate dehydrogenase | approved; nutraceutical | L-Valine | 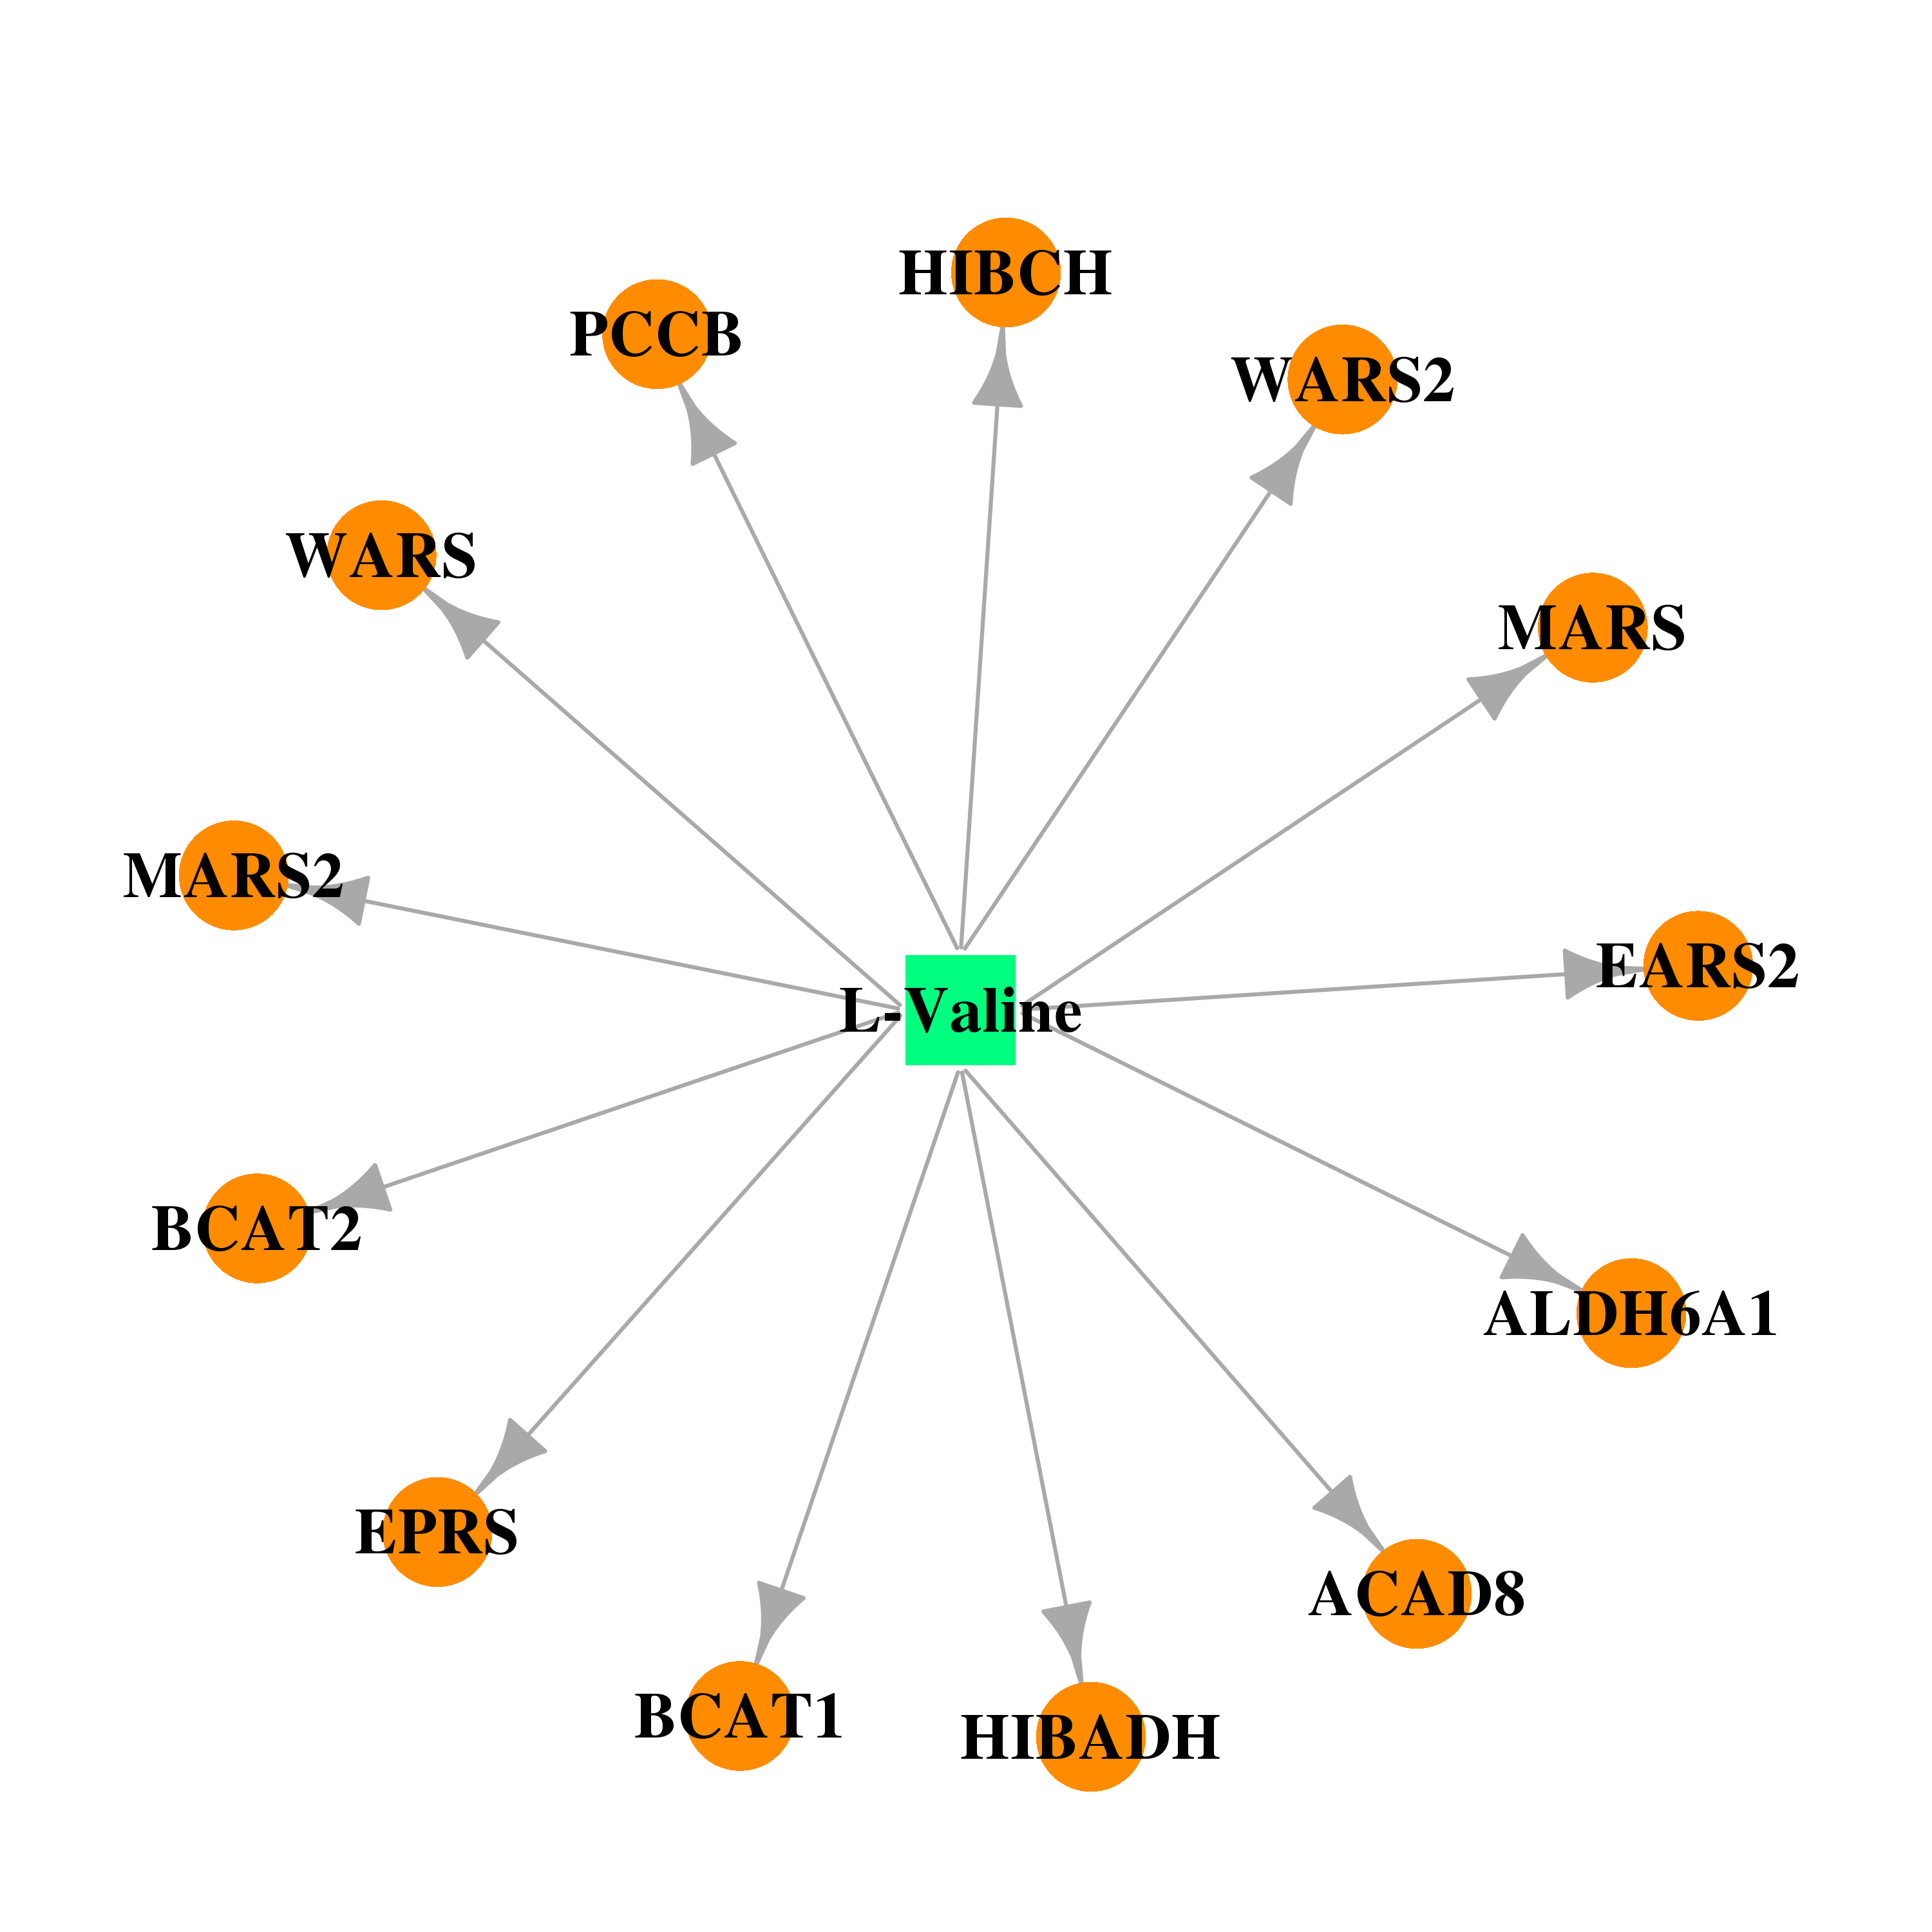 |  |
| Top |
| Cross referenced IDs for HIBADH |
| * We obtained these cross-references from Uniprot database. It covers 150 different DBs, 18 categories. http://www.uniprot.org/help/cross_references_section |
: Open all cross reference information
|
Copyright © 2016-Present - The Univsersity of Texas Health Science Center at Houston @ |