|
||||||||||||||||||||||||||||||||||||||||||||||||||||||||||||||||||||||||||||||||||||||||||||||||||||||||||||||||||||||||||||||||||||||||||||||||||||||||||||||||||||||||||||||||||||||||||||||||||||||||||||||||||||||||||||||||||||||||||||||||||||||||||||||||||||||||||||||||||||||||||||||||||||||||||||||||||||||||||
| |
| Phenotypic Information (metabolism pathway, cancer, disease, phenome) |
| |
| |
| Gene-Gene Network Information: Co-Expression Network, Interacting Genes & KEGG |
| |
|


| Gene Summary for POLR3A |
| Basic gene info. | Gene symbol | POLR3A |
| Gene name | polymerase (RNA) III (DNA directed) polypeptide A, 155kDa | |
| Synonyms | ADDH|HLD7|RPC1|RPC155|hRPC155 | |
| Cytomap | UCSC genome browser: 10q22-q23 | |
| Genomic location | chr10 :79734906-79789298 | |
| Type of gene | protein-coding | |
| RefGenes | NM_007055.3, | |
| Ensembl id | ENSG00000148606 | |
| Description | DNA-directed RNA polymerase III largest subunitDNA-directed RNA polymerase III subunit ADNA-directed RNA polymerase III subunit RPC1RNA polymerase III 155 kDa subunitRNA polymerase III subunit C1RNA polymerase III subunit C160RNA polymerase III subu | |
| Modification date | 20141219 | |
| dbXrefs | MIM : 614258 | |
| HGNC : HGNC | ||
| Ensembl : ENSG00000148606 | ||
| HPRD : 17879 | ||
| Vega : OTTHUMG00000018550 | ||
| Protein | UniProt: O14802 go to UniProt's Cross Reference DB Table | |
| Expression | CleanEX: HS_POLR3A | |
| BioGPS: 11128 | ||
| Gene Expression Atlas: ENSG00000148606 | ||
| The Human Protein Atlas: ENSG00000148606 | ||
| Pathway | NCI Pathway Interaction Database: POLR3A | |
| KEGG: POLR3A | ||
| REACTOME: POLR3A | ||
| ConsensusPathDB | ||
| Pathway Commons: POLR3A | ||
| Metabolism | MetaCyc: POLR3A | |
| HUMANCyc: POLR3A | ||
| Regulation | Ensembl's Regulation: ENSG00000148606 | |
| miRBase: chr10 :79,734,906-79,789,298 | ||
| TargetScan: NM_007055 | ||
| cisRED: ENSG00000148606 | ||
| Context | iHOP: POLR3A | |
| cancer metabolism search in PubMed: POLR3A | ||
| UCL Cancer Institute: POLR3A | ||
| Assigned class in ccmGDB | B - This gene belongs to cancer gene. | |
| Top |
| Phenotypic Information for POLR3A(metabolism pathway, cancer, disease, phenome) |
| Cancer | CGAP: POLR3A |
| Familial Cancer Database: POLR3A | |
| * This gene is included in those cancer gene databases. |
|
|
|
|
|
| . | ||||||||||||||||||||||||||||||||||||||||||||||||||||||||||||||||||||||||||||||||||||||||||||||||||||||||||||||||||||||||||||||||||||||||||||||||||||||||||||||||||||||||||||||||||||||||||||||||||||||||||||||||||||||||||||||||||||||||||||||||||||||||||||||||||||||||||||||||||||||||||||||||||||||||||||||||||||
Oncogene 1 | Significant driver gene in | |||||||||||||||||||||||||||||||||||||||||||||||||||||||||||||||||||||||||||||||||||||||||||||||||||||||||||||||||||||||||||||||||||||||||||||||||||||||||||||||||||||||||||||||||||||||||||||||||||||||||||||||||||||||||||||||||||||||||||||||||||||||||||||||||||||||||||||||||||||||||||||||||||||||||||||||||||||||||
| cf) number; DB name 1 Oncogene; http://nar.oxfordjournals.org/content/35/suppl_1/D721.long, 2 Tumor Suppressor gene; https://bioinfo.uth.edu/TSGene/, 3 Cancer Gene Census; http://www.nature.com/nrc/journal/v4/n3/abs/nrc1299.html, 4 CancerGenes; http://nar.oxfordjournals.org/content/35/suppl_1/D721.long, 5 Network of Cancer Gene; http://ncg.kcl.ac.uk/index.php, 1Therapeutic Vulnerabilities in Cancer; http://cbio.mskcc.org/cancergenomics/statius/ |
| KEGG_PURINE_METABOLISM KEGG_PYRIMIDINE_METABOLISM | |
| OMIM | 607694; phenotype. 614258; gene. |
| Orphanet | 77295; Odontoleukodystrophy. 88637; Hypomyelination - hypogonadotropic hypogonadism - hypodontia. |
| Disease | KEGG Disease: POLR3A |
| MedGen: POLR3A (Human Medical Genetics with Condition) | |
| ClinVar: POLR3A | |
| Phenotype | MGI: POLR3A (International Mouse Phenotyping Consortium) |
| PhenomicDB: POLR3A | |
| Mutations for POLR3A |
| * Under tables are showing count per each tissue to give us broad intuition about tissue specific mutation patterns.You can go to the detailed page for each mutation database's web site. |
| - Statistics for Tissue and Mutation type | Top |
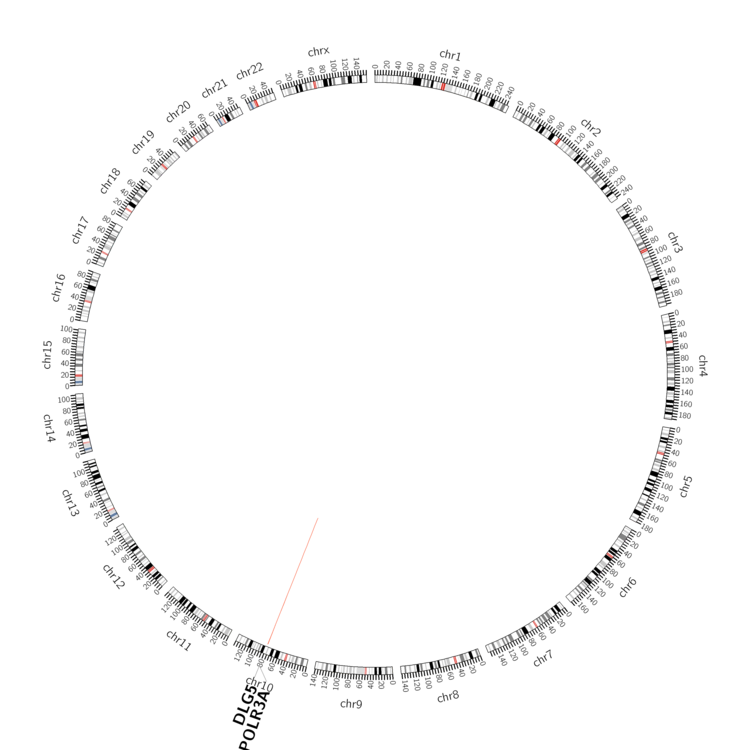 |
| - For Inter-chromosomal Variations |
| There's no inter-chromosomal structural variation. |
| - For Intra-chromosomal Variations |
| * Intra-chromosomal variantions includes 'intrachromosomal amplicon to amplicon', 'intrachromosomal amplicon to non-amplified dna', 'intrachromosomal deletion', 'intrachromosomal fold-back inversion', 'intrachromosomal inversion', 'intrachromosomal tandem duplication', 'Intrachromosomal unknown type', 'intrachromosomal with inverted orientation', 'intrachromosomal with non-inverted orientation'. |
 |
| Sample | Symbol_a | Chr_a | Start_a | End_a | Symbol_b | Chr_b | Start_b | End_b |
| ovary | POLR3A | chr10 | 79761340 | 79761360 | DLG5 | chr10 | 79657335 | 79657355 |
| ovary | POLR3A | chr10 | 79767002 | 79767022 | DLG5 | chr10 | 79616340 | 79616360 |
| pancreas | POLR3A | chr10 | 79748622 | 79748642 | DLG5 | chr10 | 79616933 | 79616953 |
| cf) Tissue number; Tissue name (1;Breast, 2;Central_nervous_system, 3;Haematopoietic_and_lymphoid_tissue, 4;Large_intestine, 5;Liver, 6;Lung, 7;Ovary, 8;Pancreas, 9;Prostate, 10;Skin, 11;Soft_tissue, 12;Upper_aerodigestive_tract) |
| * From mRNA Sanger sequences, Chitars2.0 arranged chimeric transcripts. This table shows POLR3A related fusion information. |
| ID | Head Gene | Tail Gene | Accession | Gene_a | qStart_a | qEnd_a | Chromosome_a | tStart_a | tEnd_a | Gene_a | qStart_a | qEnd_a | Chromosome_a | tStart_a | tEnd_a |
| AI193375 | PPM1F | 1 | 210 | 22 | 22297586 | 22297795 | POLR3A | 202 | 487 | 10 | 79750804 | 79753117 | |
| Top |
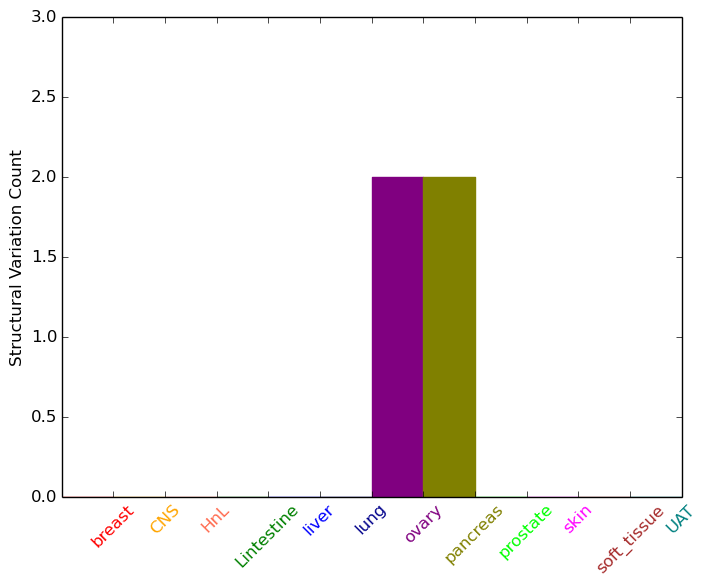
| Mutation type/ Tissue ID | brca | cns | cerv | endome | haematopo | kidn | Lintest | liver | lung | ns | ovary | pancre | prost | skin | stoma | thyro | urina | |||
| Total # sample | 2 | 1 | ||||||||||||||||||
| GAIN (# sample) | 2 | 1 | ||||||||||||||||||
| LOSS (# sample) |
| cf) Tissue ID; Tissue type (1; Breast, 2; Central_nervous_system, 3; Cervix, 4; Endometrium, 5; Haematopoietic_and_lymphoid_tissue, 6; Kidney, 7; Large_intestine, 8; Liver, 9; Lung, 10; NS, 11; Ovary, 12; Pancreas, 13; Prostate, 14; Skin, 15; Stomach, 16; Thyroid, 17; Urinary_tract) |
| Top |
|
 |
| Top |
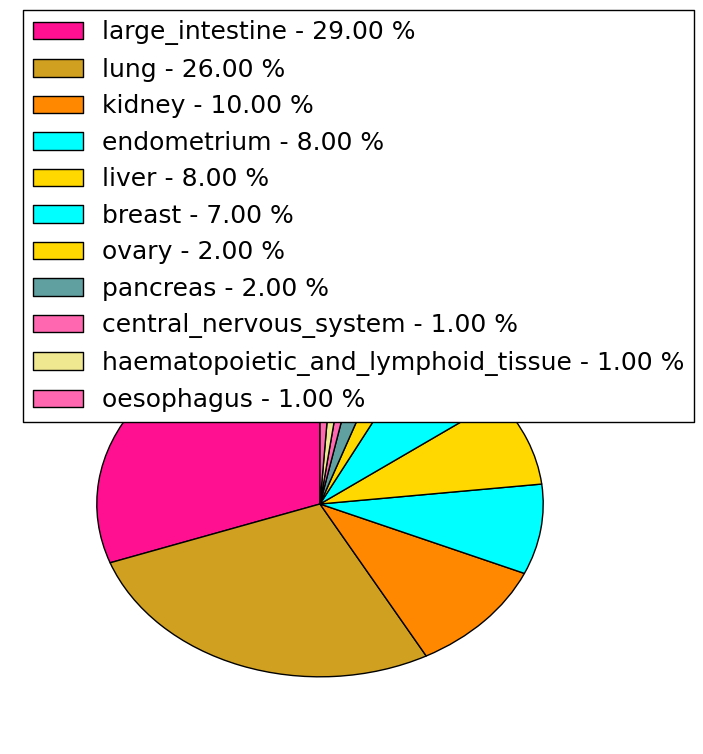
| Stat. for Non-Synonymous SNVs (# total SNVs=79) | (# total SNVs=33) |
 | 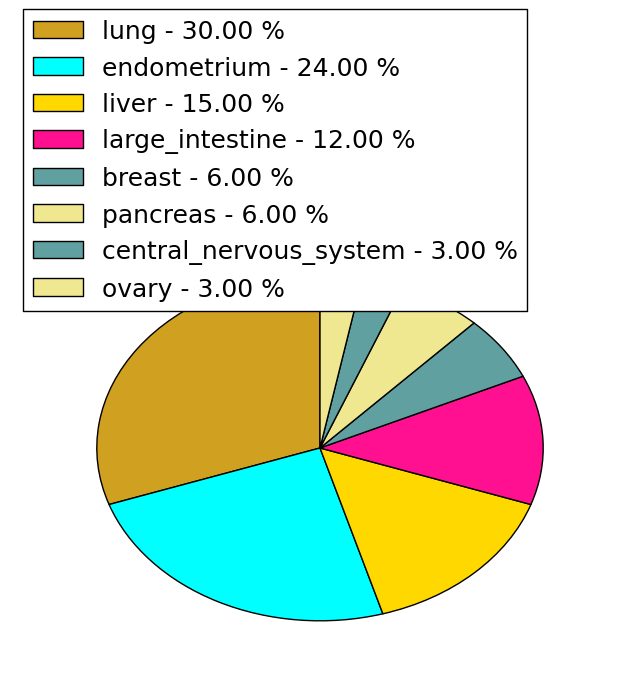 |
(# total SNVs=1) | (# total SNVs=0) |
 |
| Top |
| * When you move the cursor on each content, you can see more deailed mutation information on the Tooltip. Those are primary_site,primary_histology,mutation(aa),pubmedID. |
| GRCh37 position | Mutation(aa) | Unique sampleID count |
| chr10:79745903-79745903 | p.F972L | 3 |
| chr10:79767484-79767484 | p.A684P | 2 |
| chr10:79777462-79777462 | p.Y434Y | 2 |
| chr10:79769648-79769648 | p.R582C | 2 |
| chr10:79759756-79759756 | p.E867* | 2 |
| chr10:79764506-79764506 | p.Q739* | 2 |
| chr10:79739966-79739966 | p.A1319A | 2 |
| chr10:79785505-79785505 | p.K65E | 2 |
| chr10:79778975-79778975 | p.P412S | 2 |
| chr10:79785513-79785513 | p.T62M | 2 |
| Top |
|
 |
| Point Mutation/ Tissue ID | 1 | 2 | 3 | 4 | 5 | 6 | 7 | 8 | 9 | 10 | 11 | 12 | 13 | 14 | 15 | 16 | 17 | 18 | 19 | 20 |
| # sample | 4 | 5 | 16 | 7 | 6 | 2 | 19 | 3 | 2 | 13 | 15 | 13 | ||||||||
| # mutation | 4 | 5 | 17 | 8 | 6 | 2 | 22 | 3 | 2 | 13 | 17 | 12 | ||||||||
| nonsynonymous SNV | 4 | 3 | 13 | 6 | 6 | 2 | 15 | 1 | 1 | 3 | 14 | 4 | ||||||||
| synonymous SNV | 2 | 4 | 2 | 7 | 2 | 1 | 10 | 3 | 8 |
| cf) Tissue ID; Tissue type (1; BLCA[Bladder Urothelial Carcinoma], 2; BRCA[Breast invasive carcinoma], 3; CESC[Cervical squamous cell carcinoma and endocervical adenocarcinoma], 4; COAD[Colon adenocarcinoma], 5; GBM[Glioblastoma multiforme], 6; Glioma Low Grade, 7; HNSC[Head and Neck squamous cell carcinoma], 8; KICH[Kidney Chromophobe], 9; KIRC[Kidney renal clear cell carcinoma], 10; KIRP[Kidney renal papillary cell carcinoma], 11; LAML[Acute Myeloid Leukemia], 12; LUAD[Lung adenocarcinoma], 13; LUSC[Lung squamous cell carcinoma], 14; OV[Ovarian serous cystadenocarcinoma ], 15; PAAD[Pancreatic adenocarcinoma], 16; PRAD[Prostate adenocarcinoma], 17; SKCM[Skin Cutaneous Melanoma], 18:STAD[Stomach adenocarcinoma], 19:THCA[Thyroid carcinoma], 20:UCEC[Uterine Corpus Endometrial Carcinoma]) |
| Top |
| * We represented just top 10 SNVs. When you move the cursor on each content, you can see more deailed mutation information on the Tooltip. Those are primary_site, primary_histology, mutation(aa), pubmedID. |
| Genomic Position | Mutation(aa) | Unique sampleID count |
| chr10:79742042 | p.A1210V | 3 |
| chr10:79745903 | p.A32V | 2 |
| chr10:79769648 | p.F972L | 2 |
| chr10:79785937 | p.R582C | 2 |
| chr10:79743987 | p.R1069R | 1 |
| chr10:79764513 | p.E937K | 1 |
| chr10:79781316 | p.K735T | 1 |
| chr10:79745861 | p.L520H | 1 |
| chr10:79769644 | p.V380V | 1 |
| chr10:79782083 | p.S1291S | 1 |
| * Copy number data were extracted from TCGA using R package TCGA-Assembler. The URLs of all public data files on TCGA DCC data server were gathered on Jan-05-2015. Function ProcessCNAData in TCGA-Assembler package was used to obtain gene-level copy number value which is calculated as the average copy number of the genomic region of a gene. |
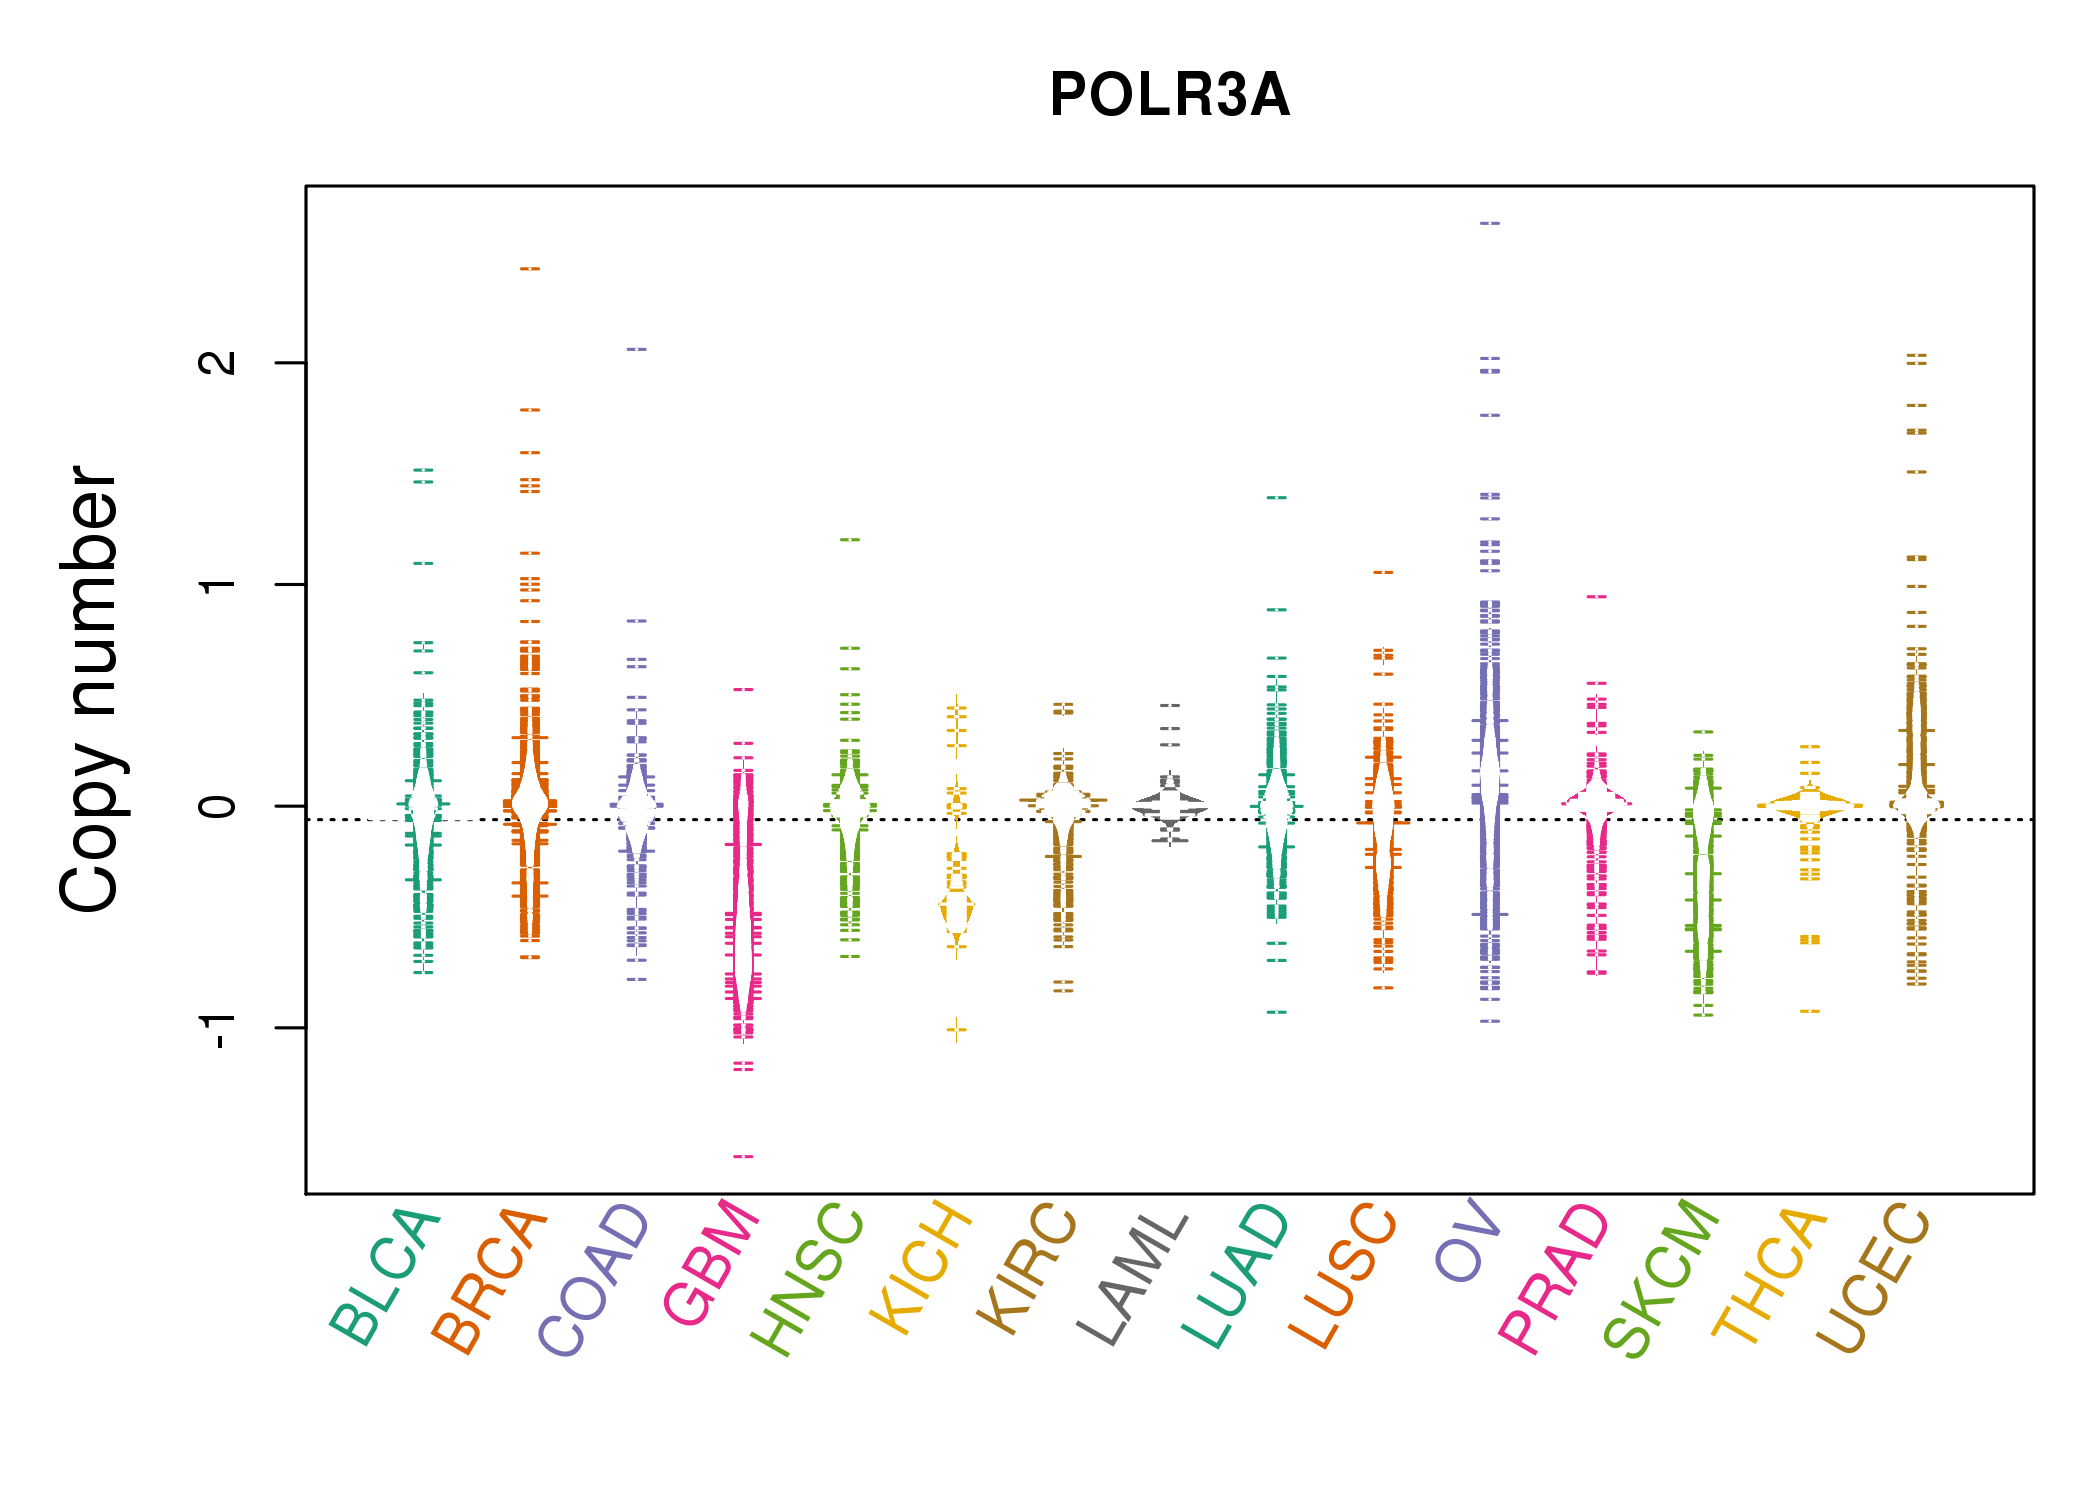 |
| cf) Tissue ID[Tissue type]: BLCA[Bladder Urothelial Carcinoma], BRCA[Breast invasive carcinoma], CESC[Cervical squamous cell carcinoma and endocervical adenocarcinoma], COAD[Colon adenocarcinoma], GBM[Glioblastoma multiforme], Glioma Low Grade, HNSC[Head and Neck squamous cell carcinoma], KICH[Kidney Chromophobe], KIRC[Kidney renal clear cell carcinoma], KIRP[Kidney renal papillary cell carcinoma], LAML[Acute Myeloid Leukemia], LUAD[Lung adenocarcinoma], LUSC[Lung squamous cell carcinoma], OV[Ovarian serous cystadenocarcinoma ], PAAD[Pancreatic adenocarcinoma], PRAD[Prostate adenocarcinoma], SKCM[Skin Cutaneous Melanoma], STAD[Stomach adenocarcinoma], THCA[Thyroid carcinoma], UCEC[Uterine Corpus Endometrial Carcinoma] |
| Top |
| Gene Expression for POLR3A |
| * CCLE gene expression data were extracted from CCLE_Expression_Entrez_2012-10-18.res: Gene-centric RMA-normalized mRNA expression data. |
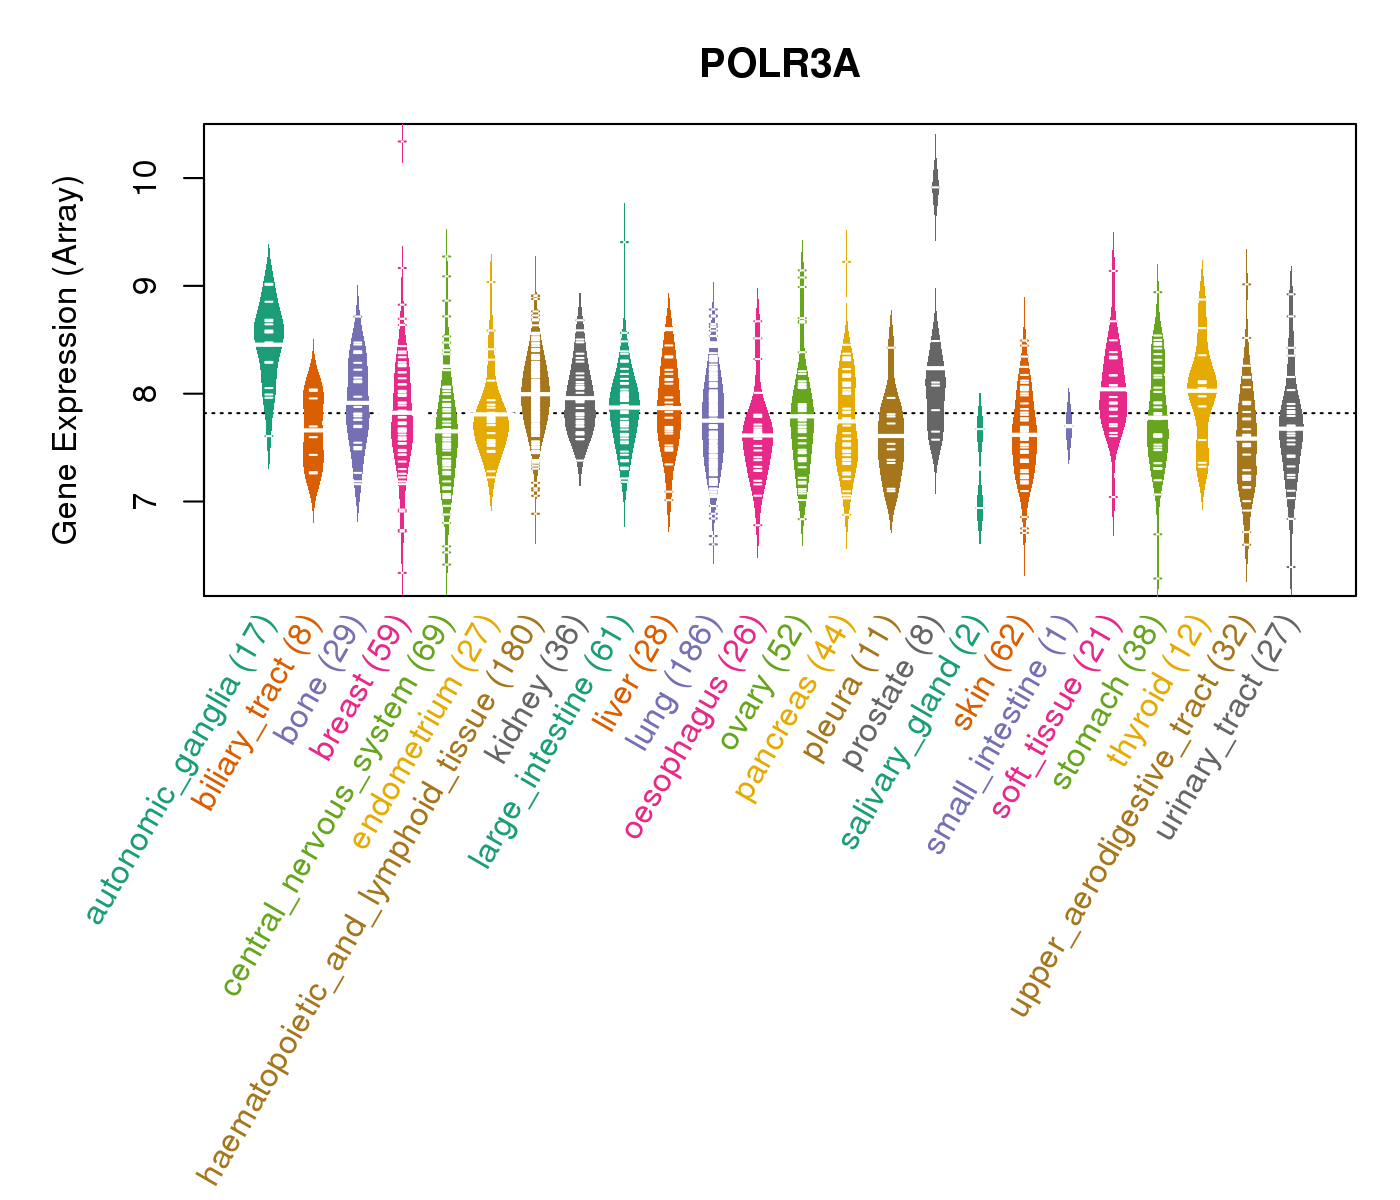 |
| * Normalized gene expression data of RNASeqV2 was extracted from TCGA using R package TCGA-Assembler. The URLs of all public data files on TCGA DCC data server were gathered at Jan-05-2015. Only eight cancer types have enough normal control samples for differential expression analysis. (t test, adjusted p<0.05 (using Benjamini-Hochberg FDR)) |
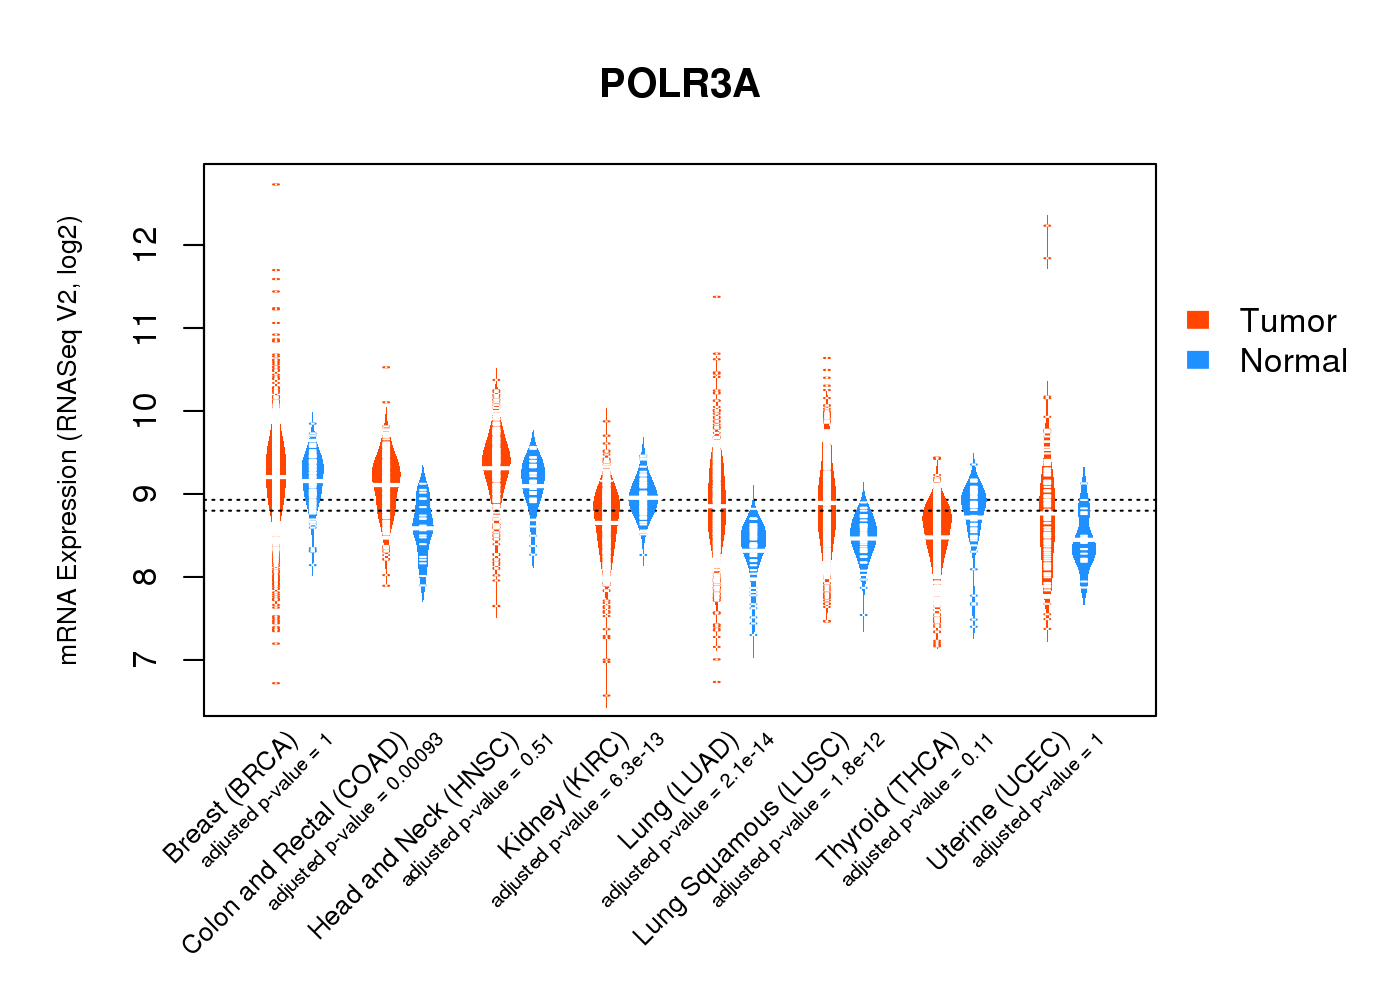 |
| Top |
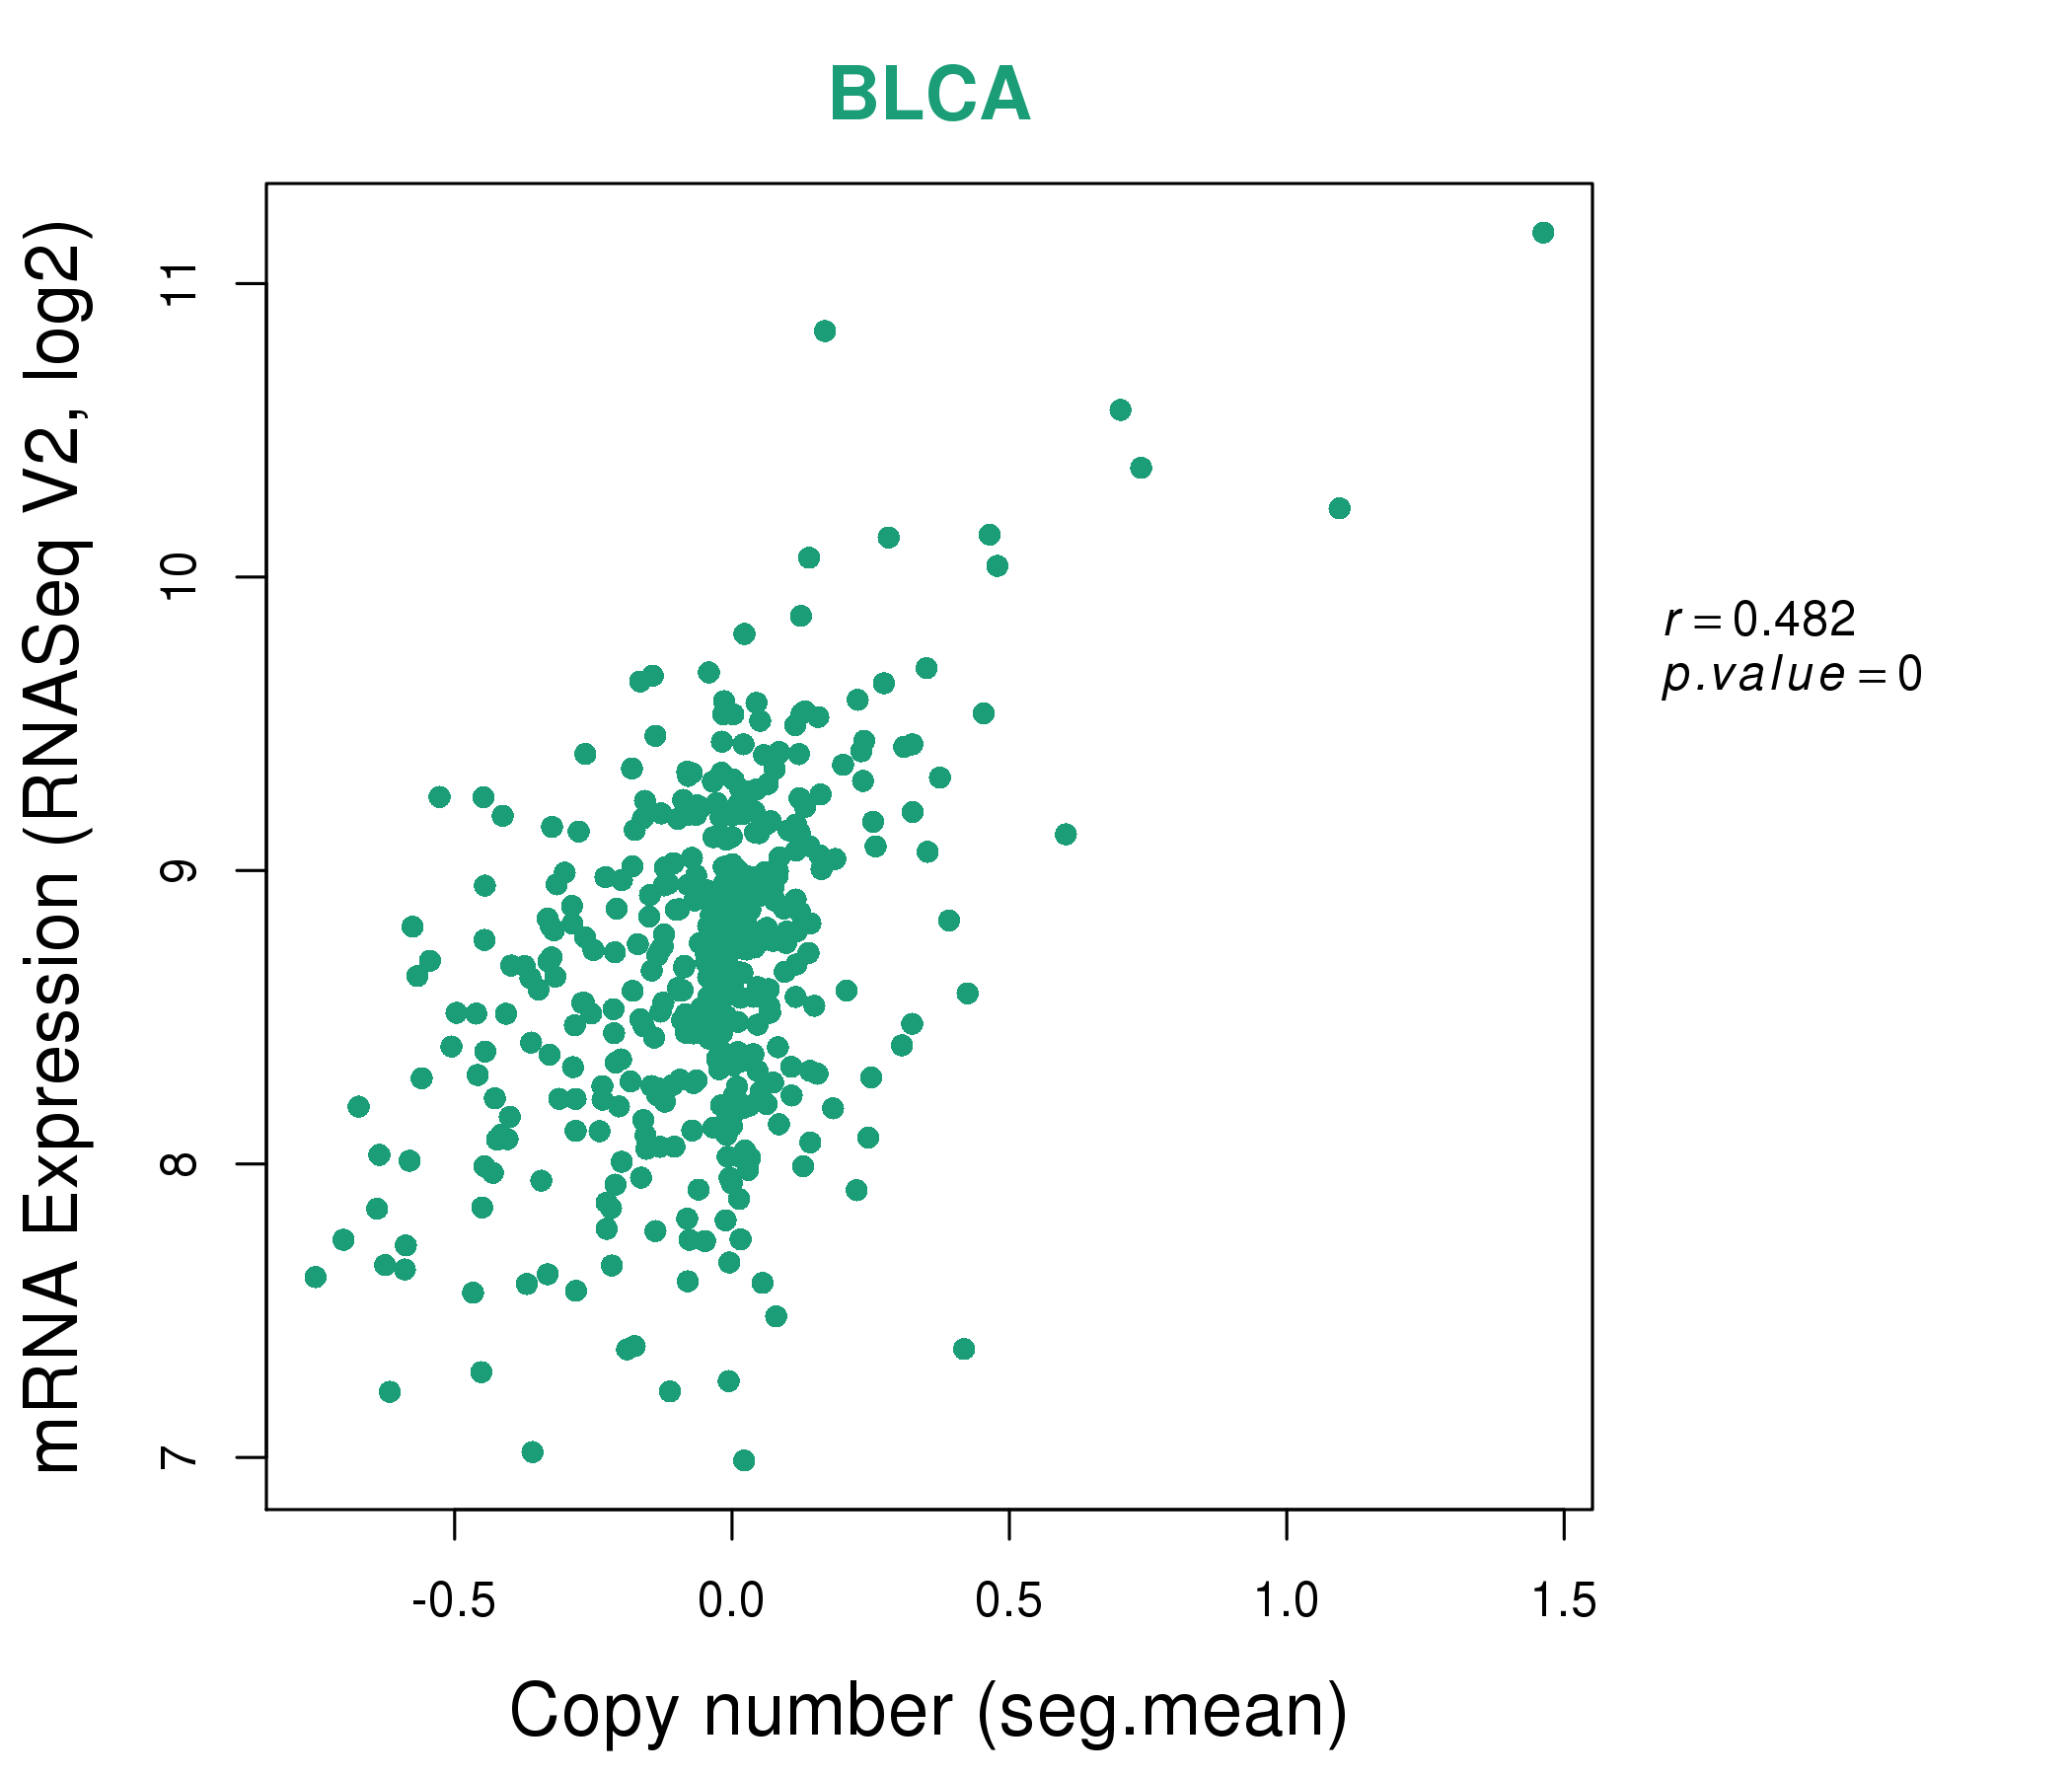
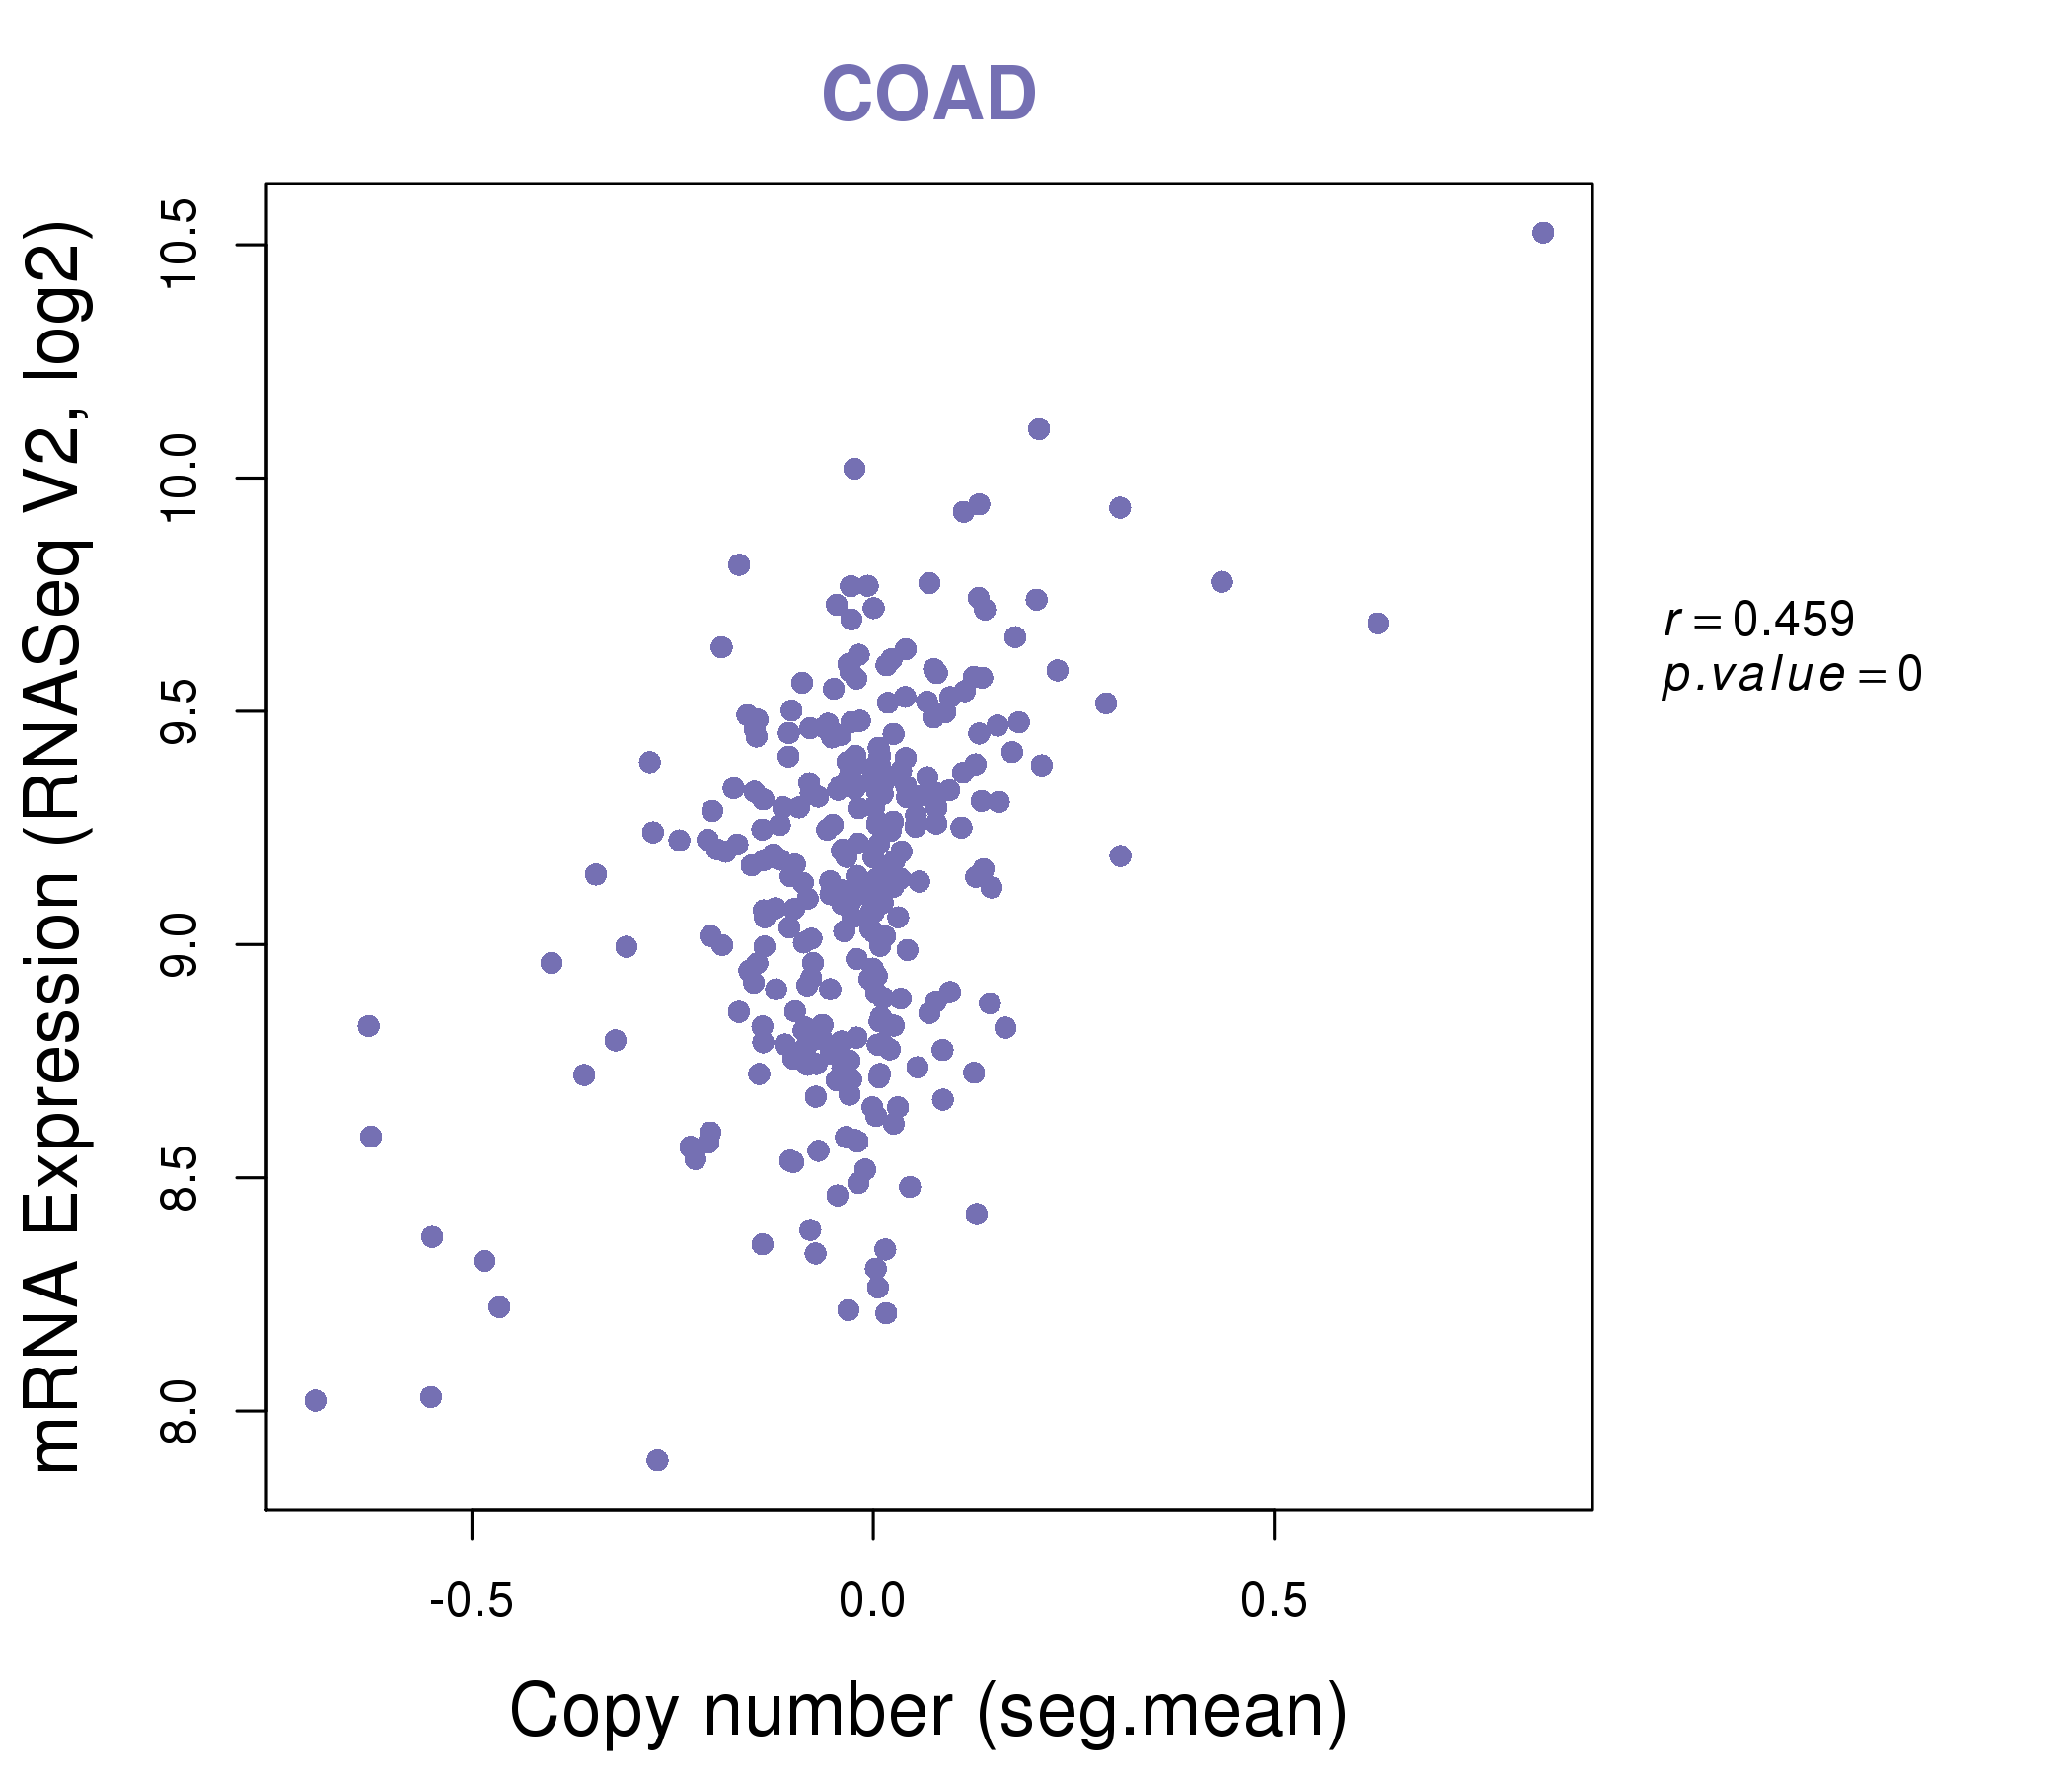
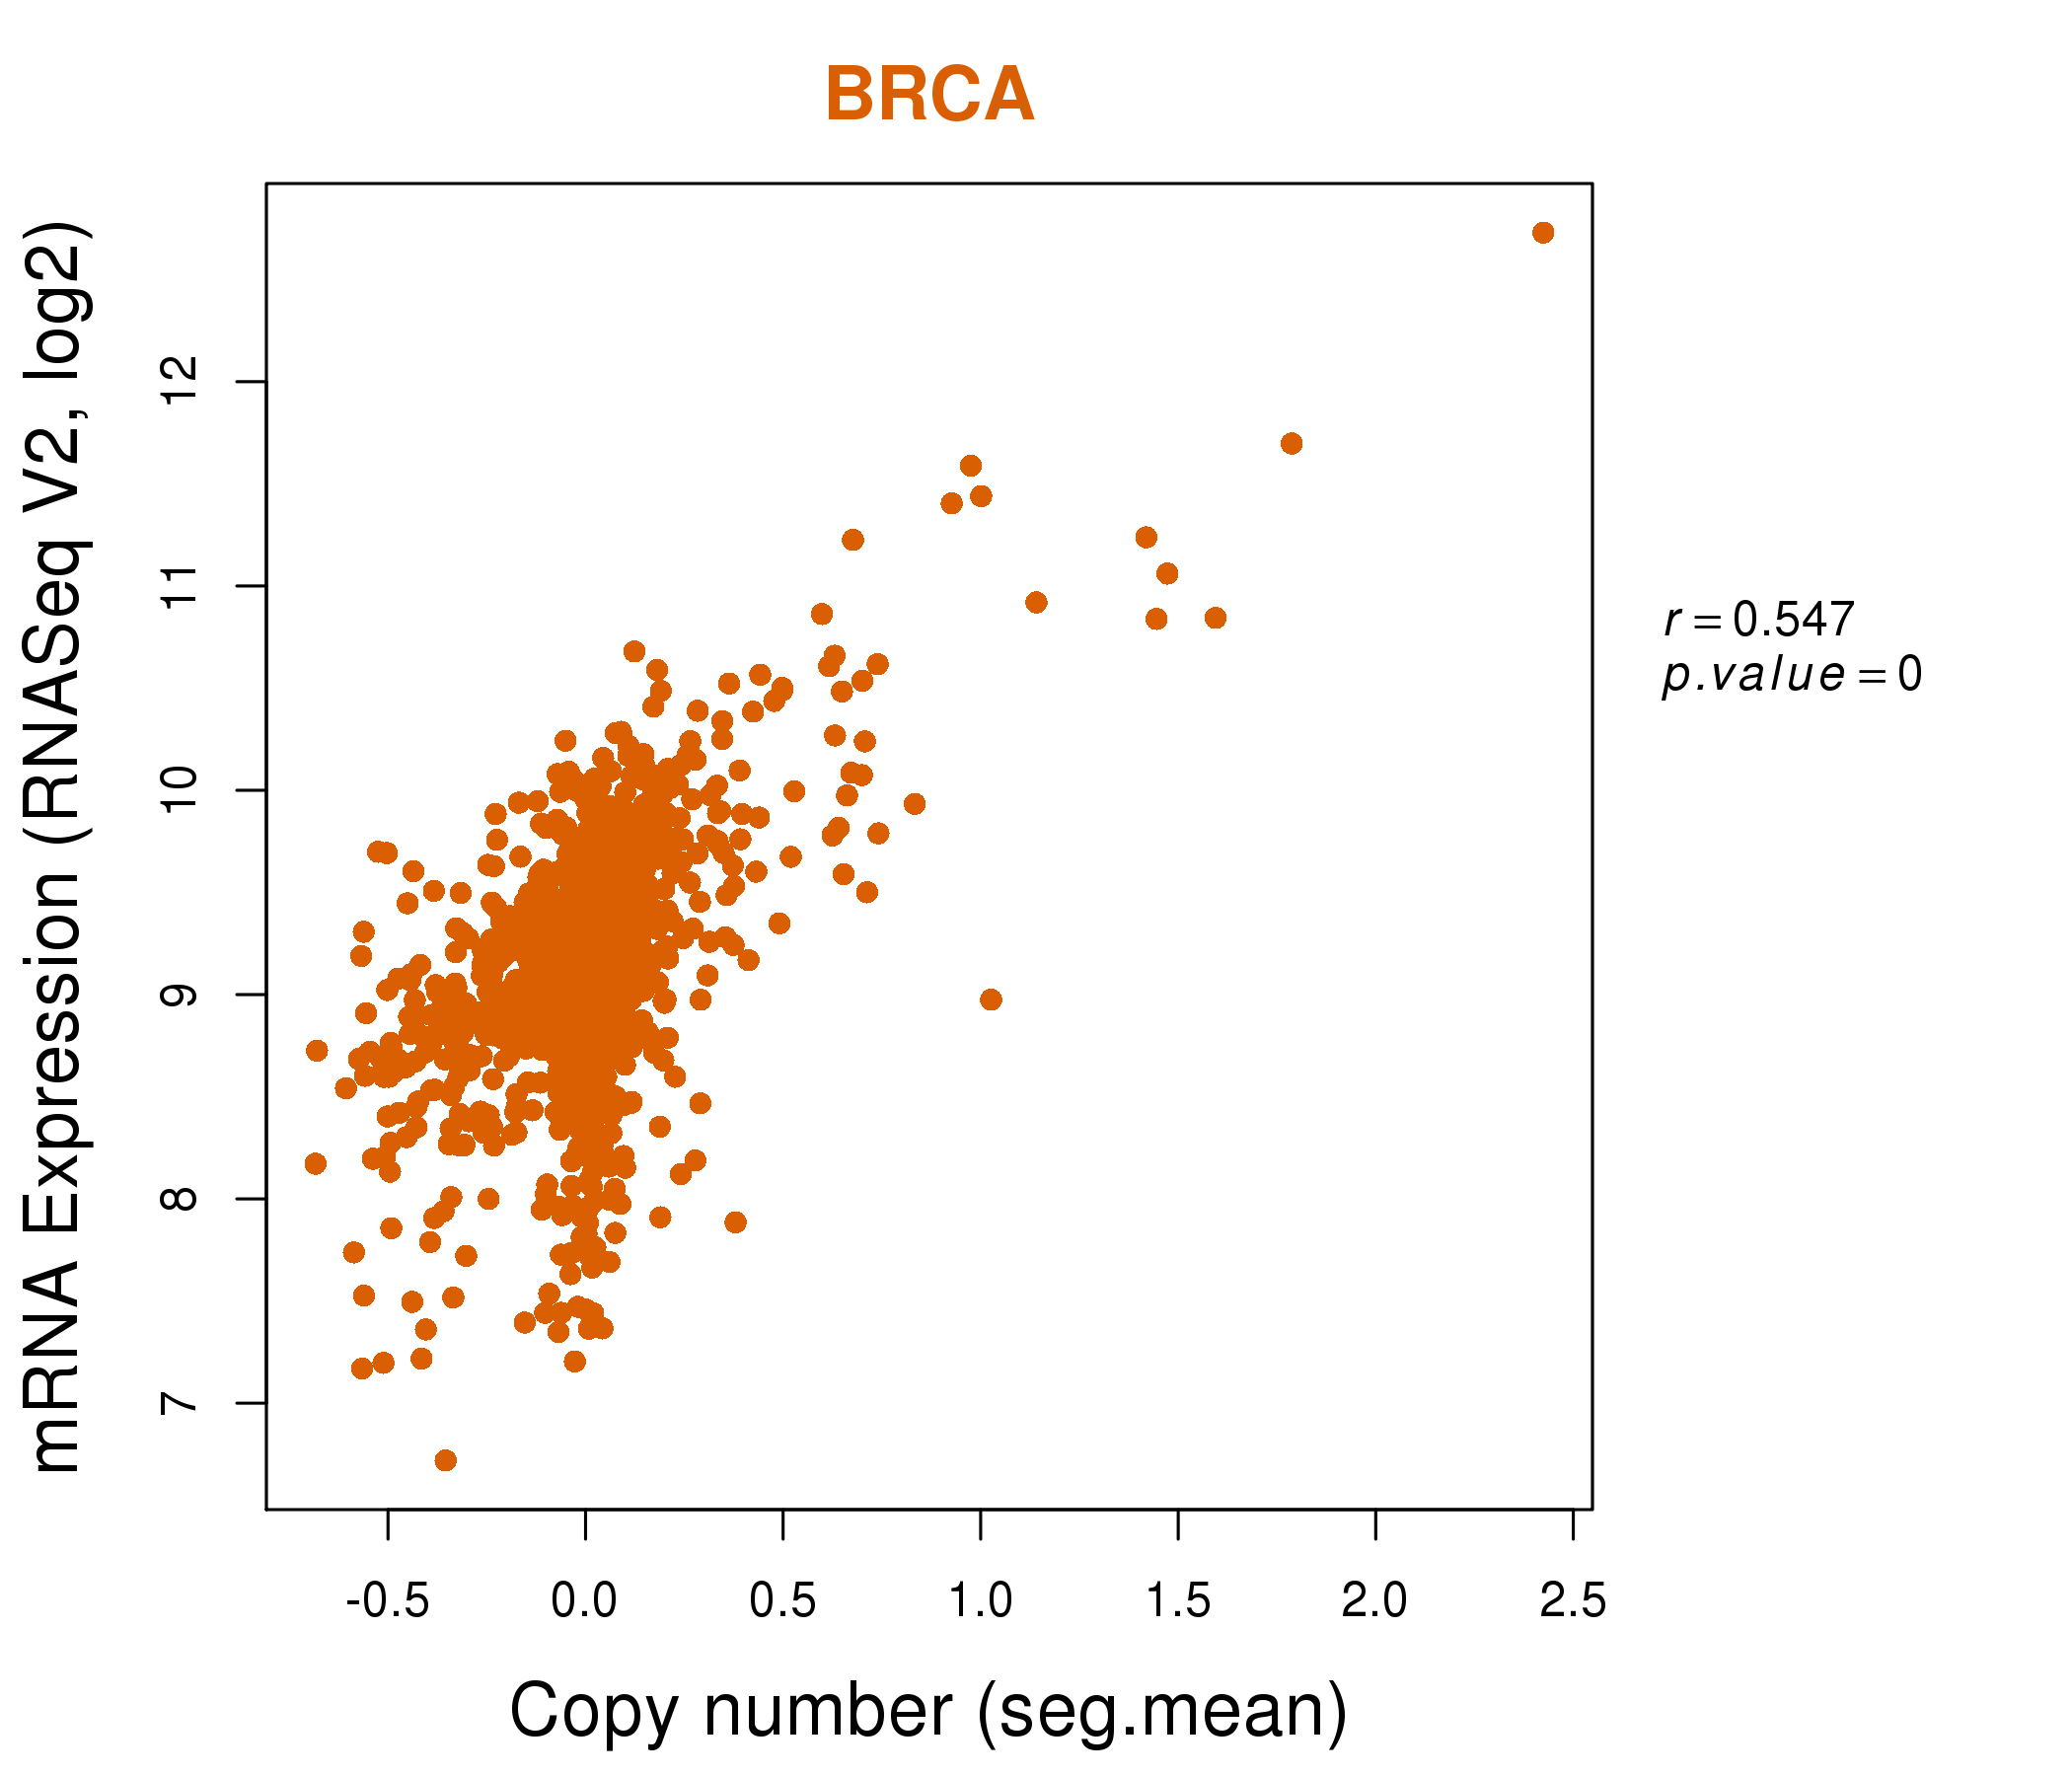
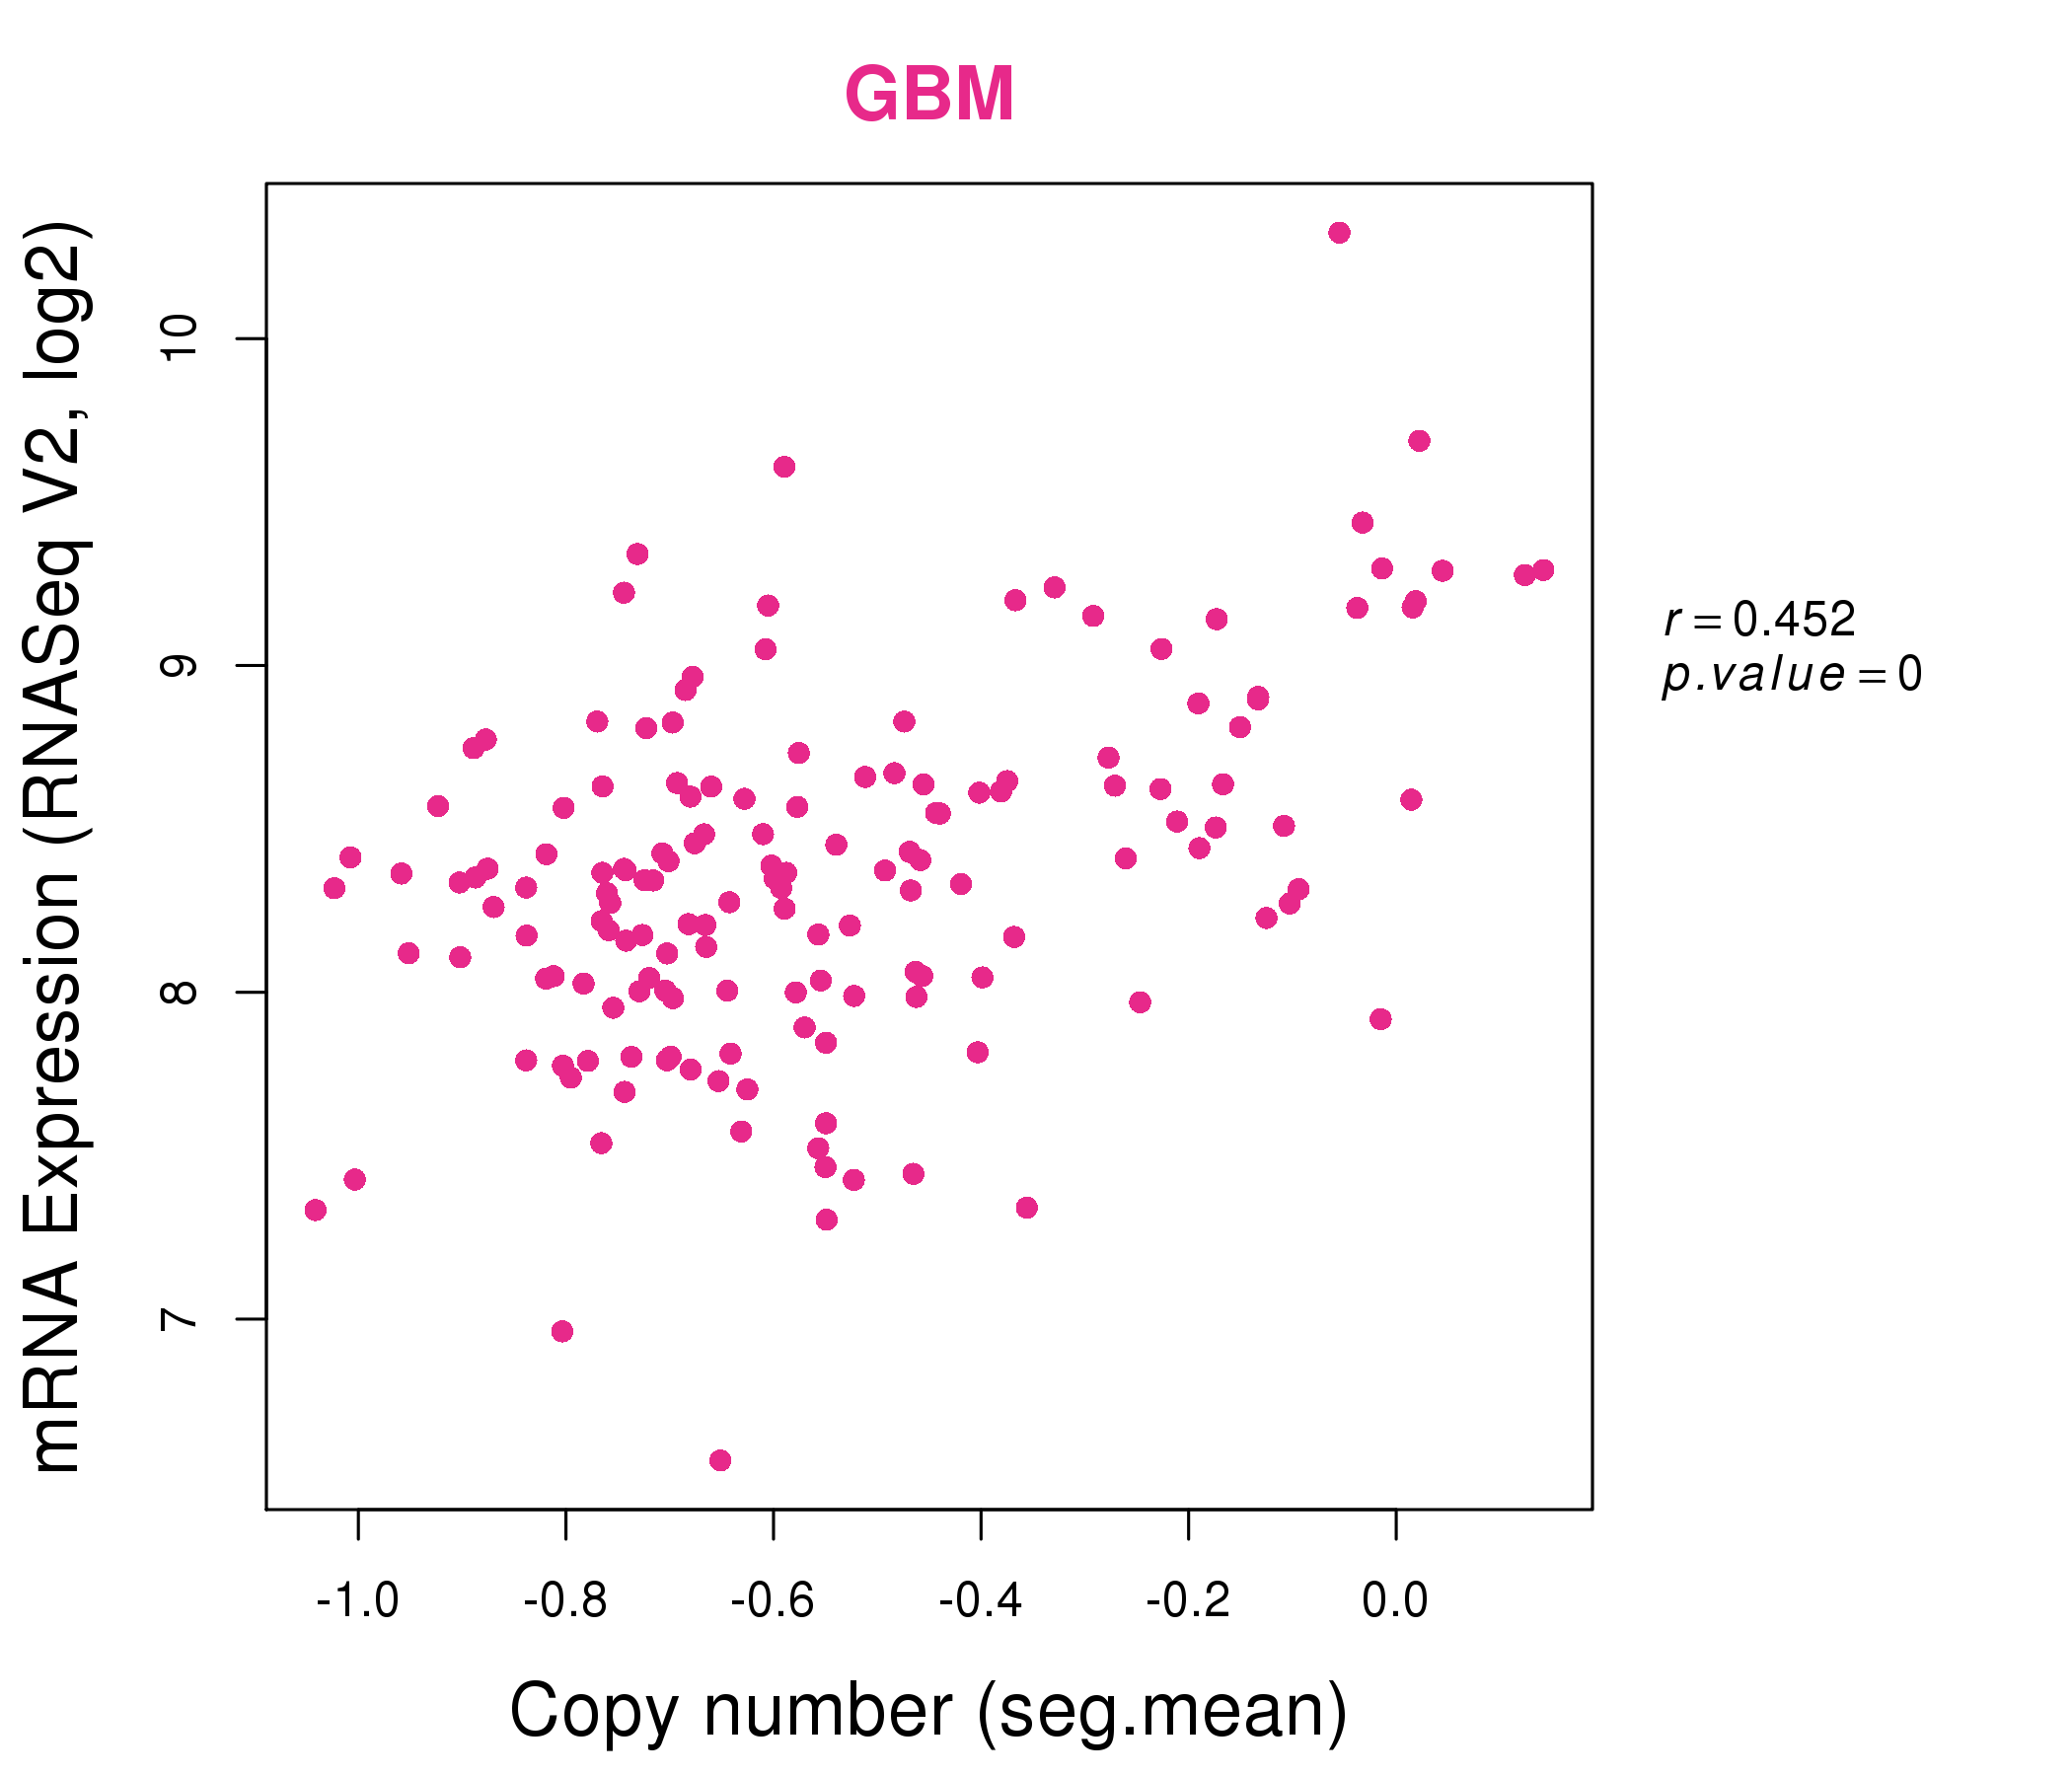
| * This plots show the correlation between CNV and gene expression. |
: Open all plots for all cancer types
 |
|
 |
|
| Top |
| Gene-Gene Network Information |
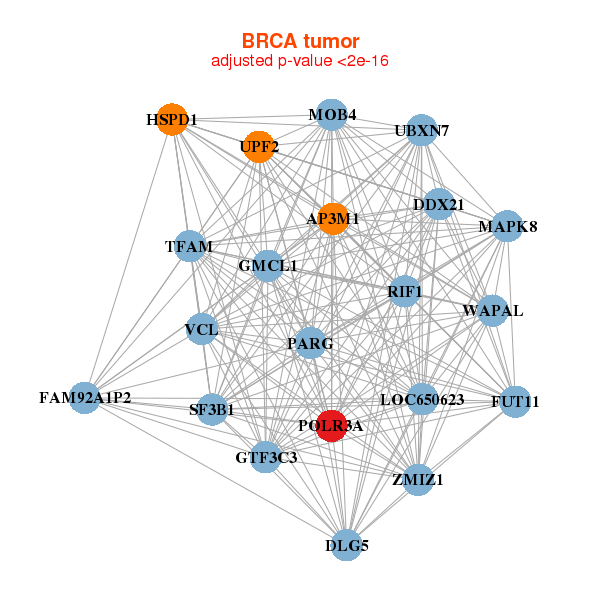
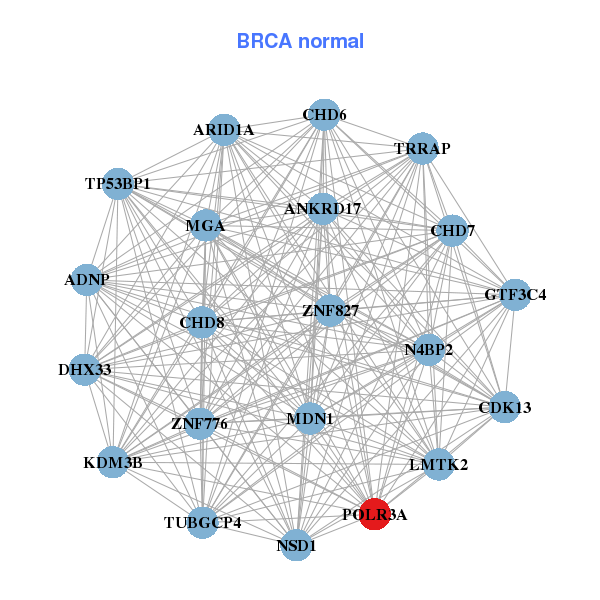
| * Co-Expression network figures were drawn using R package igraph. Only the top 20 genes with the highest correlations were shown. Red circle: input gene, orange circle: cell metabolism gene, sky circle: other gene |
: Open all plots for all cancer types
 |
|
| AP3M1,DDX21,DLG5,FAM92A1P2,FUT11,GMCL1,GTF3C3, HSPD1,LOC650623,MAPK8,MOB4,PARG,POLR3A,RIF1, SF3B1,TFAM,UBXN7,UPF2,VCL,WAPAL,ZMIZ1 | ADNP,ANKRD17,ARID1A,CDK13,CHD6,CHD7,CHD8, DHX33,GTF3C4,KDM3B,LMTK2,MDN1,MGA,N4BP2, NSD1,POLR3A,TP53BP1,TRRAP,TUBGCP4,ZNF776,ZNF827 |
 |
|
| ANAPC1,AP3M1,ASXL2,DDX21,DLG5,EIF4G1,GTF3C4, LARP1,MDN1,KMT2B___KMT2D,KAT6B,NEU3,PDCD11,POLR1A, POLR3A,RAD54L2,RIF1,SHPRH,SNRNP200,TGFBRAP1,URB1 | ANKRD17,BTAF1,FAM208B,CAD,CDK12,DDI2,IKBKAP, ILF3,KIAA1244,LARP1,MDN1,KMT2B___KMT2D,POLR1A,POLR3A, RBM19,RC3H2,POMK,TUBGCP4,USP24,VPRBP,ZNF142 |
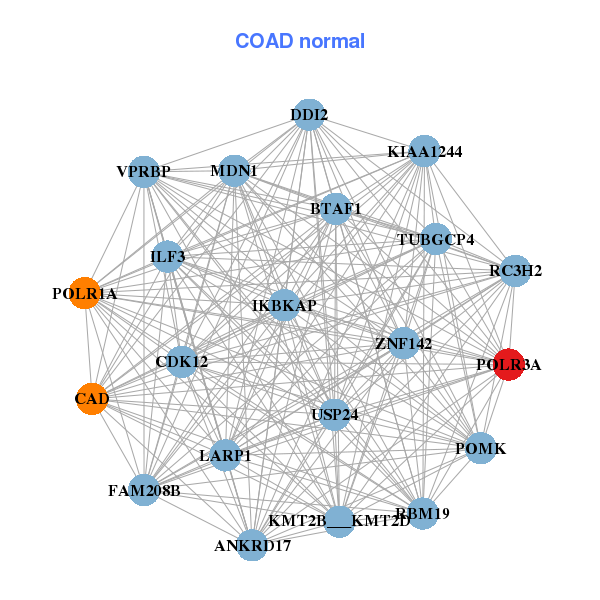
| * Co-Expression network figures were drawn using R package igraph. Only the top 20 genes with the highest correlations were shown. Red circle: input gene, orange circle: cell metabolism gene, sky circle: other gene |
: Open all plots for all cancer types
| Top |
: Open all interacting genes' information including KEGG pathway for all interacting genes from DAVID
| Top |
| Pharmacological Information for POLR3A |
| There's no related Drug. |
| Top |
| Cross referenced IDs for POLR3A |
| * We obtained these cross-references from Uniprot database. It covers 150 different DBs, 18 categories. http://www.uniprot.org/help/cross_references_section |
: Open all cross reference information
|
Copyright © 2016-Present - The Univsersity of Texas Health Science Center at Houston @ |