|
||||||||||||||||||||||||||||||||||||||||||||||||||||||||||||||||||||||||||||||||||||||||||||||||||||||||||||||||||||||||||||||||||||||||||||||||||||||||||||||||||||||||||||||||||||||||||||||||||||||||||||||||||||||||||||||||||||||||||||||||||||||||||||||||||||||||||||||||||||||||||||||||||||||||||||||||||||||||||
| |
| Phenotypic Information (metabolism pathway, cancer, disease, phenome) |
| |
| |
| Gene-Gene Network Information: Co-Expression Network, Interacting Genes & KEGG |
| |
|


| Gene Summary for PLA2G16 |
| Basic gene info. | Gene symbol | PLA2G16 |
| Gene name | phospholipase A2, group XVI | |
| Synonyms | AdPLA|H-REV107-1|HRASLS3|HREV107|HREV107-1|HREV107-3|HRSL3 | |
| Cytomap | UCSC genome browser: 11q12.3 | |
| Genomic location | chr11 :63341943-63381909 | |
| Type of gene | protein-coding | |
| RefGenes | NM_001128203.1, NM_007069.3, | |
| Ensembl id | ENSG00000176485 | |
| Description | Ca-independent phospholipase A1/2H-rev 107 protein homologHRAS-like suppressor 1HRAS-like suppressor 3adipose-specific PLA2adipose-specific phospholipase A2group XVI phospholipase A1/A2group XVI phospholipase A2renal carcinoma antigen NY-REN-65 | |
| Modification date | 20141207 | |
| dbXrefs | MIM : 613867 | |
| HGNC : HGNC | ||
| Ensembl : ENSG00000176485 | ||
| HPRD : 13671 | ||
| Protein | UniProt: P53816 go to UniProt's Cross Reference DB Table | |
| Expression | CleanEX: HS_PLA2G16 | |
| BioGPS: 11145 | ||
| Gene Expression Atlas: ENSG00000176485 | ||
| The Human Protein Atlas: ENSG00000176485 | ||
| Pathway | NCI Pathway Interaction Database: PLA2G16 | |
| KEGG: PLA2G16 | ||
| REACTOME: PLA2G16 | ||
| ConsensusPathDB | ||
| Pathway Commons: PLA2G16 | ||
| Metabolism | MetaCyc: PLA2G16 | |
| HUMANCyc: PLA2G16 | ||
| Regulation | Ensembl's Regulation: ENSG00000176485 | |
| miRBase: chr11 :63,341,943-63,381,909 | ||
| TargetScan: NM_001128203 | ||
| cisRED: ENSG00000176485 | ||
| Context | iHOP: PLA2G16 | |
| cancer metabolism search in PubMed: PLA2G16 | ||
| UCL Cancer Institute: PLA2G16 | ||
| Assigned class in ccmGDB | A - This gene has a literature evidence and it belongs to cancer gene. | |
| References showing role of PLA2G16 in cancer cell metabolism | 1. Wang C-H, Shyu R-Y, Wu C-C, Tsai T-C, Wang L-K, et al. (2014) Phospholipase A/Acyltransferase enzyme activity of H-rev107 inhibits the H-RAS signaling pathway. Journal of biomedical science 21: 1-9. go to article | |
| Top |
| Phenotypic Information for PLA2G16(metabolism pathway, cancer, disease, phenome) |
| Cancer | CGAP: PLA2G16 |
| Familial Cancer Database: PLA2G16 | |
| * This gene is included in those cancer gene databases. |
|
|
|
|
|
| . | ||||||||||||||||||||||||||||||||||||||||||||||||||||||||||||||||||||||||||||||||||||||||||||||||||||||||||||||||||||||||||||||||||||||||||||||||||||||||||||||||||||||||||||||||||||||||||||||||||||||||||||||||||||||||||||||||||||||||||||||||||||||||||||||||||||||||||||||||||||||||||||||||||||||||||||||||||||
Oncogene 1 | Significant driver gene in | |||||||||||||||||||||||||||||||||||||||||||||||||||||||||||||||||||||||||||||||||||||||||||||||||||||||||||||||||||||||||||||||||||||||||||||||||||||||||||||||||||||||||||||||||||||||||||||||||||||||||||||||||||||||||||||||||||||||||||||||||||||||||||||||||||||||||||||||||||||||||||||||||||||||||||||||||||||||||
| cf) number; DB name 1 Oncogene; http://nar.oxfordjournals.org/content/35/suppl_1/D721.long, 2 Tumor Suppressor gene; https://bioinfo.uth.edu/TSGene/, 3 Cancer Gene Census; http://www.nature.com/nrc/journal/v4/n3/abs/nrc1299.html, 4 CancerGenes; http://nar.oxfordjournals.org/content/35/suppl_1/D721.long, 5 Network of Cancer Gene; http://ncg.kcl.ac.uk/index.php, 1Therapeutic Vulnerabilities in Cancer; http://cbio.mskcc.org/cancergenomics/statius/ |
| REACTOME_PHOSPHOLIPID_METABOLISM REACTOME_METABOLISM_OF_LIPIDS_AND_LIPOPROTEINS | |
| OMIM | 613867; gene. |
| Orphanet | |
| Disease | KEGG Disease: PLA2G16 |
| MedGen: PLA2G16 (Human Medical Genetics with Condition) | |
| ClinVar: PLA2G16 | |
| Phenotype | MGI: PLA2G16 (International Mouse Phenotyping Consortium) |
| PhenomicDB: PLA2G16 | |
| Mutations for PLA2G16 |
| * Under tables are showing count per each tissue to give us broad intuition about tissue specific mutation patterns.You can go to the detailed page for each mutation database's web site. |
| - Statistics for Tissue and Mutation type | Top |
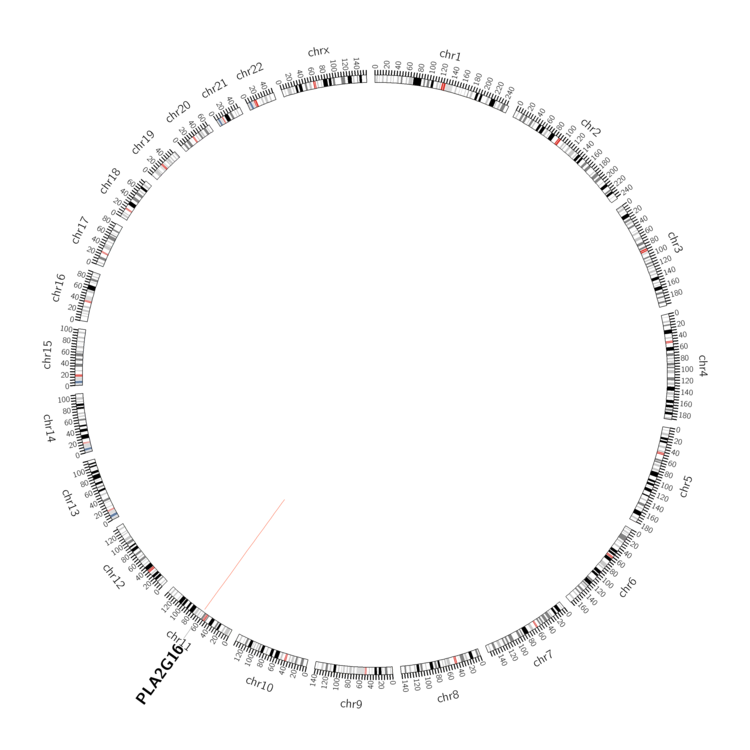 |
| - For Inter-chromosomal Variations |
| There's no inter-chromosomal structural variation. |
| - For Intra-chromosomal Variations |
| * Intra-chromosomal variantions includes 'intrachromosomal amplicon to amplicon', 'intrachromosomal amplicon to non-amplified dna', 'intrachromosomal deletion', 'intrachromosomal fold-back inversion', 'intrachromosomal inversion', 'intrachromosomal tandem duplication', 'Intrachromosomal unknown type', 'intrachromosomal with inverted orientation', 'intrachromosomal with non-inverted orientation'. |
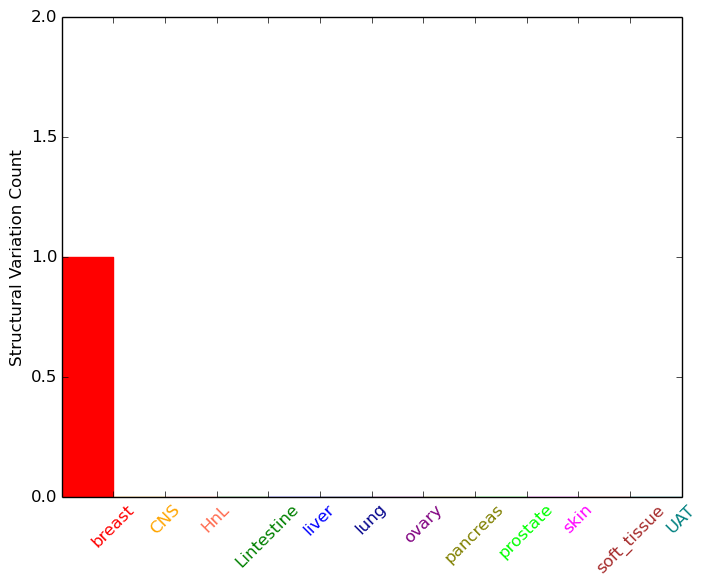 |
| Sample | Symbol_a | Chr_a | Start_a | End_a | Symbol_b | Chr_b | Start_b | End_b |
| breast | PLA2G16 | chr11 | 63350715 | 63350715 | PLA2G16 | chr11 | 63352864 | 63352864 |
| cf) Tissue number; Tissue name (1;Breast, 2;Central_nervous_system, 3;Haematopoietic_and_lymphoid_tissue, 4;Large_intestine, 5;Liver, 6;Lung, 7;Ovary, 8;Pancreas, 9;Prostate, 10;Skin, 11;Soft_tissue, 12;Upper_aerodigestive_tract) |
| * From mRNA Sanger sequences, Chitars2.0 arranged chimeric transcripts. This table shows PLA2G16 related fusion information. |
| ID | Head Gene | Tail Gene | Accession | Gene_a | qStart_a | qEnd_a | Chromosome_a | tStart_a | tEnd_a | Gene_a | qStart_a | qEnd_a | Chromosome_a | tStart_a | tEnd_a |
| BE166188 | PLA2G16 | 1 | 97 | 11 | 63342057 | 63342153 | PLA2G16 | 90 | 471 | 11 | 63342180 | 63342560 | |
| Top |
| Mutation type/ Tissue ID | brca | cns | cerv | endome | haematopo | kidn | Lintest | liver | lung | ns | ovary | pancre | prost | skin | stoma | thyro | urina | |||
| Total # sample | 2 | 1 | ||||||||||||||||||
| GAIN (# sample) | 1 | 1 | ||||||||||||||||||
| LOSS (# sample) | 1 |
| cf) Tissue ID; Tissue type (1; Breast, 2; Central_nervous_system, 3; Cervix, 4; Endometrium, 5; Haematopoietic_and_lymphoid_tissue, 6; Kidney, 7; Large_intestine, 8; Liver, 9; Lung, 10; NS, 11; Ovary, 12; Pancreas, 13; Prostate, 14; Skin, 15; Stomach, 16; Thyroid, 17; Urinary_tract) |
| Top |
|
 |
| Top |
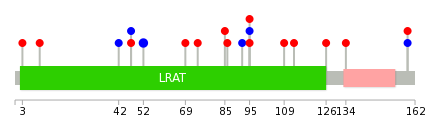
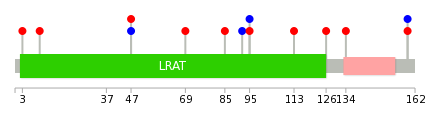
| Stat. for Non-Synonymous SNVs (# total SNVs=8) | (# total SNVs=3) |
 |  |
(# total SNVs=0) | (# total SNVs=0) |
| Top |
| * When you move the cursor on each content, you can see more deailed mutation information on the Tooltip. Those are primary_site,primary_histology,mutation(aa),pubmedID. |
| GRCh37 position | Mutation(aa) | Unique sampleID count |
| chr11:63357803-63357803 | p.S52S | 2 |
| chr11:63357675-63357675 | p.R95Q | 1 |
| chr11:63365622-63365622 | p.P10L | 1 |
| chr11:63357676-63357676 | p.R95W | 1 |
| chr11:63381479-63381479 | p.A3V | 1 |
| chr11:63357683-63357683 | p.I92I | 1 |
| chr11:63357702-63357702 | p.P86L | 1 |
| chr11:63342429-63342429 | p.R159R | 1 |
| chr11:63357705-63357705 | p.S85L | 1 |
| chr11:63342430-63342430 | p.R159Q | 1 |
| Top |
|
 |
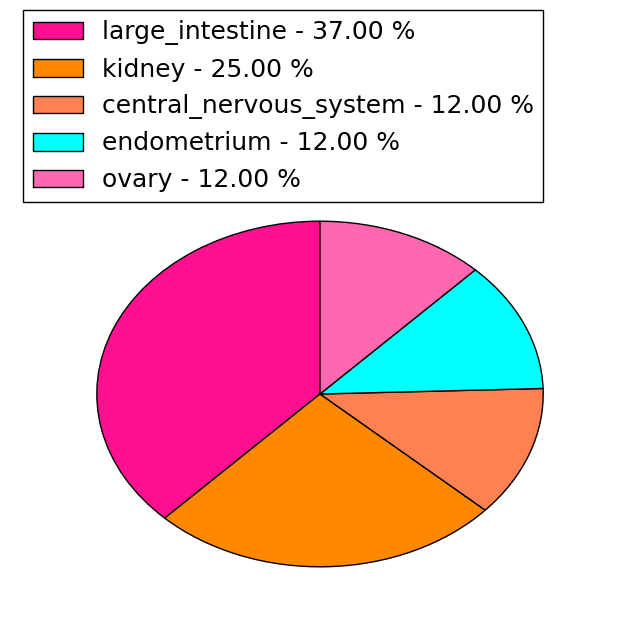
| Point Mutation/ Tissue ID | 1 | 2 | 3 | 4 | 5 | 6 | 7 | 8 | 9 | 10 | 11 | 12 | 13 | 14 | 15 | 16 | 17 | 18 | 19 | 20 |
| # sample | 2 | 1 | 2 | 1 | 1 | 5 | 1 | 1 | ||||||||||||
| # mutation | 2 | 1 | 2 | 1 | 1 | 5 | 1 | 1 | ||||||||||||
| nonsynonymous SNV | 1 | 1 | 2 | 1 | 3 | 1 | 1 | |||||||||||||
| synonymous SNV | 1 | 1 | 2 |
| cf) Tissue ID; Tissue type (1; BLCA[Bladder Urothelial Carcinoma], 2; BRCA[Breast invasive carcinoma], 3; CESC[Cervical squamous cell carcinoma and endocervical adenocarcinoma], 4; COAD[Colon adenocarcinoma], 5; GBM[Glioblastoma multiforme], 6; Glioma Low Grade, 7; HNSC[Head and Neck squamous cell carcinoma], 8; KICH[Kidney Chromophobe], 9; KIRC[Kidney renal clear cell carcinoma], 10; KIRP[Kidney renal papillary cell carcinoma], 11; LAML[Acute Myeloid Leukemia], 12; LUAD[Lung adenocarcinoma], 13; LUSC[Lung squamous cell carcinoma], 14; OV[Ovarian serous cystadenocarcinoma ], 15; PAAD[Pancreatic adenocarcinoma], 16; PRAD[Prostate adenocarcinoma], 17; SKCM[Skin Cutaneous Melanoma], 18:STAD[Stomach adenocarcinoma], 19:THCA[Thyroid carcinoma], 20:UCEC[Uterine Corpus Endometrial Carcinoma]) |
| Top |
| * We represented just top 10 SNVs. When you move the cursor on each content, you can see more deailed mutation information on the Tooltip. Those are primary_site, primary_histology, mutation(aa), pubmedID. |
| Genomic Position | Mutation(aa) | Unique sampleID count |
| chr11:63357683 | p.A47A,PLA2G16 | 1 |
| chr11:63357705 | p.A47T,PLA2G16 | 1 |
| chr11:63357753 | p.P10L,PLA2G16 | 1 |
| chr11:63357818 | p.A3V,PLA2G16 | 1 |
| chr11:63342429 | p.R159R,PLA2G16 | 1 |
| chr11:63357820 | p.R159Q,PLA2G16 | 1 |
| chr11:63342430 | p.I134M,PLA2G16 | 1 |
| chr11:63365622 | p.R126H,PLA2G16 | 1 |
| chr11:63342504 | p.C113F,PLA2G16 | 1 |
| chr11:63381479 | p.R95R,PLA2G16 | 1 |
| * Copy number data were extracted from TCGA using R package TCGA-Assembler. The URLs of all public data files on TCGA DCC data server were gathered on Jan-05-2015. Function ProcessCNAData in TCGA-Assembler package was used to obtain gene-level copy number value which is calculated as the average copy number of the genomic region of a gene. |
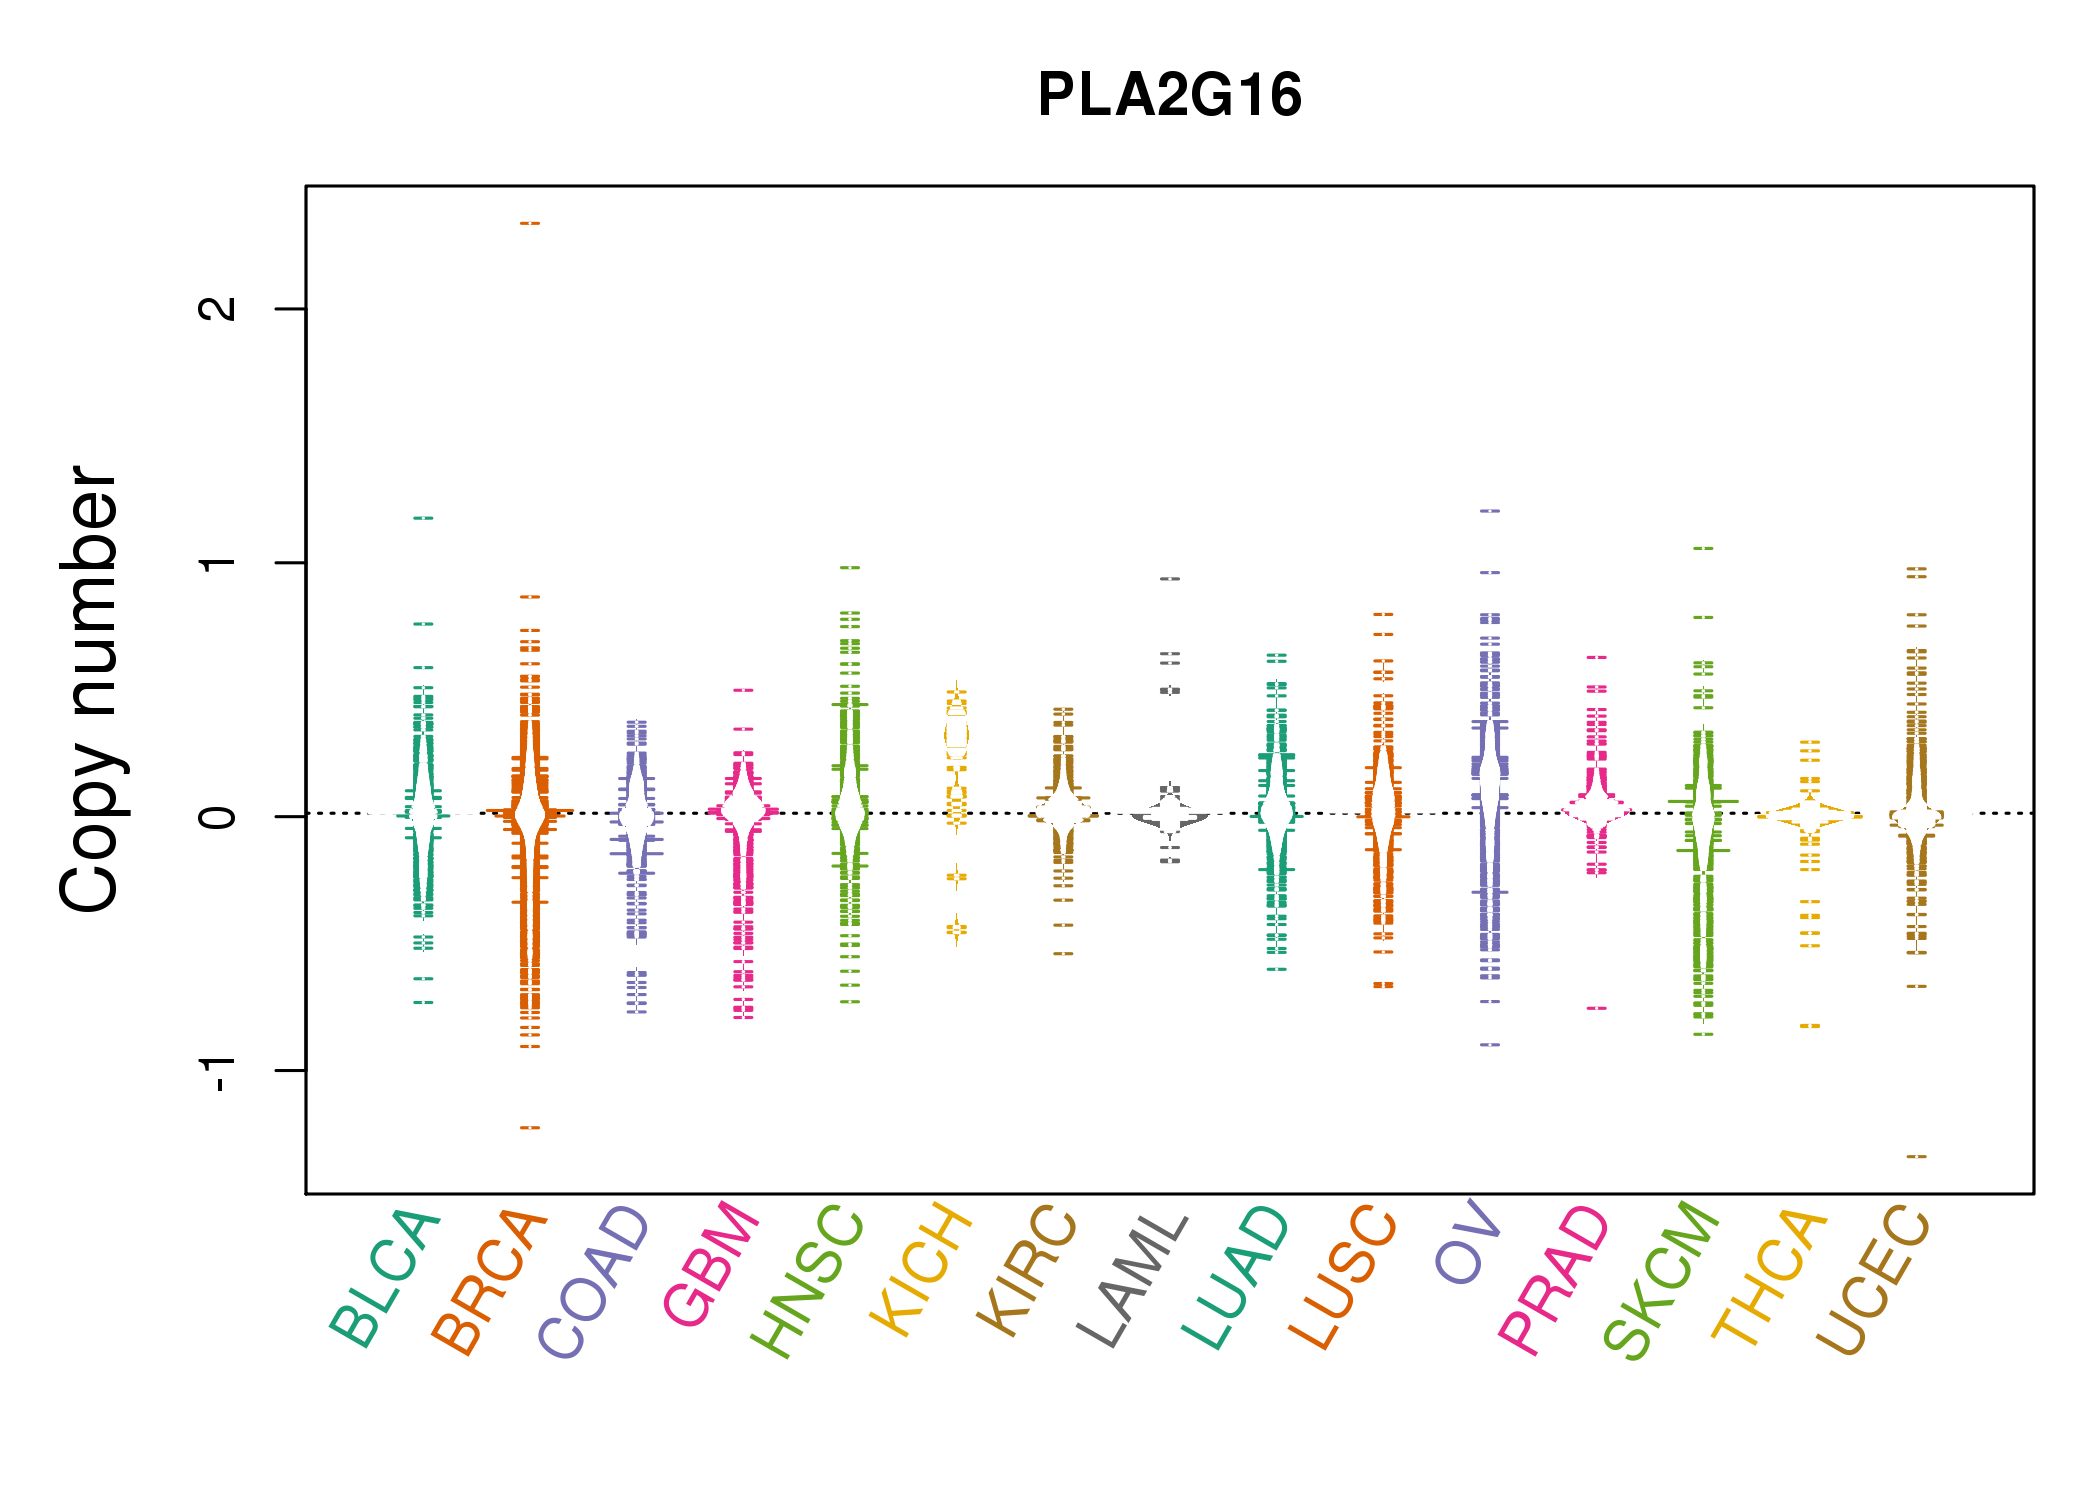 |
| cf) Tissue ID[Tissue type]: BLCA[Bladder Urothelial Carcinoma], BRCA[Breast invasive carcinoma], CESC[Cervical squamous cell carcinoma and endocervical adenocarcinoma], COAD[Colon adenocarcinoma], GBM[Glioblastoma multiforme], Glioma Low Grade, HNSC[Head and Neck squamous cell carcinoma], KICH[Kidney Chromophobe], KIRC[Kidney renal clear cell carcinoma], KIRP[Kidney renal papillary cell carcinoma], LAML[Acute Myeloid Leukemia], LUAD[Lung adenocarcinoma], LUSC[Lung squamous cell carcinoma], OV[Ovarian serous cystadenocarcinoma ], PAAD[Pancreatic adenocarcinoma], PRAD[Prostate adenocarcinoma], SKCM[Skin Cutaneous Melanoma], STAD[Stomach adenocarcinoma], THCA[Thyroid carcinoma], UCEC[Uterine Corpus Endometrial Carcinoma] |
| Top |
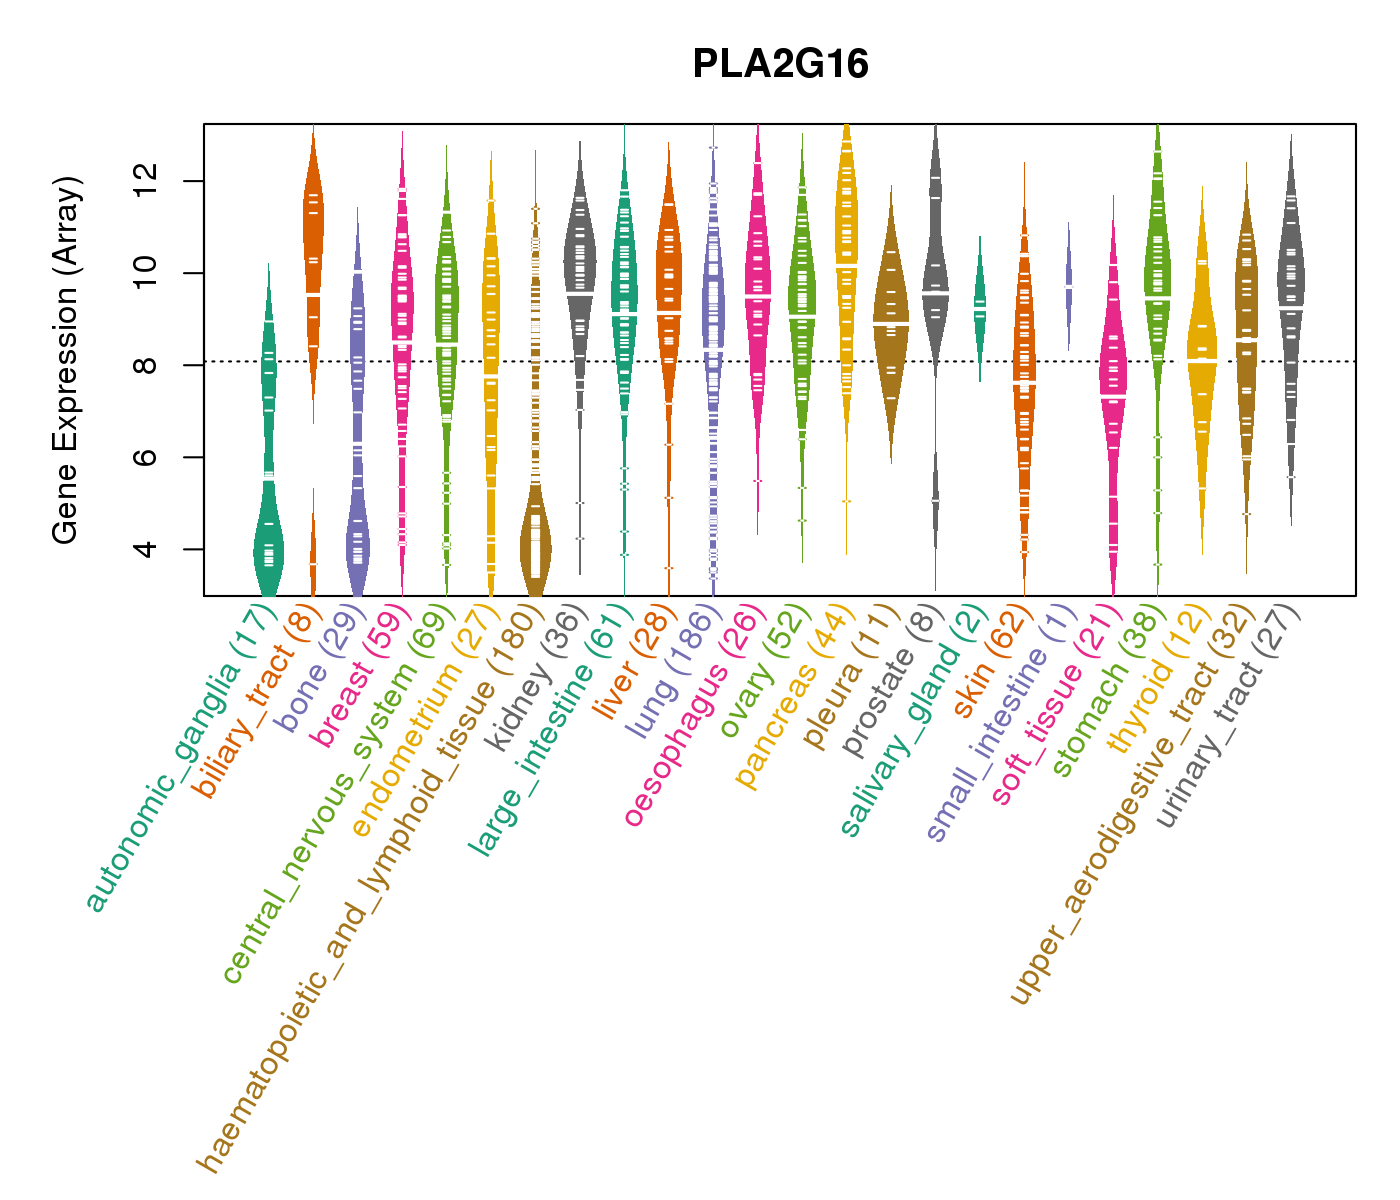
| Gene Expression for PLA2G16 |
| * CCLE gene expression data were extracted from CCLE_Expression_Entrez_2012-10-18.res: Gene-centric RMA-normalized mRNA expression data. |
 |
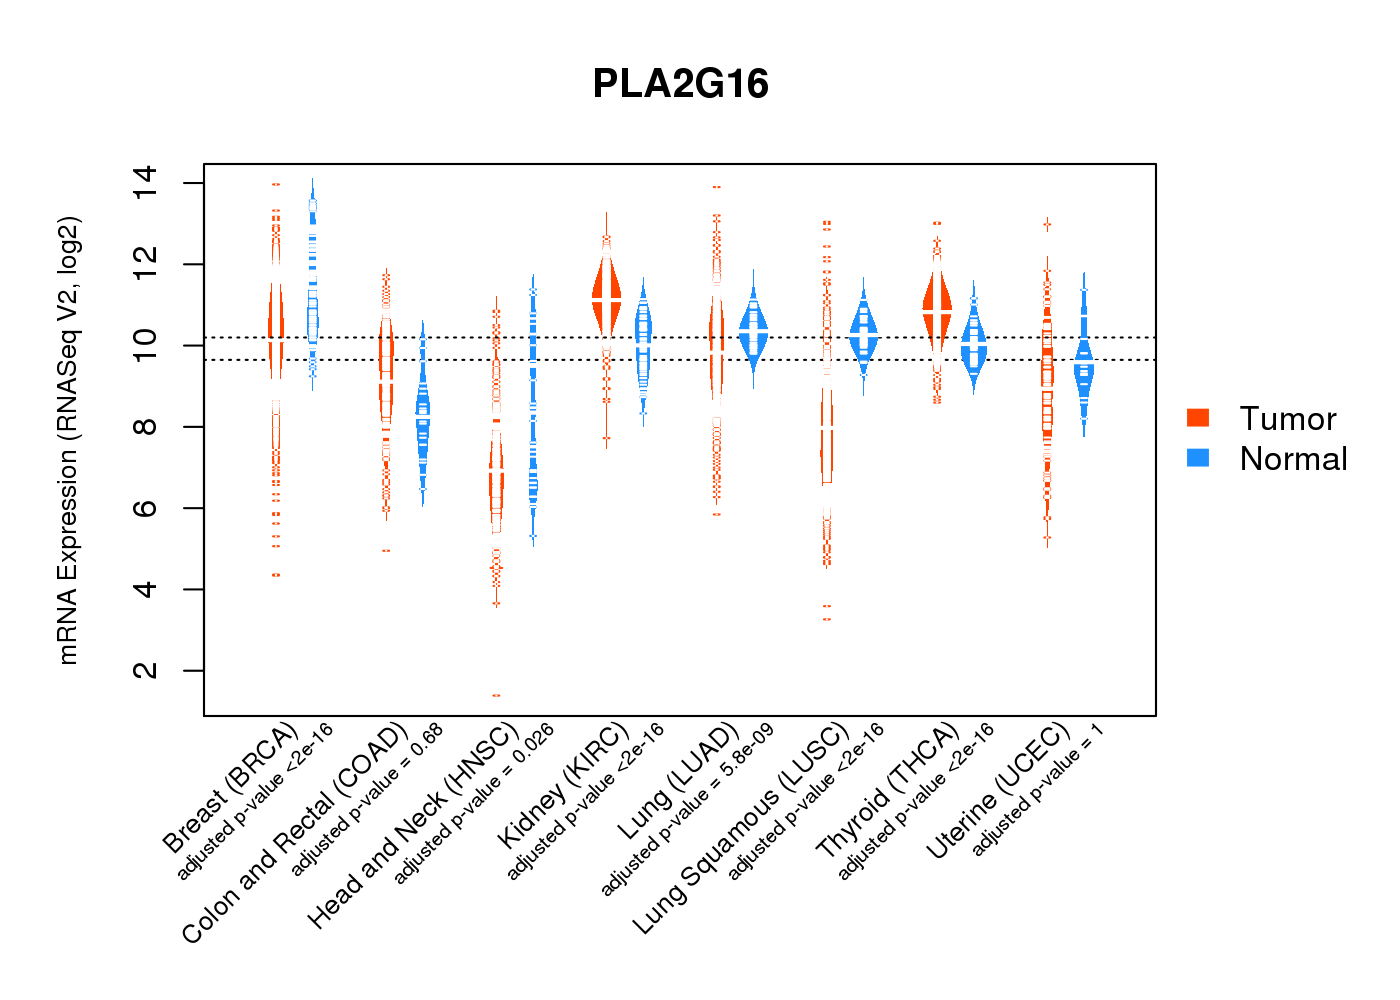
| * Normalized gene expression data of RNASeqV2 was extracted from TCGA using R package TCGA-Assembler. The URLs of all public data files on TCGA DCC data server were gathered at Jan-05-2015. Only eight cancer types have enough normal control samples for differential expression analysis. (t test, adjusted p<0.05 (using Benjamini-Hochberg FDR)) |
 |
| Top |
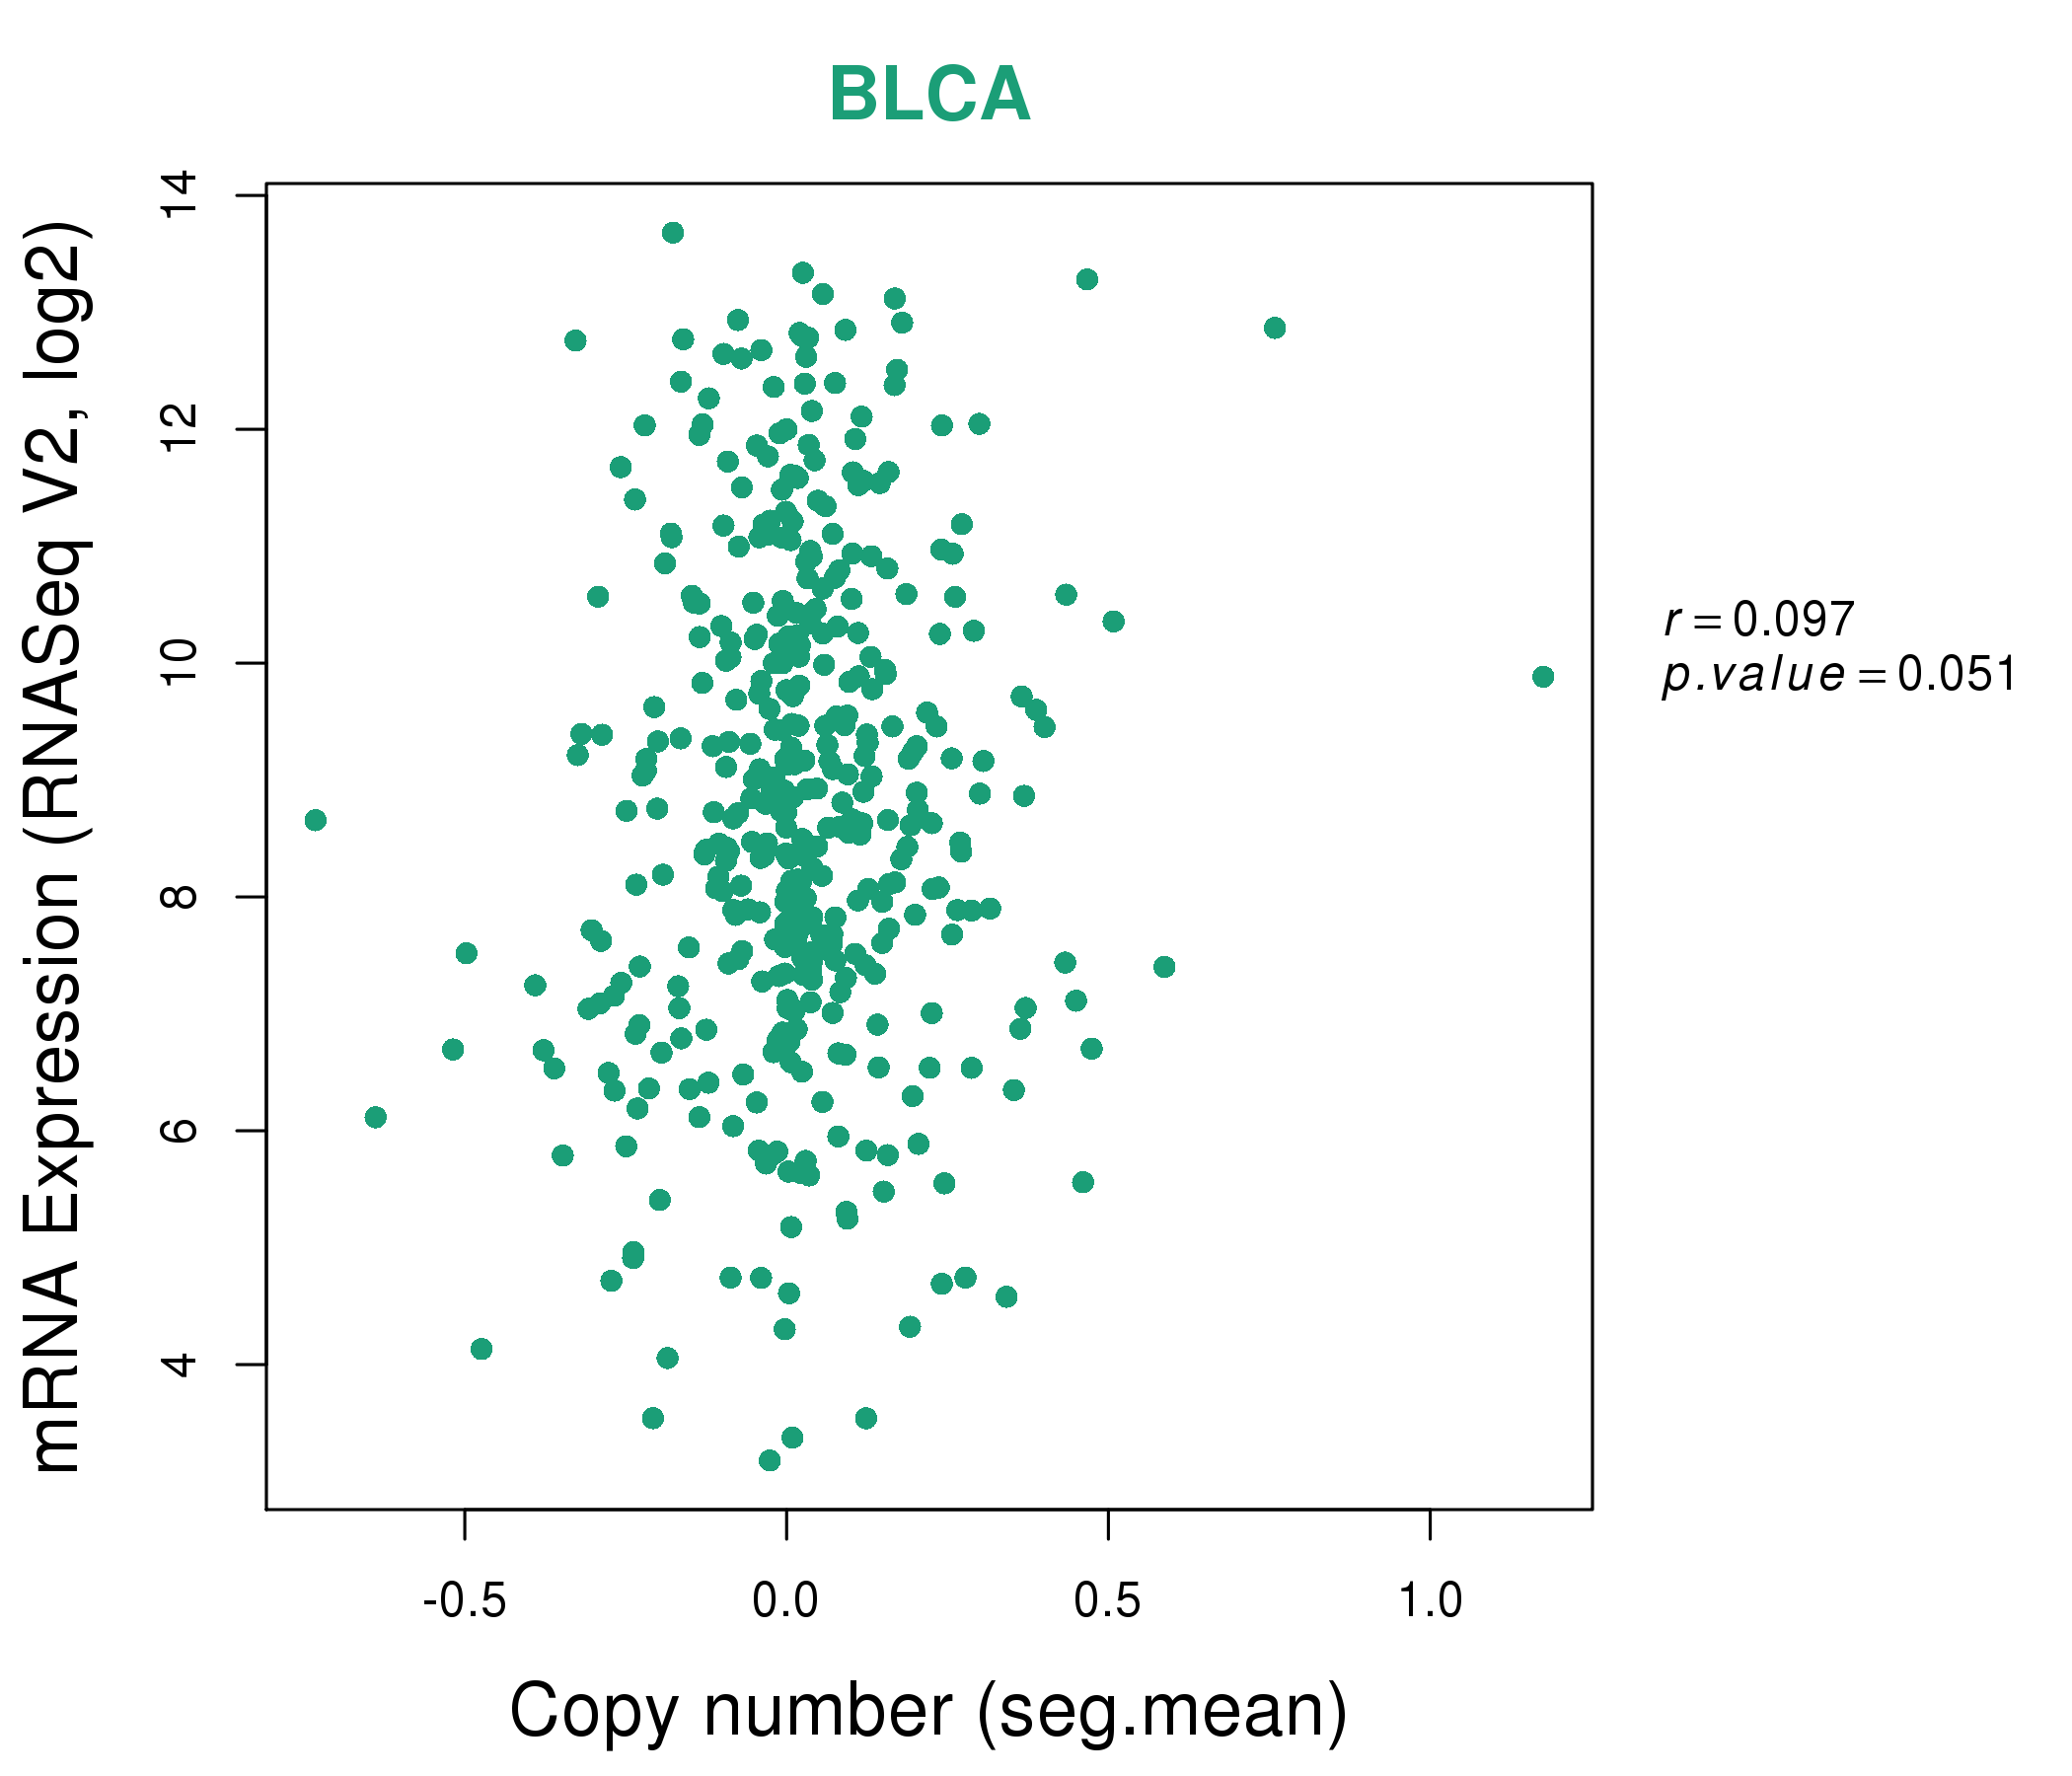
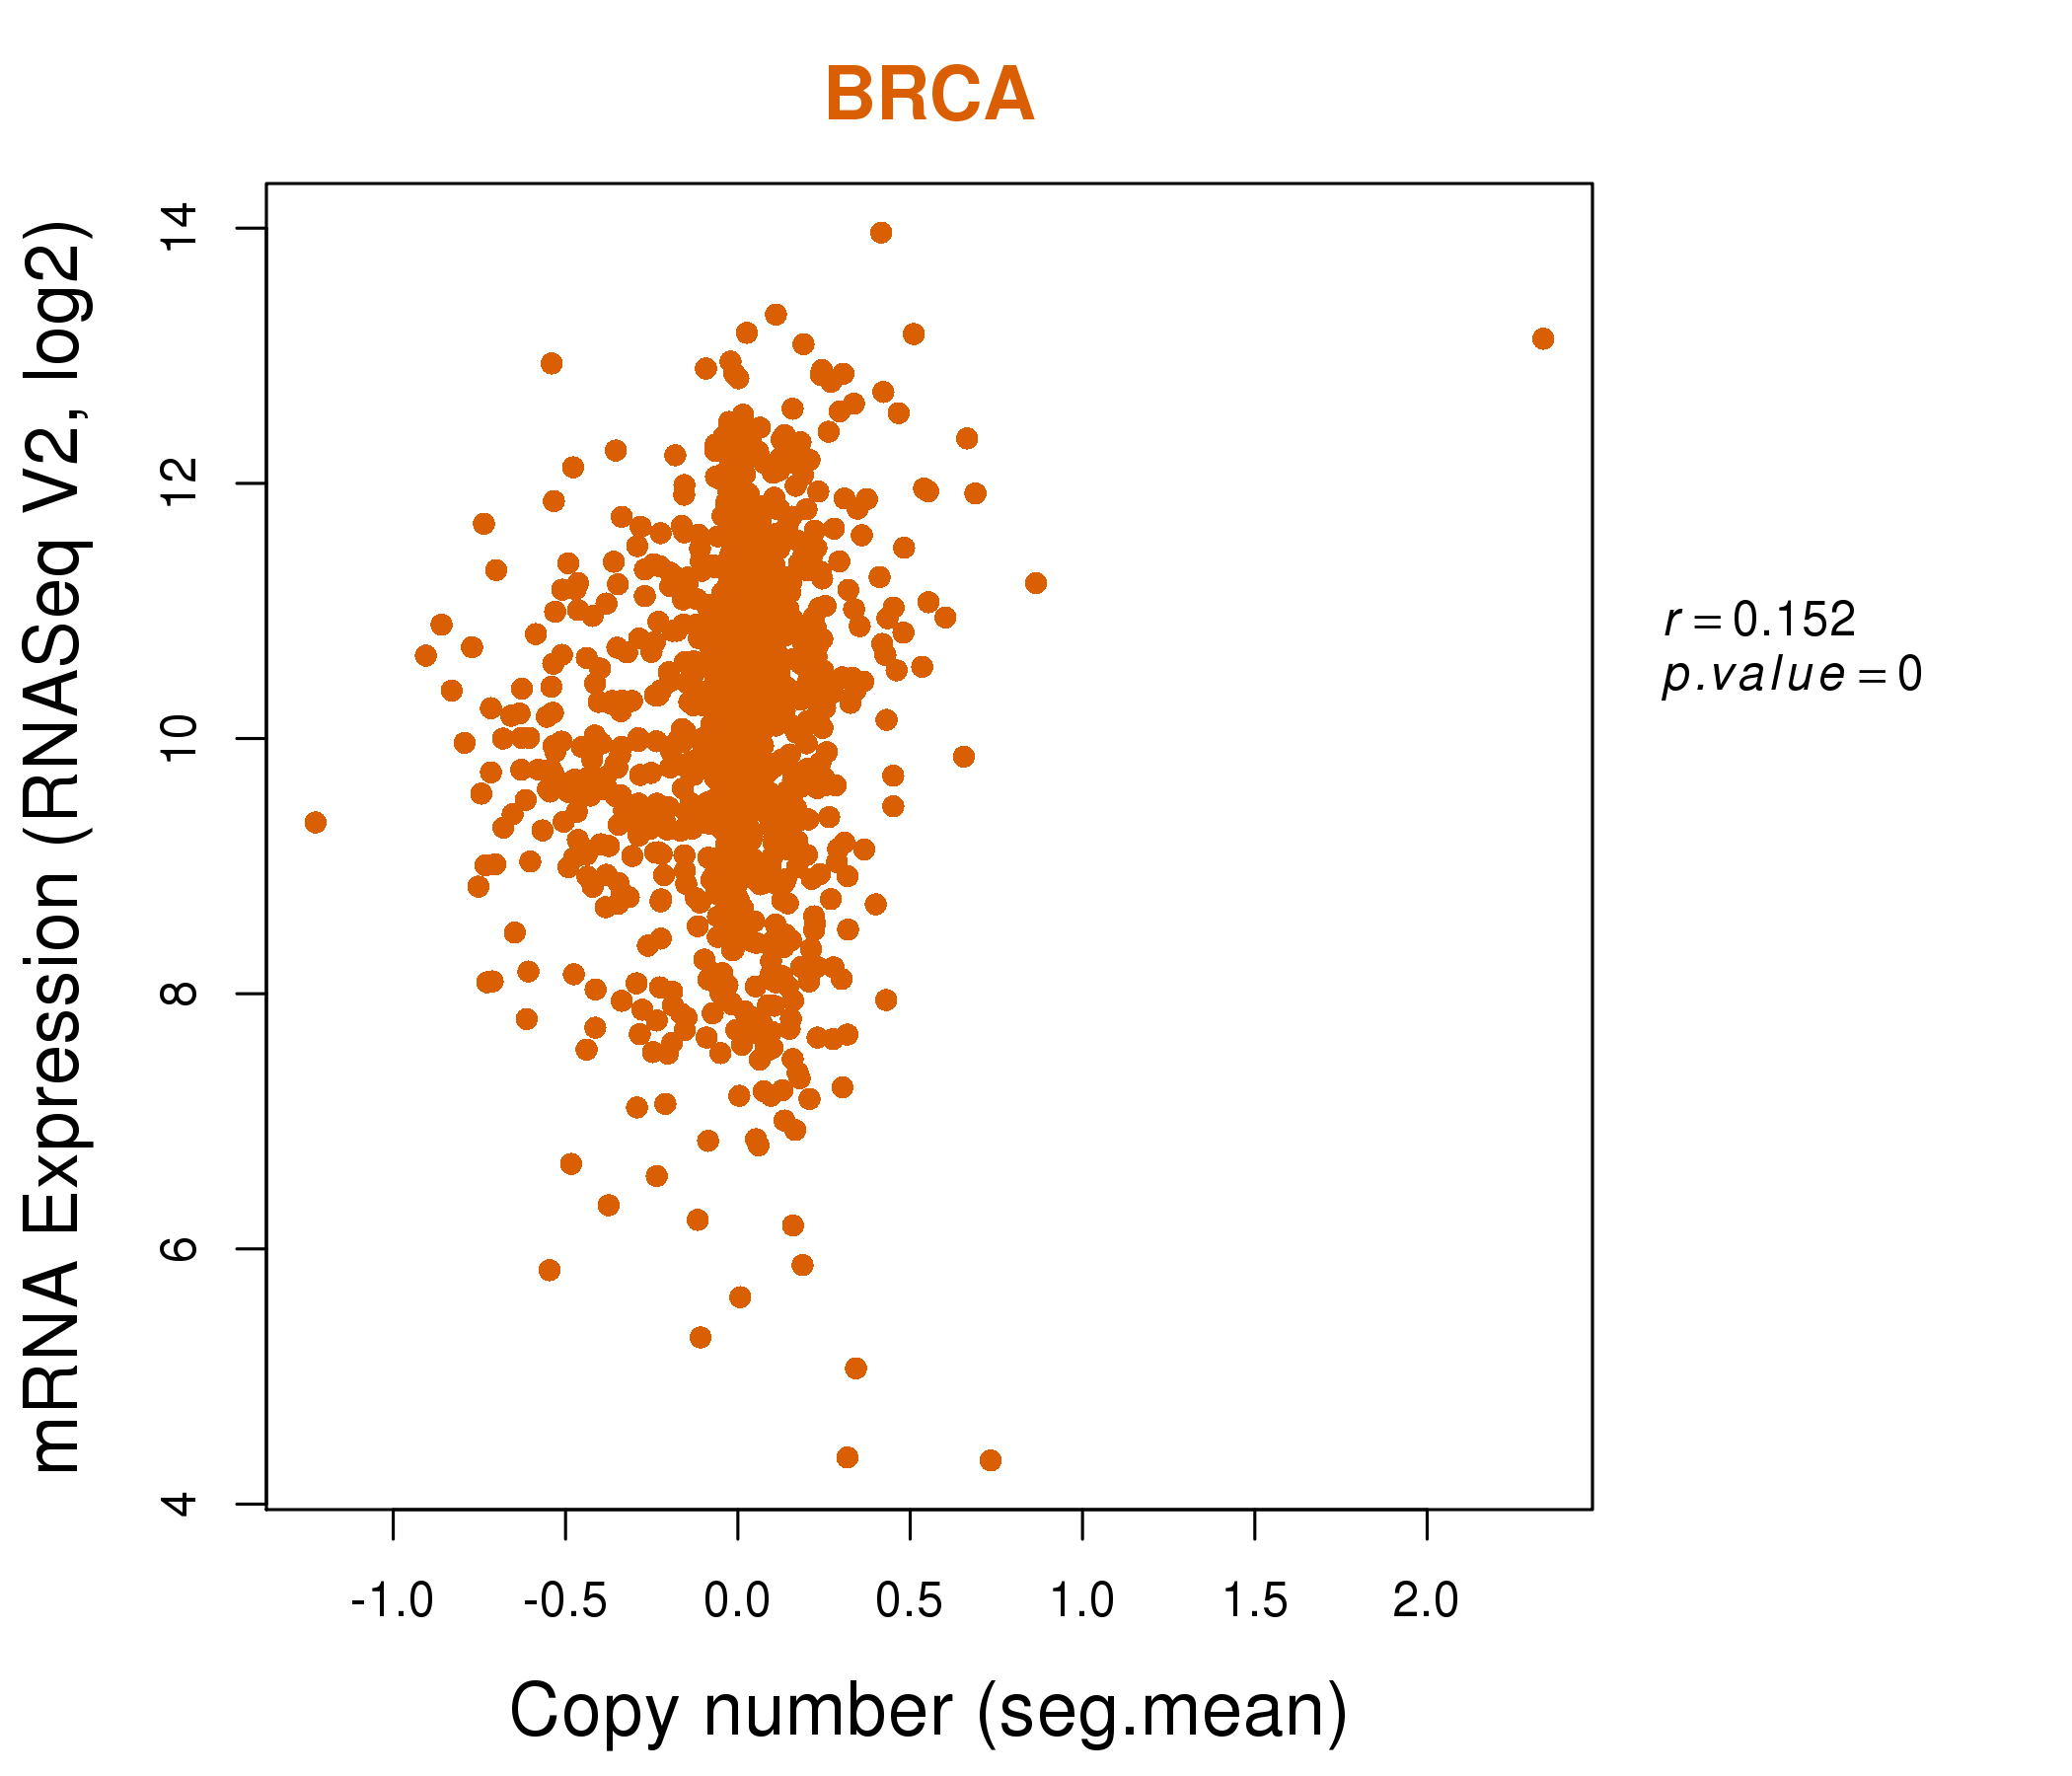
| * This plots show the correlation between CNV and gene expression. |
: Open all plots for all cancer types
 |
|
 |
|

| Top |
| Gene-Gene Network Information |
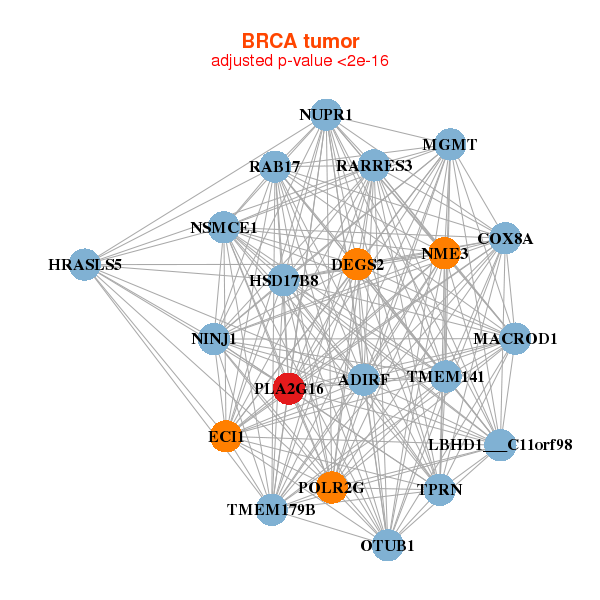
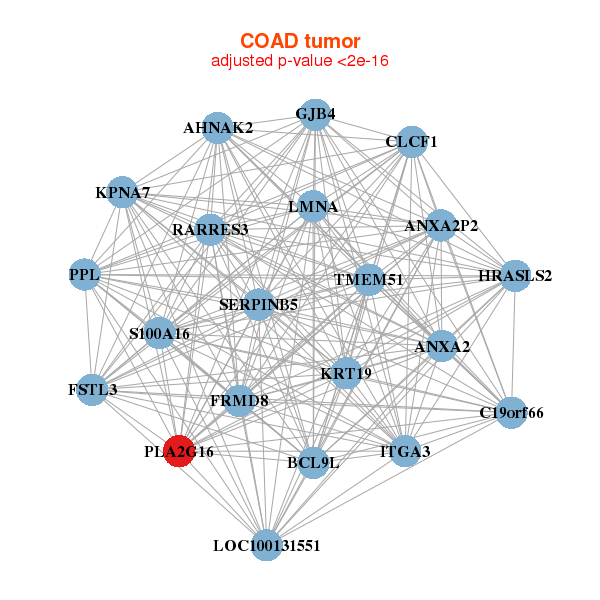
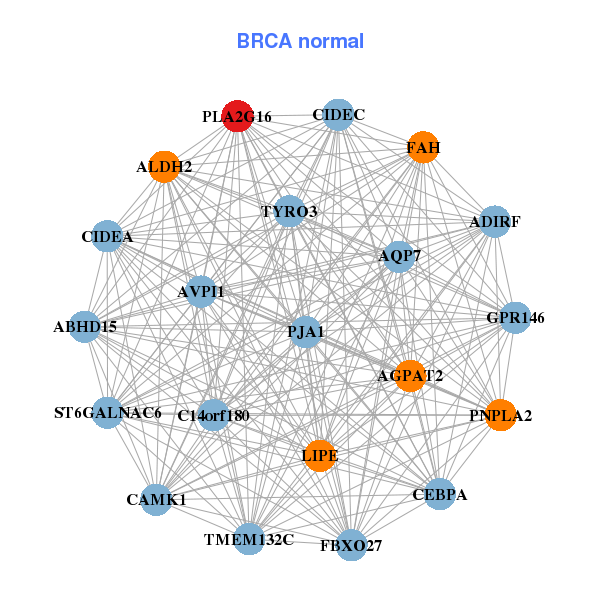
| * Co-Expression network figures were drawn using R package igraph. Only the top 20 genes with the highest correlations were shown. Red circle: input gene, orange circle: cell metabolism gene, sky circle: other gene |
: Open all plots for all cancer types
 |
|
| ADIRF,LBHD1___C11orf98,COX8A,ECI1,DEGS2,HRASLS5,HSD17B8, MACROD1,MGMT,NINJ1,NME3,NSMCE1,NUPR1,OTUB1, PLA2G16,POLR2G,RAB17,RARRES3,TMEM141,TMEM179B,TPRN | ABHD15,AGPAT2,ALDH2,AQP7,AVPI1,ADIRF,C14orf180, CAMK1,CEBPA,CIDEA,CIDEC,FAH,FBXO27,GPR146, LIPE,PJA1,PLA2G16,PNPLA2,ST6GALNAC6,TMEM132C,TYRO3 |
 |
|
| AHNAK2,ANXA2,ANXA2P2,BCL9L,C19orf66,CLCF1,FRMD8, FSTL3,GJB4,HRASLS2,ITGA3,KPNA7,KRT19,LMNA, LOC100131551,PLA2G16,PPL,RARRES3,S100A16,SERPINB5,TMEM51 | APLN,APOL3,BLVRA,C1orf162,CBR3,CDC27,CFB, CFI,DRAM1,FCN1,GABRP,GBP2,GIF,GMPR, GRINA,IFITM3,PLA2G16,SAMHD1,SLFN12,STK3,STOM |
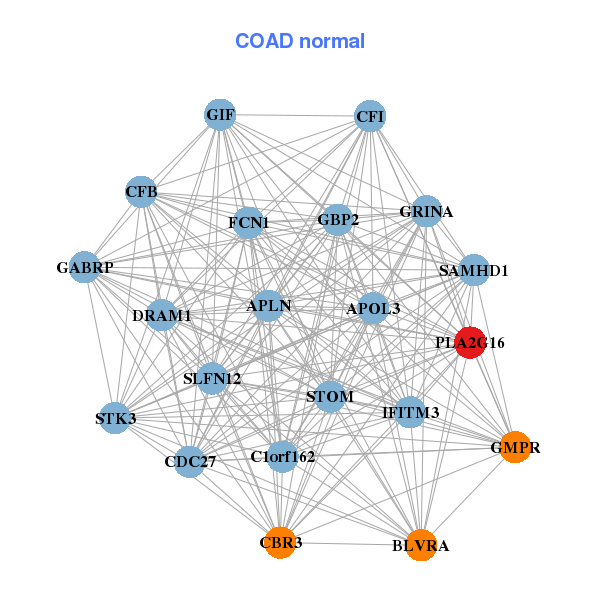
| * Co-Expression network figures were drawn using R package igraph. Only the top 20 genes with the highest correlations were shown. Red circle: input gene, orange circle: cell metabolism gene, sky circle: other gene |
: Open all plots for all cancer types
| Top |
: Open all interacting genes' information including KEGG pathway for all interacting genes from DAVID
| Top |
| Pharmacological Information for PLA2G16 |
| There's no related Drug. |
| Top |
| Cross referenced IDs for PLA2G16 |
| * We obtained these cross-references from Uniprot database. It covers 150 different DBs, 18 categories. http://www.uniprot.org/help/cross_references_section |
: Open all cross reference information
|
Copyright © 2016-Present - The Univsersity of Texas Health Science Center at Houston @ |