|
|||||||||||||||||||||||||||||||||||||||||||||||||||||||||||||||||||||||||||||||||||||||||||||||||||||||||||||||||||||||||||||||||||||||||||||||||||||||||||||||||||||||||||||||||||||||||||||||||||||||||||||||||||||||||||||||||||||||||||||||||||||||||||||||||||||||||||||||||||||||||||||||||||||||||||||||||||||||||||||||||||||||||||||||||||||||||||||||||||||
| |
| Phenotypic Information (metabolism pathway, cancer, disease, phenome) |
| |
| |
| Gene-Gene Network Information: Co-Expression Network, Interacting Genes & KEGG |
| |
|


| Gene Summary for CHIT1 |
| Top |
| Phenotypic Information for CHIT1(metabolism pathway, cancer, disease, phenome) |
| Cancer | CGAP: CHIT1 |
| Familial Cancer Database: CHIT1 | |
| * This gene is included in those cancer gene databases. |
|
|
|
|
|
|
| |||||||||||||||||||||||||||||||||||||||||||||||||||||||||||||||||||||||||||||||||||||||||||||||||||||||||||||||||||||||||||||||||||||||||||||||||||||||||||||||||||||||||||||||||||||||||||||||||||||||||||||||||||||||||||||||||||||||||||||||||||||||||||||||||||||||||||||||||||||||||||||||||||||||||||||||||||||||||||||||||||||||||||||||||||||||||||||||
Oncogene 1 | Significant driver gene in | ||||||||||||||||||||||||||||||||||||||||||||||||||||||||||||||||||||||||||||||||||||||||||||||||||||||||||||||||||||||||||||||||||||||||||||||||||||||||||||||||||||||||||||||||||||||||||||||||||||||||||||||||||||||||||||||||||||||||||||||||||||||||||||||||||||||||||||||||||||||||||||||||||||||||||||||||||||||||||||||||||||||||||||||||||||||||||||||||||||
| cf) number; DB name 1 Oncogene; http://nar.oxfordjournals.org/content/35/suppl_1/D721.long, 2 Tumor Suppressor gene; https://bioinfo.uth.edu/TSGene/, 3 Cancer Gene Census; http://www.nature.com/nrc/journal/v4/n3/abs/nrc1299.html, 4 CancerGenes; http://nar.oxfordjournals.org/content/35/suppl_1/D721.long, 5 Network of Cancer Gene; http://ncg.kcl.ac.uk/index.php, 1Therapeutic Vulnerabilities in Cancer; http://cbio.mskcc.org/cancergenomics/statius/ |
| KEGG_AMINO_SUGAR_AND_NUCLEOTIDE_SUGAR_METABOLISM | |
| OMIM | |
| Orphanet | |
| Disease | KEGG Disease: CHIT1 |
| MedGen: CHIT1 (Human Medical Genetics with Condition) | |
| ClinVar: CHIT1 | |
| Phenotype | MGI: CHIT1 (International Mouse Phenotyping Consortium) |
| PhenomicDB: CHIT1 | |
| Mutations for CHIT1 |
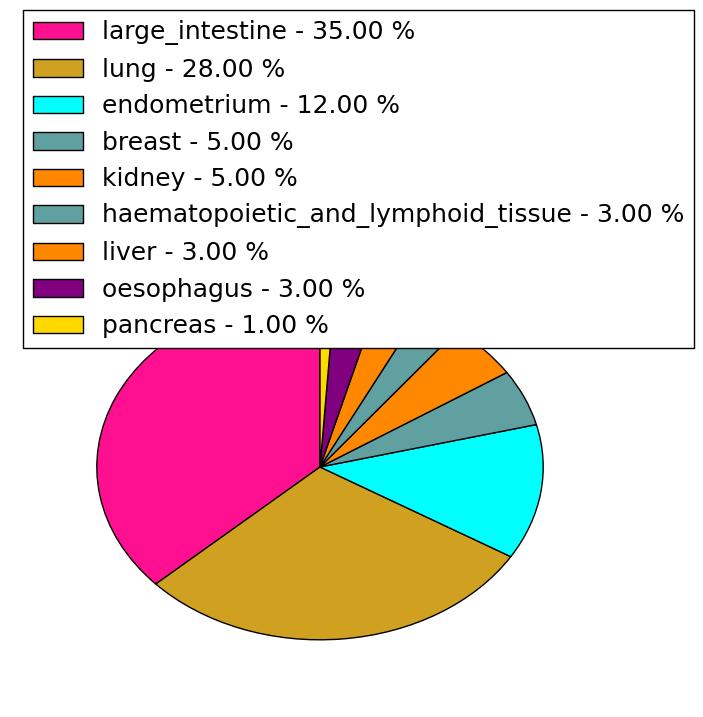
| * Under tables are showing count per each tissue to give us broad intuition about tissue specific mutation patterns.You can go to the detailed page for each mutation database's web site. |
| There's no structural variation information in COSMIC data for this gene. |
| * From mRNA Sanger sequences, Chitars2.0 arranged chimeric transcripts. This table shows CHIT1 related fusion information. |
| ID | Head Gene | Tail Gene | Accession | Gene_a | qStart_a | qEnd_a | Chromosome_a | tStart_a | tEnd_a | Gene_a | qStart_a | qEnd_a | Chromosome_a | tStart_a | tEnd_a |
| BP305867 | NAA50 | 1 | 413 | 3 | 113442329 | 113465007 | CHIT1 | 414 | 580 | 1 | 203194920 | 203198796 | |
| Top |
| Mutation type/ Tissue ID | brca | cns | cerv | endome | haematopo | kidn | Lintest | liver | lung | ns | ovary | pancre | prost | skin | stoma | thyro | urina | |||
| Total # sample | 1 | |||||||||||||||||||
| GAIN (# sample) | 1 | |||||||||||||||||||
| LOSS (# sample) |
| cf) Tissue ID; Tissue type (1; Breast, 2; Central_nervous_system, 3; Cervix, 4; Endometrium, 5; Haematopoietic_and_lymphoid_tissue, 6; Kidney, 7; Large_intestine, 8; Liver, 9; Lung, 10; NS, 11; Ovary, 12; Pancreas, 13; Prostate, 14; Skin, 15; Stomach, 16; Thyroid, 17; Urinary_tract) |
| Top |
|
 |
| Top |
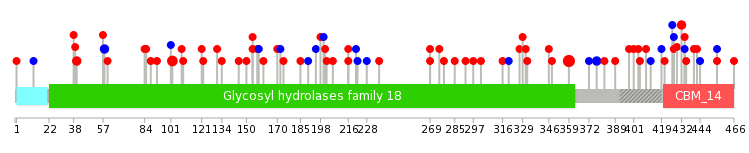
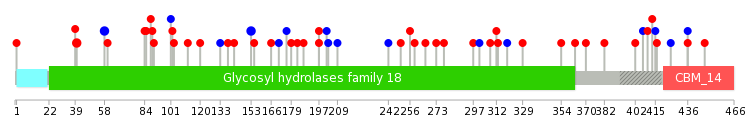
| Stat. for Non-Synonymous SNVs (# total SNVs=56) | (# total SNVs=12) |
 |  |
(# total SNVs=0) | (# total SNVs=1) |
 |
| Top |
| * When you move the cursor on each content, you can see more deailed mutation information on the Tooltip. Those are primary_site,primary_histology,mutation(aa),pubmedID. |
| GRCh37 position | Mutation(aa) | Unique sampleID count |
| chr1:203186947-203186947 | p.A359G | 8 |
| chr1:203186950-203186950 | p.W358* | 5 |
| chr1:203194186-203194186 | p.G102S | 4 |
| chr1:203186950-203186951 | p.V357_W358ins* | 4 |
| chr1:203192738-203192738 | p.S122* | 2 |
| chr1:203194880-203194880 | p.F58F | 2 |
| chr1:203186892-203186892 | p.L377L | 2 |
| chr1:203194936-203194936 | p.R40C | 2 |
| chr1:203188447-203188447 | p.W309* | 2 |
| chr1:203192643-203192643 | p.R154C | 2 |
| Top |
|
 |
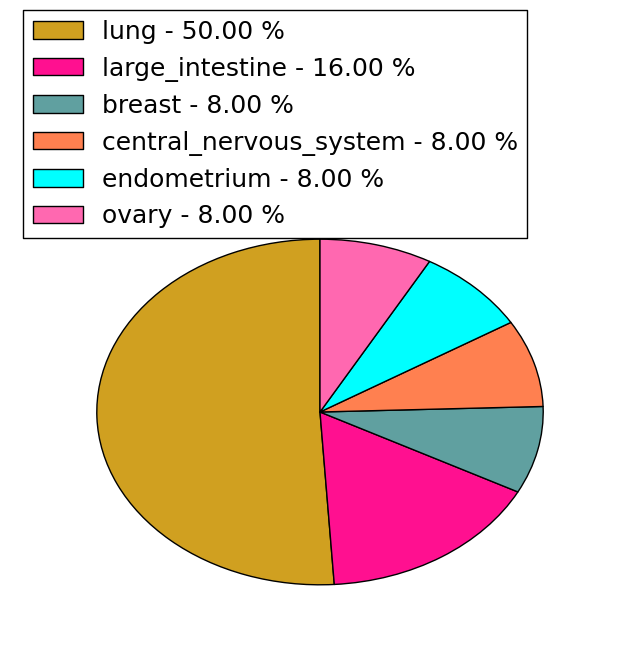
| Point Mutation/ Tissue ID | 1 | 2 | 3 | 4 | 5 | 6 | 7 | 8 | 9 | 10 | 11 | 12 | 13 | 14 | 15 | 16 | 17 | 18 | 19 | 20 |
| # sample | 4 | 8 | 2 | 1 | 3 | 1 | 6 | 7 | 1 | 15 | 4 | 8 | ||||||||
| # mutation | 4 | 8 | 2 | 1 | 3 | 1 | 6 | 7 | 1 | 15 | 4 | 8 | ||||||||
| nonsynonymous SNV | 3 | 6 | 1 | 3 | 1 | 4 | 5 | 11 | 3 | 7 | ||||||||||
| synonymous SNV | 1 | 2 | 1 | 1 | 2 | 2 | 1 | 4 | 1 | 1 |
| cf) Tissue ID; Tissue type (1; BLCA[Bladder Urothelial Carcinoma], 2; BRCA[Breast invasive carcinoma], 3; CESC[Cervical squamous cell carcinoma and endocervical adenocarcinoma], 4; COAD[Colon adenocarcinoma], 5; GBM[Glioblastoma multiforme], 6; Glioma Low Grade, 7; HNSC[Head and Neck squamous cell carcinoma], 8; KICH[Kidney Chromophobe], 9; KIRC[Kidney renal clear cell carcinoma], 10; KIRP[Kidney renal papillary cell carcinoma], 11; LAML[Acute Myeloid Leukemia], 12; LUAD[Lung adenocarcinoma], 13; LUSC[Lung squamous cell carcinoma], 14; OV[Ovarian serous cystadenocarcinoma ], 15; PAAD[Pancreatic adenocarcinoma], 16; PRAD[Prostate adenocarcinoma], 17; SKCM[Skin Cutaneous Melanoma], 18:STAD[Stomach adenocarcinoma], 19:THCA[Thyroid carcinoma], 20:UCEC[Uterine Corpus Endometrial Carcinoma]) |
| Top |
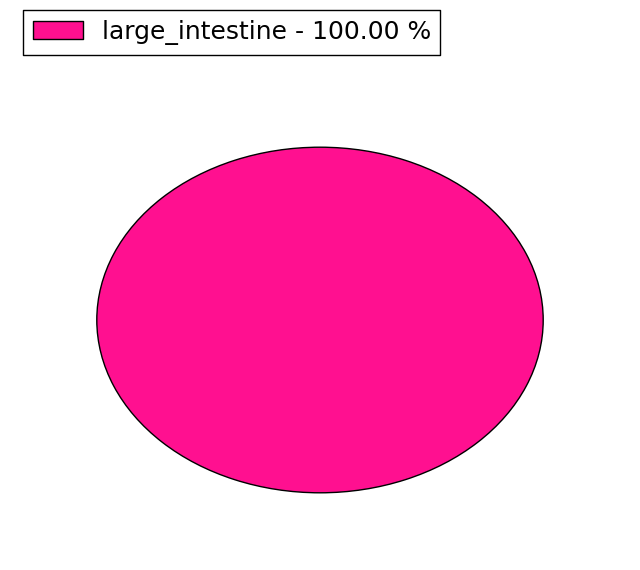
| * We represented just top 10 SNVs. When you move the cursor on each content, you can see more deailed mutation information on the Tooltip. Those are primary_site, primary_histology, mutation(aa), pubmedID. |
| Genomic Position | Mutation(aa) | Unique sampleID count |
| chr1:203194880 | p.F58F,CHIT1 | 2 |
| chr1:203194936 | p.T153T,CHIT1 | 2 |
| chr1:203192352 | p.R40C,CHIT1 | 2 |
| chr1:203191413 | p.G197D,CHIT1 | 1 |
| chr1:203186021 | p.N102I,CHIT1 | 1 |
| chr1:203192647 | p.E319E,CHIT1 | 1 |
| chr1:203186253 | p.V313E,CHIT1 | 1 |
| chr1:203194875 | p.G197C,CHIT1 | 1 |
| chr1:203188832 | p.M90K,CHIT1 | 1 |
| chr1:203191443 | p.N447S,CHIT1 | 1 |
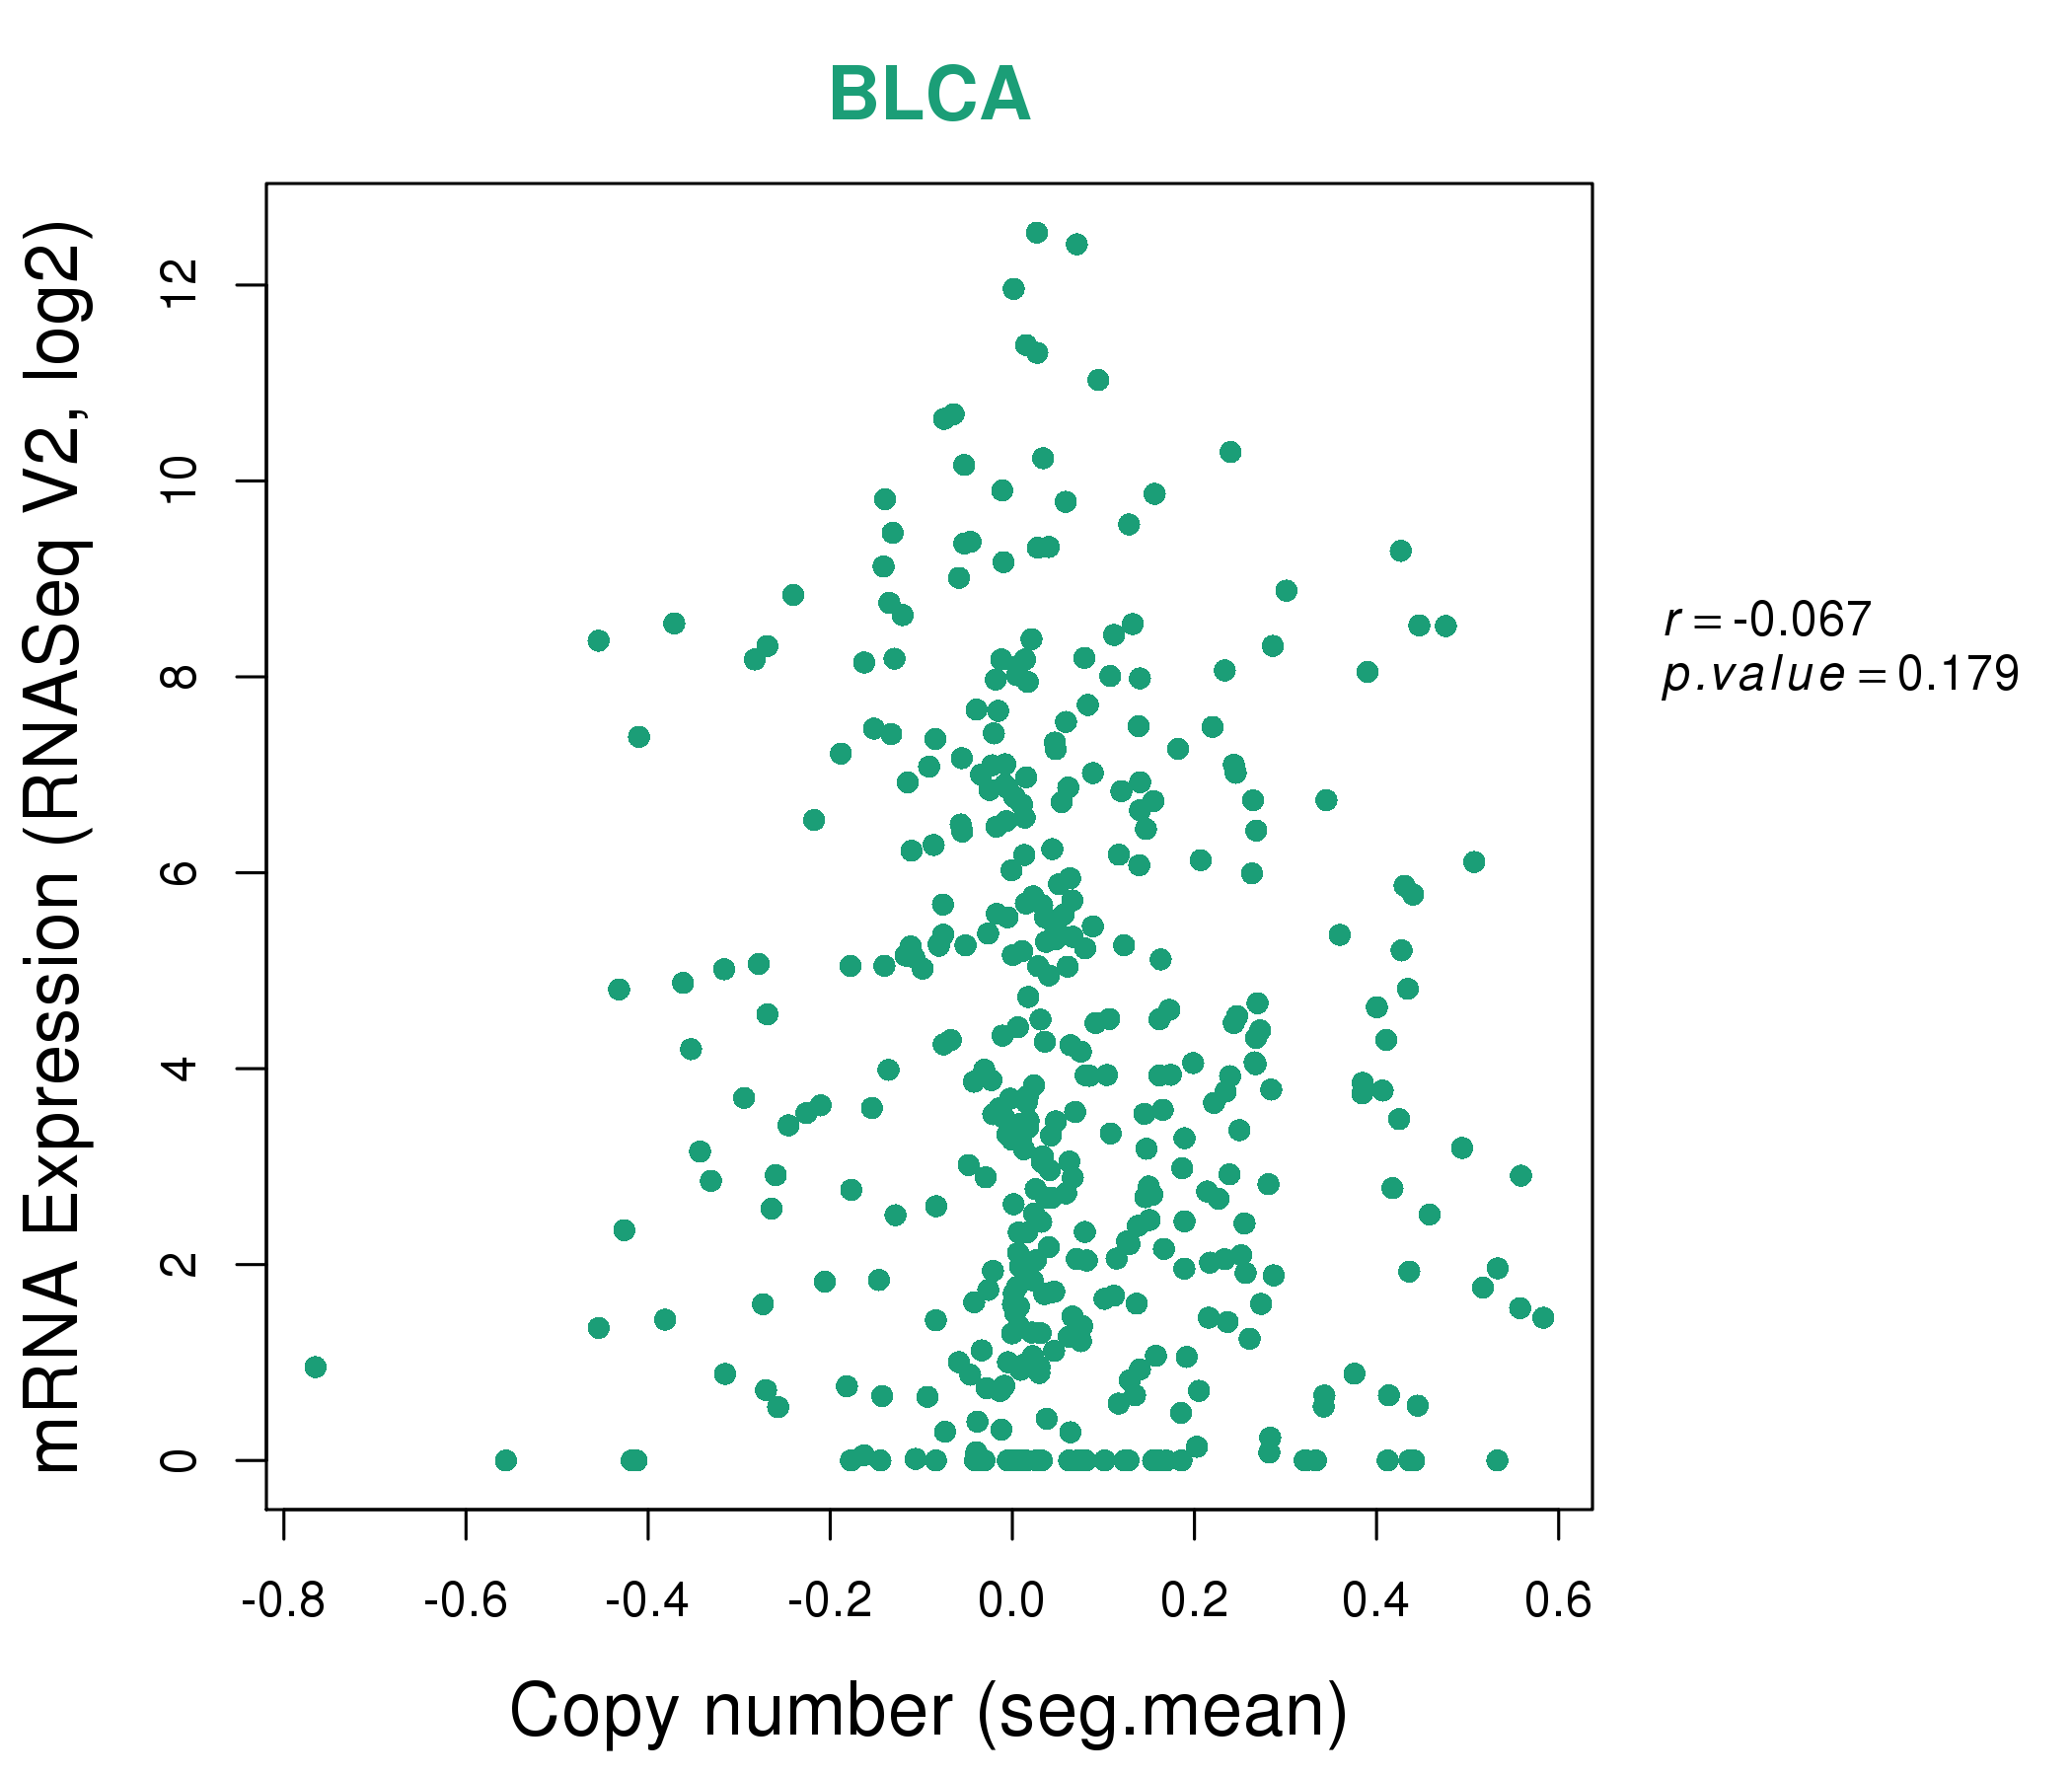
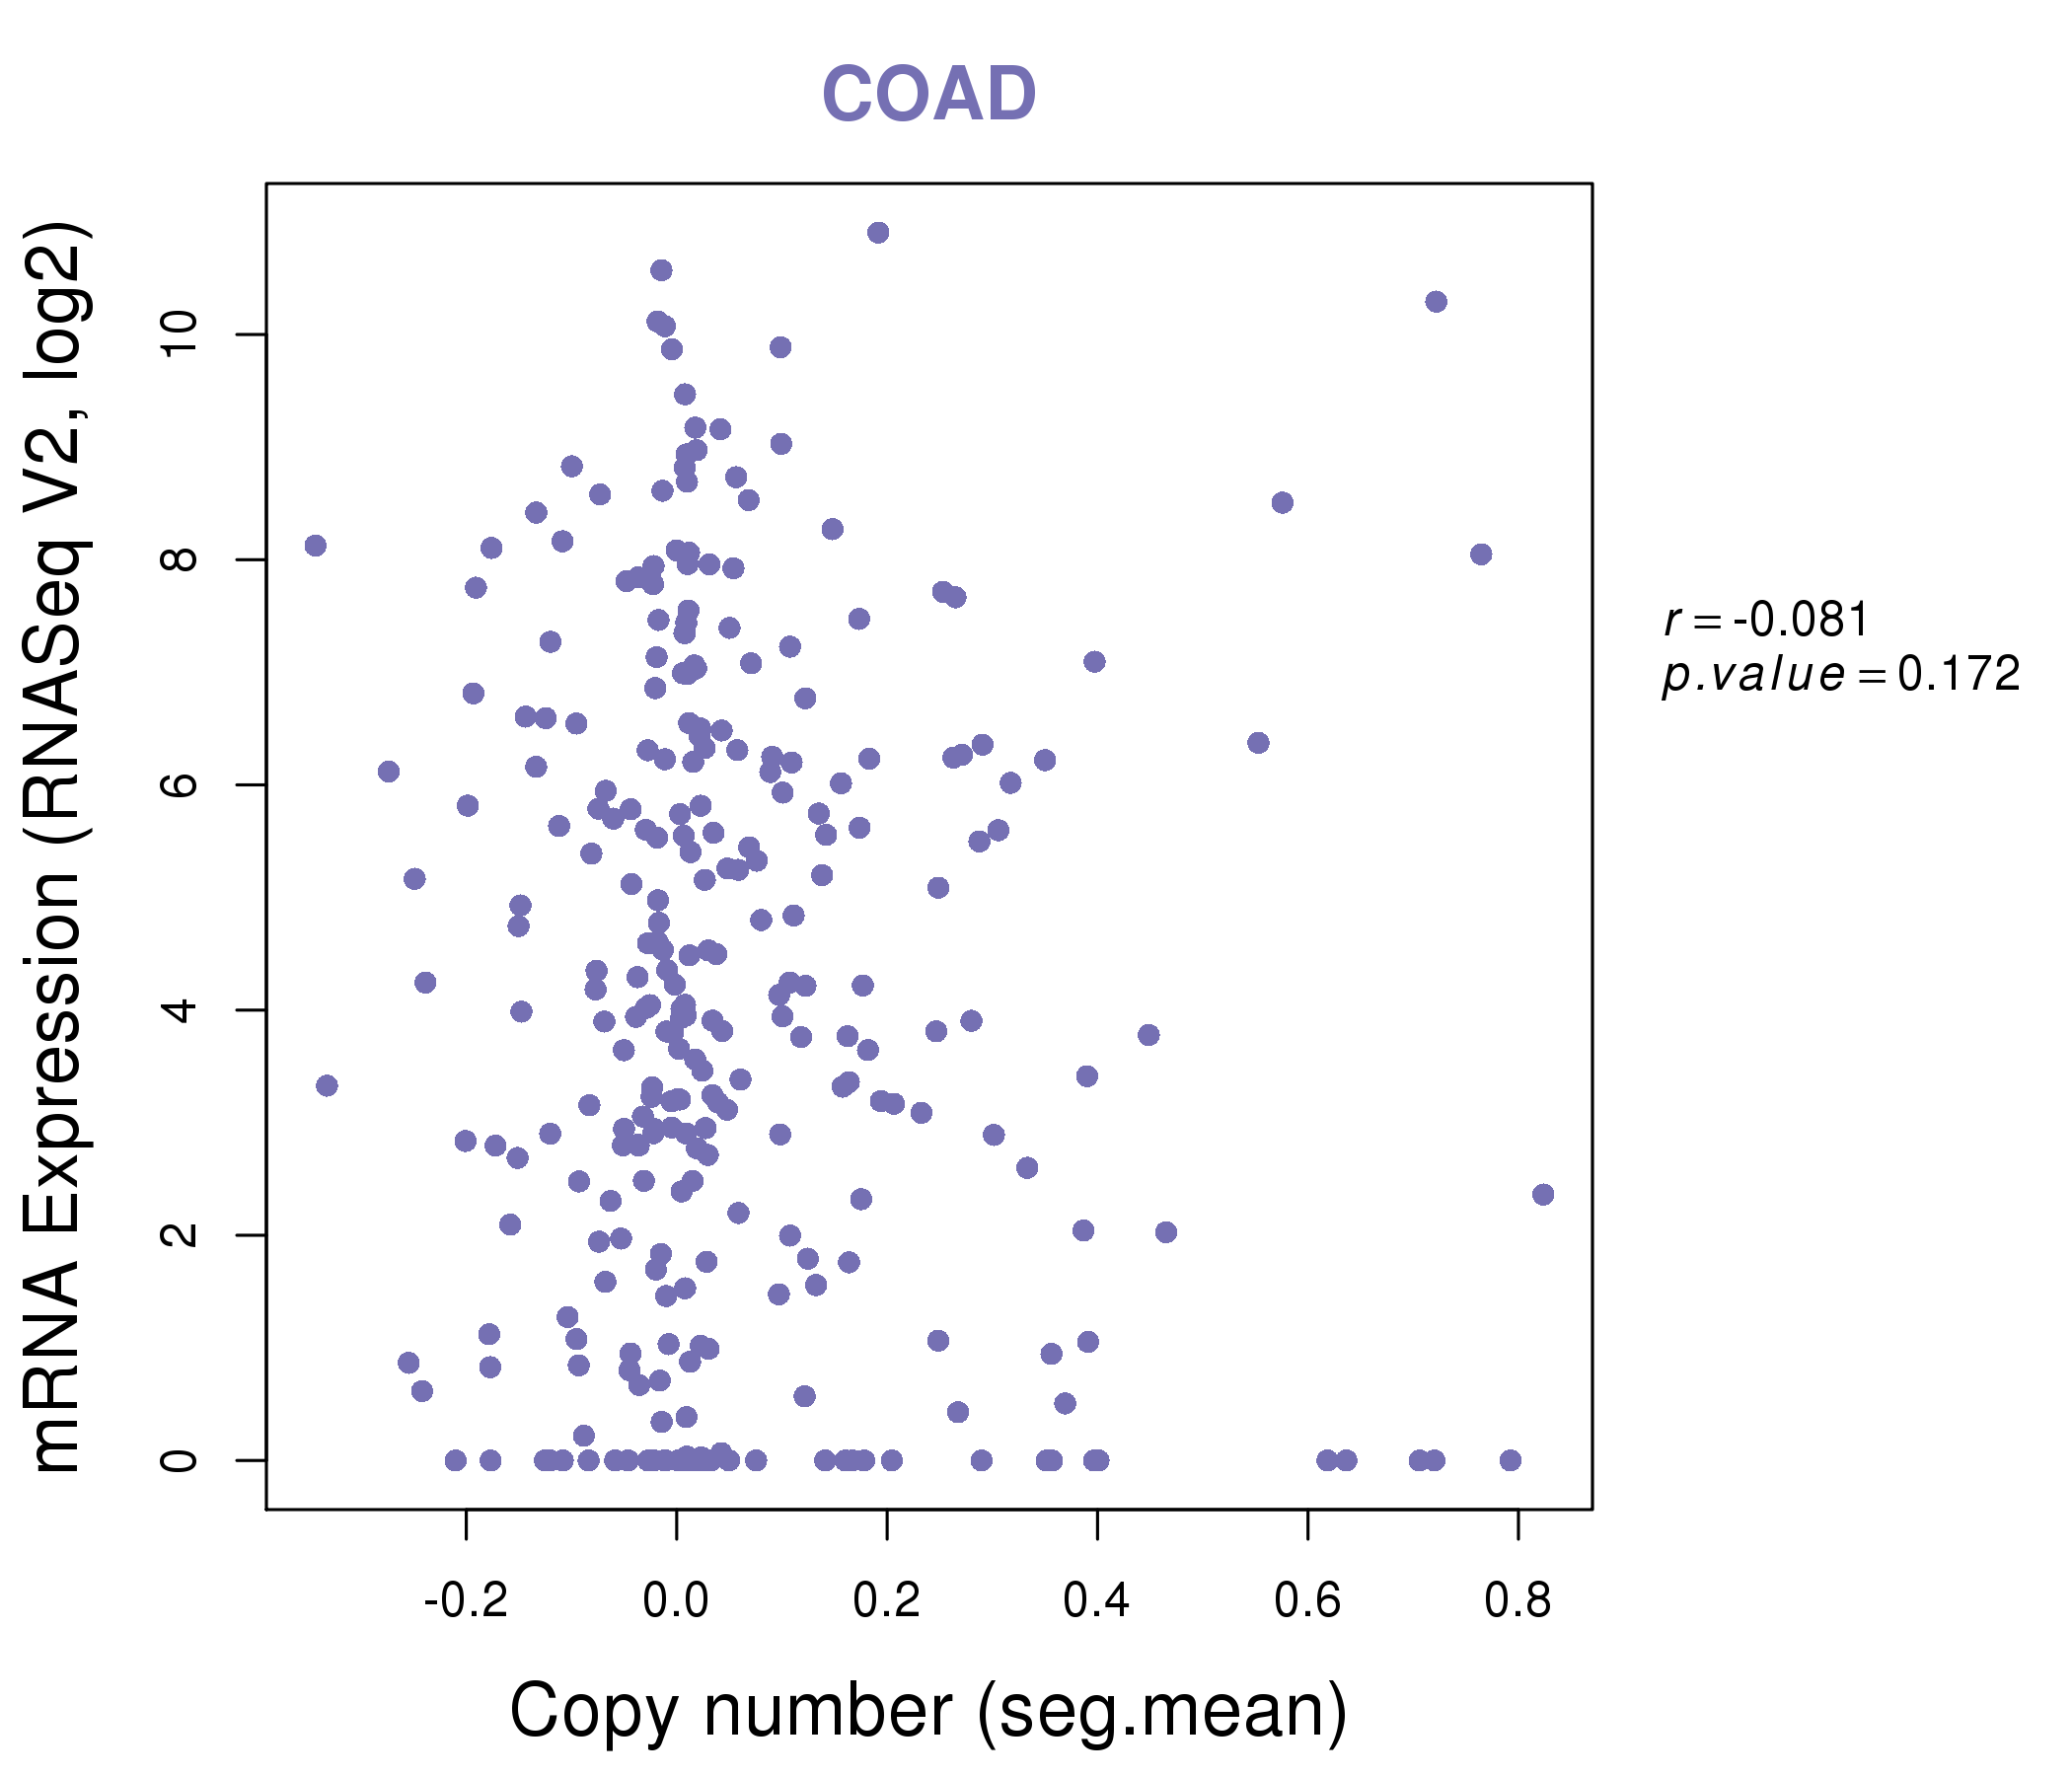
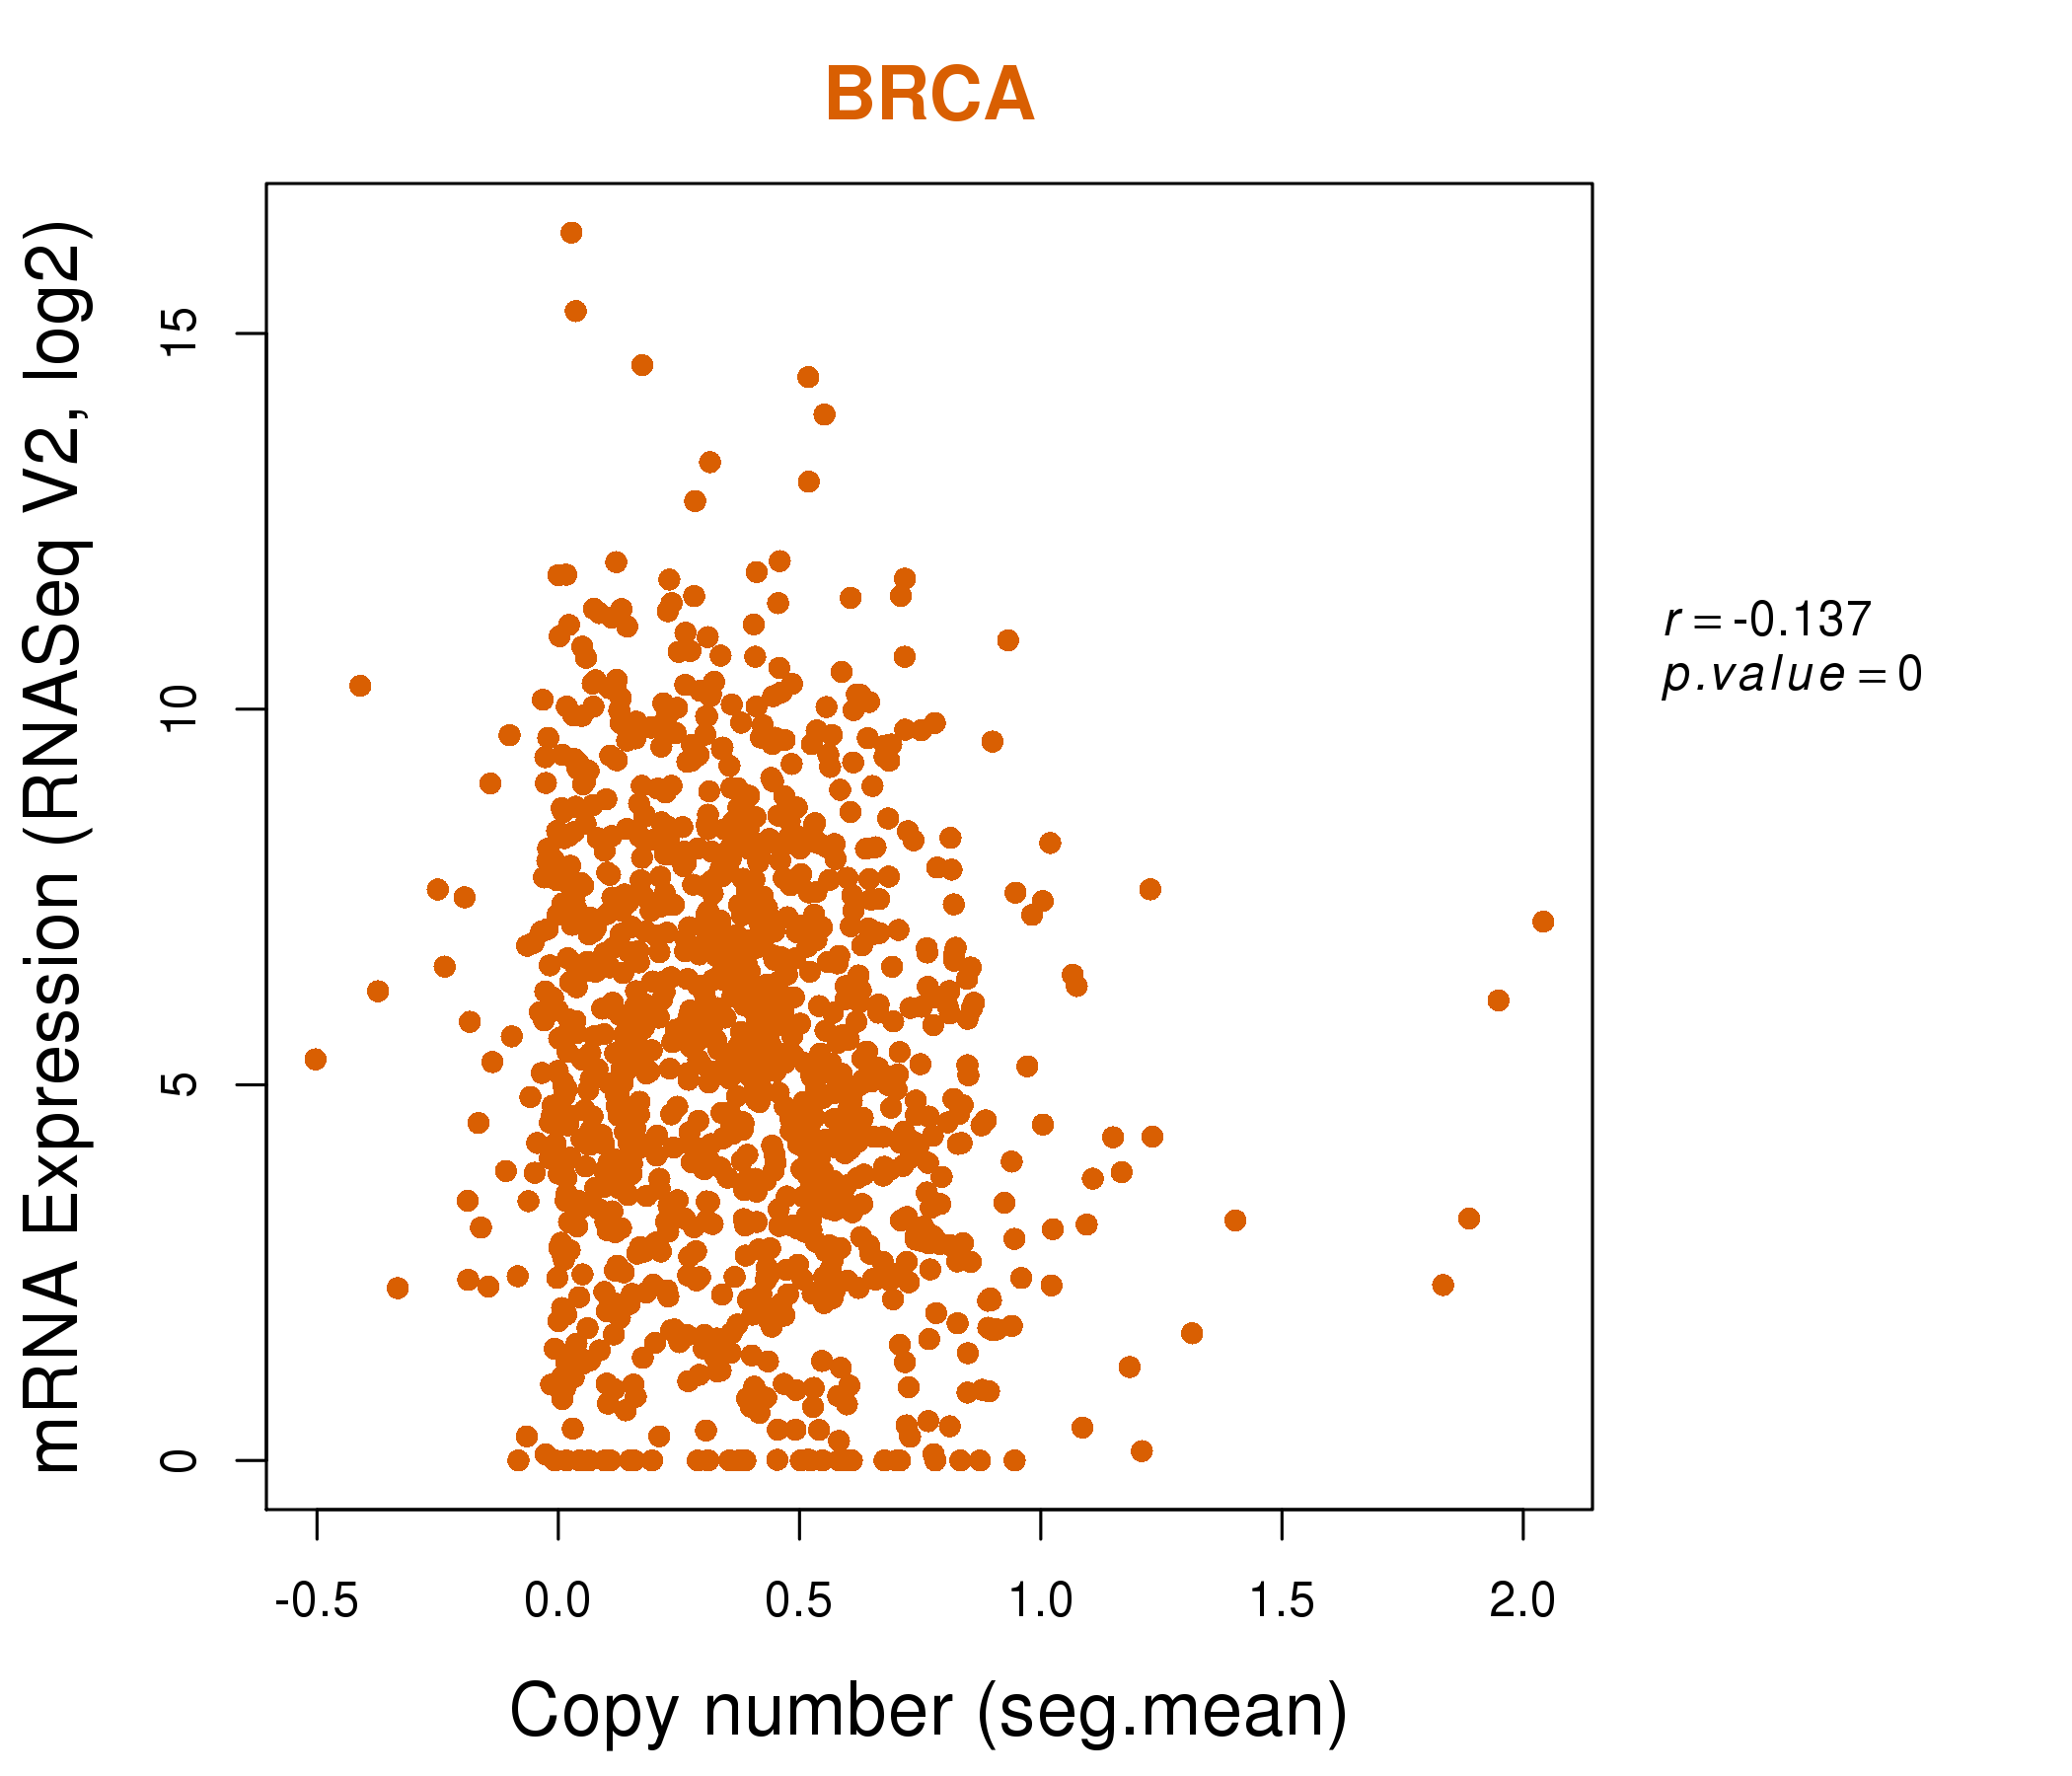
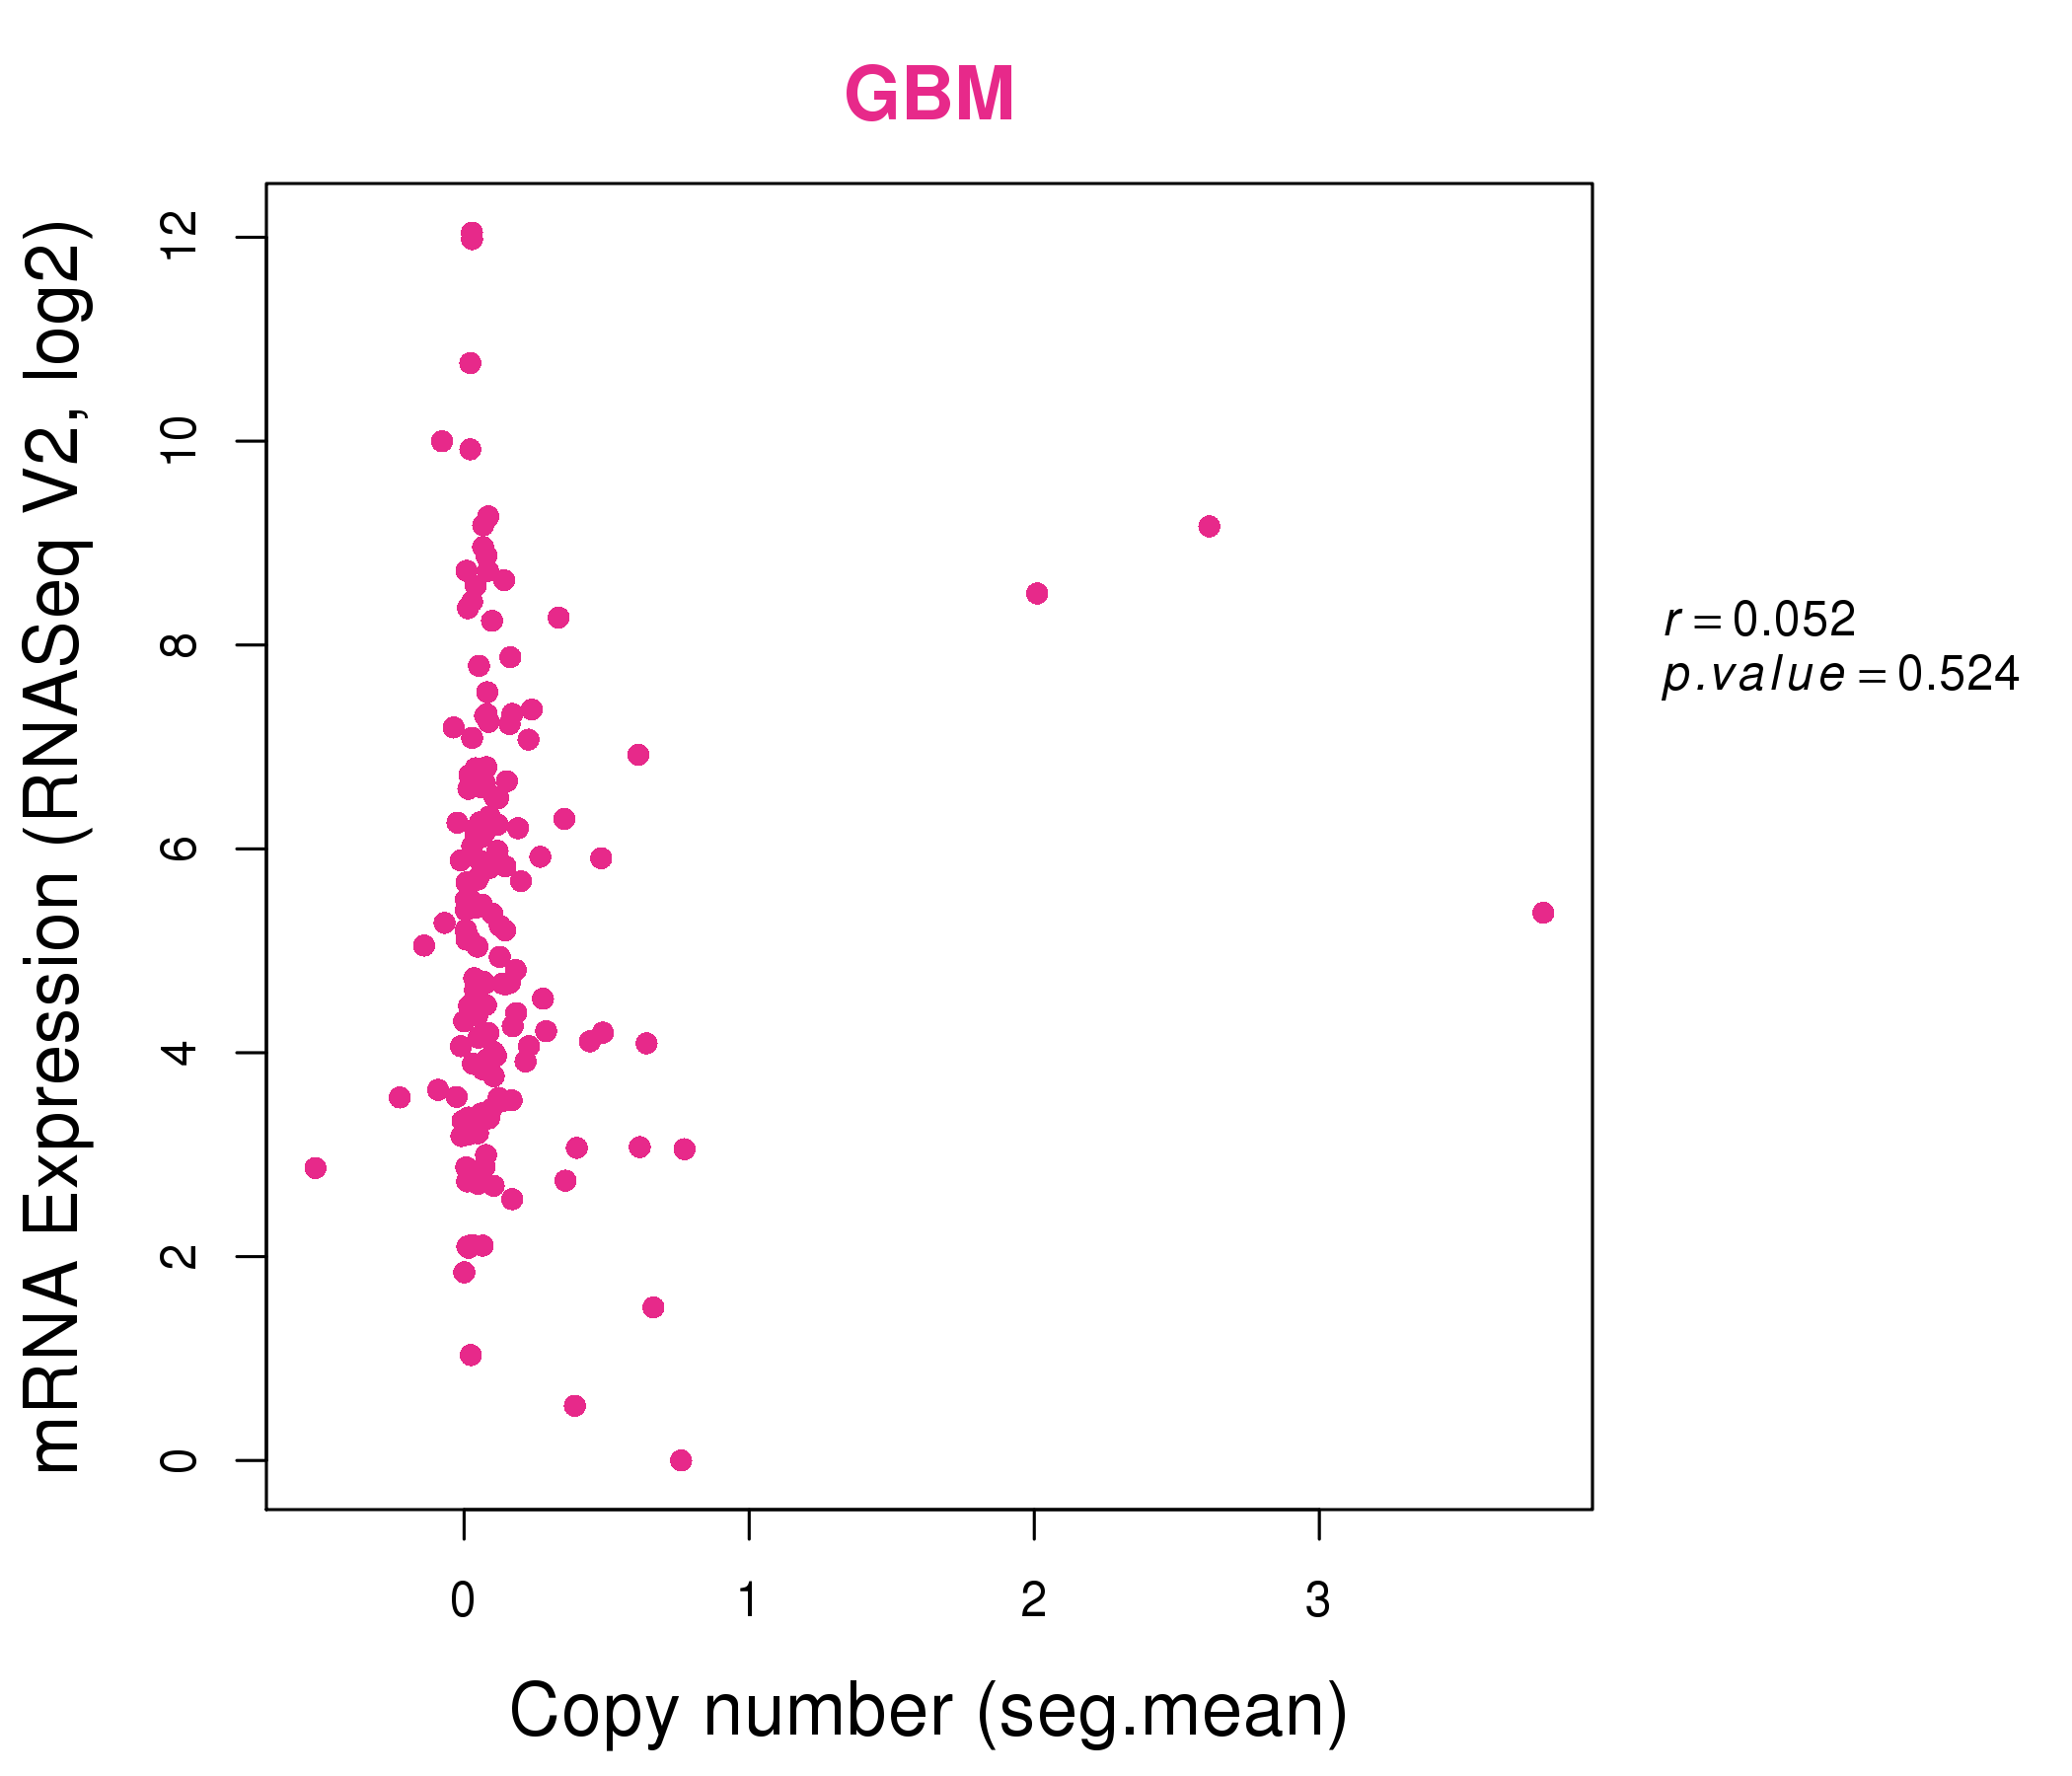
| * Copy number data were extracted from TCGA using R package TCGA-Assembler. The URLs of all public data files on TCGA DCC data server were gathered on Jan-05-2015. Function ProcessCNAData in TCGA-Assembler package was used to obtain gene-level copy number value which is calculated as the average copy number of the genomic region of a gene. |
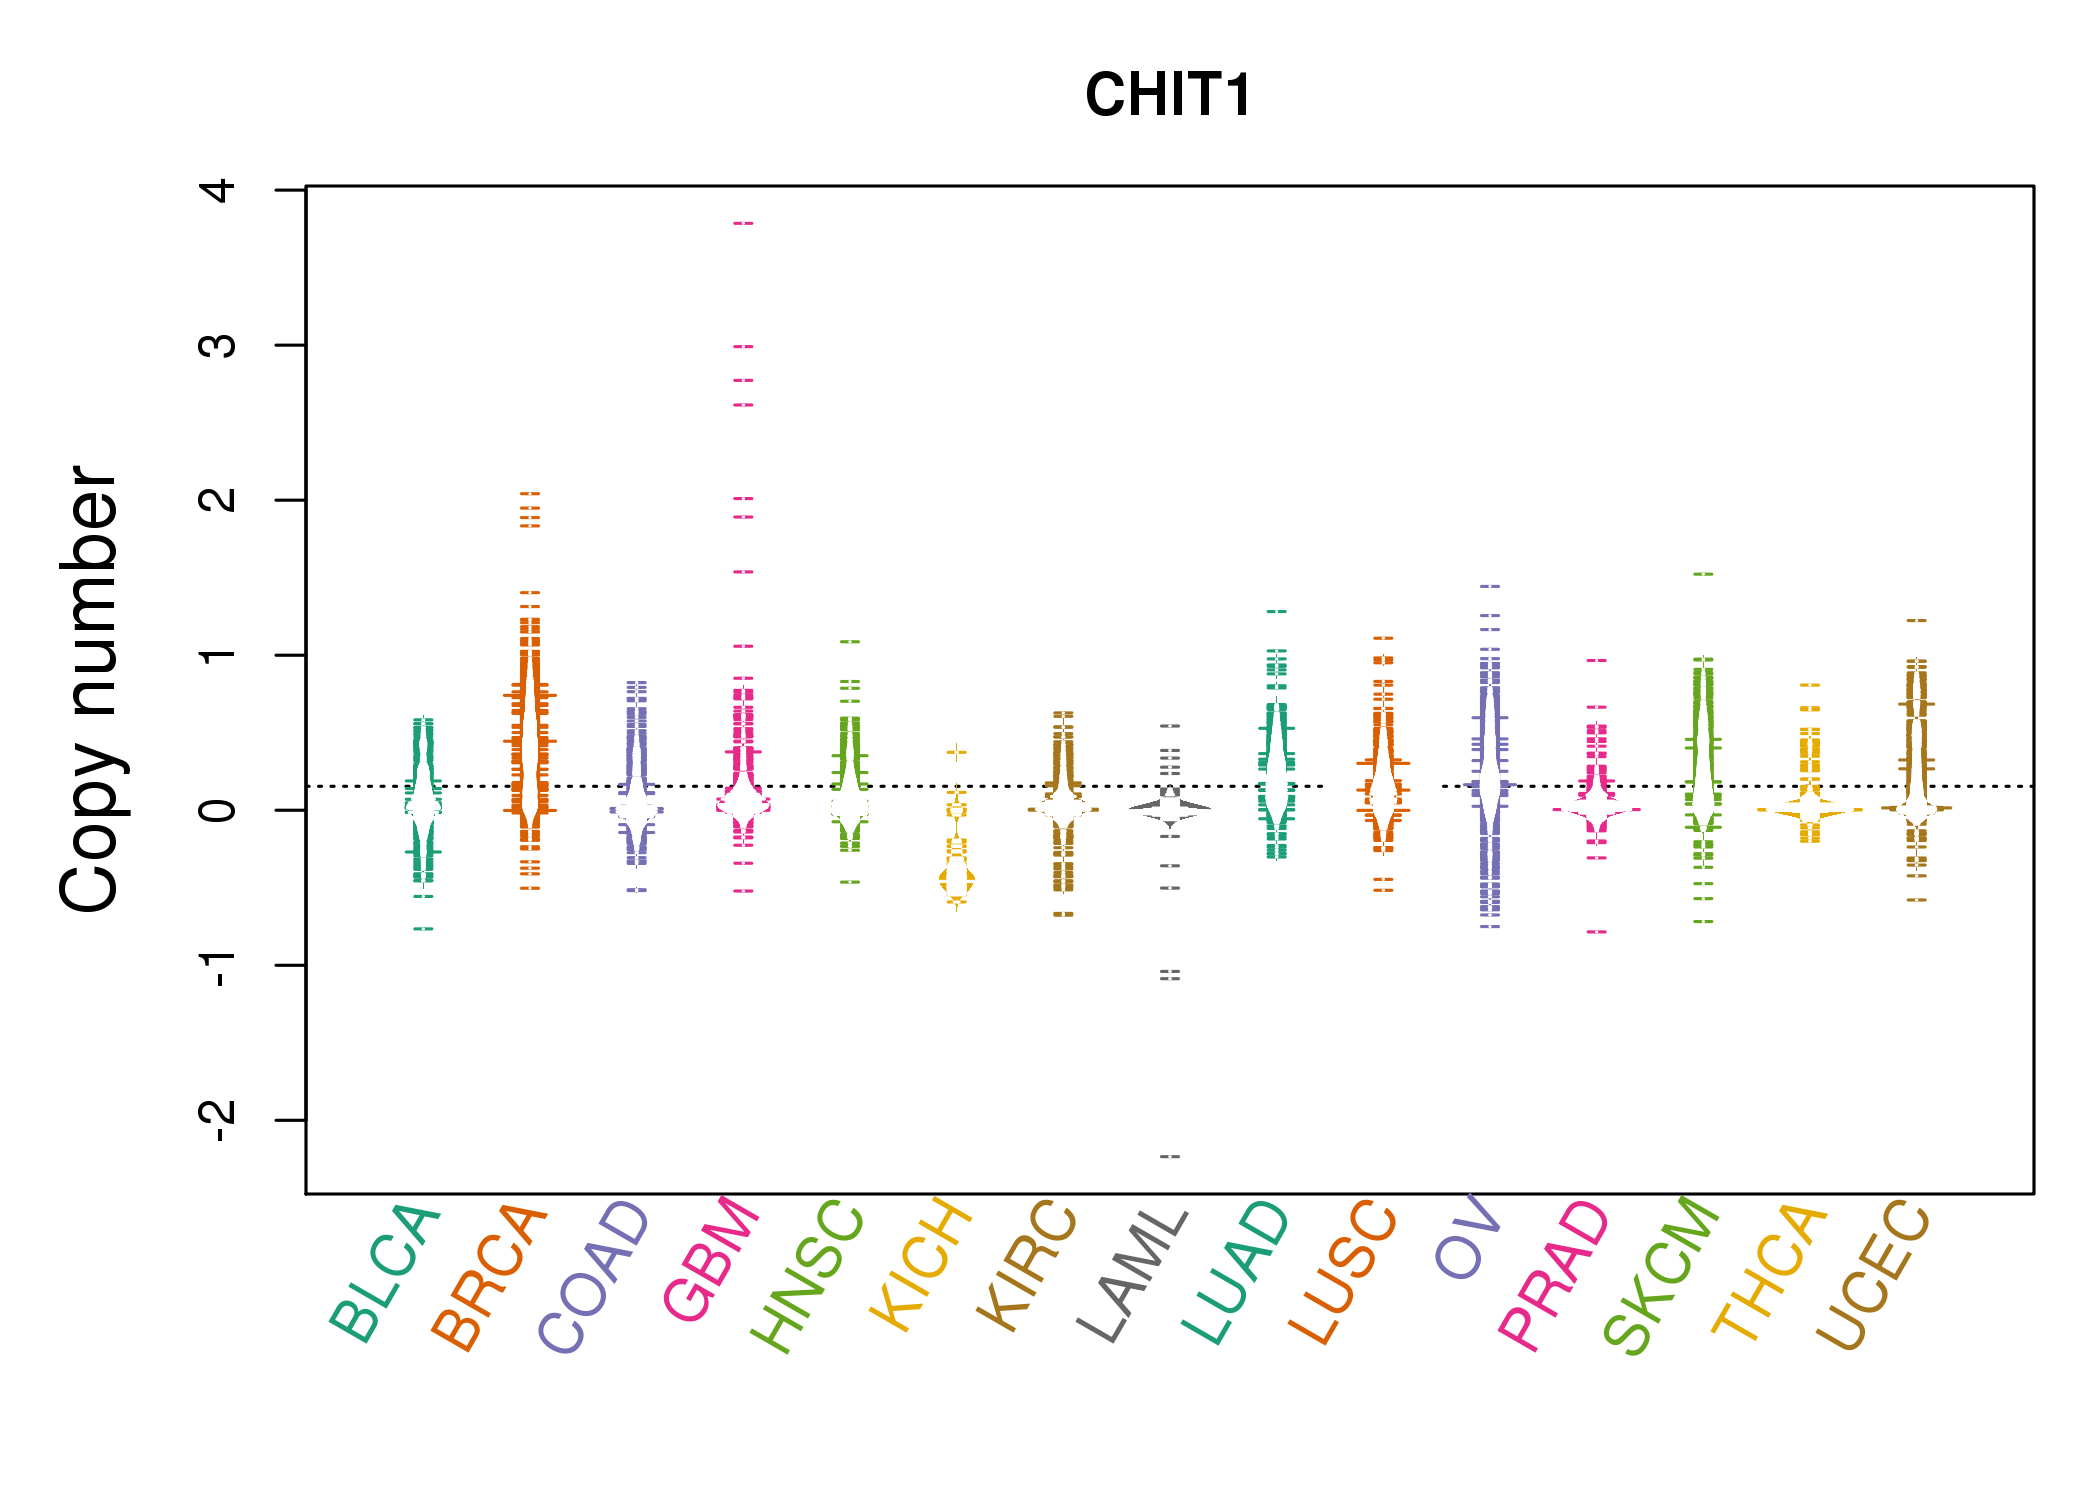 |
| cf) Tissue ID[Tissue type]: BLCA[Bladder Urothelial Carcinoma], BRCA[Breast invasive carcinoma], CESC[Cervical squamous cell carcinoma and endocervical adenocarcinoma], COAD[Colon adenocarcinoma], GBM[Glioblastoma multiforme], Glioma Low Grade, HNSC[Head and Neck squamous cell carcinoma], KICH[Kidney Chromophobe], KIRC[Kidney renal clear cell carcinoma], KIRP[Kidney renal papillary cell carcinoma], LAML[Acute Myeloid Leukemia], LUAD[Lung adenocarcinoma], LUSC[Lung squamous cell carcinoma], OV[Ovarian serous cystadenocarcinoma ], PAAD[Pancreatic adenocarcinoma], PRAD[Prostate adenocarcinoma], SKCM[Skin Cutaneous Melanoma], STAD[Stomach adenocarcinoma], THCA[Thyroid carcinoma], UCEC[Uterine Corpus Endometrial Carcinoma] |
| Top |
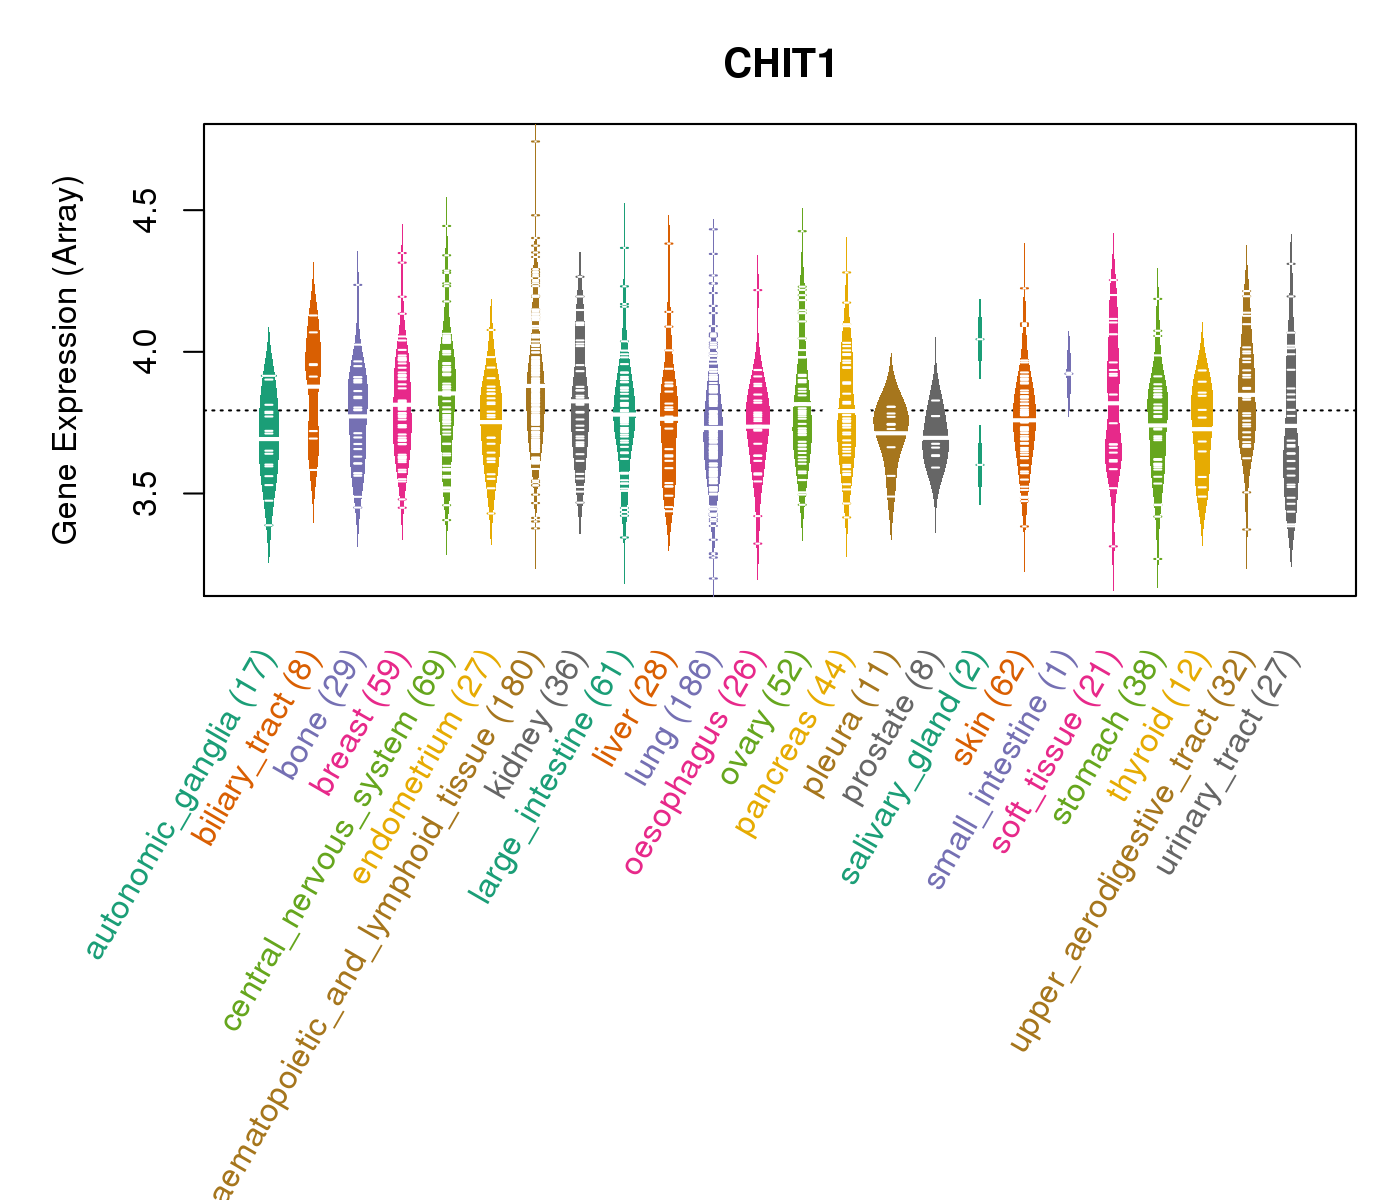
| Gene Expression for CHIT1 |
| * CCLE gene expression data were extracted from CCLE_Expression_Entrez_2012-10-18.res: Gene-centric RMA-normalized mRNA expression data. |
 |
| * Normalized gene expression data of RNASeqV2 was extracted from TCGA using R package TCGA-Assembler. The URLs of all public data files on TCGA DCC data server were gathered at Jan-05-2015. Only eight cancer types have enough normal control samples for differential expression analysis. (t test, adjusted p<0.05 (using Benjamini-Hochberg FDR)) |
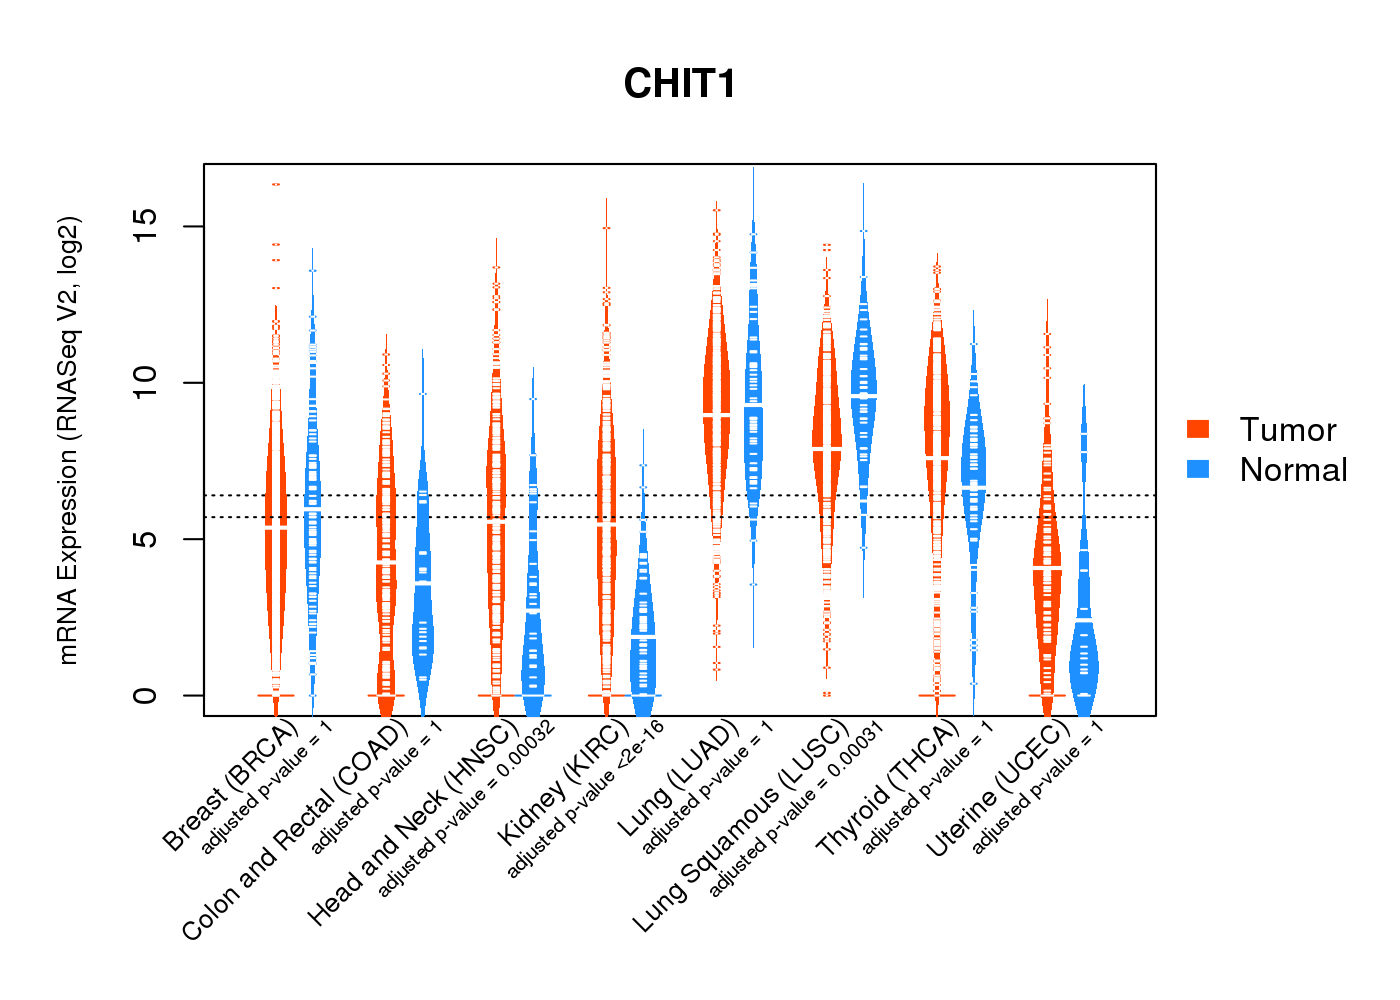 |
| Top |
| * This plots show the correlation between CNV and gene expression. |
: Open all plots for all cancer types
 |
|
 |
|
| Top |
| Gene-Gene Network Information |
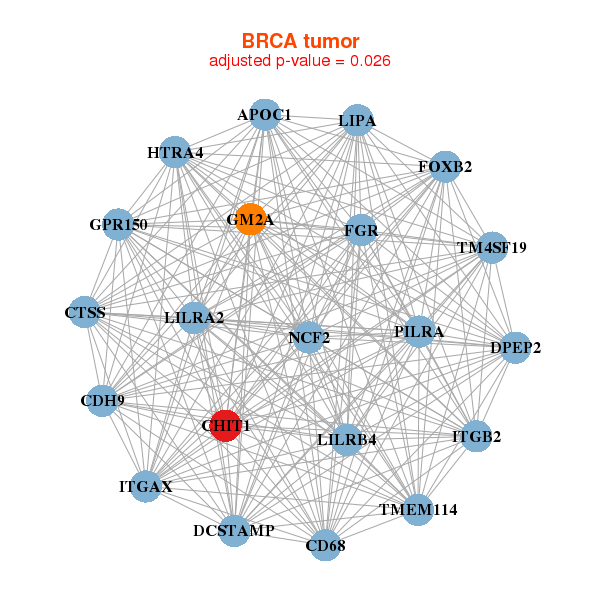
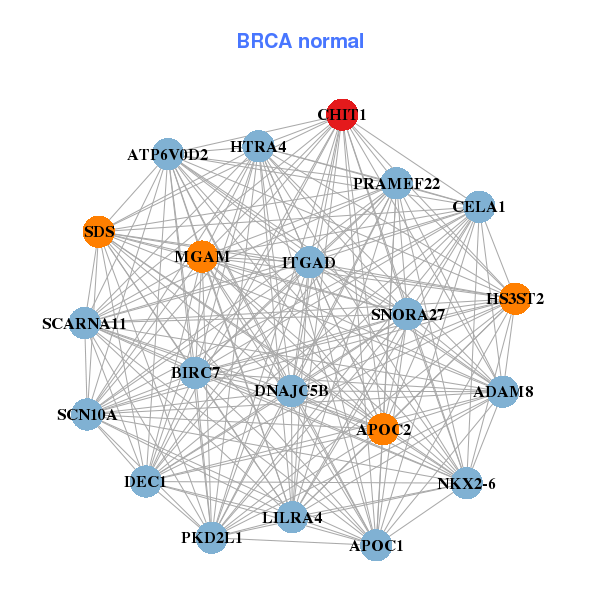
| * Co-Expression network figures were drawn using R package igraph. Only the top 20 genes with the highest correlations were shown. Red circle: input gene, orange circle: cell metabolism gene, sky circle: other gene |
: Open all plots for all cancer types
 |
| ||||
| APOC1,CD68,CDH9,CHIT1,CTSS,DPEP2,FGR, FOXB2,GM2A,GPR150,HTRA4,ITGAX,ITGB2,LILRA2, LILRB4,LIPA,NCF2,PILRA,TM4SF19,DCSTAMP,TMEM114 | ADAM8,APOC1,APOC2,ATP6V0D2,BIRC7,CELA1,CHIT1, DEC1,DNAJC5B,HS3ST2,HTRA4,ITGAD,LILRA4,MGAM, NKX2-6,PKD2L1,PRAMEF22,SCARNA11,SCN10A,SDS,SNORA27 | ||||
 |
| ||||
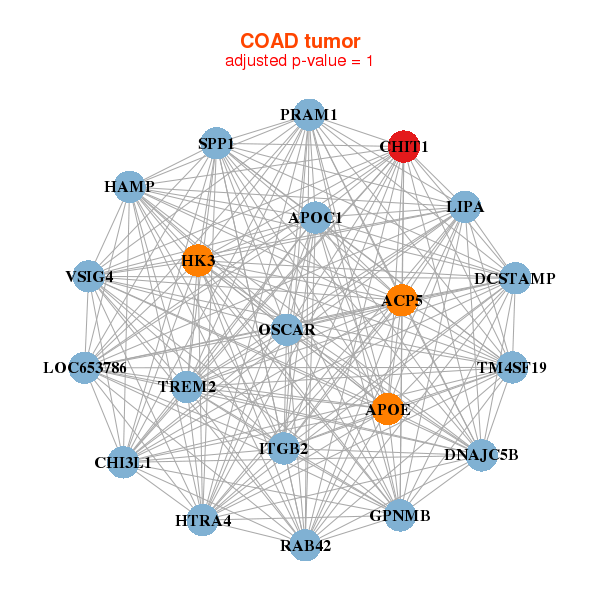
| ACP5,APOC1,APOE,CHI3L1,CHIT1,DNAJC5B,GPNMB, HAMP,HK3,HTRA4,ITGB2,LIPA,LOC653786,OSCAR, PRAM1,RAB42,SPP1,TM4SF19,DCSTAMP,TREM2,VSIG4 | ACTBL2,CCL18,CHIT1,DEFB103B,DEFB4A,FAM74A1,FAM92A1P2, FLJ25758,HS3ST2,HTRA4,KRT6B,KRTAP13-1,LY6D,MMP10, OR1J1,OR1J2,PRAMEF12,RBMXL3,TM4SF19,TRIM42,XKRY2 |
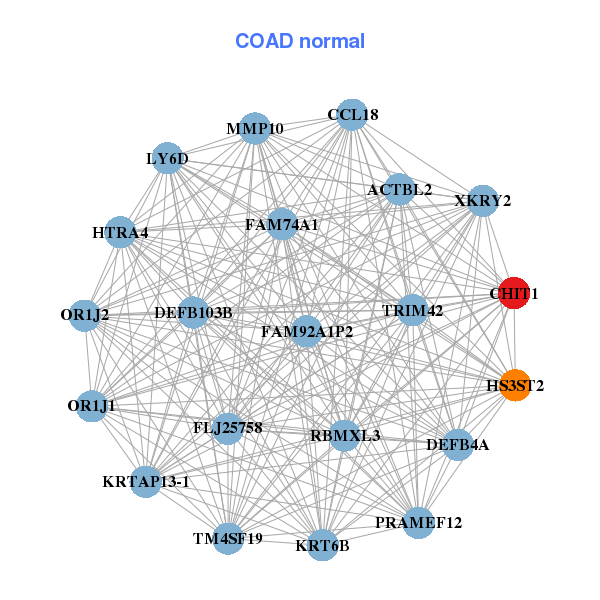
| * Co-Expression network figures were drawn using R package igraph. Only the top 20 genes with the highest correlations were shown. Red circle: input gene, orange circle: cell metabolism gene, sky circle: other gene |
: Open all plots for all cancer types
| Top |
: Open all interacting genes' information including KEGG pathway for all interacting genes from DAVID
| Top |
| Pharmacological Information for CHIT1 |
| DB Category | DB Name | DB's ID and Url link |
| * Gene Centered Interaction Network. |
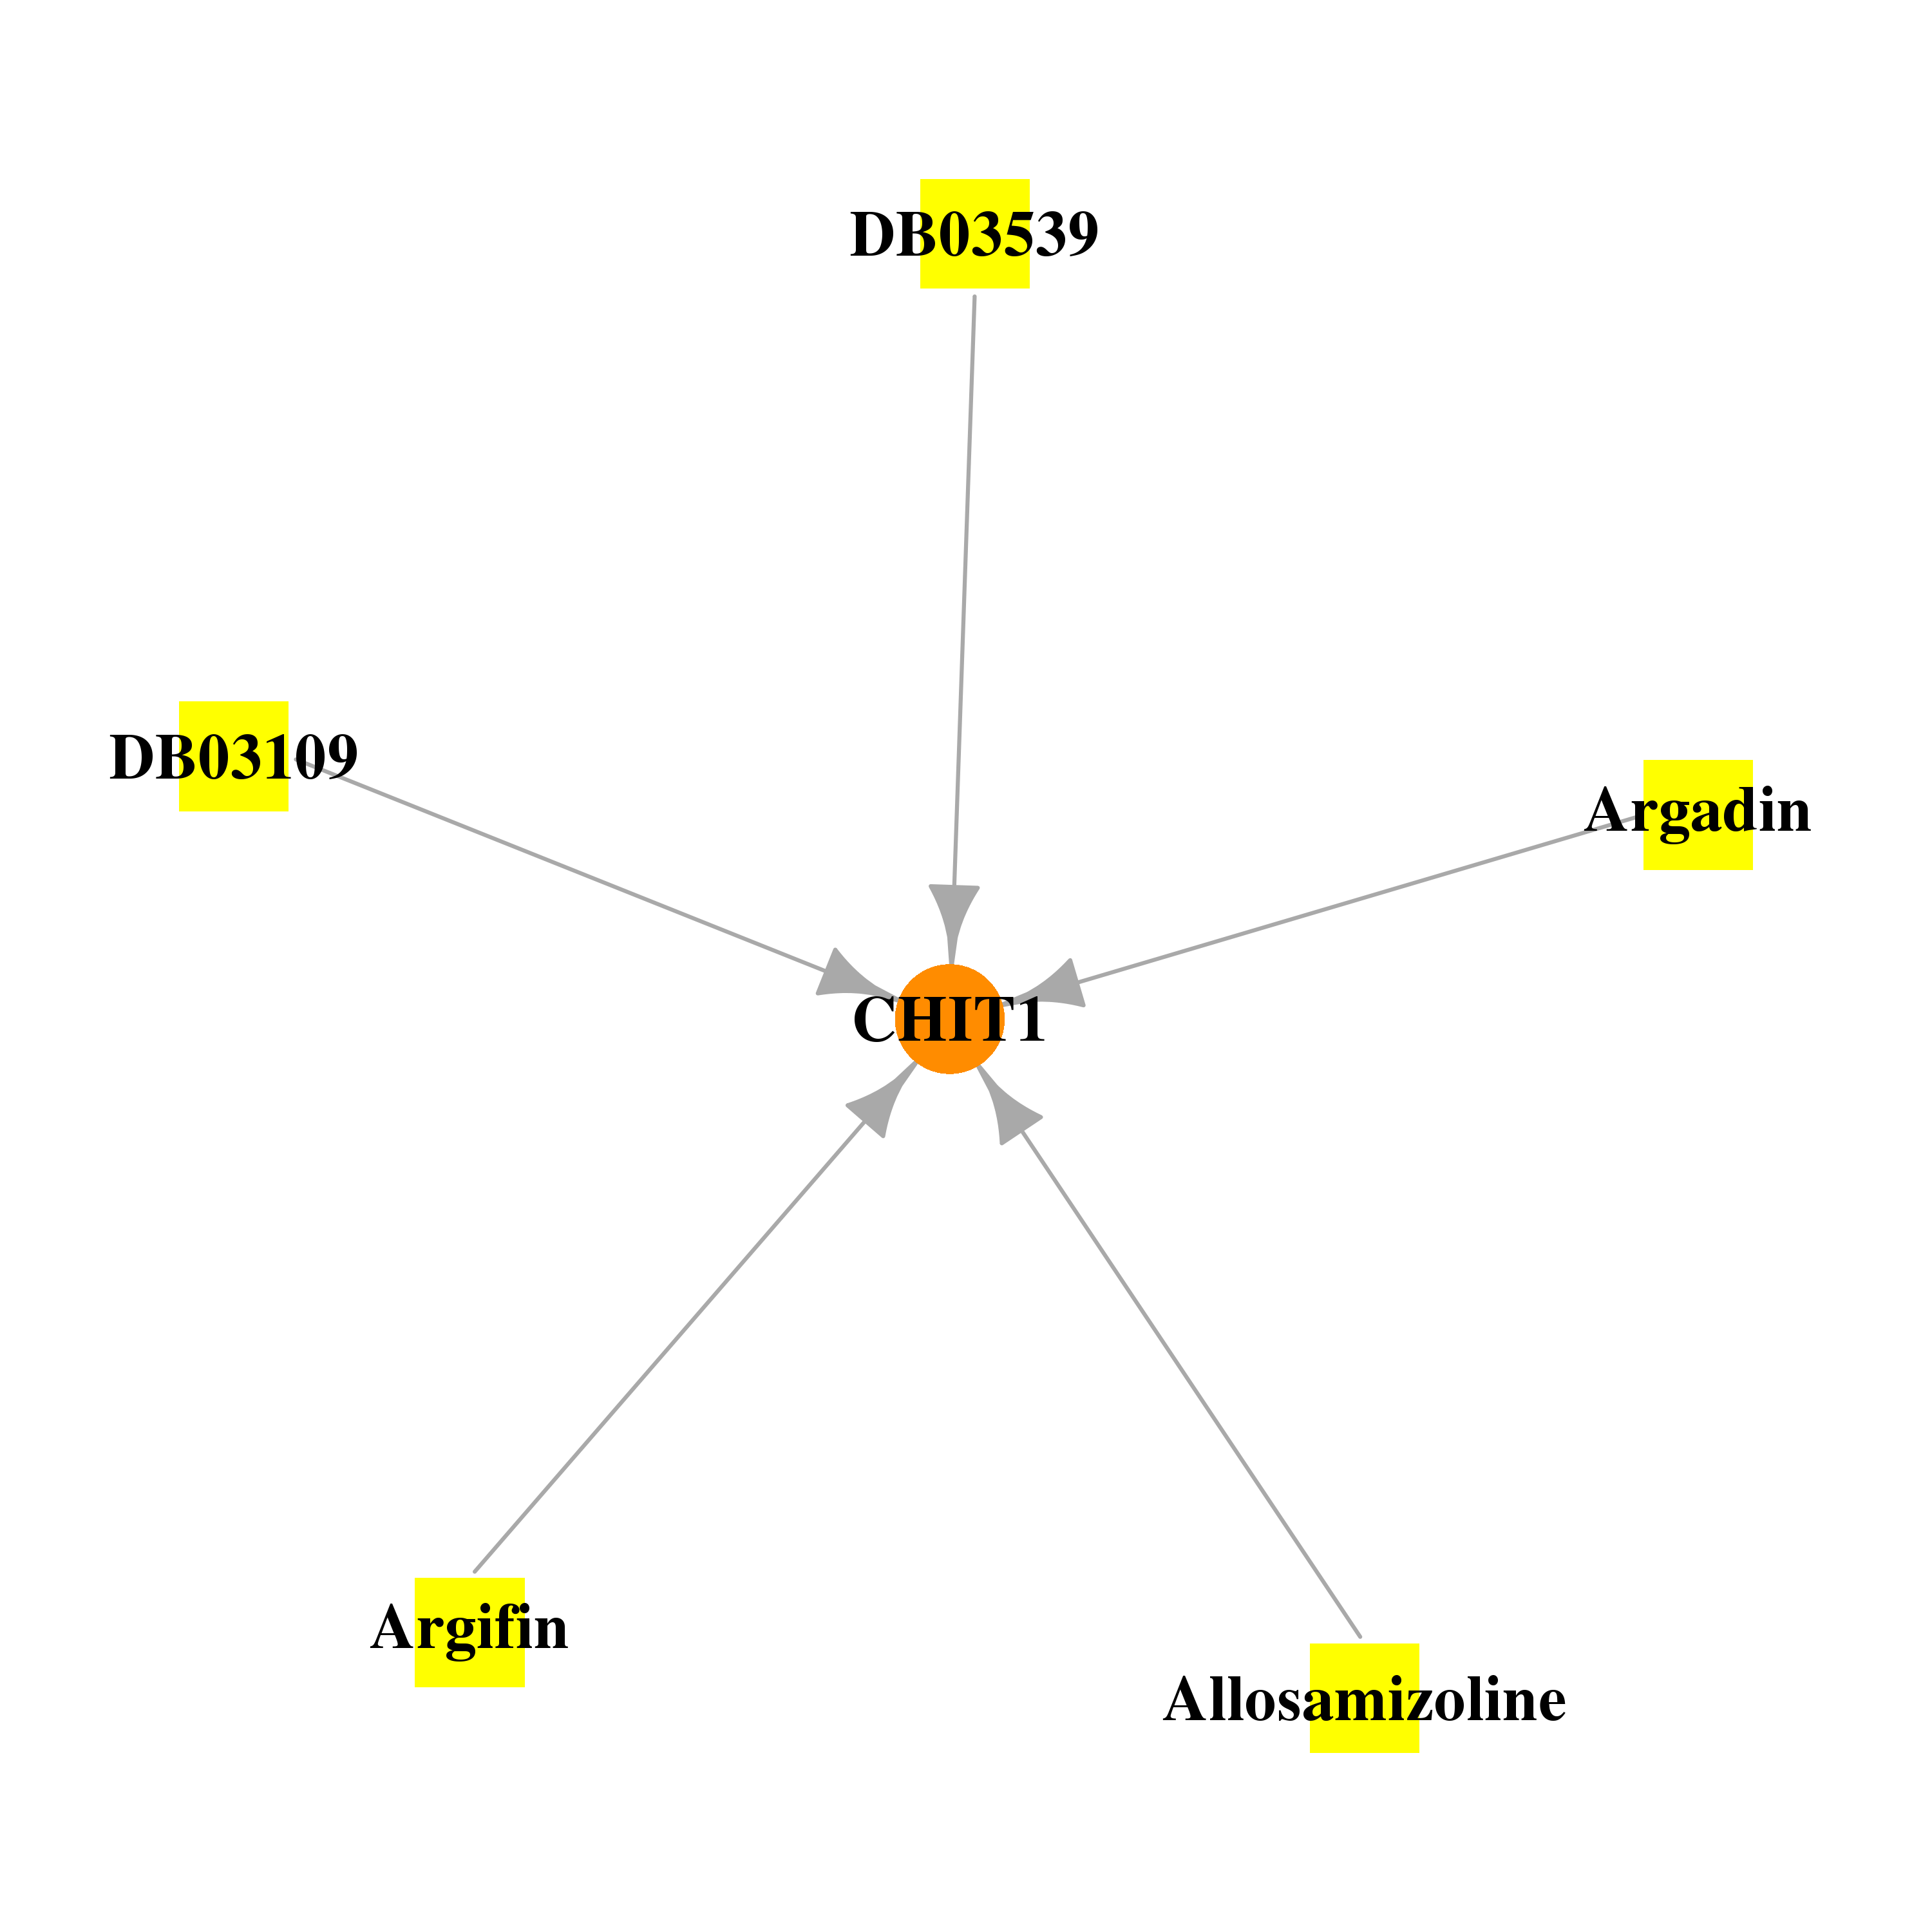 |
| * Drug Centered Interaction Network. |
| DrugBank ID | Target Name | Drug Groups | Generic Name | Drug Centered Network | Drug Structure |
| DB03109 | chitinase 1 (chitotriosidase) | experimental | N-Acetyl-D-Allosamine | 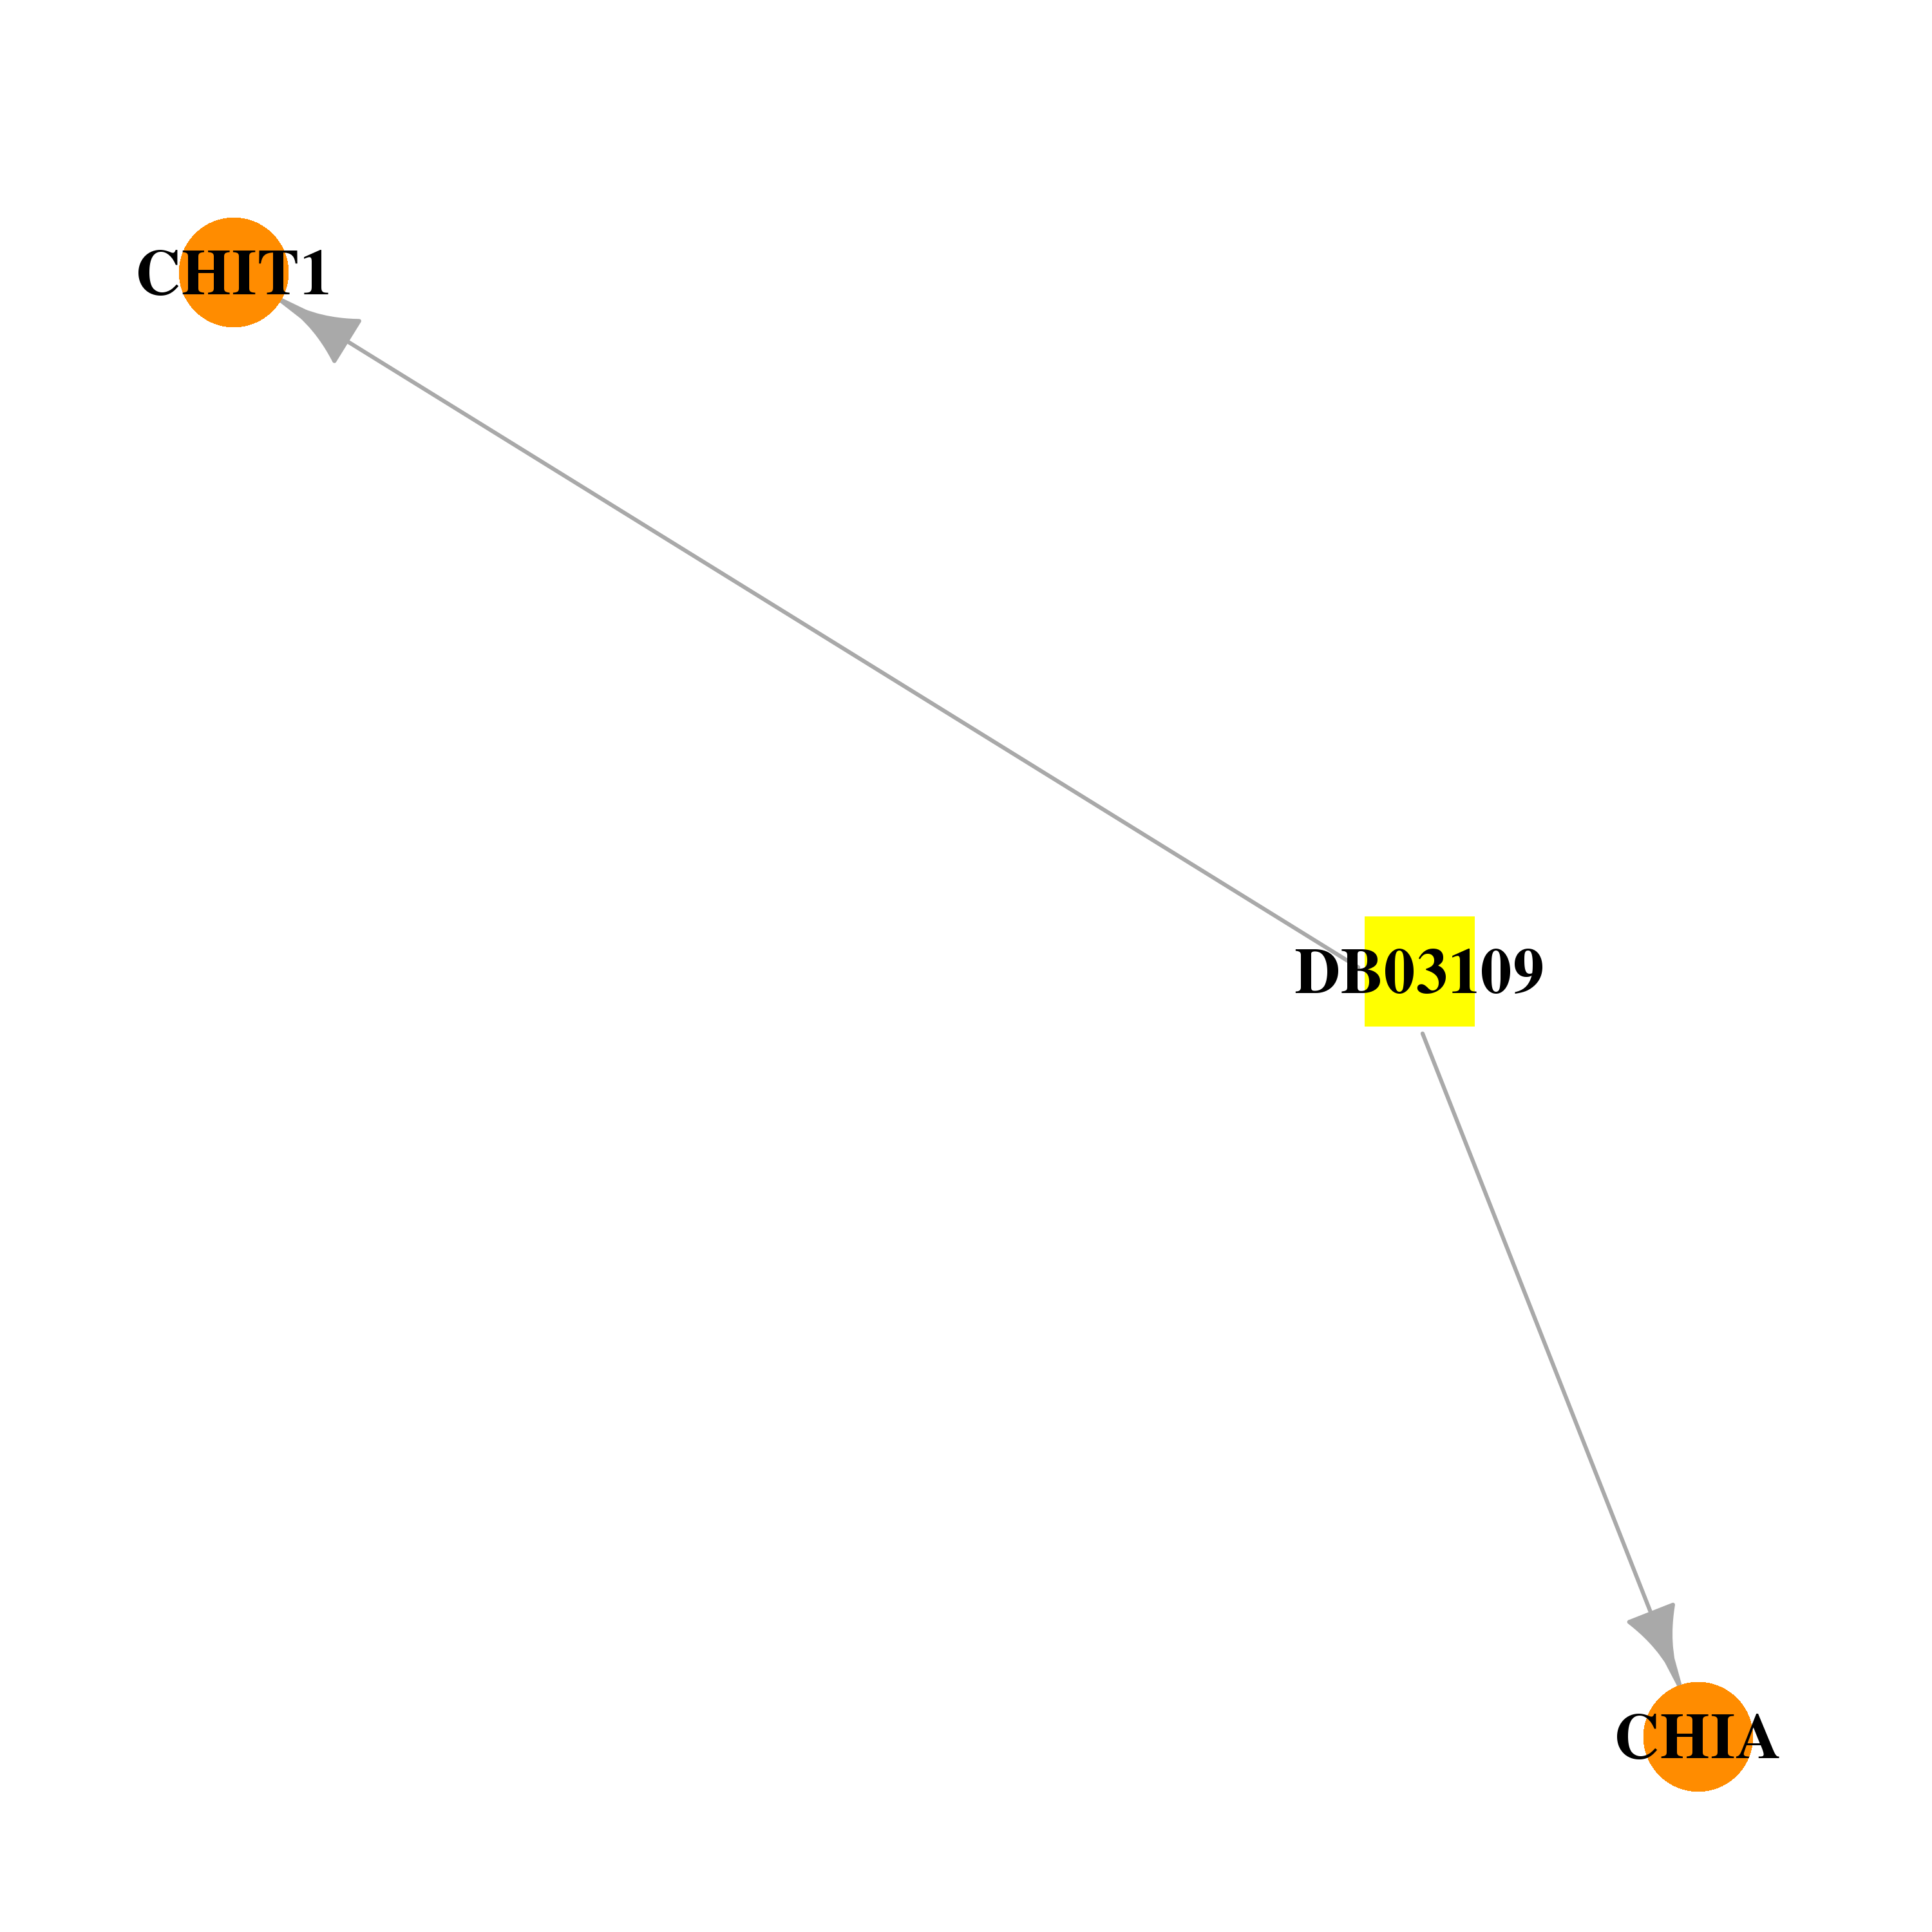 | 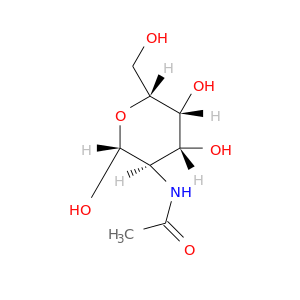 |
| DB03539 | chitinase 1 (chitotriosidase) | experimental | 2-(Acetylamino)-2-Deoxy-6-O-Methyl-Alpha-D-Allopyranose | 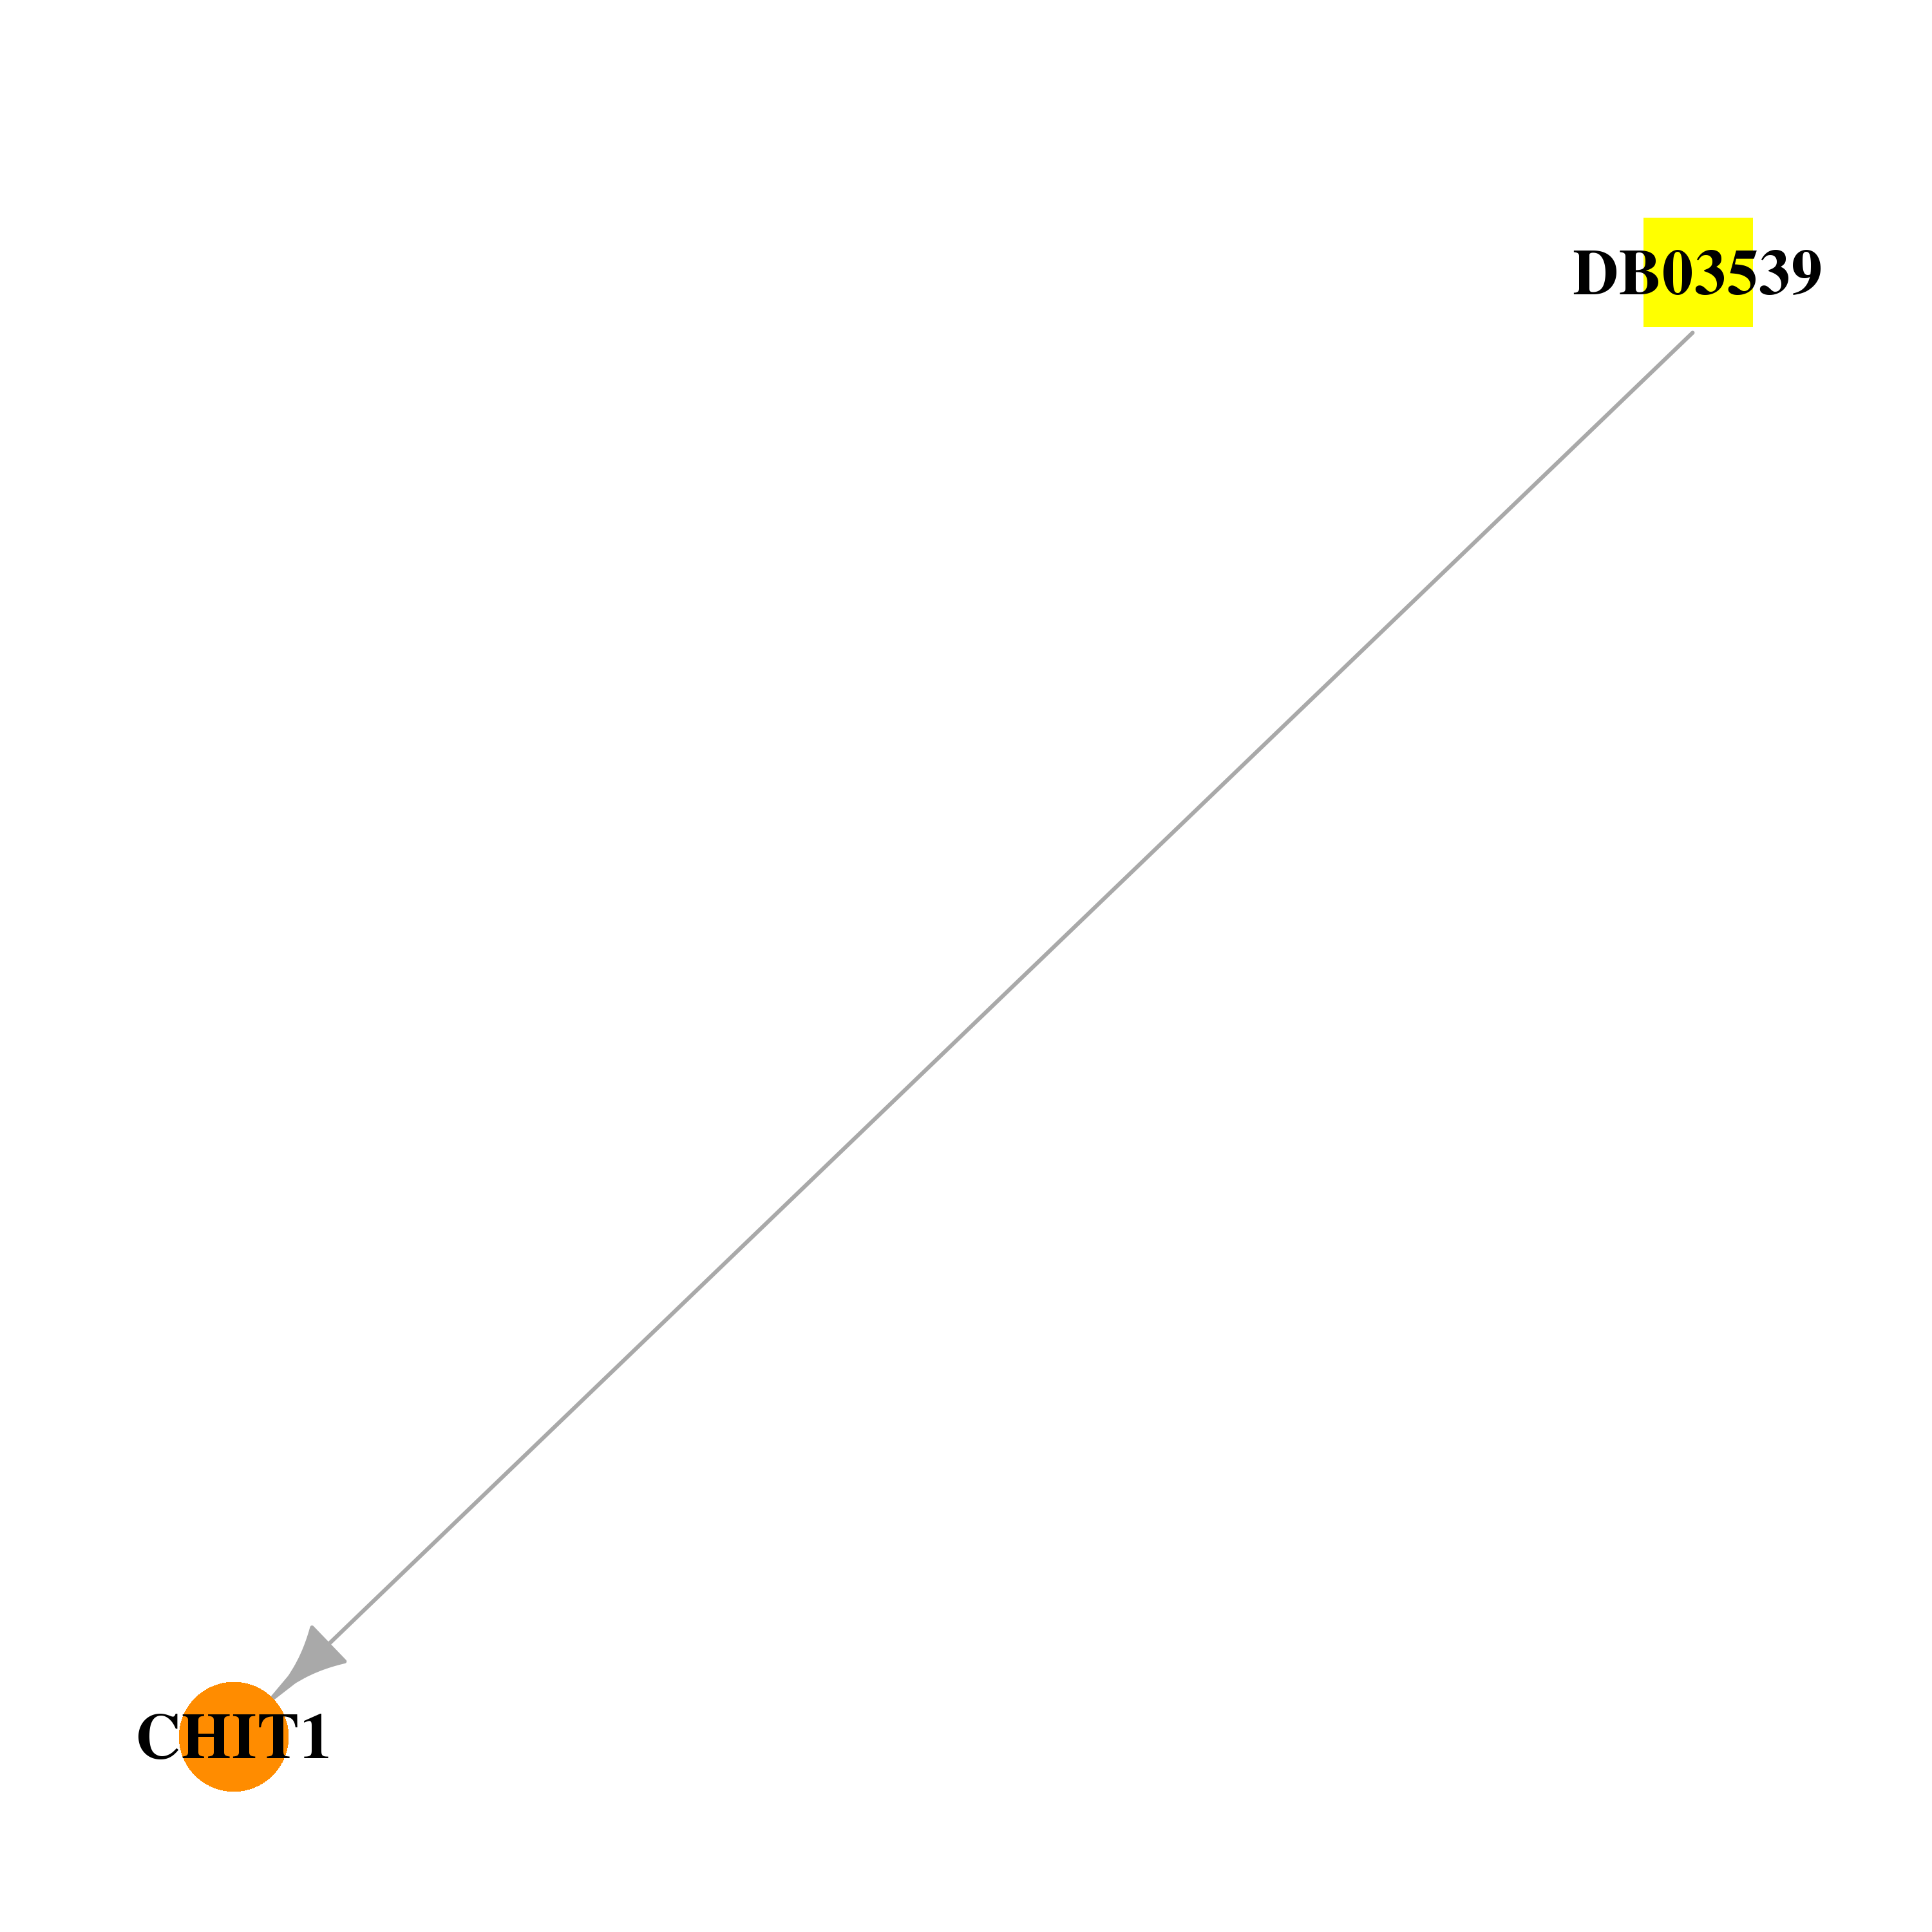 |  |
| DB03632 | chitinase 1 (chitotriosidase) | experimental | Argifin |  |  |
| DB04350 | chitinase 1 (chitotriosidase) | experimental | Argadin | 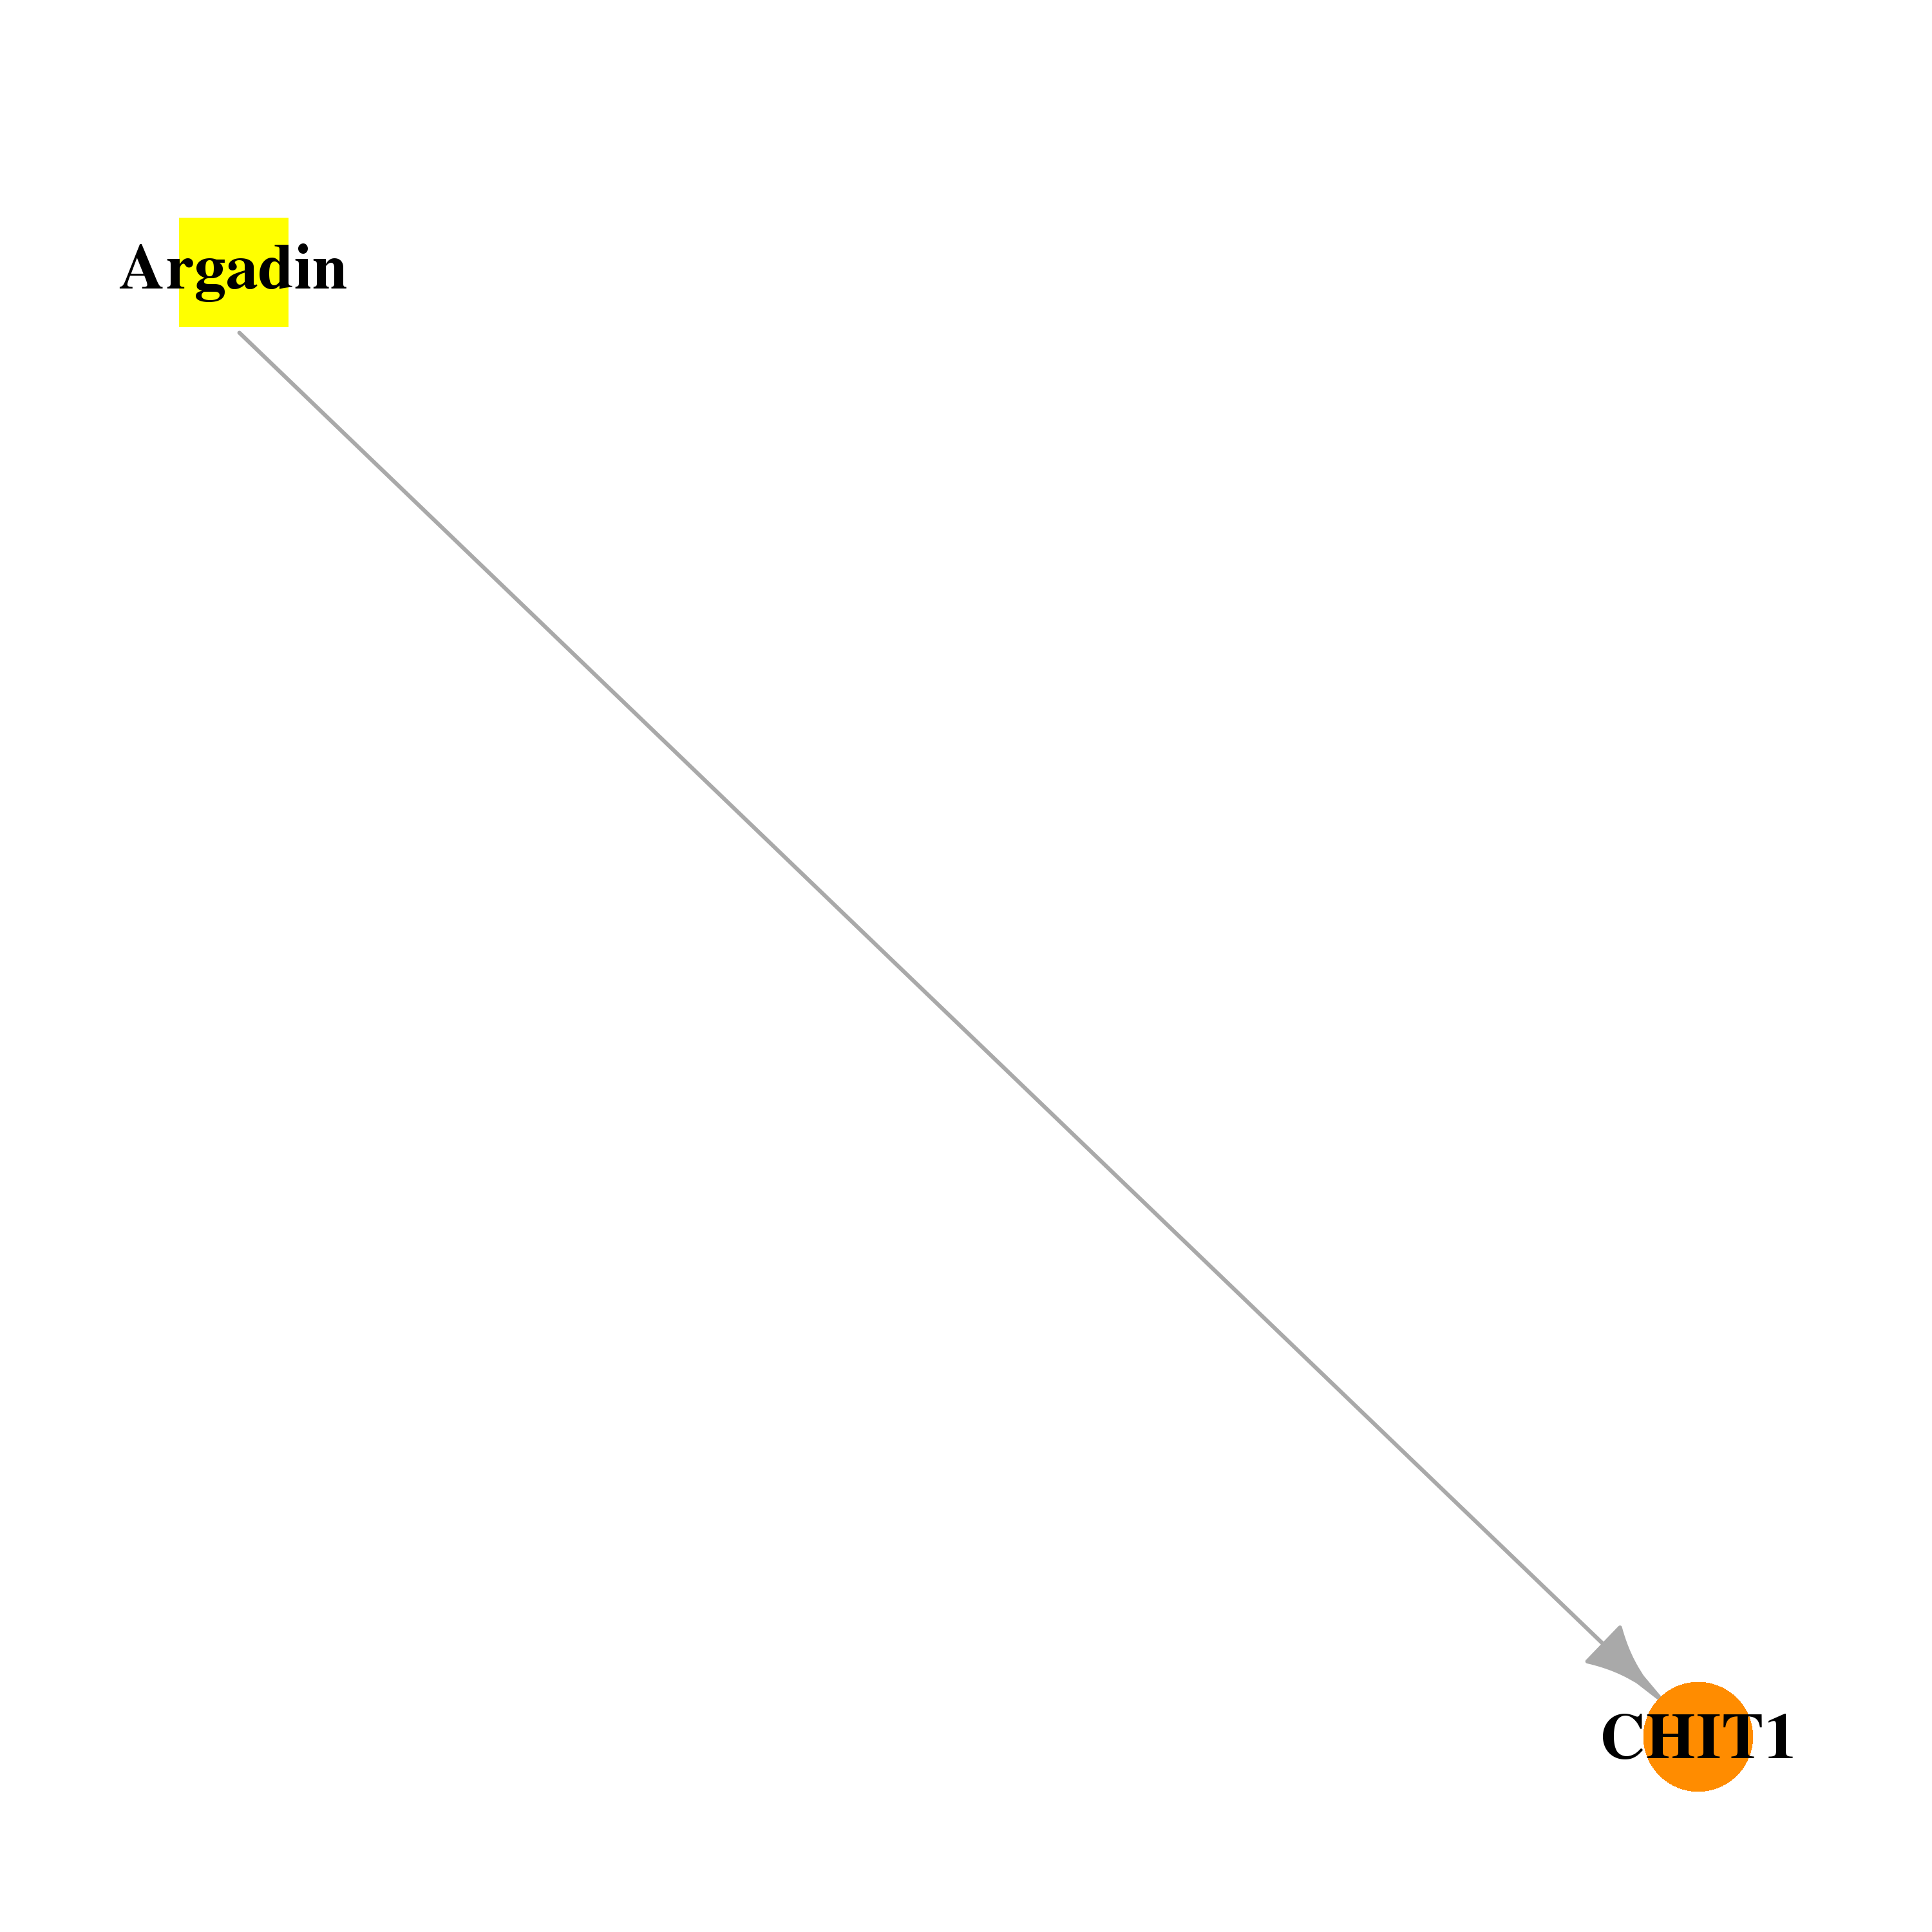 |  |
| DB04404 | chitinase 1 (chitotriosidase) | experimental | Allosamizoline | 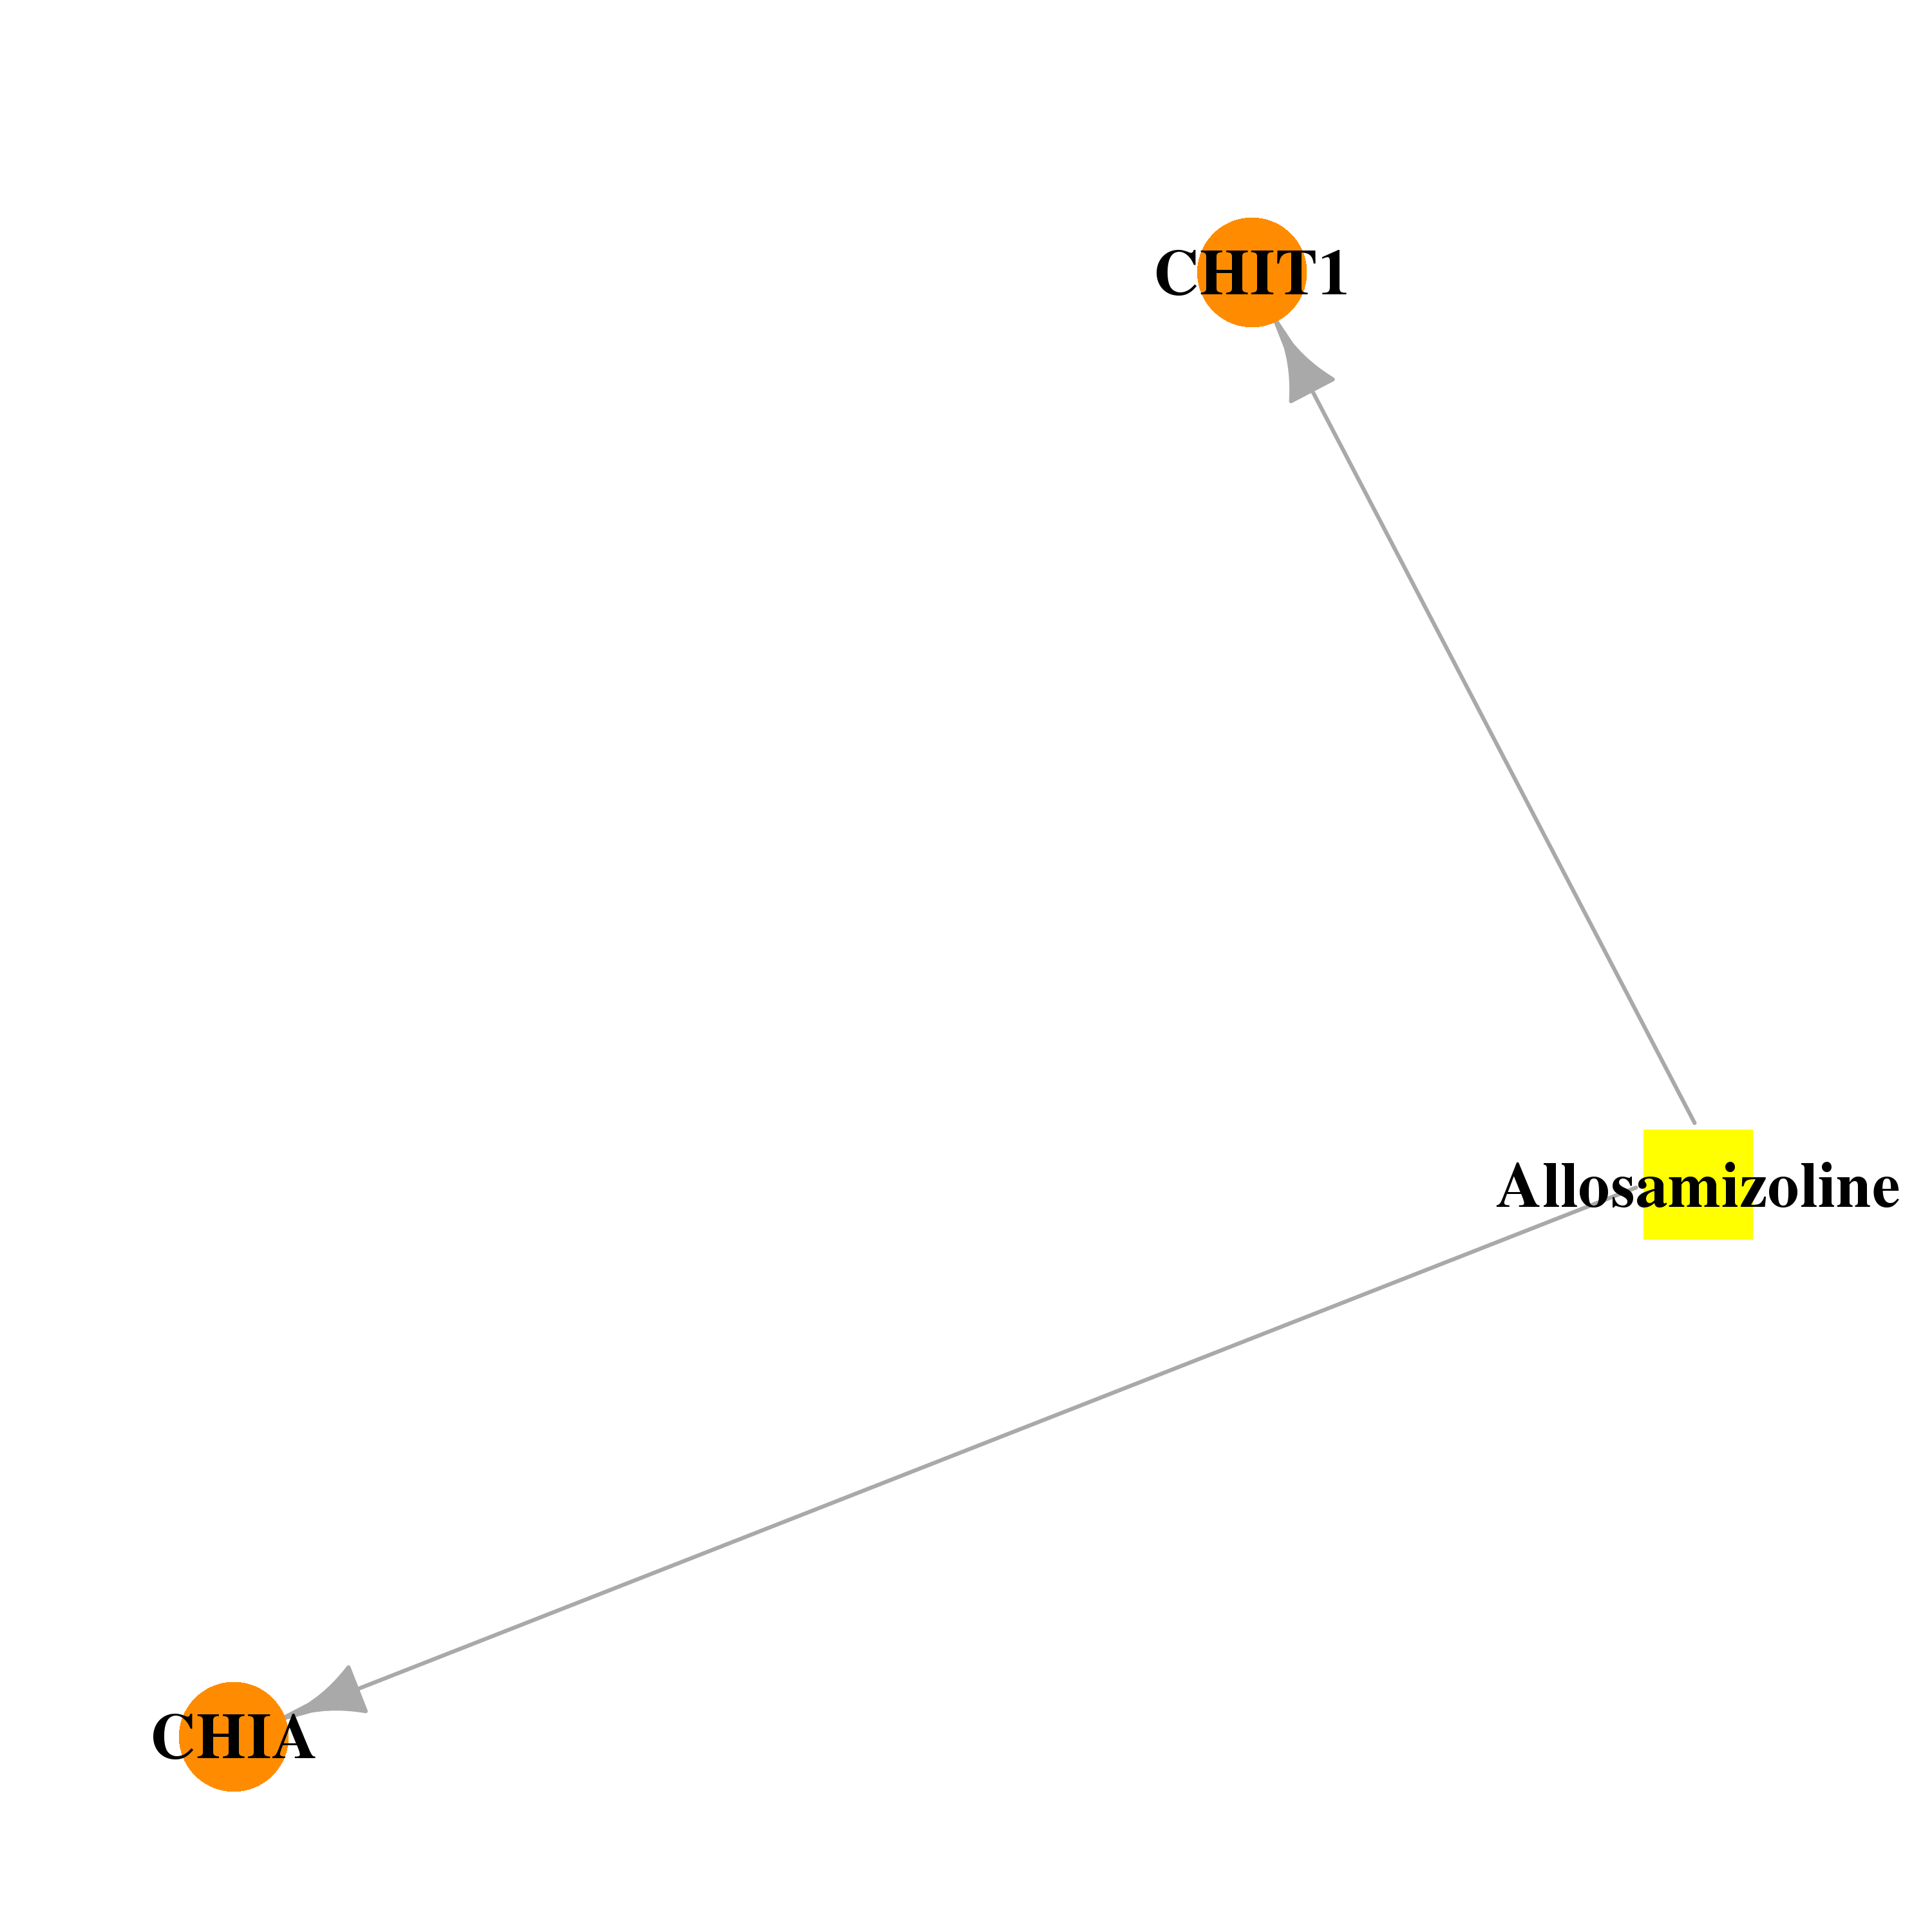 | 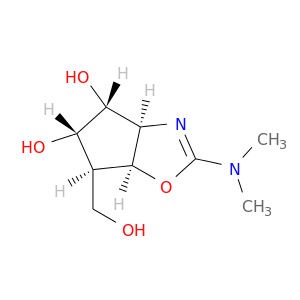 |
| Top |
| Cross referenced IDs for CHIT1 |
| * We obtained these cross-references from Uniprot database. It covers 150 different DBs, 18 categories. http://www.uniprot.org/help/cross_references_section |
: Open all cross reference information
|
Copyright © 2016-Present - The Univsersity of Texas Health Science Center at Houston @ |