|
||||||||||||||||||||
| |
| Phenotypic Information (metabolism pathway, cancer, disease, phenome) |
| |
| |
| Gene-Gene Network Information: Co-Expression Network, Interacting Genes & KEGG |
| |
|


| Gene Summary for INMT |
| Basic gene info. | Gene symbol | INMT |
| Gene name | indolethylamine N-methyltransferase | |
| Synonyms | TEMT | |
| Cytomap | UCSC genome browser: 7p14.3 | |
| Genomic location | chr7 :30791750-30797218 | |
| Type of gene | protein-coding | |
| RefGenes | NM_001199219.1, NM_006774.4, | |
| Ensembl id | ENSG00000241644 | |
| Description | amine N-methyltransferasearomatic alkylamine N-methyltransferasearylamine N-methyltransferaseindolamine N-methyltransferasenicotine N-methyltransferasethioether S-methyltransferase | |
| Modification date | 20141207 | |
| dbXrefs | MIM : 604854 | |
| HGNC : HGNC | ||
| Ensembl : ENSG00000241644 | ||
| HPRD : 06890 | ||
| Vega : OTTHUMG00000167163 | ||
| Protein | UniProt: go to UniProt's Cross Reference DB Table | |
| Expression | CleanEX: HS_INMT | |
| BioGPS: 11185 | ||
| Gene Expression Atlas: ENSG00000241644 | ||
| The Human Protein Atlas: ENSG00000241644 | ||
| Pathway | NCI Pathway Interaction Database: INMT | |
| KEGG: INMT | ||
| REACTOME: INMT | ||
| ConsensusPathDB | ||
| Pathway Commons: INMT | ||
| Metabolism | MetaCyc: INMT | |
| HUMANCyc: INMT | ||
| Regulation | Ensembl's Regulation: ENSG00000241644 | |
| miRBase: chr7 :30,791,750-30,797,218 | ||
| TargetScan: NM_001199219 | ||
| cisRED: ENSG00000241644 | ||
| Context | iHOP: INMT | |
| cancer metabolism search in PubMed: INMT | ||
| UCL Cancer Institute: INMT | ||
| Assigned class in ccmGDB | C | |
| Top |
| Phenotypic Information for INMT(metabolism pathway, cancer, disease, phenome) |
| Cancer | CGAP: INMT |
| Familial Cancer Database: INMT | |
| * This gene is included in those cancer gene databases. |
|
|
|
|
|
| . | ||||||||||||||
Oncogene 1 | Significant driver gene in | |||||||||||||||||||
| cf) number; DB name 1 Oncogene; http://nar.oxfordjournals.org/content/35/suppl_1/D721.long, 2 Tumor Suppressor gene; https://bioinfo.uth.edu/TSGene/, 3 Cancer Gene Census; http://www.nature.com/nrc/journal/v4/n3/abs/nrc1299.html, 4 CancerGenes; http://nar.oxfordjournals.org/content/35/suppl_1/D721.long, 5 Network of Cancer Gene; http://ncg.kcl.ac.uk/index.php, 1Therapeutic Vulnerabilities in Cancer; http://cbio.mskcc.org/cancergenomics/statius/ |
| KEGG_TRYPTOPHAN_METABOLISM | |
| OMIM | |
| Orphanet | |
| Disease | KEGG Disease: INMT |
| MedGen: INMT (Human Medical Genetics with Condition) | |
| ClinVar: INMT | |
| Phenotype | MGI: INMT (International Mouse Phenotyping Consortium) |
| PhenomicDB: INMT | |
| Mutations for INMT |
| * Under tables are showing count per each tissue to give us broad intuition about tissue specific mutation patterns.You can go to the detailed page for each mutation database's web site. |
| There's no structural variation information in COSMIC data for this gene. |
| * From mRNA Sanger sequences, Chitars2.0 arranged chimeric transcripts. This table shows INMT related fusion information. |
| ID | Head Gene | Tail Gene | Accession | Gene_a | qStart_a | qEnd_a | Chromosome_a | tStart_a | tEnd_a | Gene_a | qStart_a | qEnd_a | Chromosome_a | tStart_a | tEnd_a |
| Top |
| There's no copy number variation information in COSMIC data for this gene. |
| Top |
|
 |
| Top |
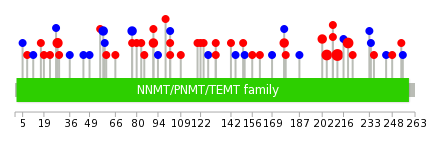
| Stat. for Non-Synonymous SNVs (# total SNVs=33) | (# total SNVs=12) |
 |  |
(# total SNVs=0) | (# total SNVs=0) |
| Top |
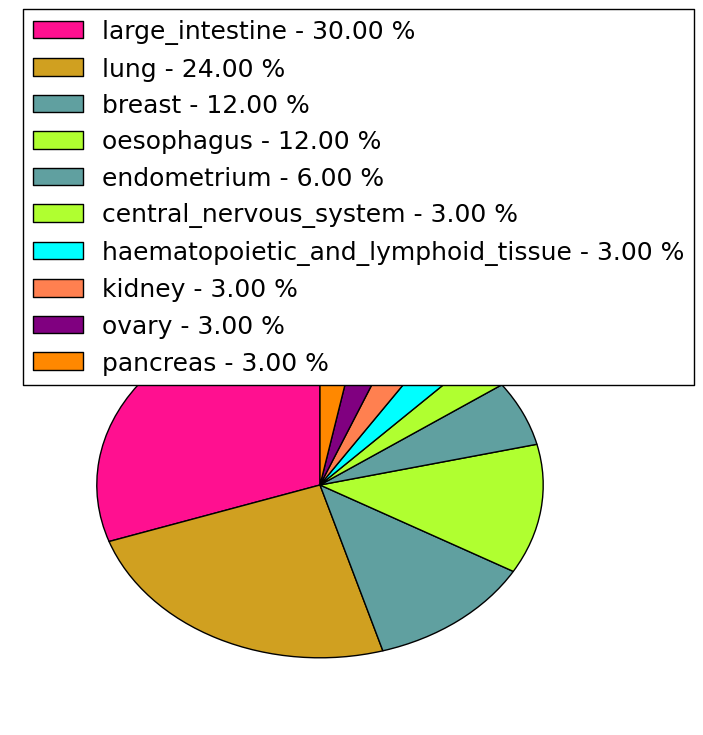
| * When you move the cursor on each content, you can see more deailed mutation information on the Tooltip. Those are primary_site,primary_histology,mutation(aa),pubmedID. |
| GRCh37 position | Mutation(aa) | Unique sampleID count |
| chr7:30795310-30795310 | p.S212F | 7 |
| chr7:30795288-30795288 | p.M205V | 4 |
| chr7:30795331-30795331 | p.E219G | 4 |
| chr7:30791848-30791848 | p.D28N | 3 |
| chr7:30793366-30793366 | p.T58T | 2 |
| chr7:30795280-30795280 | p.P202L | 2 |
| chr7:30795287-30795287 | p.Y204* | 2 |
| chr7:30793497-30793497 | p.P102L | 2 |
| chr7:30793423-30793423 | p.S77S | 2 |
| chr7:30795204-30795204 | p.R177C | 2 |
| Top |
|
 |
| Point Mutation/ Tissue ID | 1 | 2 | 3 | 4 | 5 | 6 | 7 | 8 | 9 | 10 | 11 | 12 | 13 | 14 | 15 | 16 | 17 | 18 | 19 | 20 |
| # sample | 3 | 6 | 1 | 1 | 1 | 8 | 6 | 1 | 14 | 5 | 2 | |||||||||
| # mutation | 3 | 7 | 1 | 1 | 1 | 7 | 6 | 1 | 12 | 5 | 3 | |||||||||
| nonsynonymous SNV | 3 | 4 | 1 | 6 | 4 | 1 | 5 | 2 | 2 | |||||||||||
| synonymous SNV | 3 | 1 | 1 | 1 | 2 | 7 | 3 | 1 |
| cf) Tissue ID; Tissue type (1; BLCA[Bladder Urothelial Carcinoma], 2; BRCA[Breast invasive carcinoma], 3; CESC[Cervical squamous cell carcinoma and endocervical adenocarcinoma], 4; COAD[Colon adenocarcinoma], 5; GBM[Glioblastoma multiforme], 6; Glioma Low Grade, 7; HNSC[Head and Neck squamous cell carcinoma], 8; KICH[Kidney Chromophobe], 9; KIRC[Kidney renal clear cell carcinoma], 10; KIRP[Kidney renal papillary cell carcinoma], 11; LAML[Acute Myeloid Leukemia], 12; LUAD[Lung adenocarcinoma], 13; LUSC[Lung squamous cell carcinoma], 14; OV[Ovarian serous cystadenocarcinoma ], 15; PAAD[Pancreatic adenocarcinoma], 16; PRAD[Prostate adenocarcinoma], 17; SKCM[Skin Cutaneous Melanoma], 18:STAD[Stomach adenocarcinoma], 19:THCA[Thyroid carcinoma], 20:UCEC[Uterine Corpus Endometrial Carcinoma]) |
| Top |
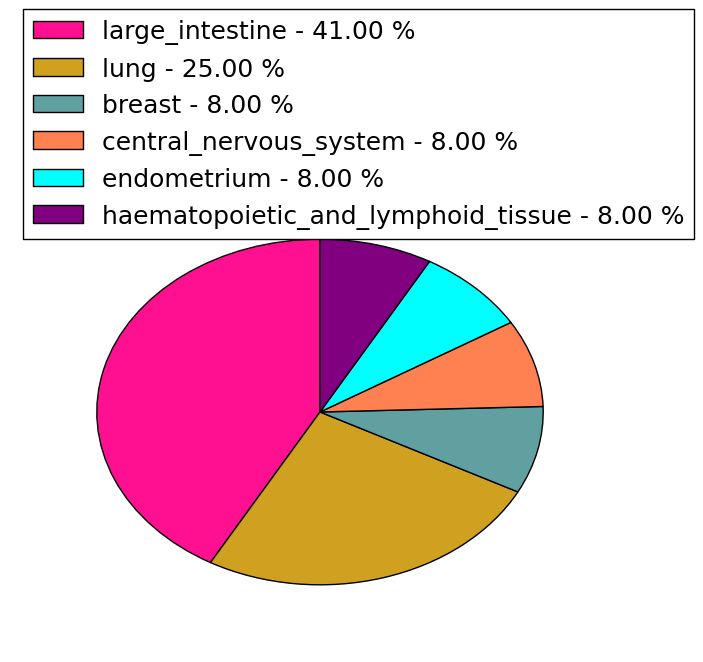
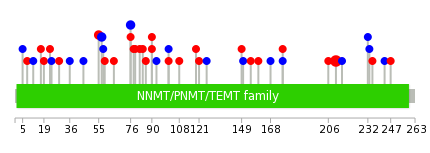
| * We represented just top 10 SNVs. When you move the cursor on each content, you can see more deailed mutation information on the Tooltip. Those are primary_site, primary_histology, mutation(aa), pubmedID. |
| Genomic Position | Mutation(aa) | Unique sampleID count |
| chr7:30795310 | p.S211F,INMT | 6 |
| chr7:30793423 | p.G55V,INMT | 2 |
| chr7:30793359 | p.T57T,INMT | 2 |
| chr7:30793366 | p.S76S,INMT | 2 |
| chr7:30793389 | p.Y24Y,INMT | 1 |
| chr7:30793497 | p.R90W,INMT | 1 |
| chr7:30791821 | p.G206W,INMT | 1 |
| chr7:30795204 | p.G29S,INMT | 1 |
| chr7:30793422 | p.R90Q,INMT | 1 |
| chr7:30793498 | p.E36E,INMT | 1 |
| * Copy number data were extracted from TCGA using R package TCGA-Assembler. The URLs of all public data files on TCGA DCC data server were gathered on Jan-05-2015. Function ProcessCNAData in TCGA-Assembler package was used to obtain gene-level copy number value which is calculated as the average copy number of the genomic region of a gene. |
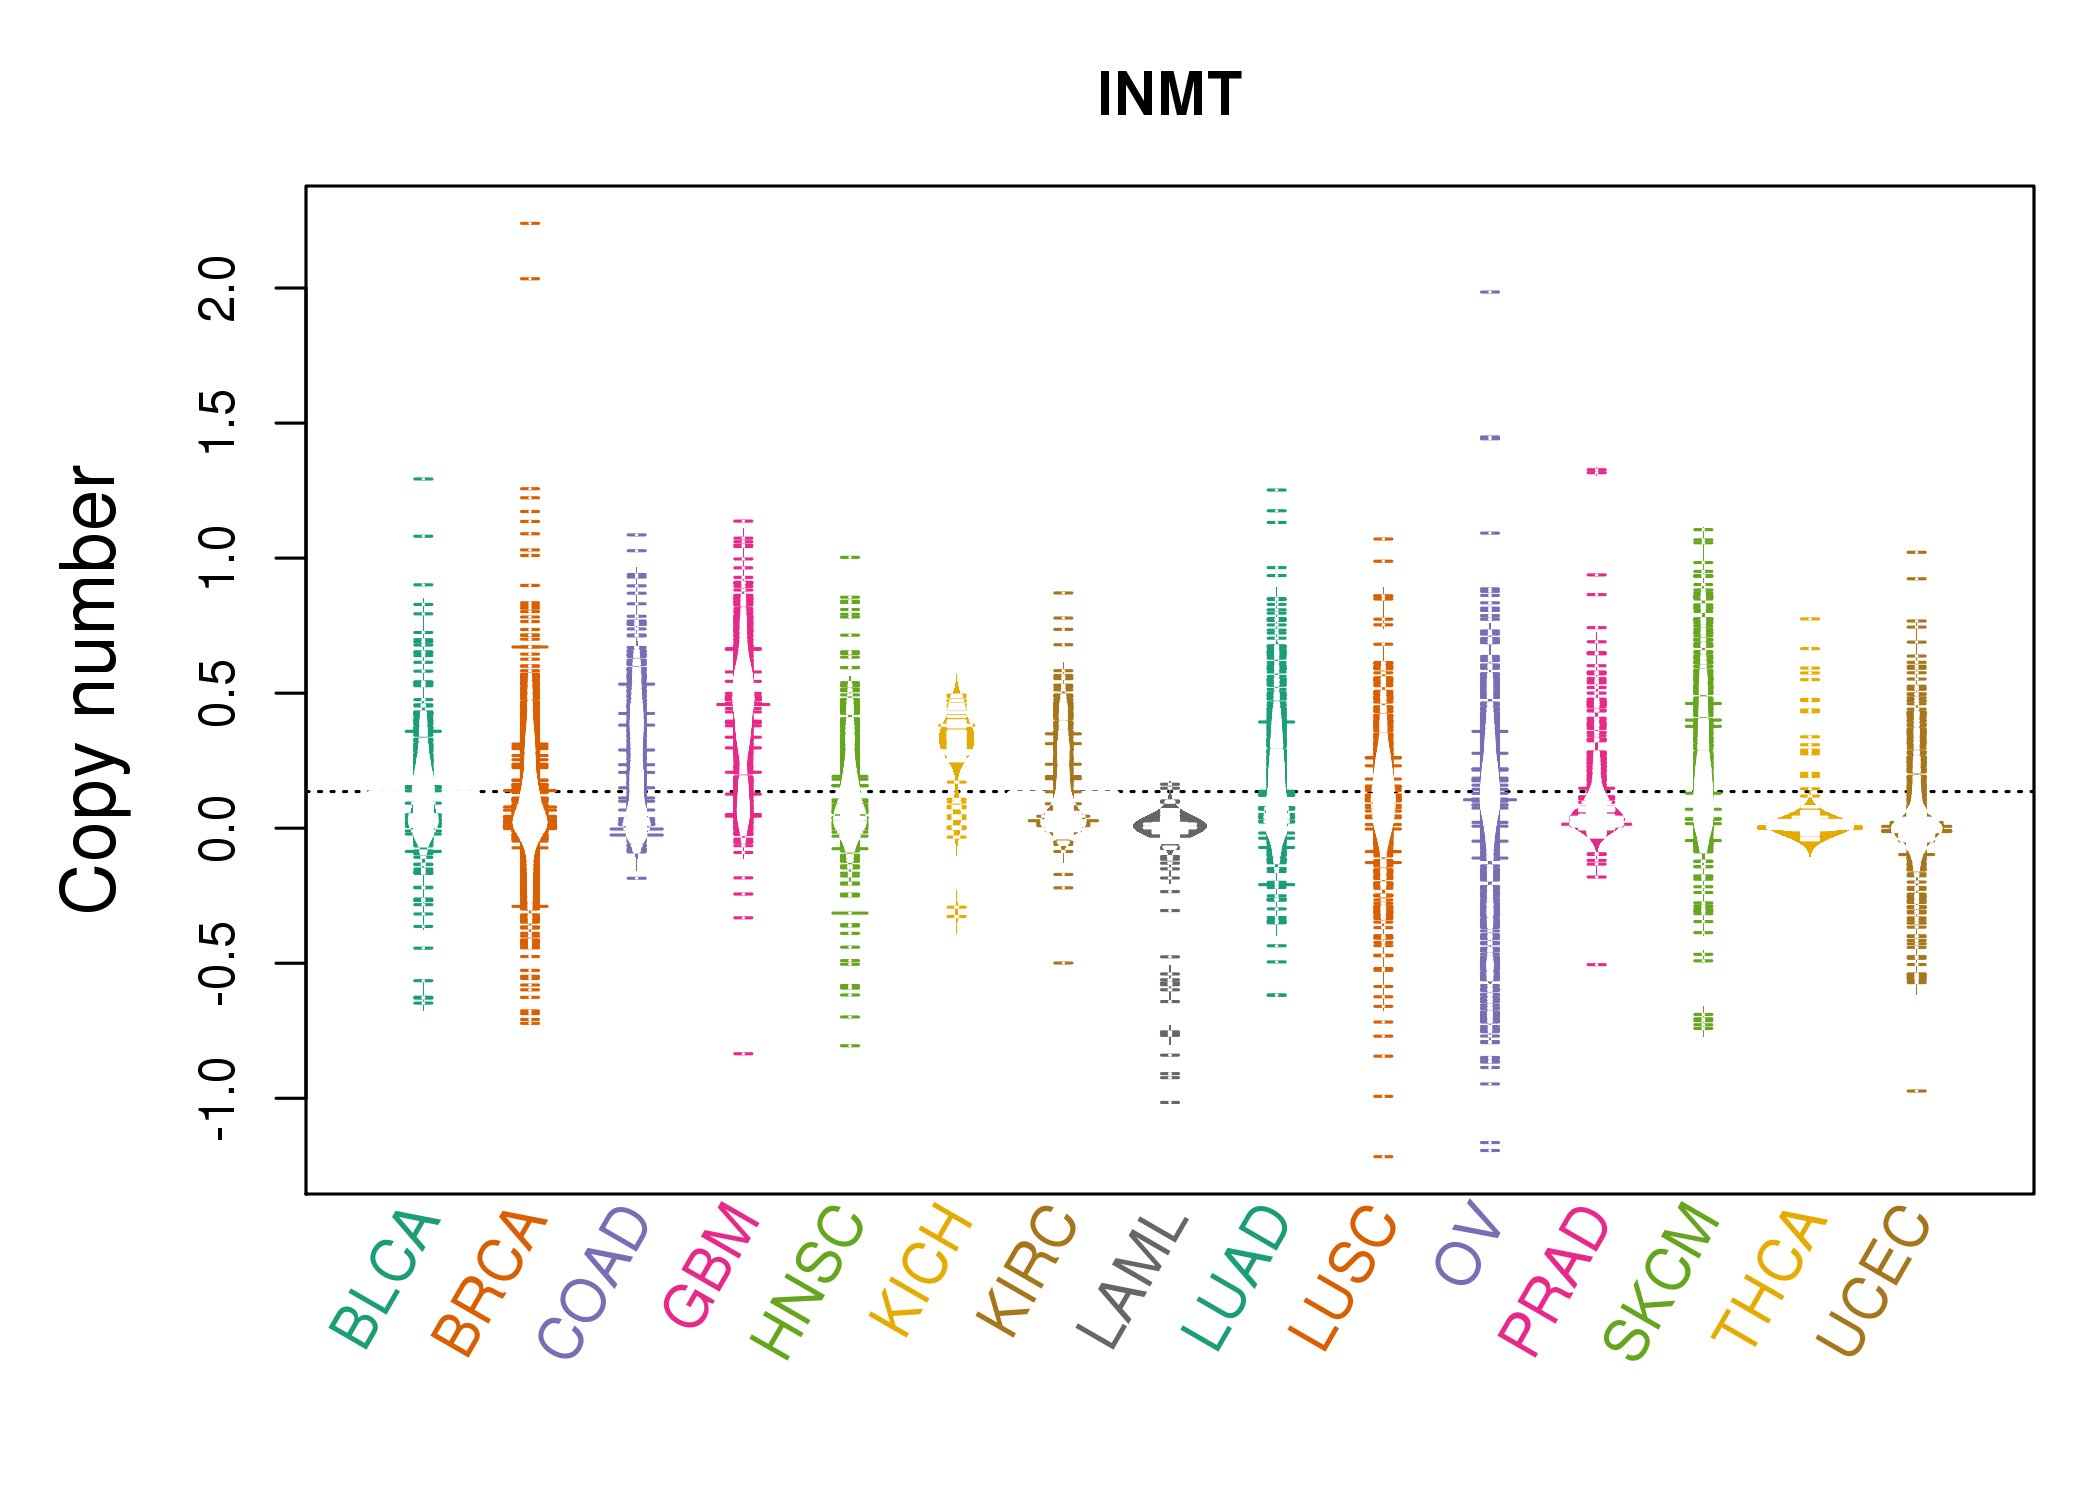 |
| cf) Tissue ID[Tissue type]: BLCA[Bladder Urothelial Carcinoma], BRCA[Breast invasive carcinoma], CESC[Cervical squamous cell carcinoma and endocervical adenocarcinoma], COAD[Colon adenocarcinoma], GBM[Glioblastoma multiforme], Glioma Low Grade, HNSC[Head and Neck squamous cell carcinoma], KICH[Kidney Chromophobe], KIRC[Kidney renal clear cell carcinoma], KIRP[Kidney renal papillary cell carcinoma], LAML[Acute Myeloid Leukemia], LUAD[Lung adenocarcinoma], LUSC[Lung squamous cell carcinoma], OV[Ovarian serous cystadenocarcinoma ], PAAD[Pancreatic adenocarcinoma], PRAD[Prostate adenocarcinoma], SKCM[Skin Cutaneous Melanoma], STAD[Stomach adenocarcinoma], THCA[Thyroid carcinoma], UCEC[Uterine Corpus Endometrial Carcinoma] |
| Top |
| Gene Expression for INMT |
| * CCLE gene expression data were extracted from CCLE_Expression_Entrez_2012-10-18.res: Gene-centric RMA-normalized mRNA expression data. |
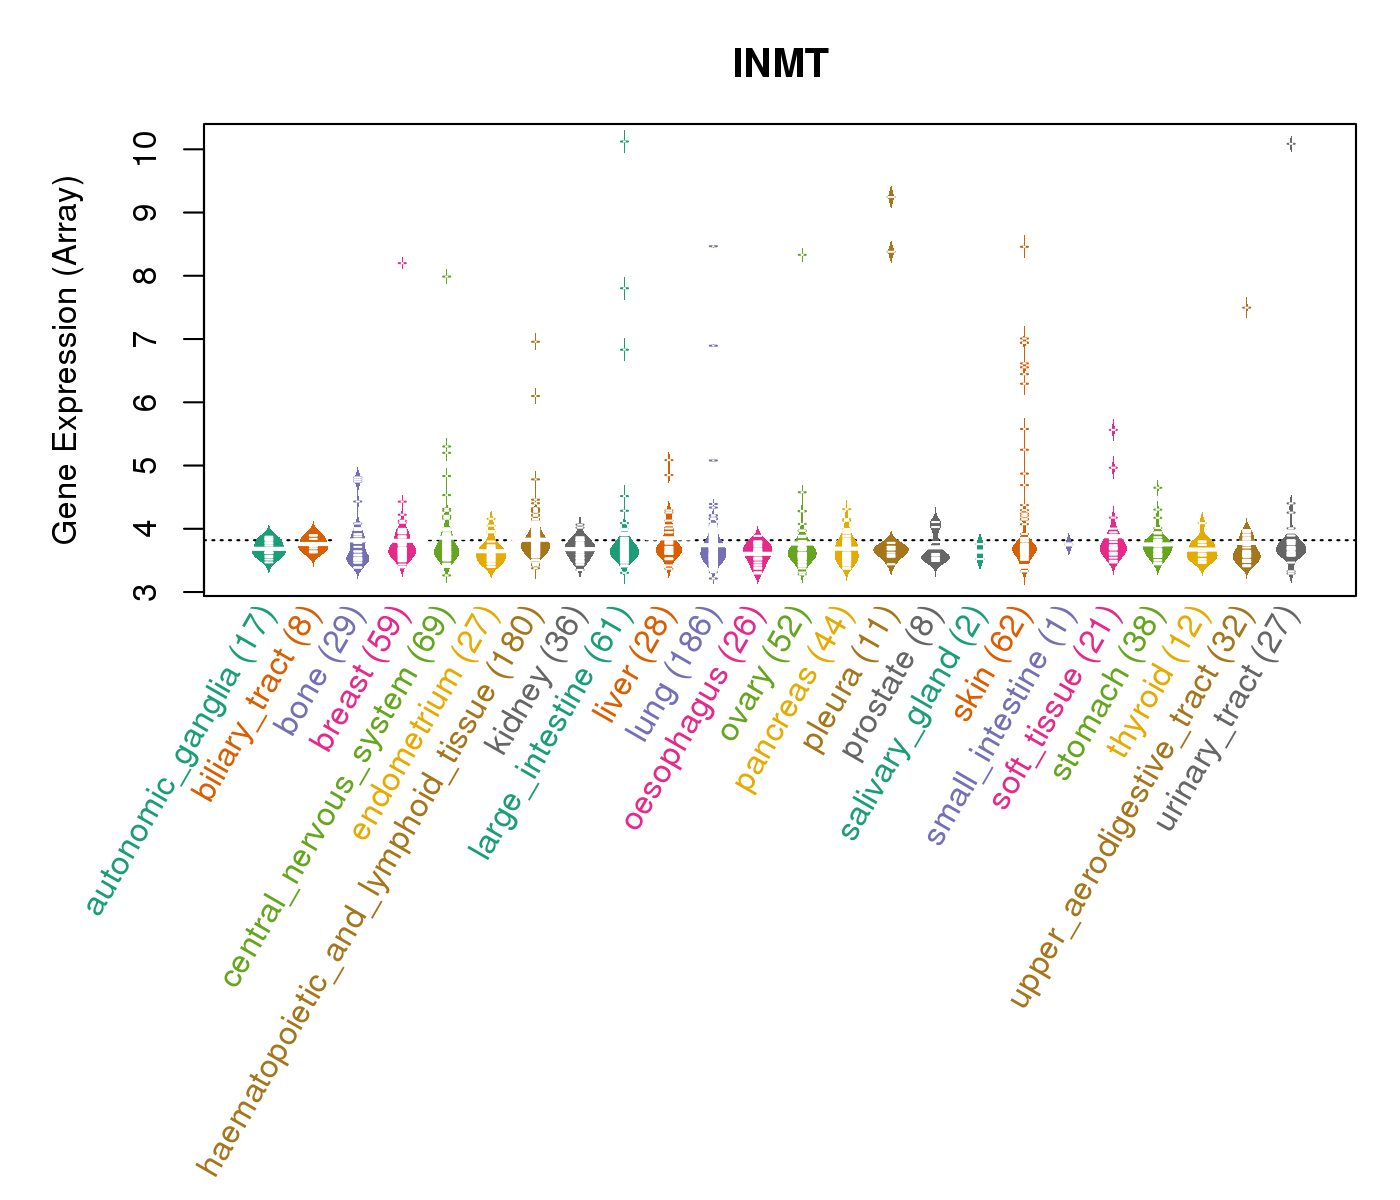 |
| * Normalized gene expression data of RNASeqV2 was extracted from TCGA using R package TCGA-Assembler. The URLs of all public data files on TCGA DCC data server were gathered at Jan-05-2015. Only eight cancer types have enough normal control samples for differential expression analysis. (t test, adjusted p<0.05 (using Benjamini-Hochberg FDR)) |
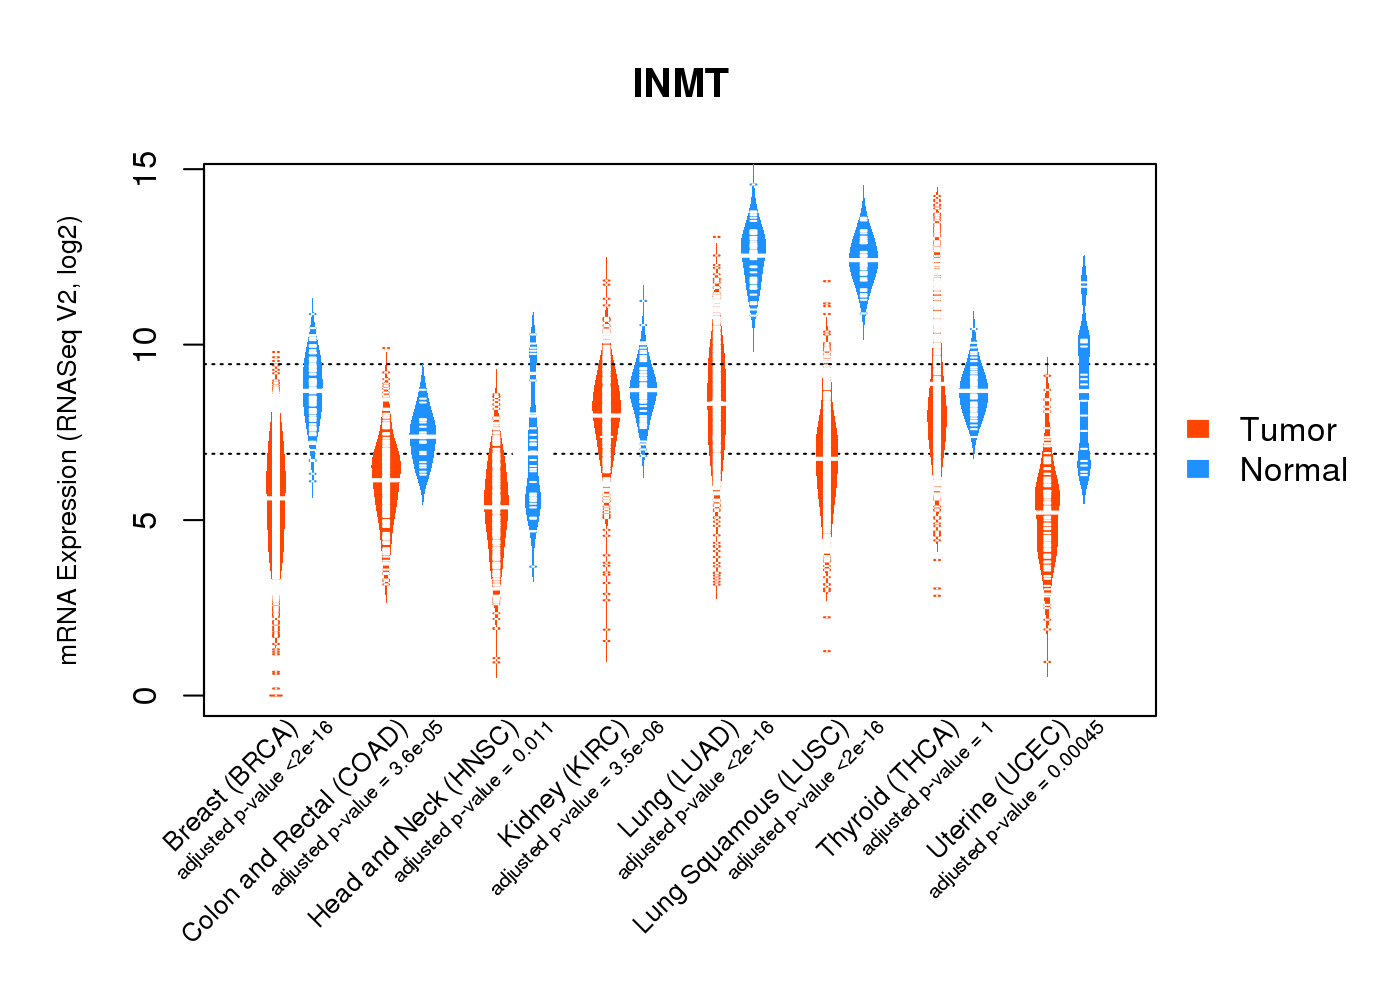 |
| Top |
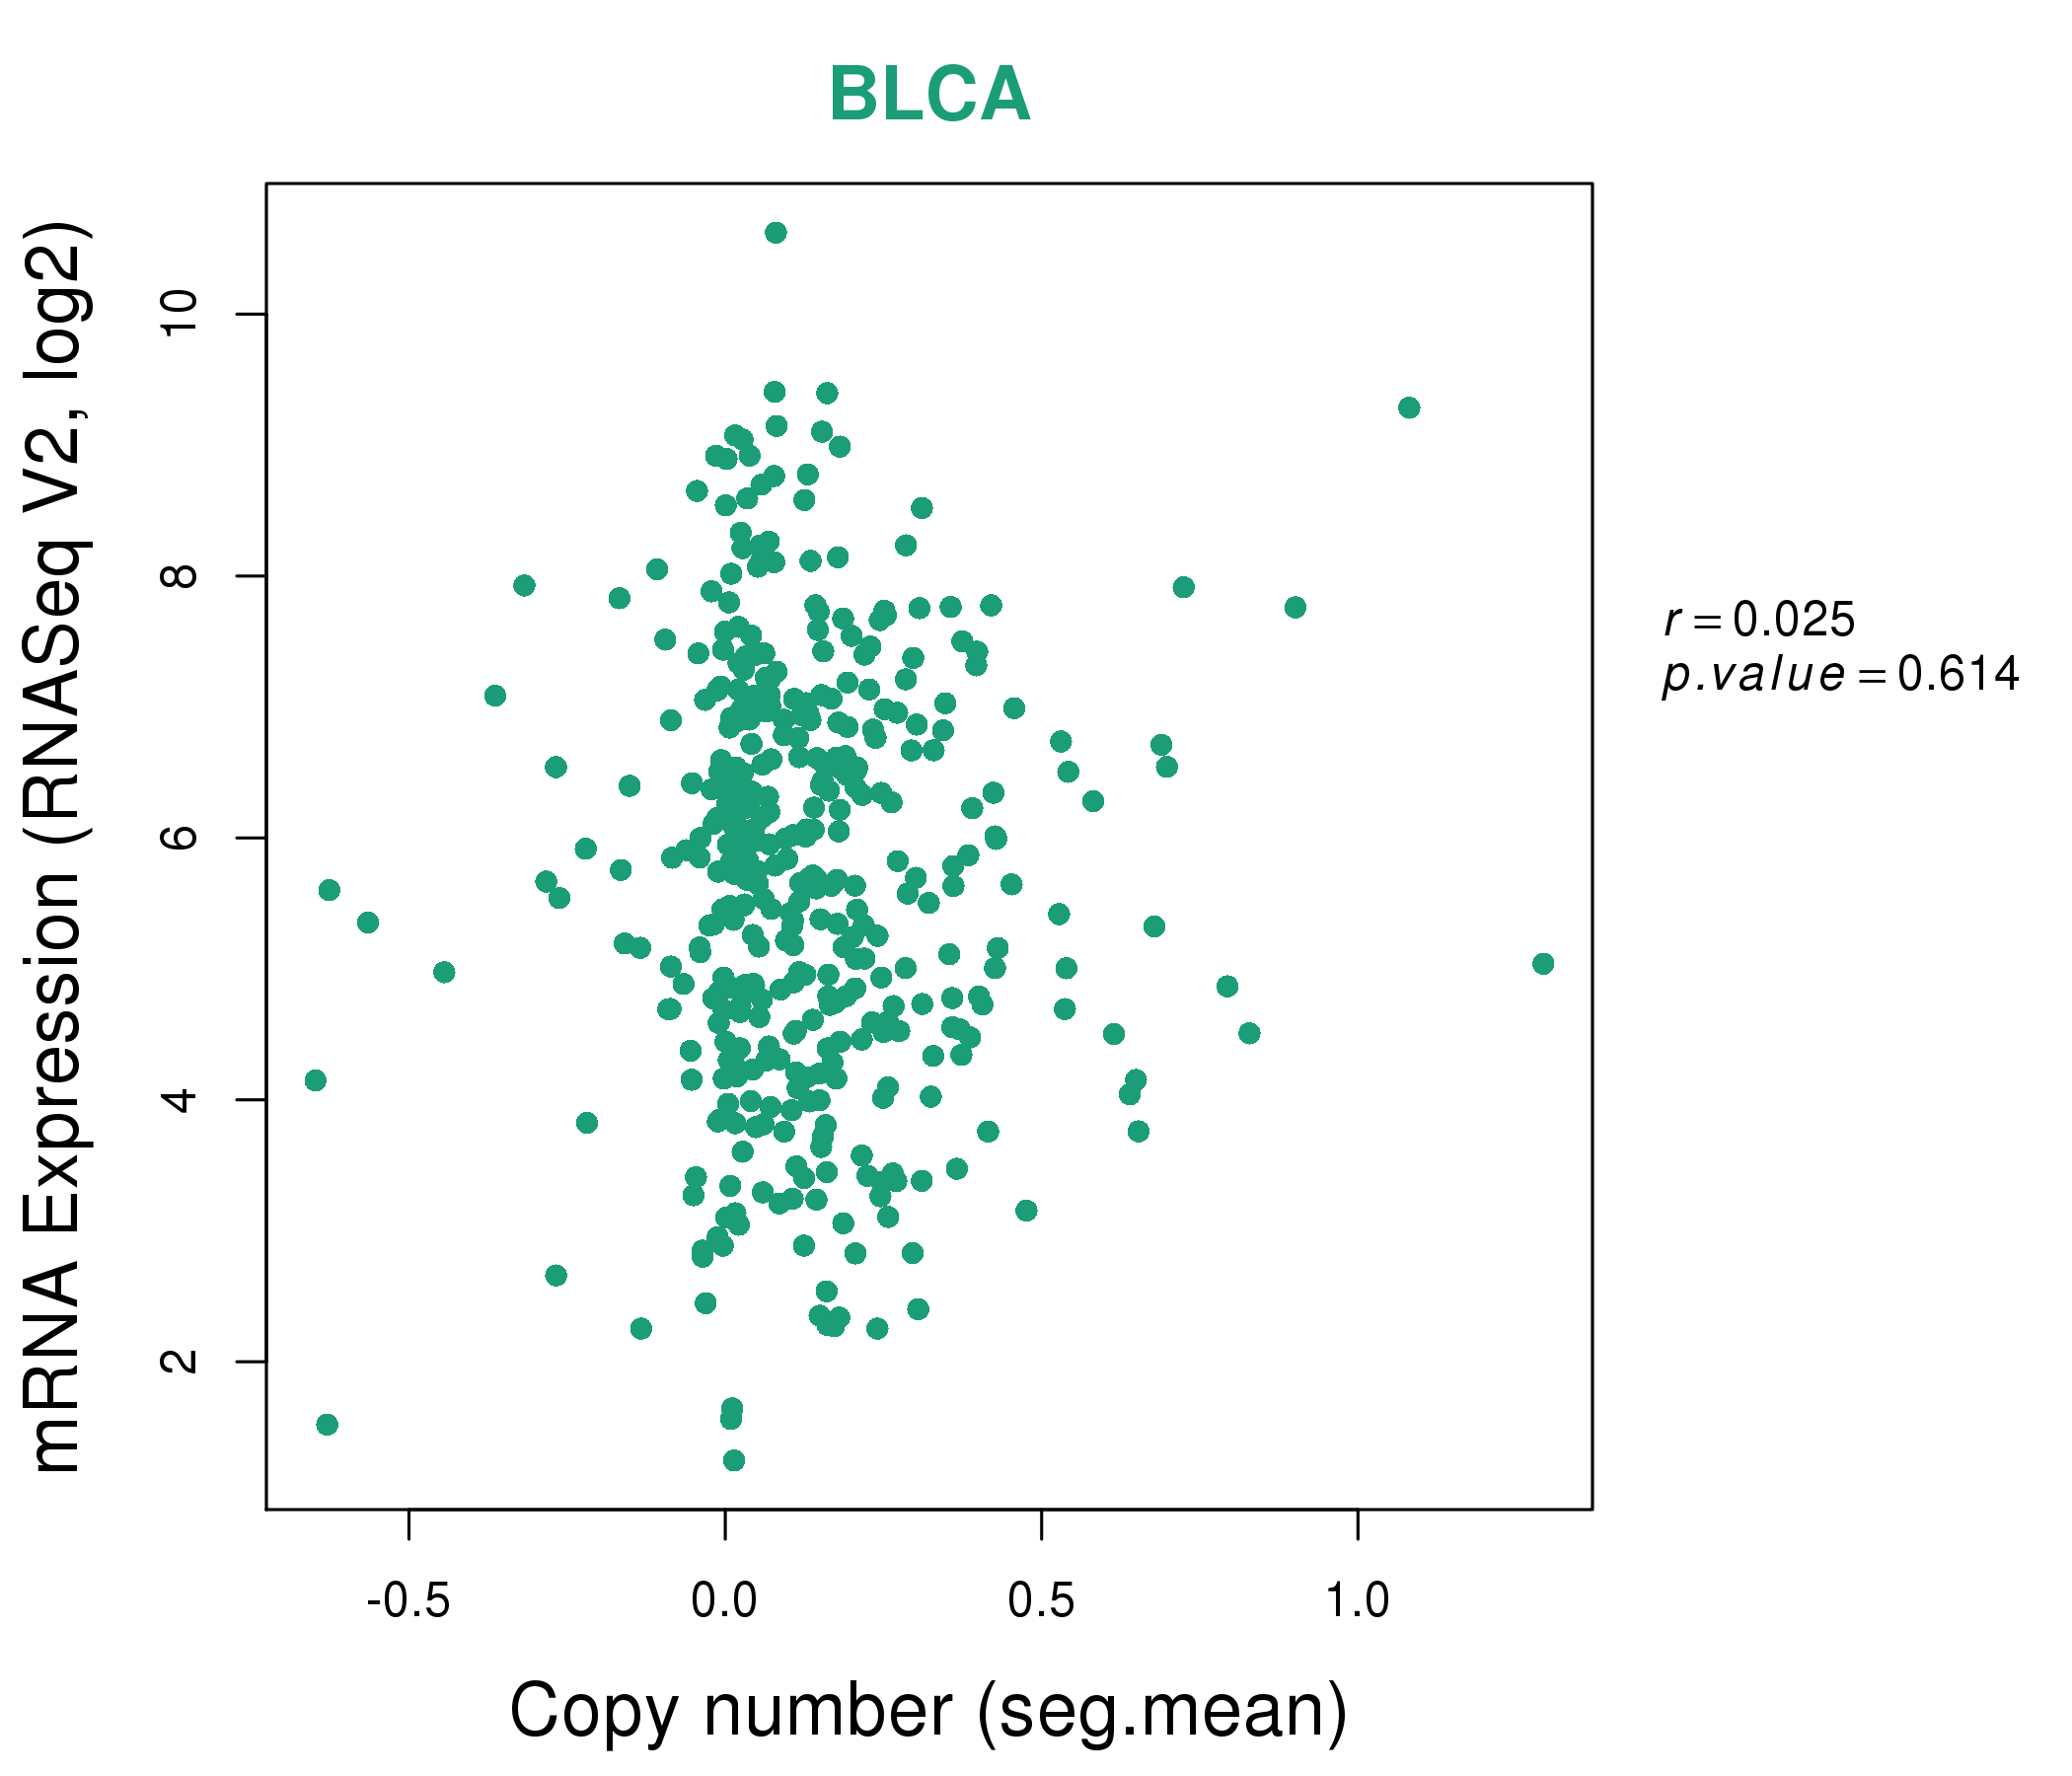
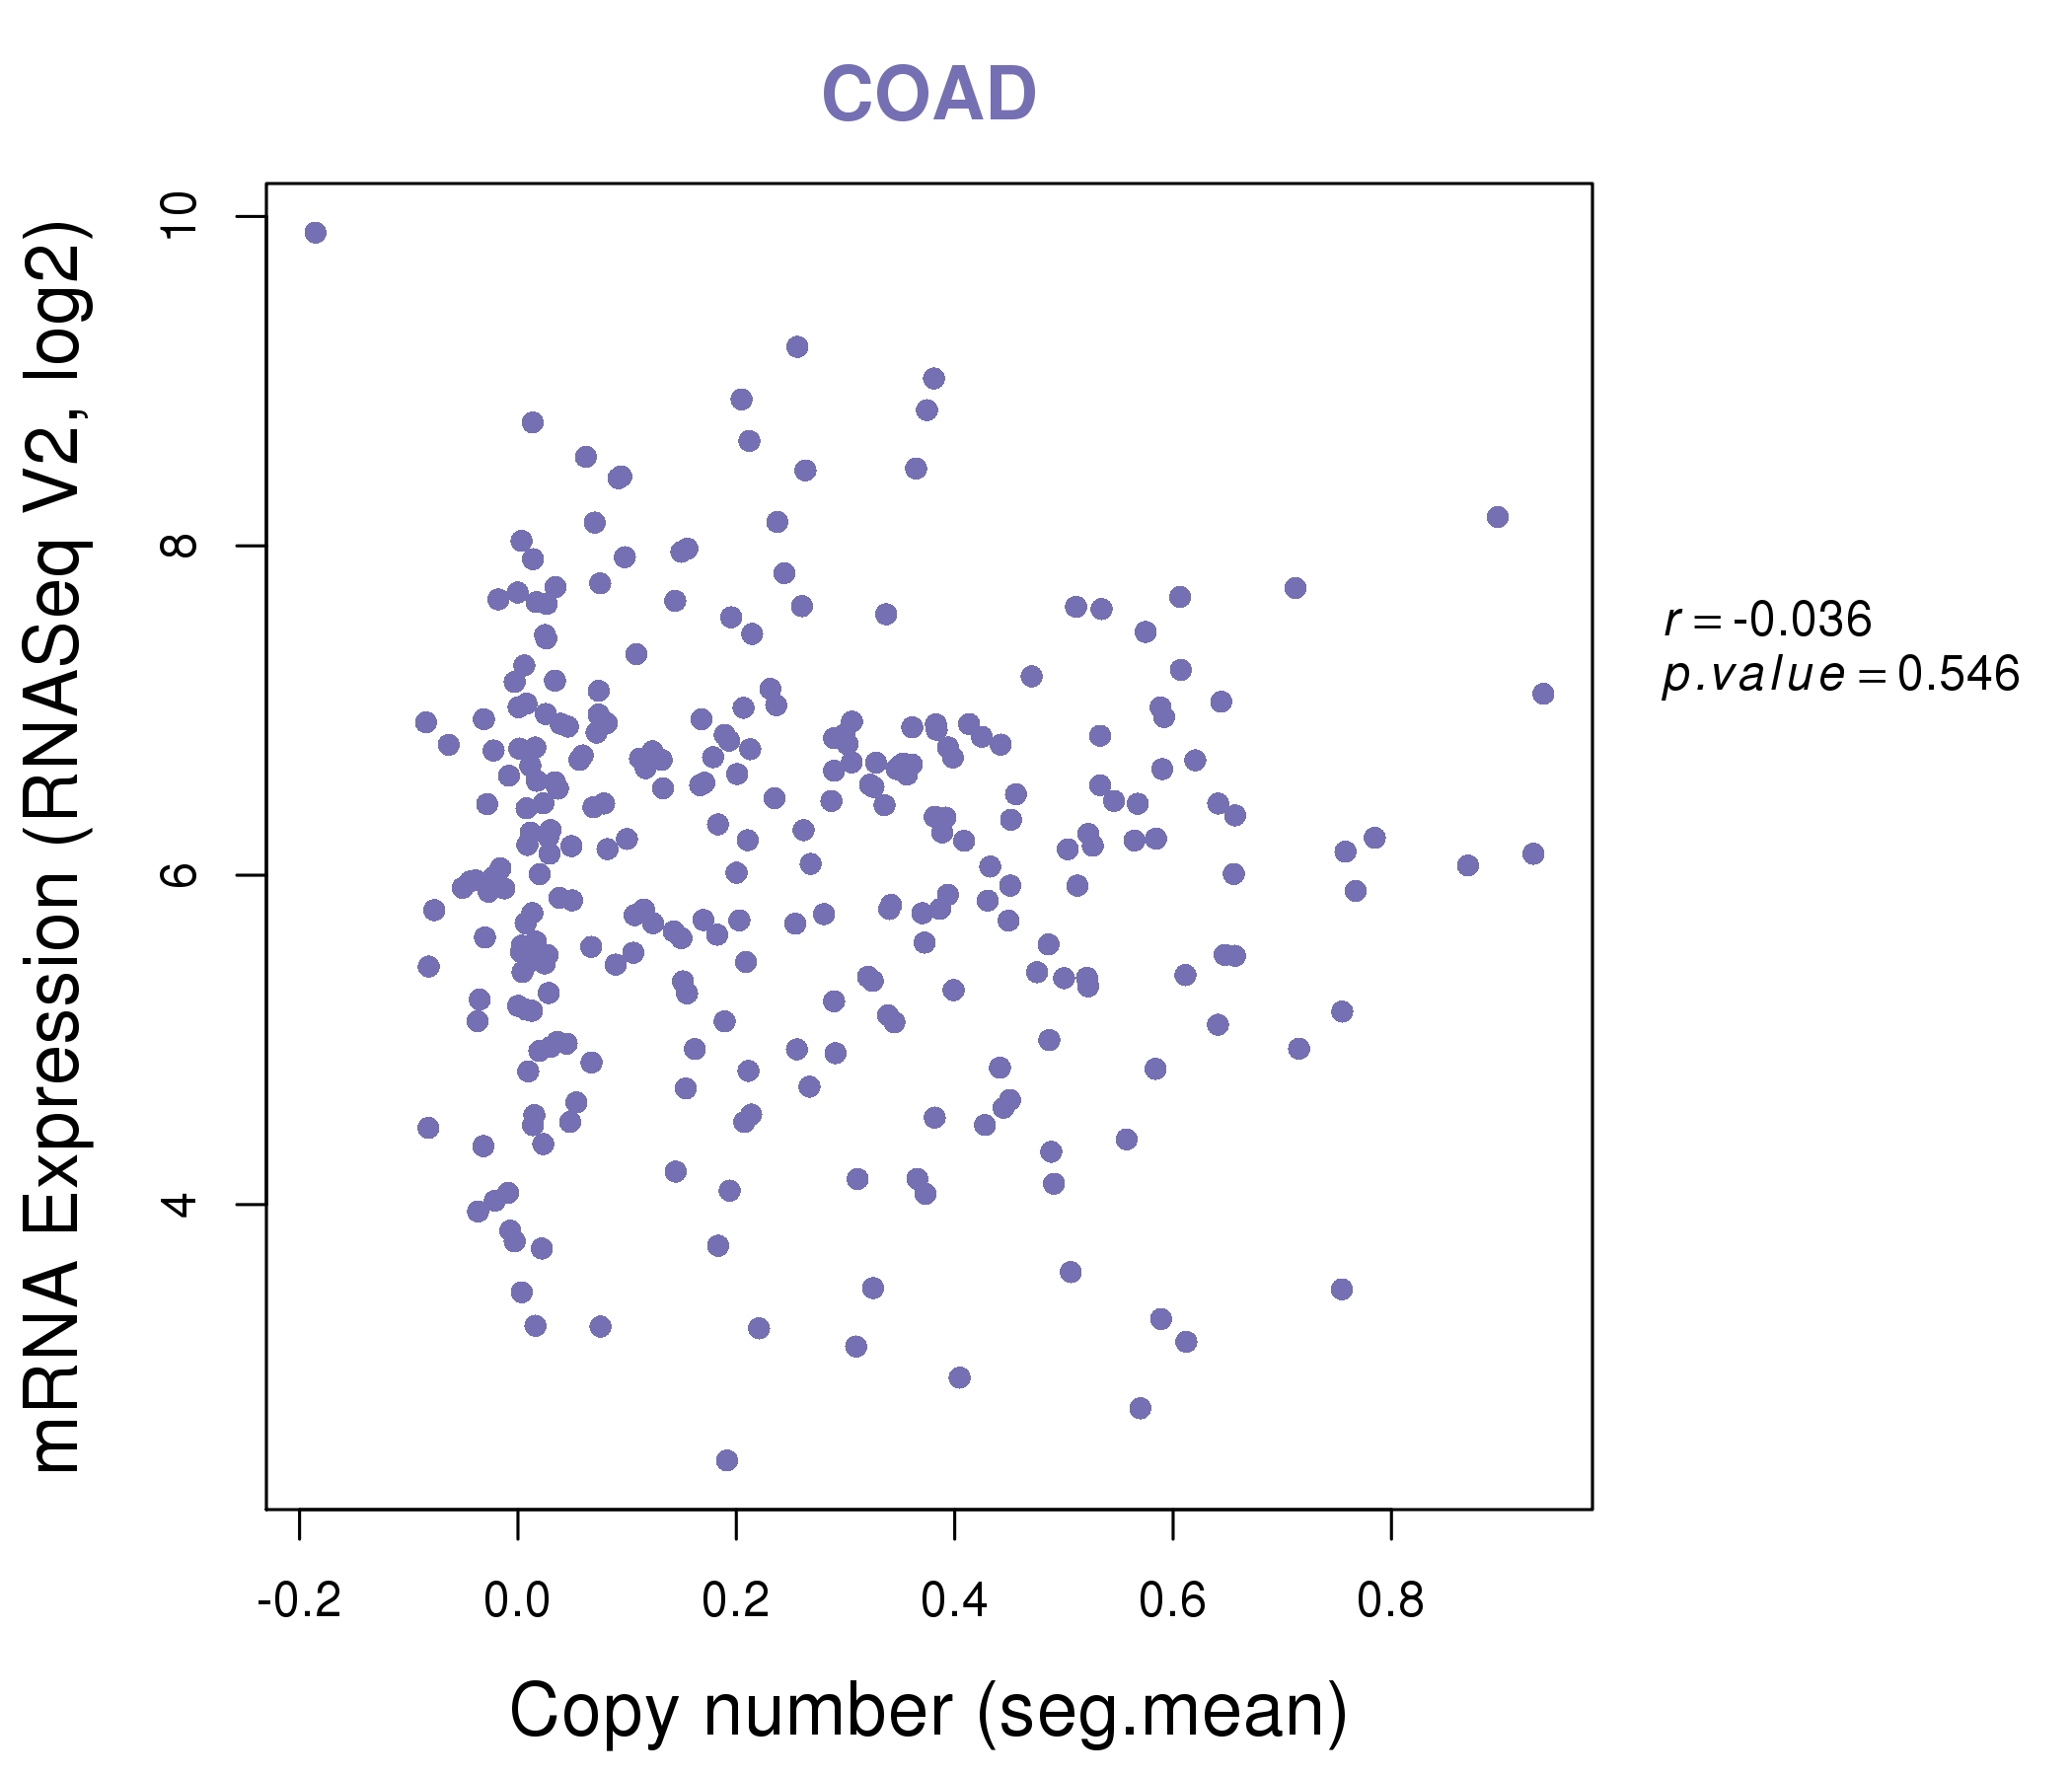
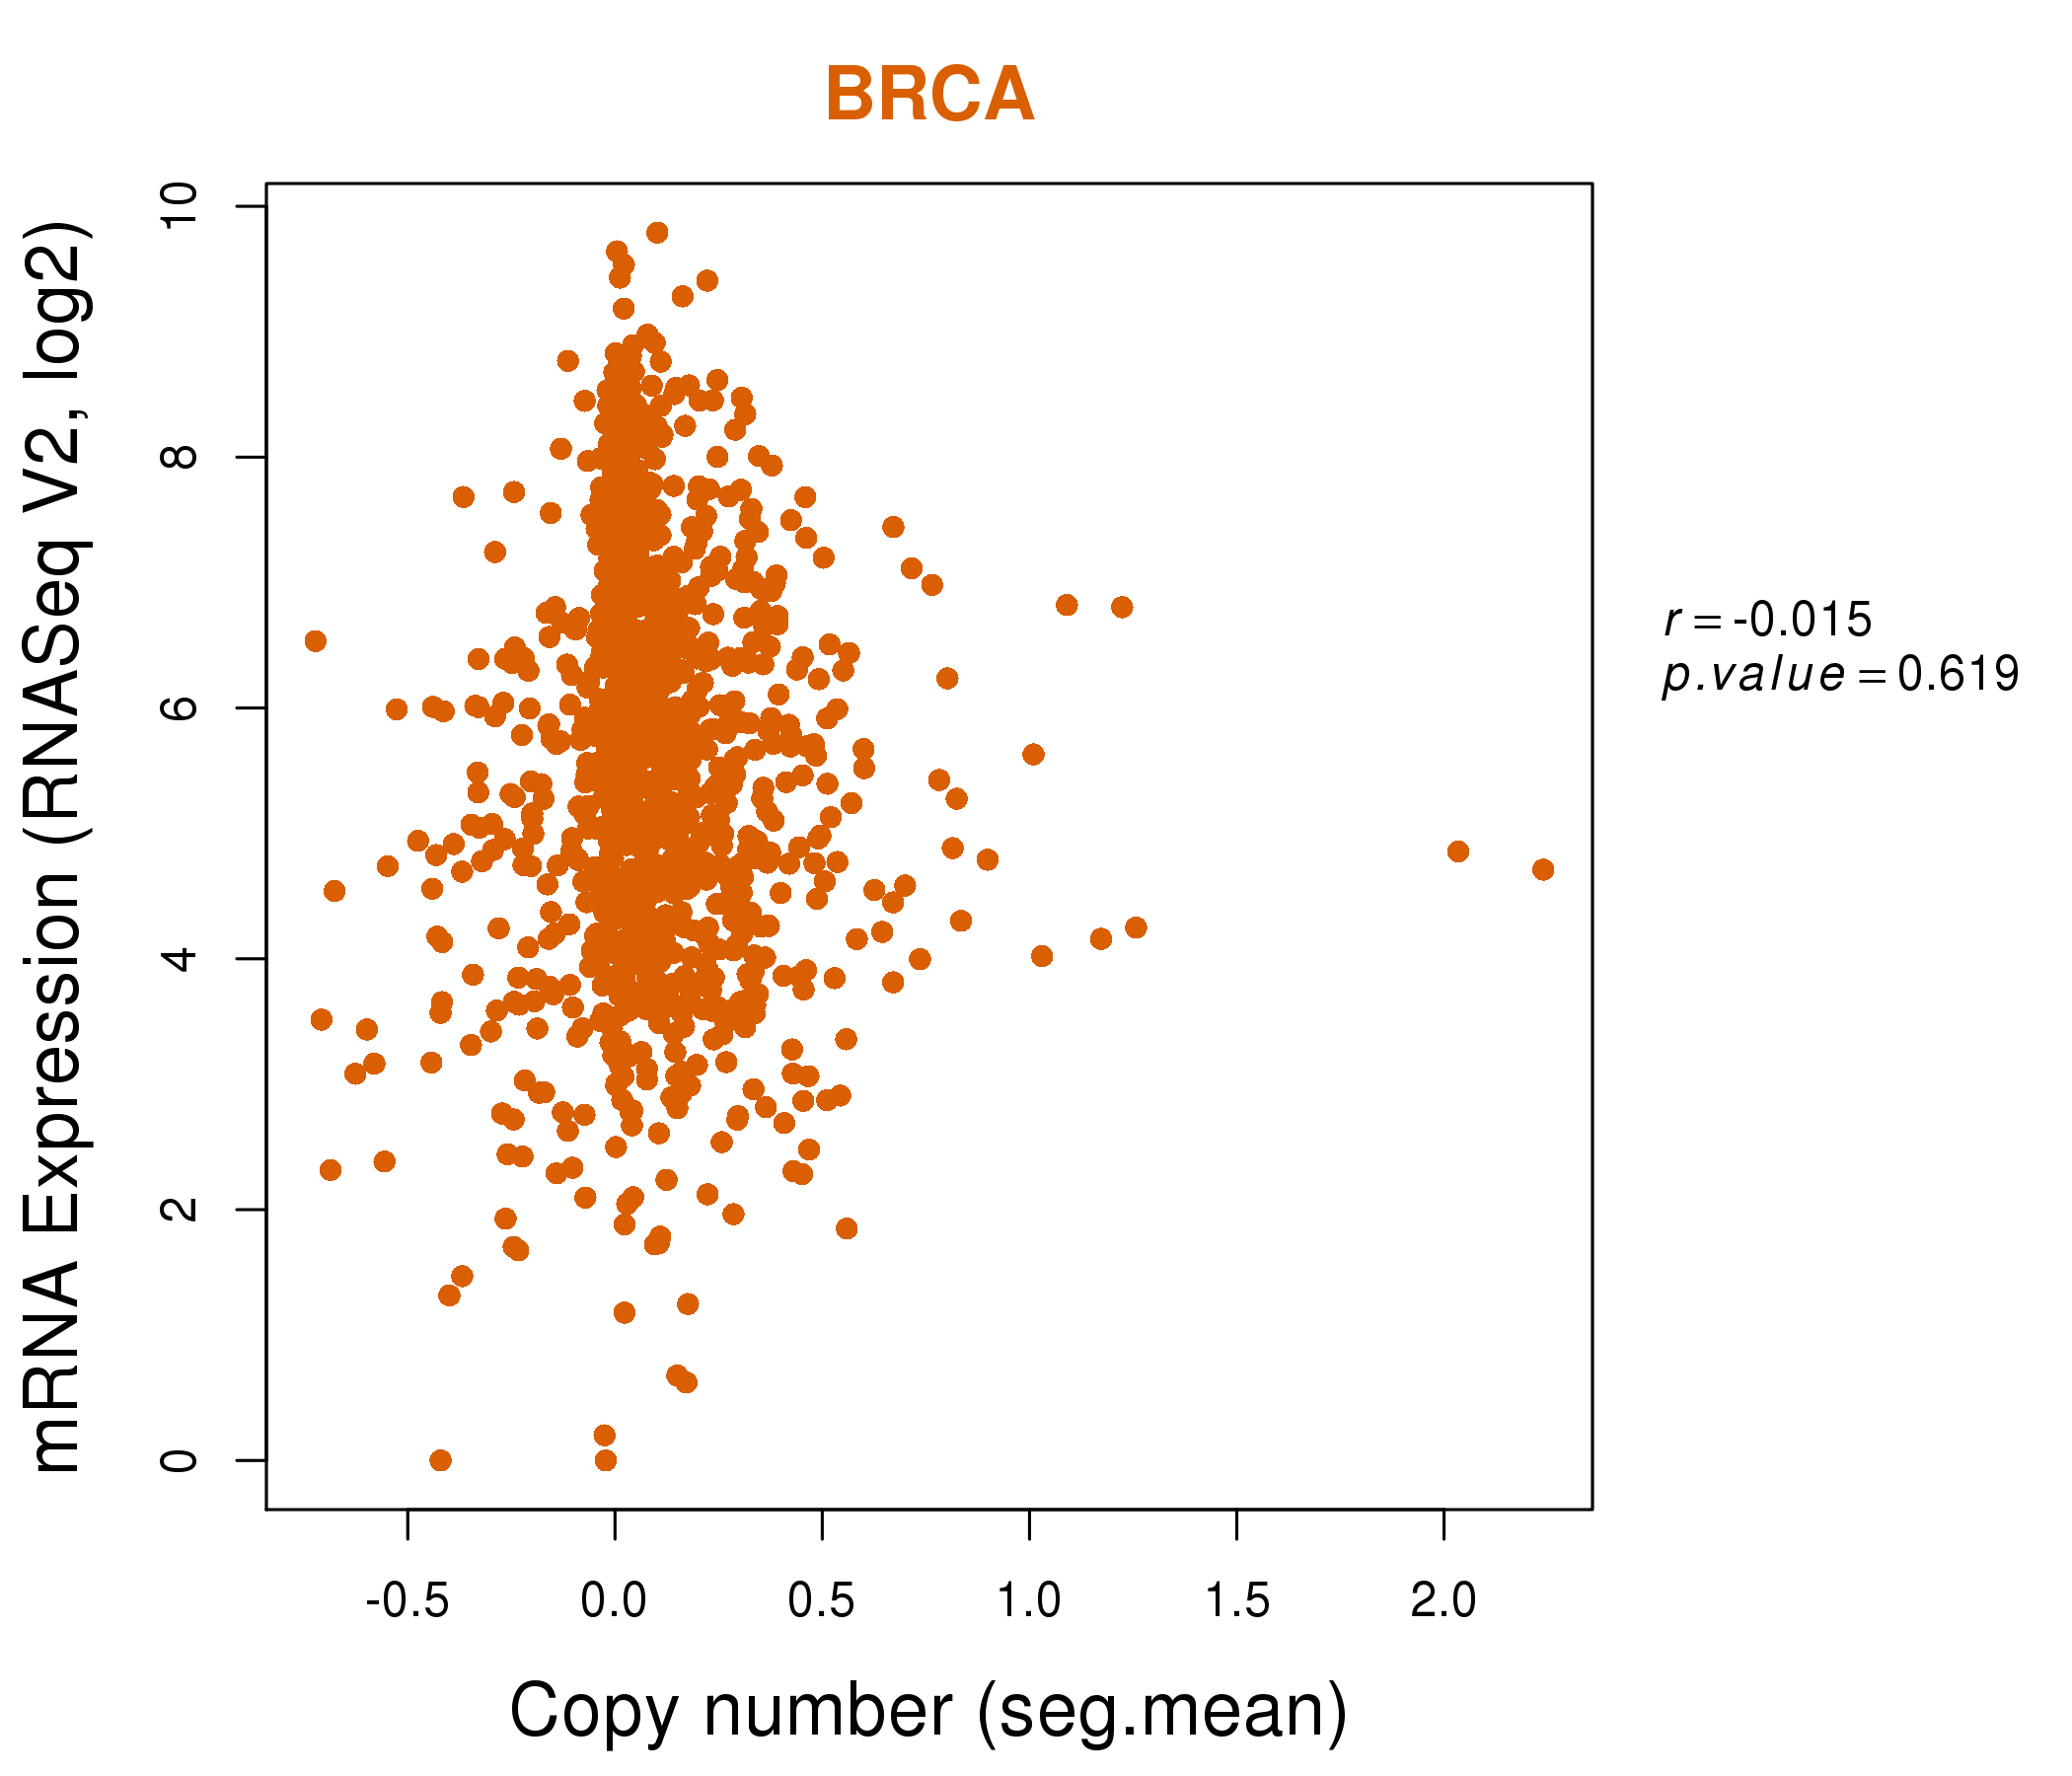
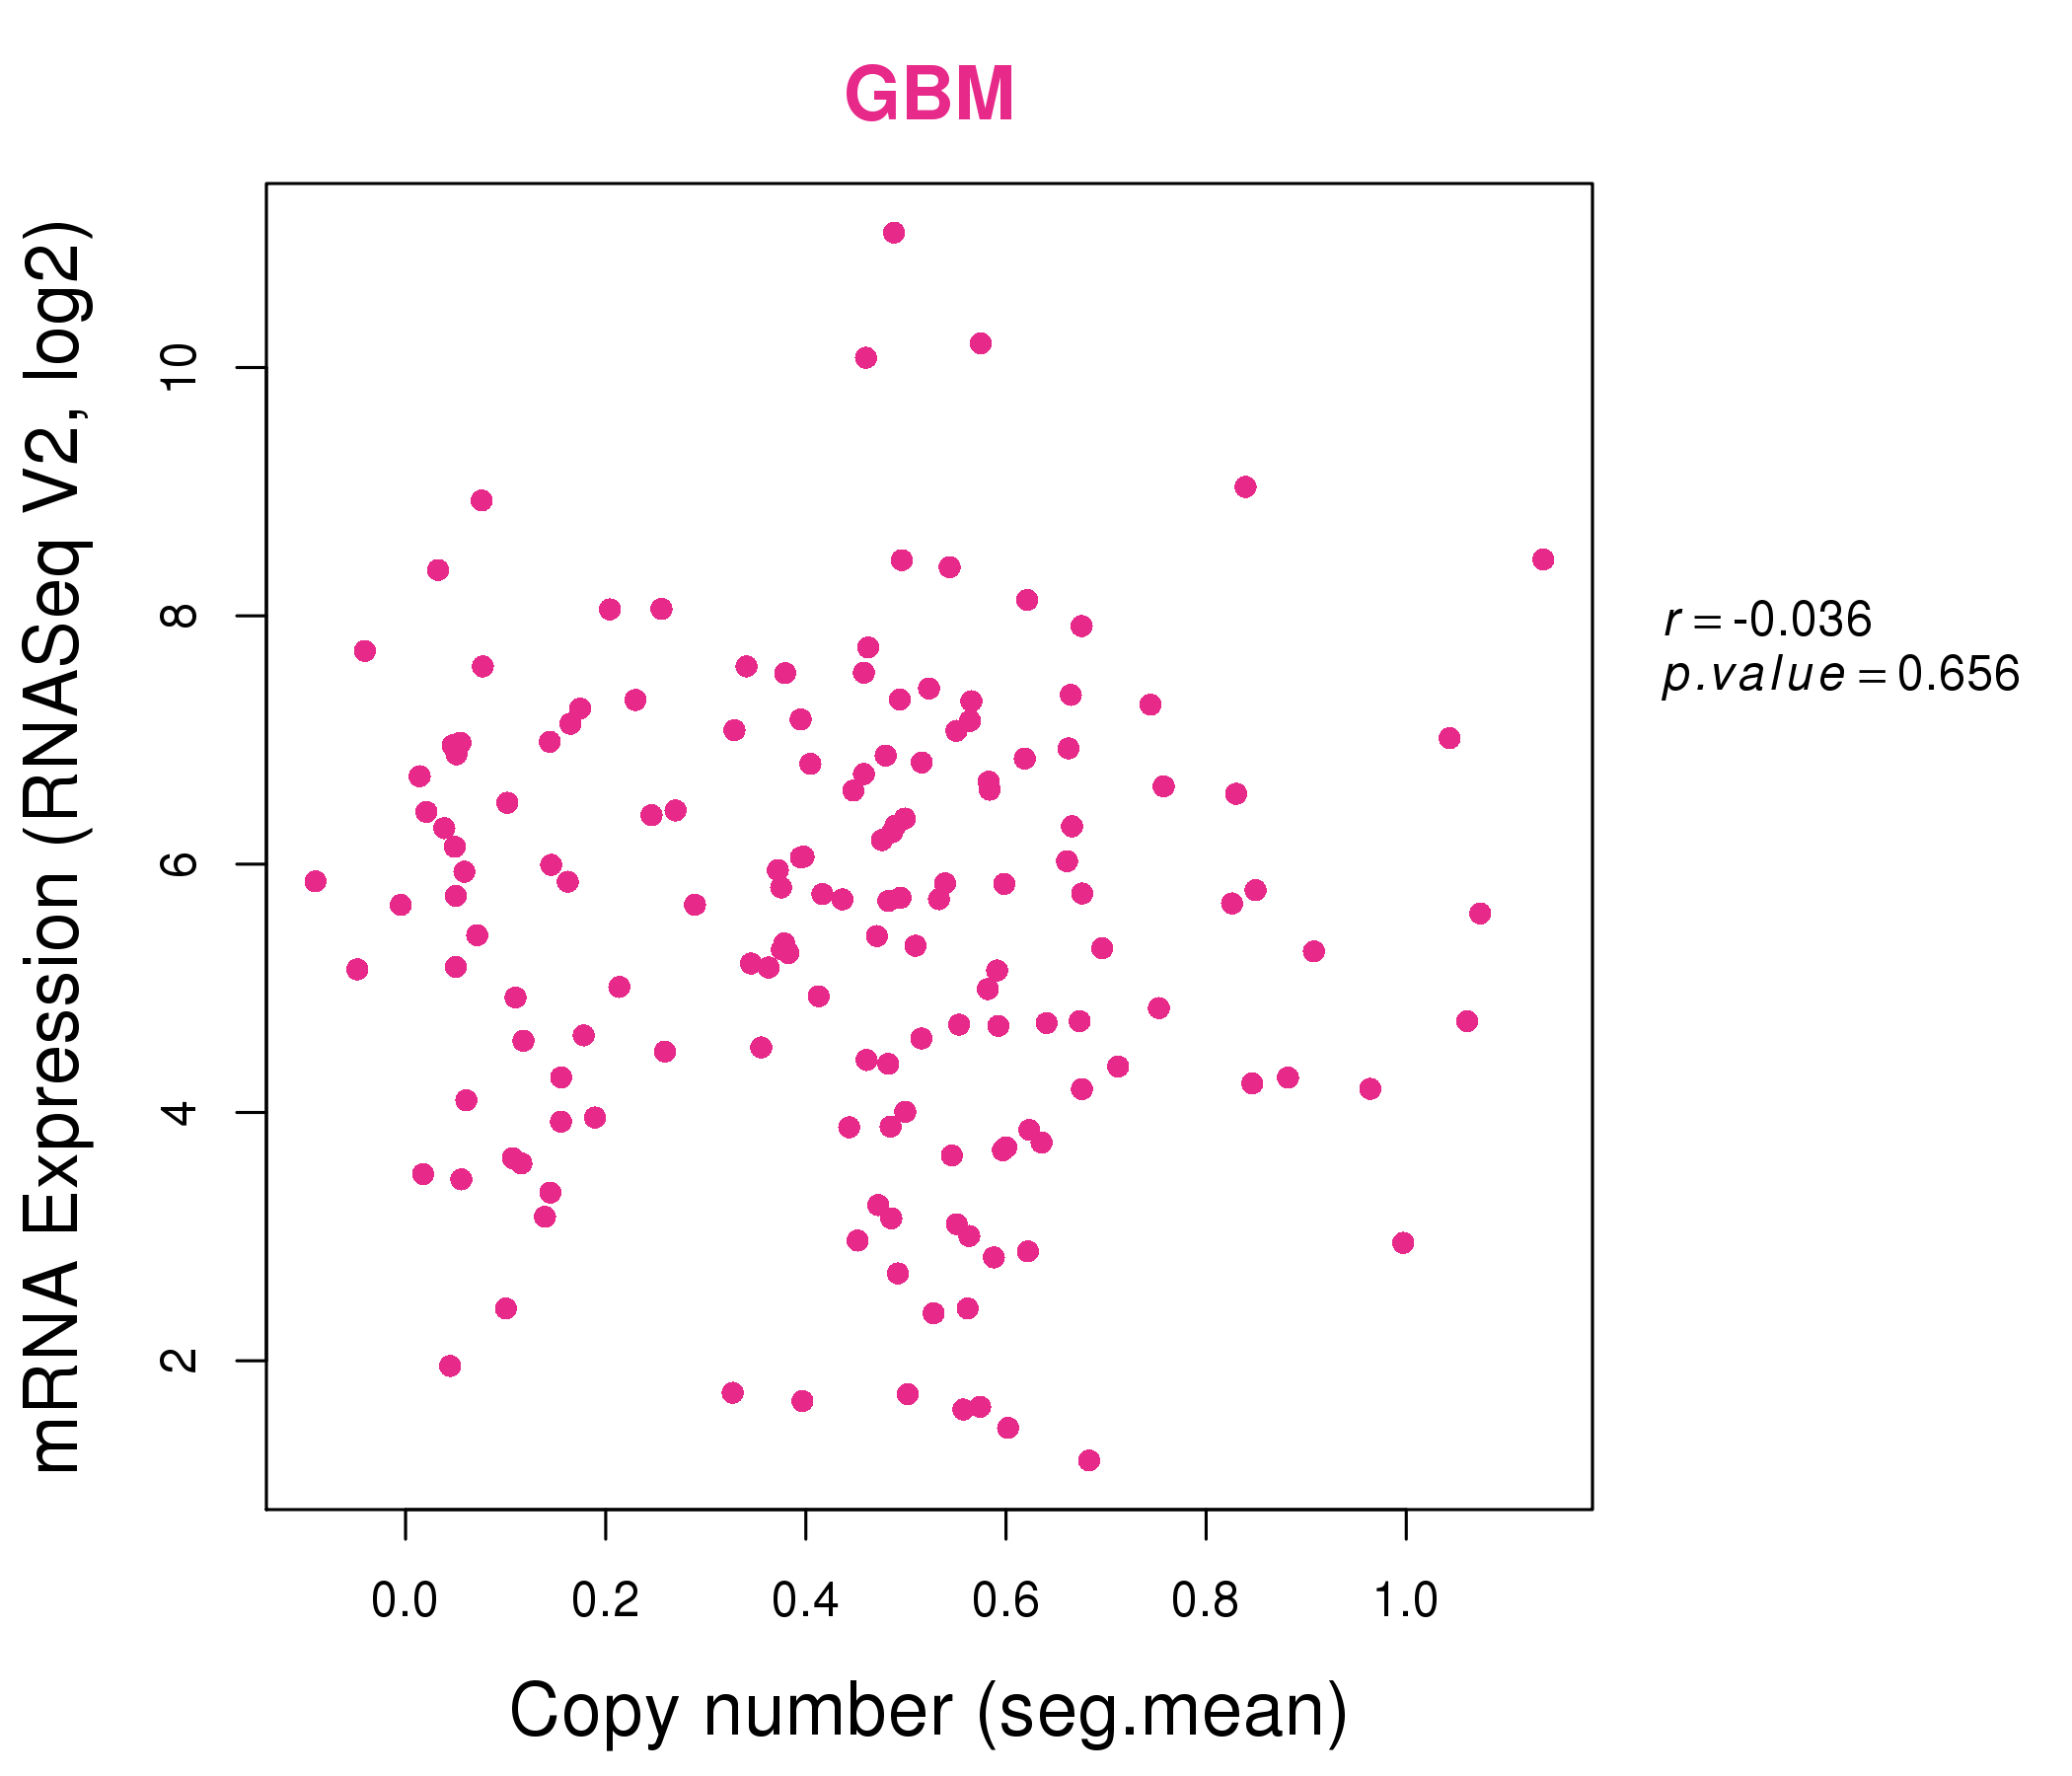
| * This plots show the correlation between CNV and gene expression. |
: Open all plots for all cancer types
 |
|
 |
|
| Top |
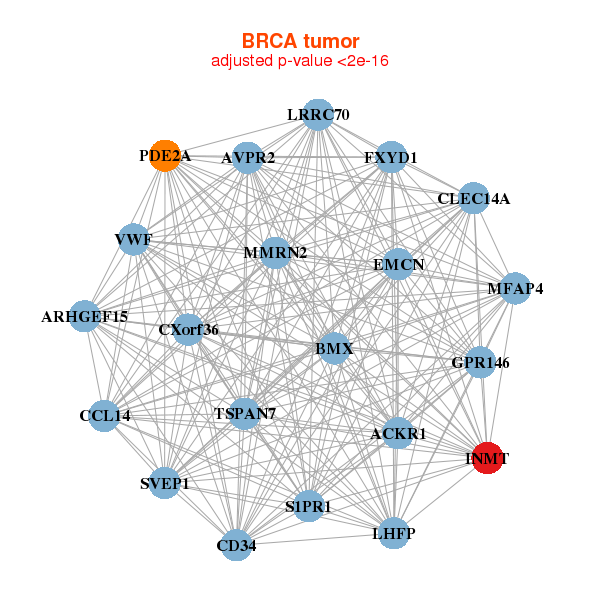
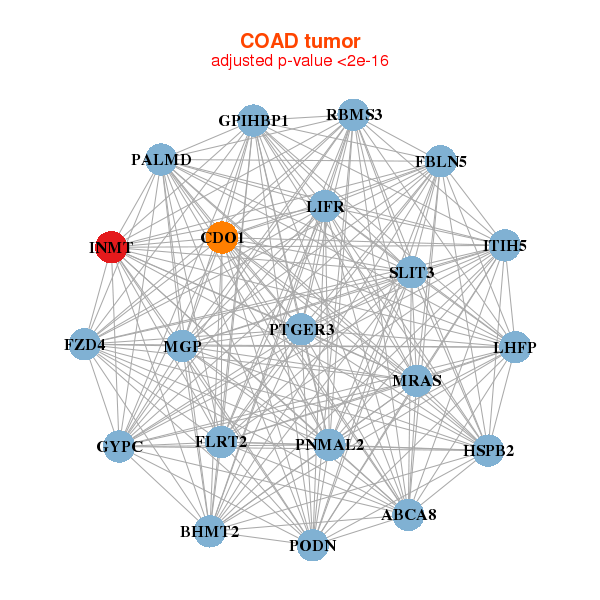
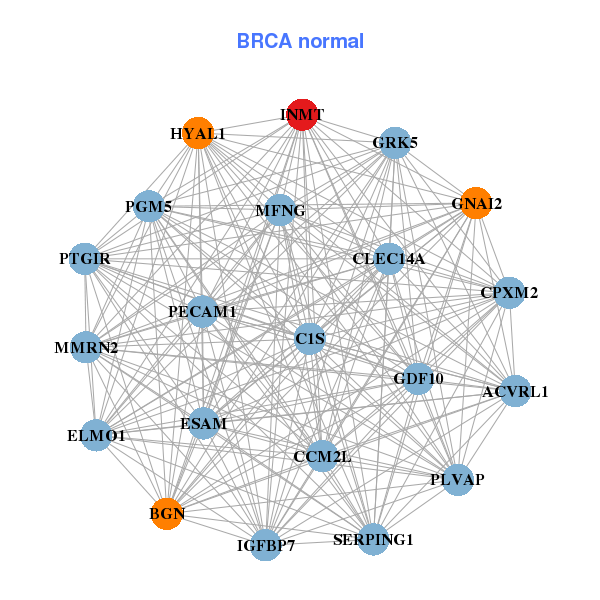
| Gene-Gene Network Information |
| * Co-Expression network figures were drawn using R package igraph. Only the top 20 genes with the highest correlations were shown. Red circle: input gene, orange circle: cell metabolism gene, sky circle: other gene |
: Open all plots for all cancer types
 |
|
| ARHGEF15,AVPR2,BMX,CCL14,CD34,CLEC14A,CXorf36, ACKR1,EMCN,FXYD1,GPR146,INMT,LHFP,LRRC70, MFAP4,MMRN2,PDE2A,S1PR1,SVEP1,TSPAN7,VWF | ACVRL1,BGN,C1S,CCM2L,CLEC14A,CPXM2,ELMO1, ESAM,GDF10,GNAI2,GRK5,HYAL1,IGFBP7,INMT, MFNG,MMRN2,PECAM1,PGM5,PLVAP,PTGIR,SERPING1 |
 |
|
| ABCA8,BHMT2,CDO1,FBLN5,FLRT2,FZD4,GPIHBP1, GYPC,HSPB2,INMT,ITIH5,LHFP,LIFR,MGP, MRAS,PALMD,PNMAL2,PODN,PTGER3,RBMS3,SLIT3 | AKAP12,BRSK1,C15orf59,CADM3,CREB5,ECM2,FAIM2, FNDC5,GDF1,GPR133,GRB10,INMT,ITPKB,LONRF2, MMP17,MTUS2,NMNAT2,NTN1,PALM,RFX2,ZMAT4 |
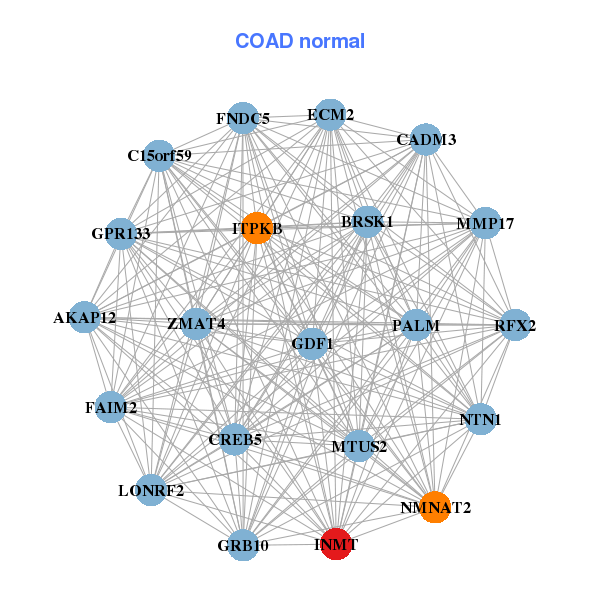
| * Co-Expression network figures were drawn using R package igraph. Only the top 20 genes with the highest correlations were shown. Red circle: input gene, orange circle: cell metabolism gene, sky circle: other gene |
: Open all plots for all cancer types
| Top |
: Open all interacting genes' information including KEGG pathway for all interacting genes from DAVID
| Top |
| Pharmacological Information for INMT |
| There's no related Drug. |
| Top |
| Cross referenced IDs for INMT |
| * We obtained these cross-references from Uniprot database. It covers 150 different DBs, 18 categories. http://www.uniprot.org/help/cross_references_section |
: Open all cross reference information
|
Copyright © 2016-Present - The Univsersity of Texas Health Science Center at Houston @ |