|
||||||||||||||||||||
| |
| Phenotypic Information (metabolism pathway, cancer, disease, phenome) |
| |
| |
| Gene-Gene Network Information: Co-Expression Network, Interacting Genes & KEGG |
| |
|


| Gene Summary for DDX20 |
| Basic gene info. | Gene symbol | DDX20 |
| Gene name | DEAD (Asp-Glu-Ala-Asp) box polypeptide 20 | |
| Synonyms | DP103|GEMIN3 | |
| Cytomap | UCSC genome browser: 1p21.1-p13.2 | |
| Genomic location | chr1 :112298189-112310199 | |
| Type of gene | protein-coding | |
| RefGenes | NM_007204.4, | |
| Ensembl id | ENSG00000064703 | |
| Description | DEAD box protein 20DEAD box protein DP 103DEAD-box protein DP103DEAD/H (Asp-Glu-Ala-Asp/His) box polypeptide 20, 103kDSMN-interacting proteincomponent of gems 3gemin-3probable ATP-dependent RNA helicase DDX20 | |
| Modification date | 20141207 | |
| dbXrefs | MIM : 606168 | |
| HGNC : HGNC | ||
| Ensembl : ENSG00000064703 | ||
| HPRD : 05859 | ||
| Vega : OTTHUMG00000011956 | ||
| Protein | UniProt: go to UniProt's Cross Reference DB Table | |
| Expression | CleanEX: HS_DDX20 | |
| BioGPS: 11218 | ||
| Gene Expression Atlas: ENSG00000064703 | ||
| The Human Protein Atlas: ENSG00000064703 | ||
| Pathway | NCI Pathway Interaction Database: DDX20 | |
| KEGG: DDX20 | ||
| REACTOME: DDX20 | ||
| ConsensusPathDB | ||
| Pathway Commons: DDX20 | ||
| Metabolism | MetaCyc: DDX20 | |
| HUMANCyc: DDX20 | ||
| Regulation | Ensembl's Regulation: ENSG00000064703 | |
| miRBase: chr1 :112,298,189-112,310,199 | ||
| TargetScan: NM_007204 | ||
| cisRED: ENSG00000064703 | ||
| Context | iHOP: DDX20 | |
| cancer metabolism search in PubMed: DDX20 | ||
| UCL Cancer Institute: DDX20 | ||
| Assigned class in ccmGDB | C | |
| Top |
| Phenotypic Information for DDX20(metabolism pathway, cancer, disease, phenome) |
| Cancer | CGAP: DDX20 |
| Familial Cancer Database: DDX20 | |
| * This gene is included in those cancer gene databases. |
|
|
|
|
|
| . | ||||||||||||||
Oncogene 1 | Significant driver gene in | |||||||||||||||||||
| cf) number; DB name 1 Oncogene; http://nar.oxfordjournals.org/content/35/suppl_1/D721.long, 2 Tumor Suppressor gene; https://bioinfo.uth.edu/TSGene/, 3 Cancer Gene Census; http://www.nature.com/nrc/journal/v4/n3/abs/nrc1299.html, 4 CancerGenes; http://nar.oxfordjournals.org/content/35/suppl_1/D721.long, 5 Network of Cancer Gene; http://ncg.kcl.ac.uk/index.php, 1Therapeutic Vulnerabilities in Cancer; http://cbio.mskcc.org/cancergenomics/statius/ |
| REACTOME_METABOLISM_OF_NON_CODING_RNA REACTOME_METABOLISM_OF_RNA | |
| OMIM | |
| Orphanet | |
| Disease | KEGG Disease: DDX20 |
| MedGen: DDX20 (Human Medical Genetics with Condition) | |
| ClinVar: DDX20 | |
| Phenotype | MGI: DDX20 (International Mouse Phenotyping Consortium) |
| PhenomicDB: DDX20 | |
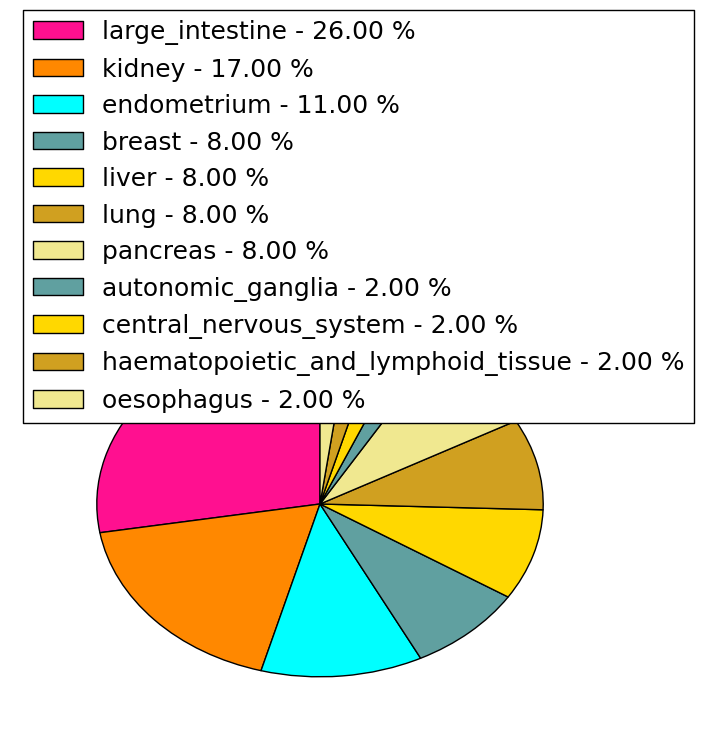
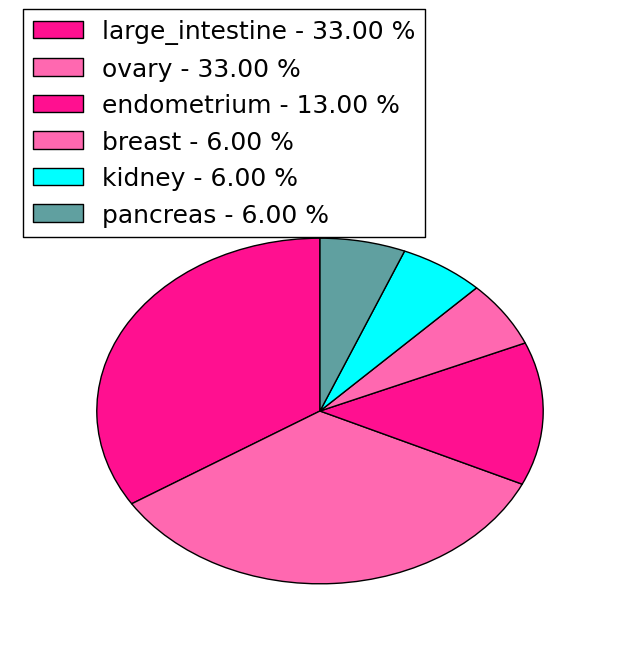
| Mutations for DDX20 |
| * Under tables are showing count per each tissue to give us broad intuition about tissue specific mutation patterns.You can go to the detailed page for each mutation database's web site. |
| - Statistics for Tissue and Mutation type | Top |
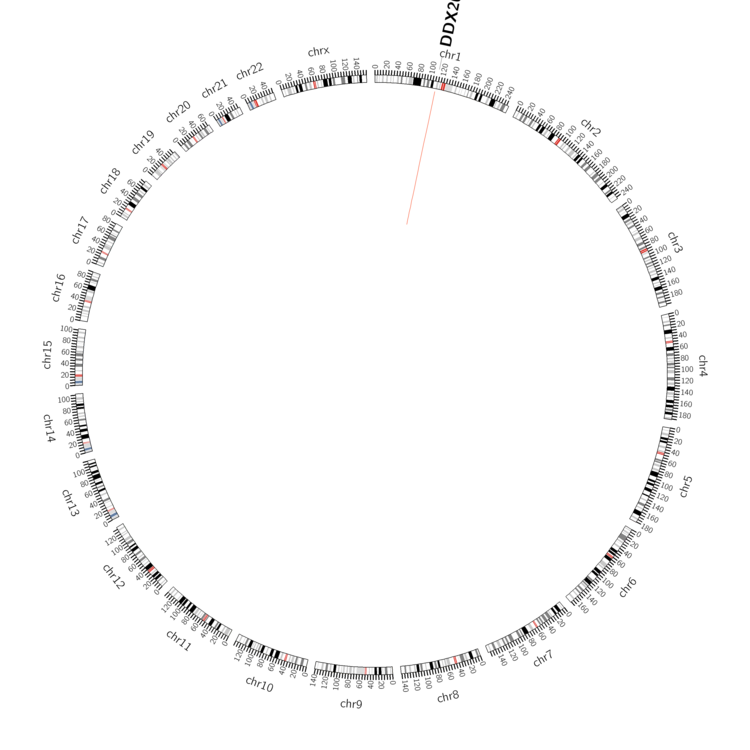 |
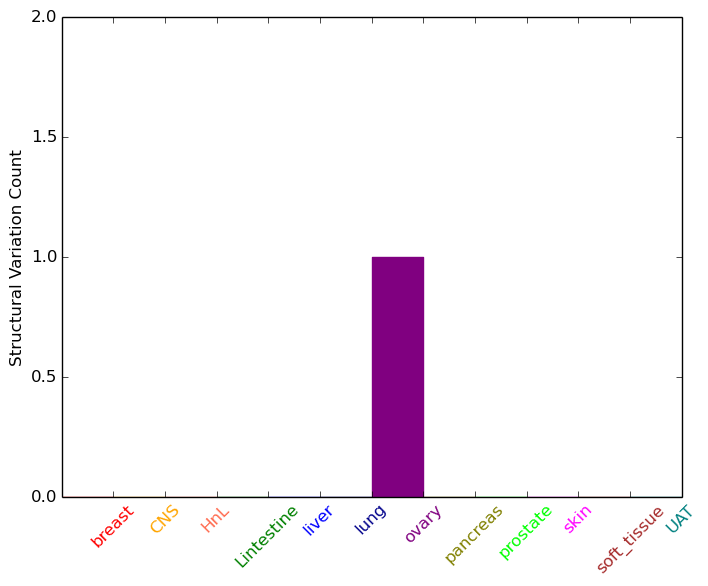
| - For Inter-chromosomal Variations |
| There's no inter-chromosomal structural variation. |
| - For Intra-chromosomal Variations |
| * Intra-chromosomal variantions includes 'intrachromosomal amplicon to amplicon', 'intrachromosomal amplicon to non-amplified dna', 'intrachromosomal deletion', 'intrachromosomal fold-back inversion', 'intrachromosomal inversion', 'intrachromosomal tandem duplication', 'Intrachromosomal unknown type', 'intrachromosomal with inverted orientation', 'intrachromosomal with non-inverted orientation'. |
 |
| Sample | Symbol_a | Chr_a | Start_a | End_a | Symbol_b | Chr_b | Start_b | End_b |
| ovary | DDX20 | chr1 | 112299278 | 112299298 | DDX20 | chr1 | 112299560 | 112299580 |
| cf) Tissue number; Tissue name (1;Breast, 2;Central_nervous_system, 3;Haematopoietic_and_lymphoid_tissue, 4;Large_intestine, 5;Liver, 6;Lung, 7;Ovary, 8;Pancreas, 9;Prostate, 10;Skin, 11;Soft_tissue, 12;Upper_aerodigestive_tract) |
| * From mRNA Sanger sequences, Chitars2.0 arranged chimeric transcripts. This table shows DDX20 related fusion information. |
| ID | Head Gene | Tail Gene | Accession | Gene_a | qStart_a | qEnd_a | Chromosome_a | tStart_a | tEnd_a | Gene_a | qStart_a | qEnd_a | Chromosome_a | tStart_a | tEnd_a |
| Top |
| There's no copy number variation information in COSMIC data for this gene. |
| Top |
|
 |
| Top |
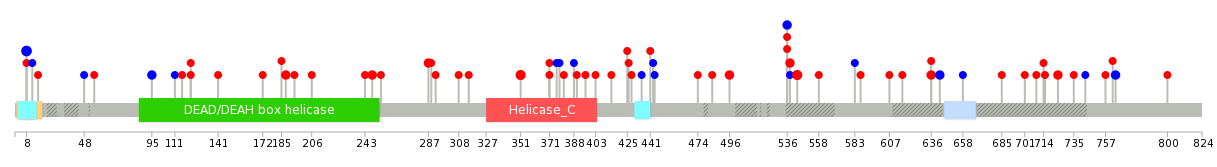
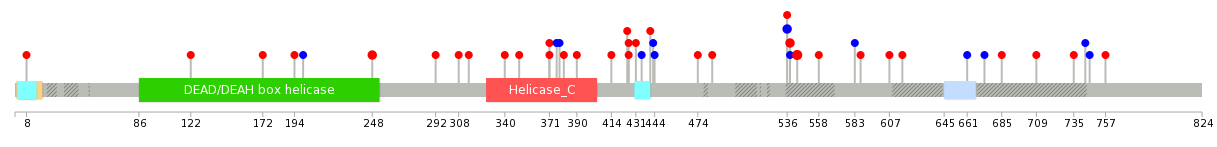
| Stat. for Non-Synonymous SNVs (# total SNVs=45) | (# total SNVs=15) |
 |  |
(# total SNVs=1) | (# total SNVs=0) |
 |
| Top |
| * When you move the cursor on each content, you can see more deailed mutation information on the Tooltip. Those are primary_site,primary_histology,mutation(aa),pubmedID. |
| GRCh37 position | Mutation(aa) | Unique sampleID count |
| chr1:112298570-112298570 | p.S8S | 4 |
| chr1:112308673-112308673 | p.E543K | 3 |
| chr1:112304906-112304906 | p.A351S | 3 |
| chr1:112299330-112299330 | p.D122N | 2 |
| chr1:112308358-112308358 | p.? | 2 |
| chr1:112309338-112309338 | p.L764L | 2 |
| chr1:112309444-112309444 | p.Q800* | 2 |
| chr1:112302187-112302187 | p.P188A | 2 |
| chr1:112309217-112309217 | p.K724I | 2 |
| chr1:112308533-112308533 | p.S496F | 2 |
| Top |
|
 |
| Point Mutation/ Tissue ID | 1 | 2 | 3 | 4 | 5 | 6 | 7 | 8 | 9 | 10 | 11 | 12 | 13 | 14 | 15 | 16 | 17 | 18 | 19 | 20 |
| # sample | 3 | 2 | 8 | 1 | 6 | 4 | 2 | 3 | 7 | 4 | 7 | |||||||||
| # mutation | 3 | 2 | 9 | 1 | 6 | 4 | 3 | 3 | 7 | 4 | 7 | |||||||||
| nonsynonymous SNV | 2 | 2 | 5 | 1 | 3 | 3 | 3 | 2 | 5 | 4 | 5 | |||||||||
| synonymous SNV | 1 | 4 | 3 | 1 | 1 | 2 | 2 |
| cf) Tissue ID; Tissue type (1; BLCA[Bladder Urothelial Carcinoma], 2; BRCA[Breast invasive carcinoma], 3; CESC[Cervical squamous cell carcinoma and endocervical adenocarcinoma], 4; COAD[Colon adenocarcinoma], 5; GBM[Glioblastoma multiforme], 6; Glioma Low Grade, 7; HNSC[Head and Neck squamous cell carcinoma], 8; KICH[Kidney Chromophobe], 9; KIRC[Kidney renal clear cell carcinoma], 10; KIRP[Kidney renal papillary cell carcinoma], 11; LAML[Acute Myeloid Leukemia], 12; LUAD[Lung adenocarcinoma], 13; LUSC[Lung squamous cell carcinoma], 14; OV[Ovarian serous cystadenocarcinoma ], 15; PAAD[Pancreatic adenocarcinoma], 16; PRAD[Prostate adenocarcinoma], 17; SKCM[Skin Cutaneous Melanoma], 18:STAD[Stomach adenocarcinoma], 19:THCA[Thyroid carcinoma], 20:UCEC[Uterine Corpus Endometrial Carcinoma]) |
| Top |
| * We represented just top 10 SNVs. When you move the cursor on each content, you can see more deailed mutation information on the Tooltip. Those are primary_site, primary_histology, mutation(aa), pubmedID. |
| Genomic Position | Mutation(aa) | Unique sampleID count |
| chr1:112308673 | p.E543K | 3 |
| chr1:112308658 | p.C538R | 2 |
| chr1:112303389 | p.E248K | 2 |
| chr1:112308654 | p.E376E | 1 |
| chr1:112303904 | p.L536P | 1 |
| chr1:112309100 | p.L746L | 1 |
| chr1:112305594 | p.V378V | 1 |
| chr1:112304903 | p.L536L | 1 |
| chr1:112309171 | p.D757N | 1 |
| chr1:112305608 | p.V381A | 1 |
| * Copy number data were extracted from TCGA using R package TCGA-Assembler. The URLs of all public data files on TCGA DCC data server were gathered on Jan-05-2015. Function ProcessCNAData in TCGA-Assembler package was used to obtain gene-level copy number value which is calculated as the average copy number of the genomic region of a gene. |
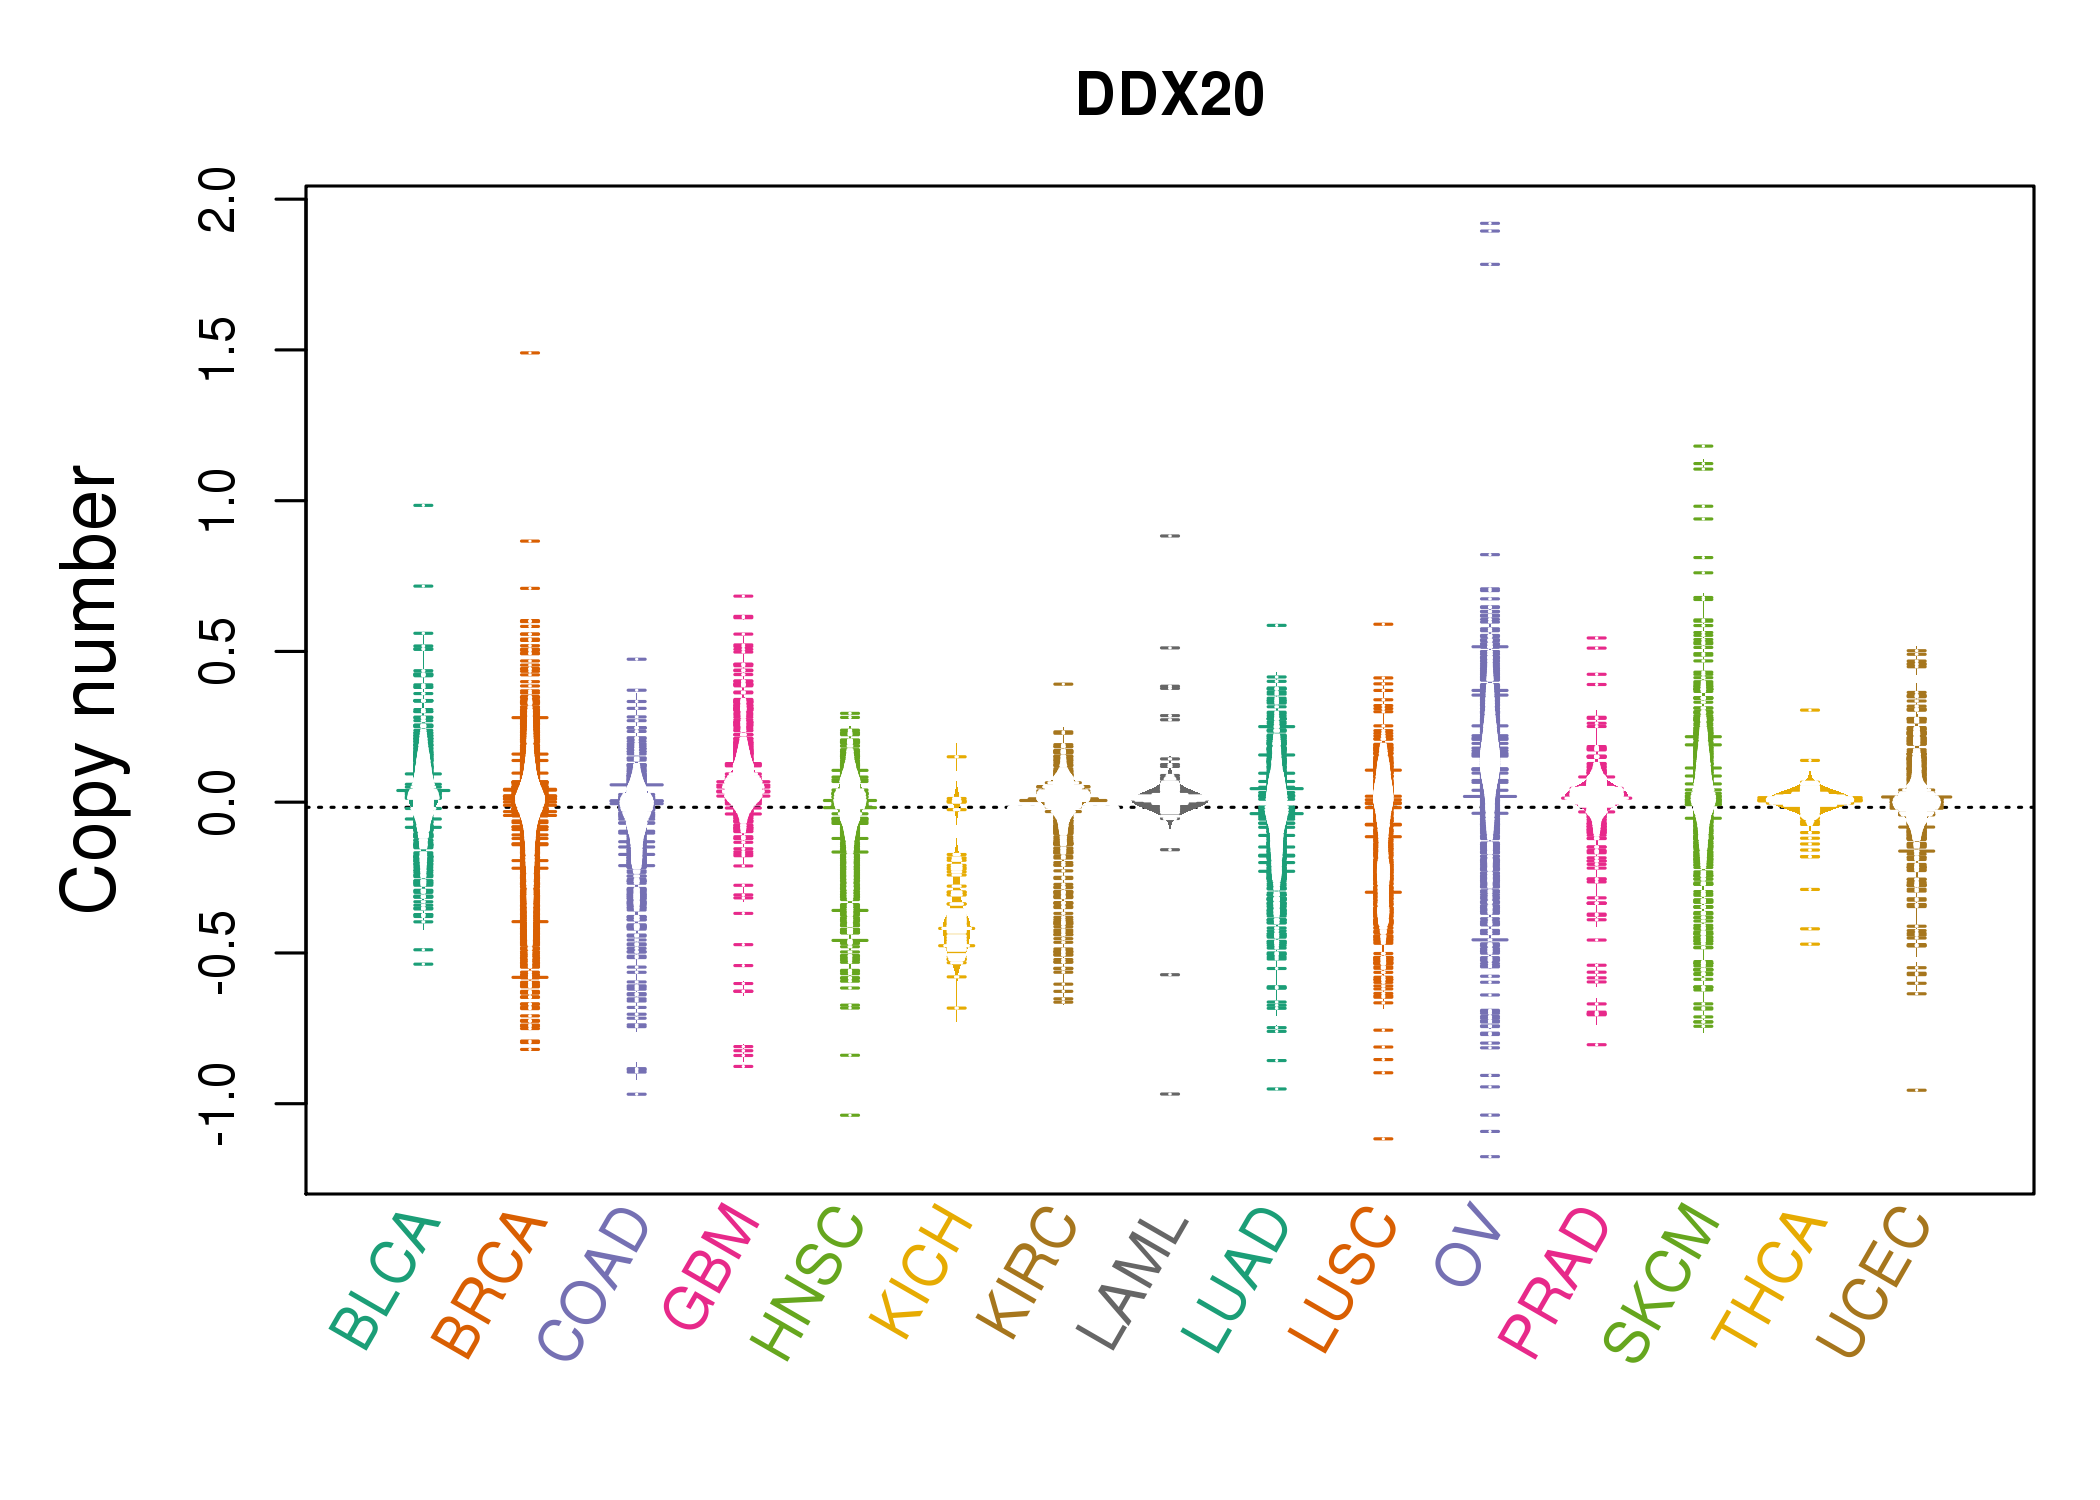 |
| cf) Tissue ID[Tissue type]: BLCA[Bladder Urothelial Carcinoma], BRCA[Breast invasive carcinoma], CESC[Cervical squamous cell carcinoma and endocervical adenocarcinoma], COAD[Colon adenocarcinoma], GBM[Glioblastoma multiforme], Glioma Low Grade, HNSC[Head and Neck squamous cell carcinoma], KICH[Kidney Chromophobe], KIRC[Kidney renal clear cell carcinoma], KIRP[Kidney renal papillary cell carcinoma], LAML[Acute Myeloid Leukemia], LUAD[Lung adenocarcinoma], LUSC[Lung squamous cell carcinoma], OV[Ovarian serous cystadenocarcinoma ], PAAD[Pancreatic adenocarcinoma], PRAD[Prostate adenocarcinoma], SKCM[Skin Cutaneous Melanoma], STAD[Stomach adenocarcinoma], THCA[Thyroid carcinoma], UCEC[Uterine Corpus Endometrial Carcinoma] |
| Top |
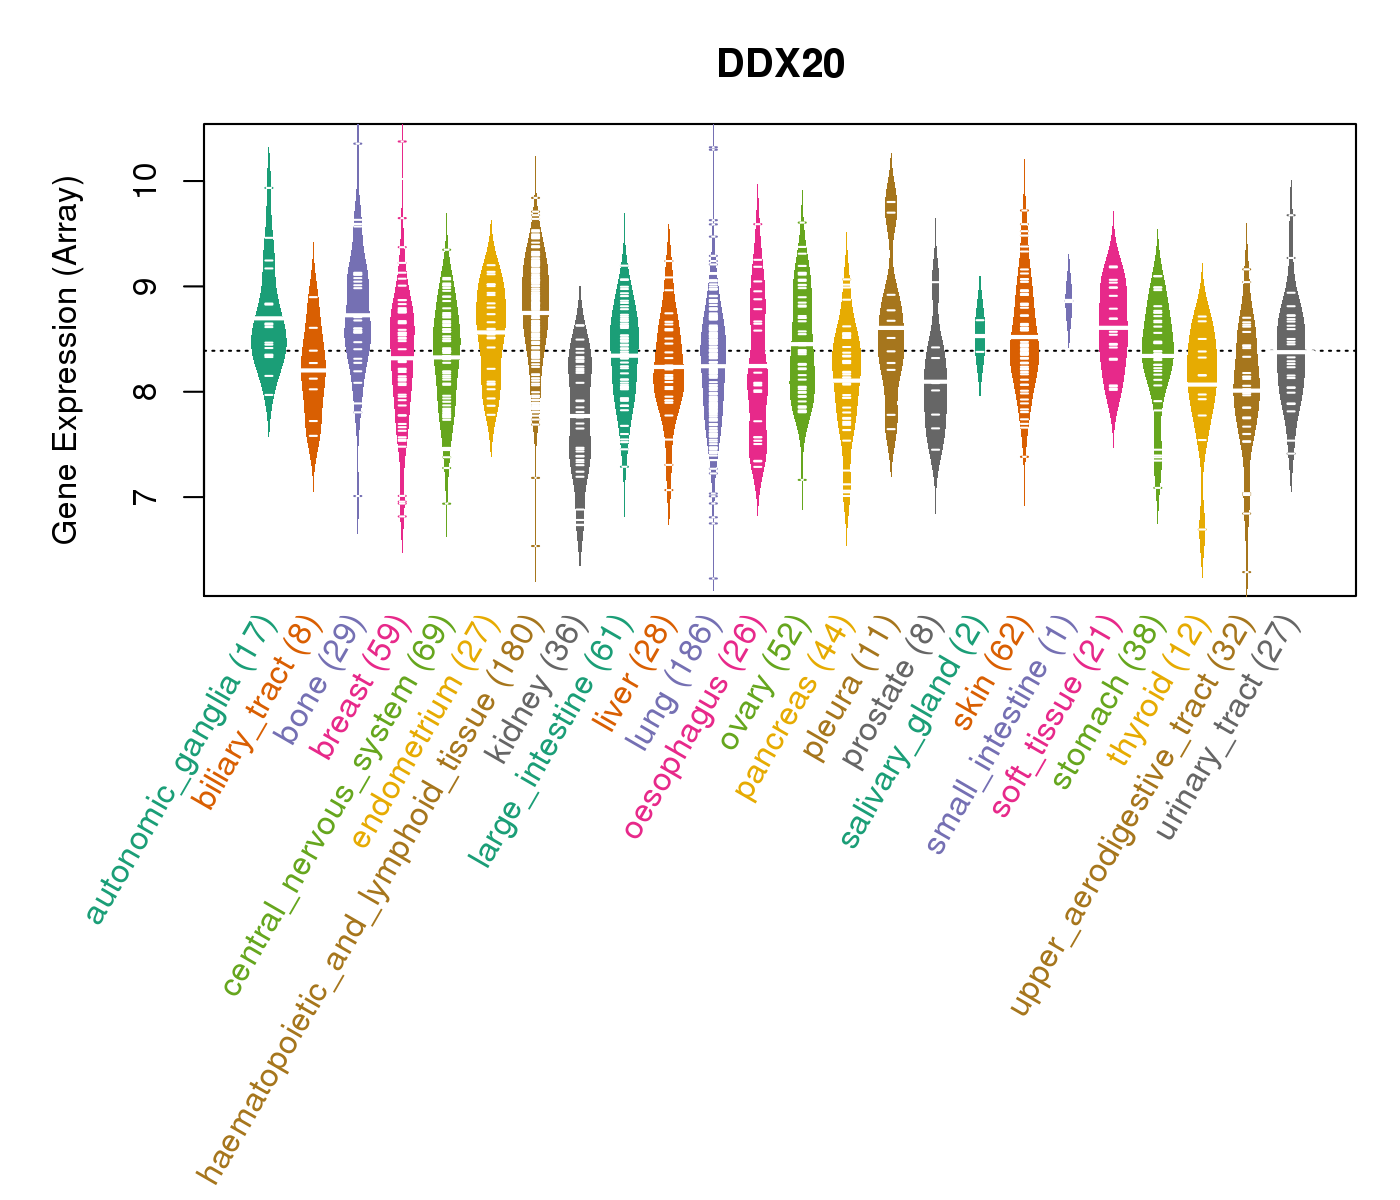
| Gene Expression for DDX20 |
| * CCLE gene expression data were extracted from CCLE_Expression_Entrez_2012-10-18.res: Gene-centric RMA-normalized mRNA expression data. |
 |
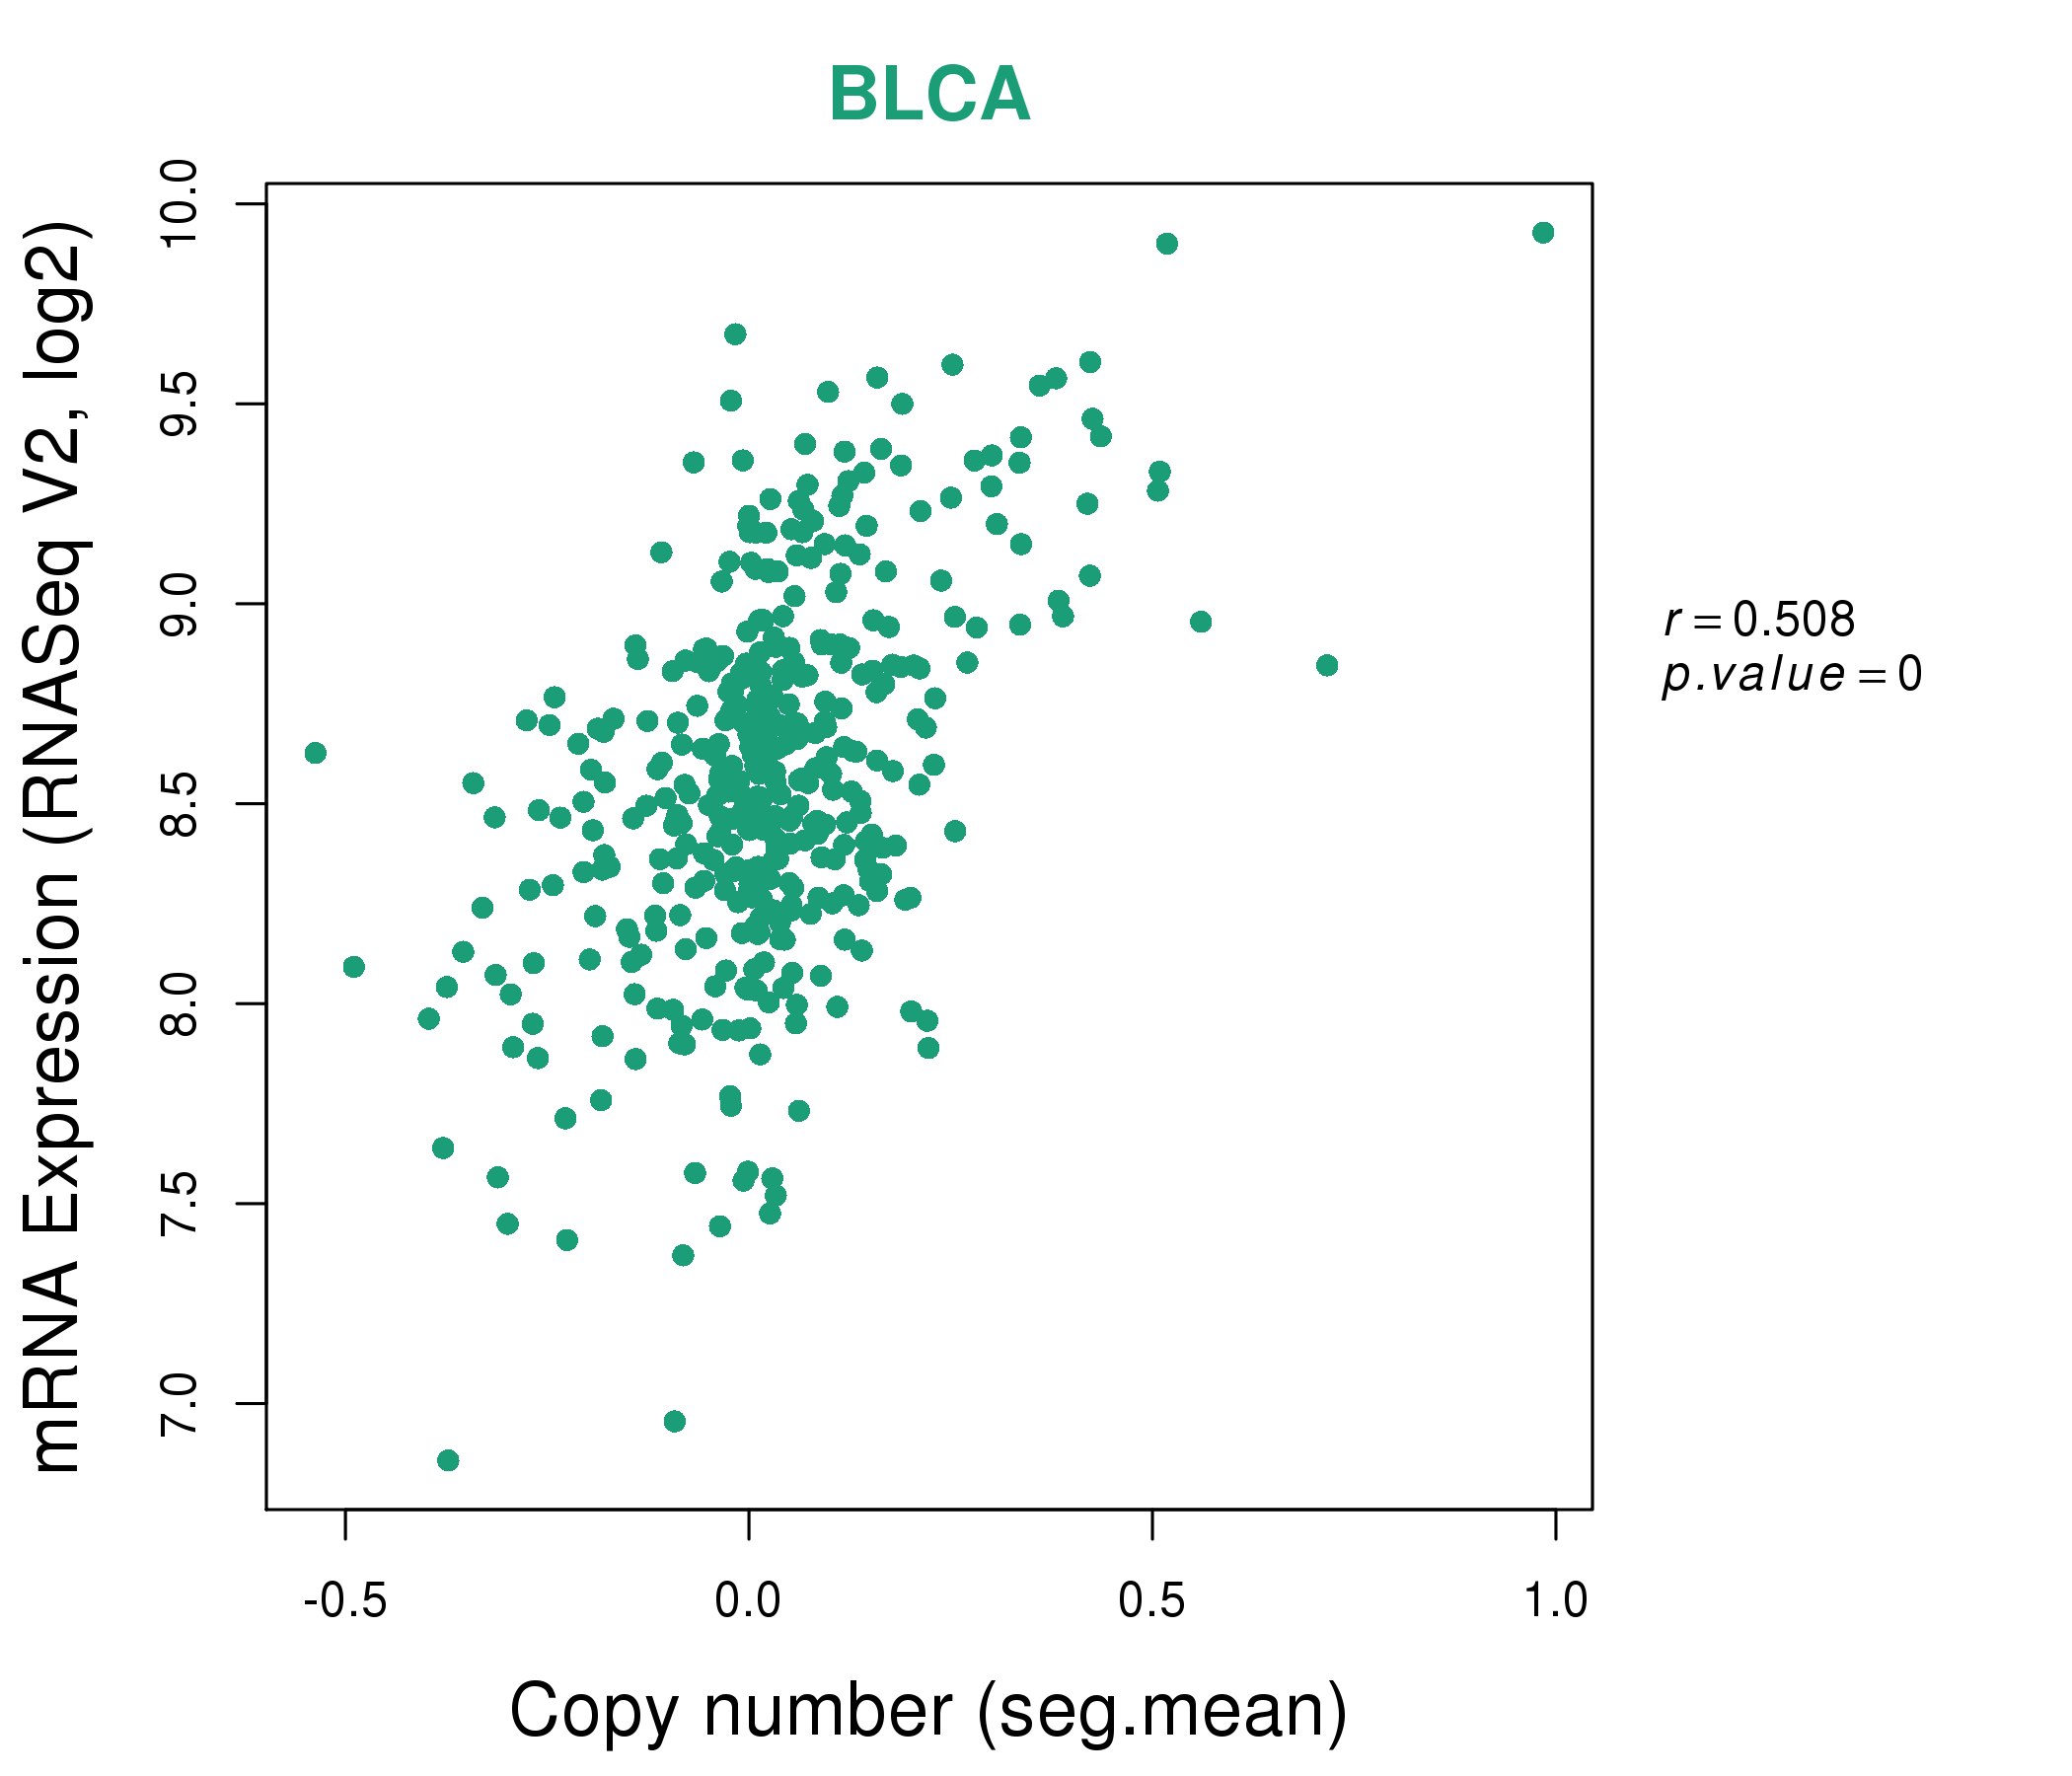
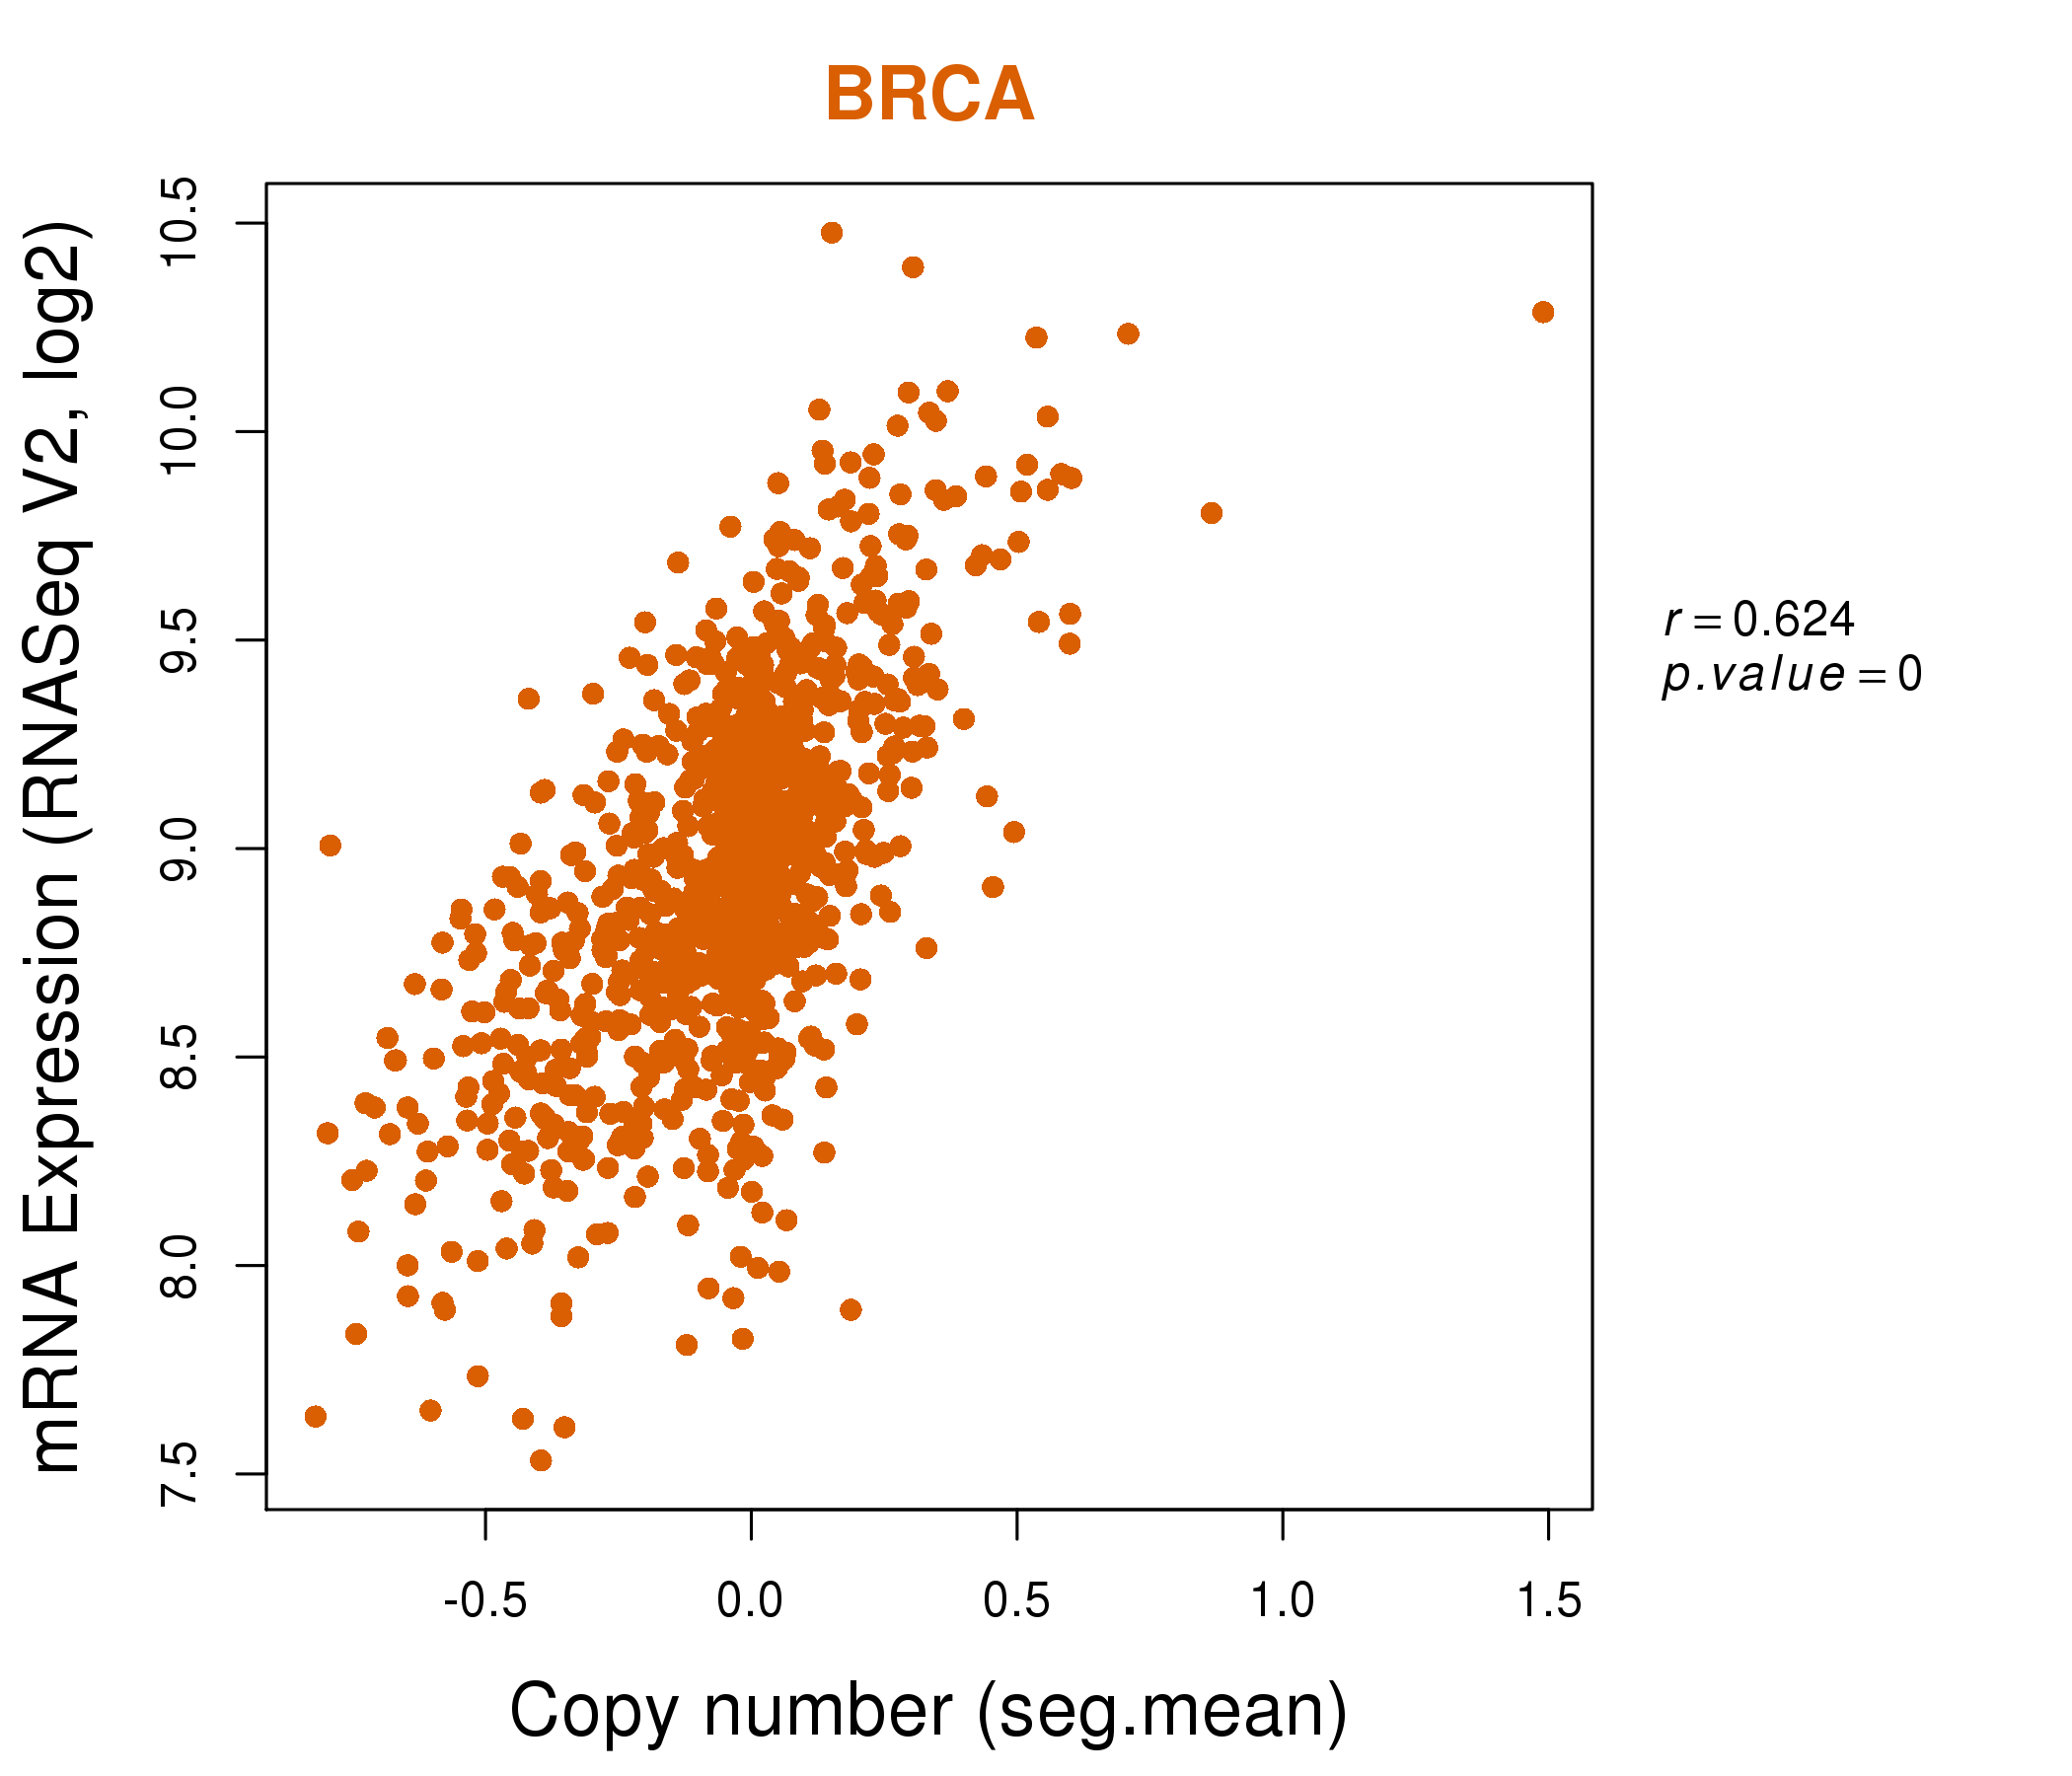
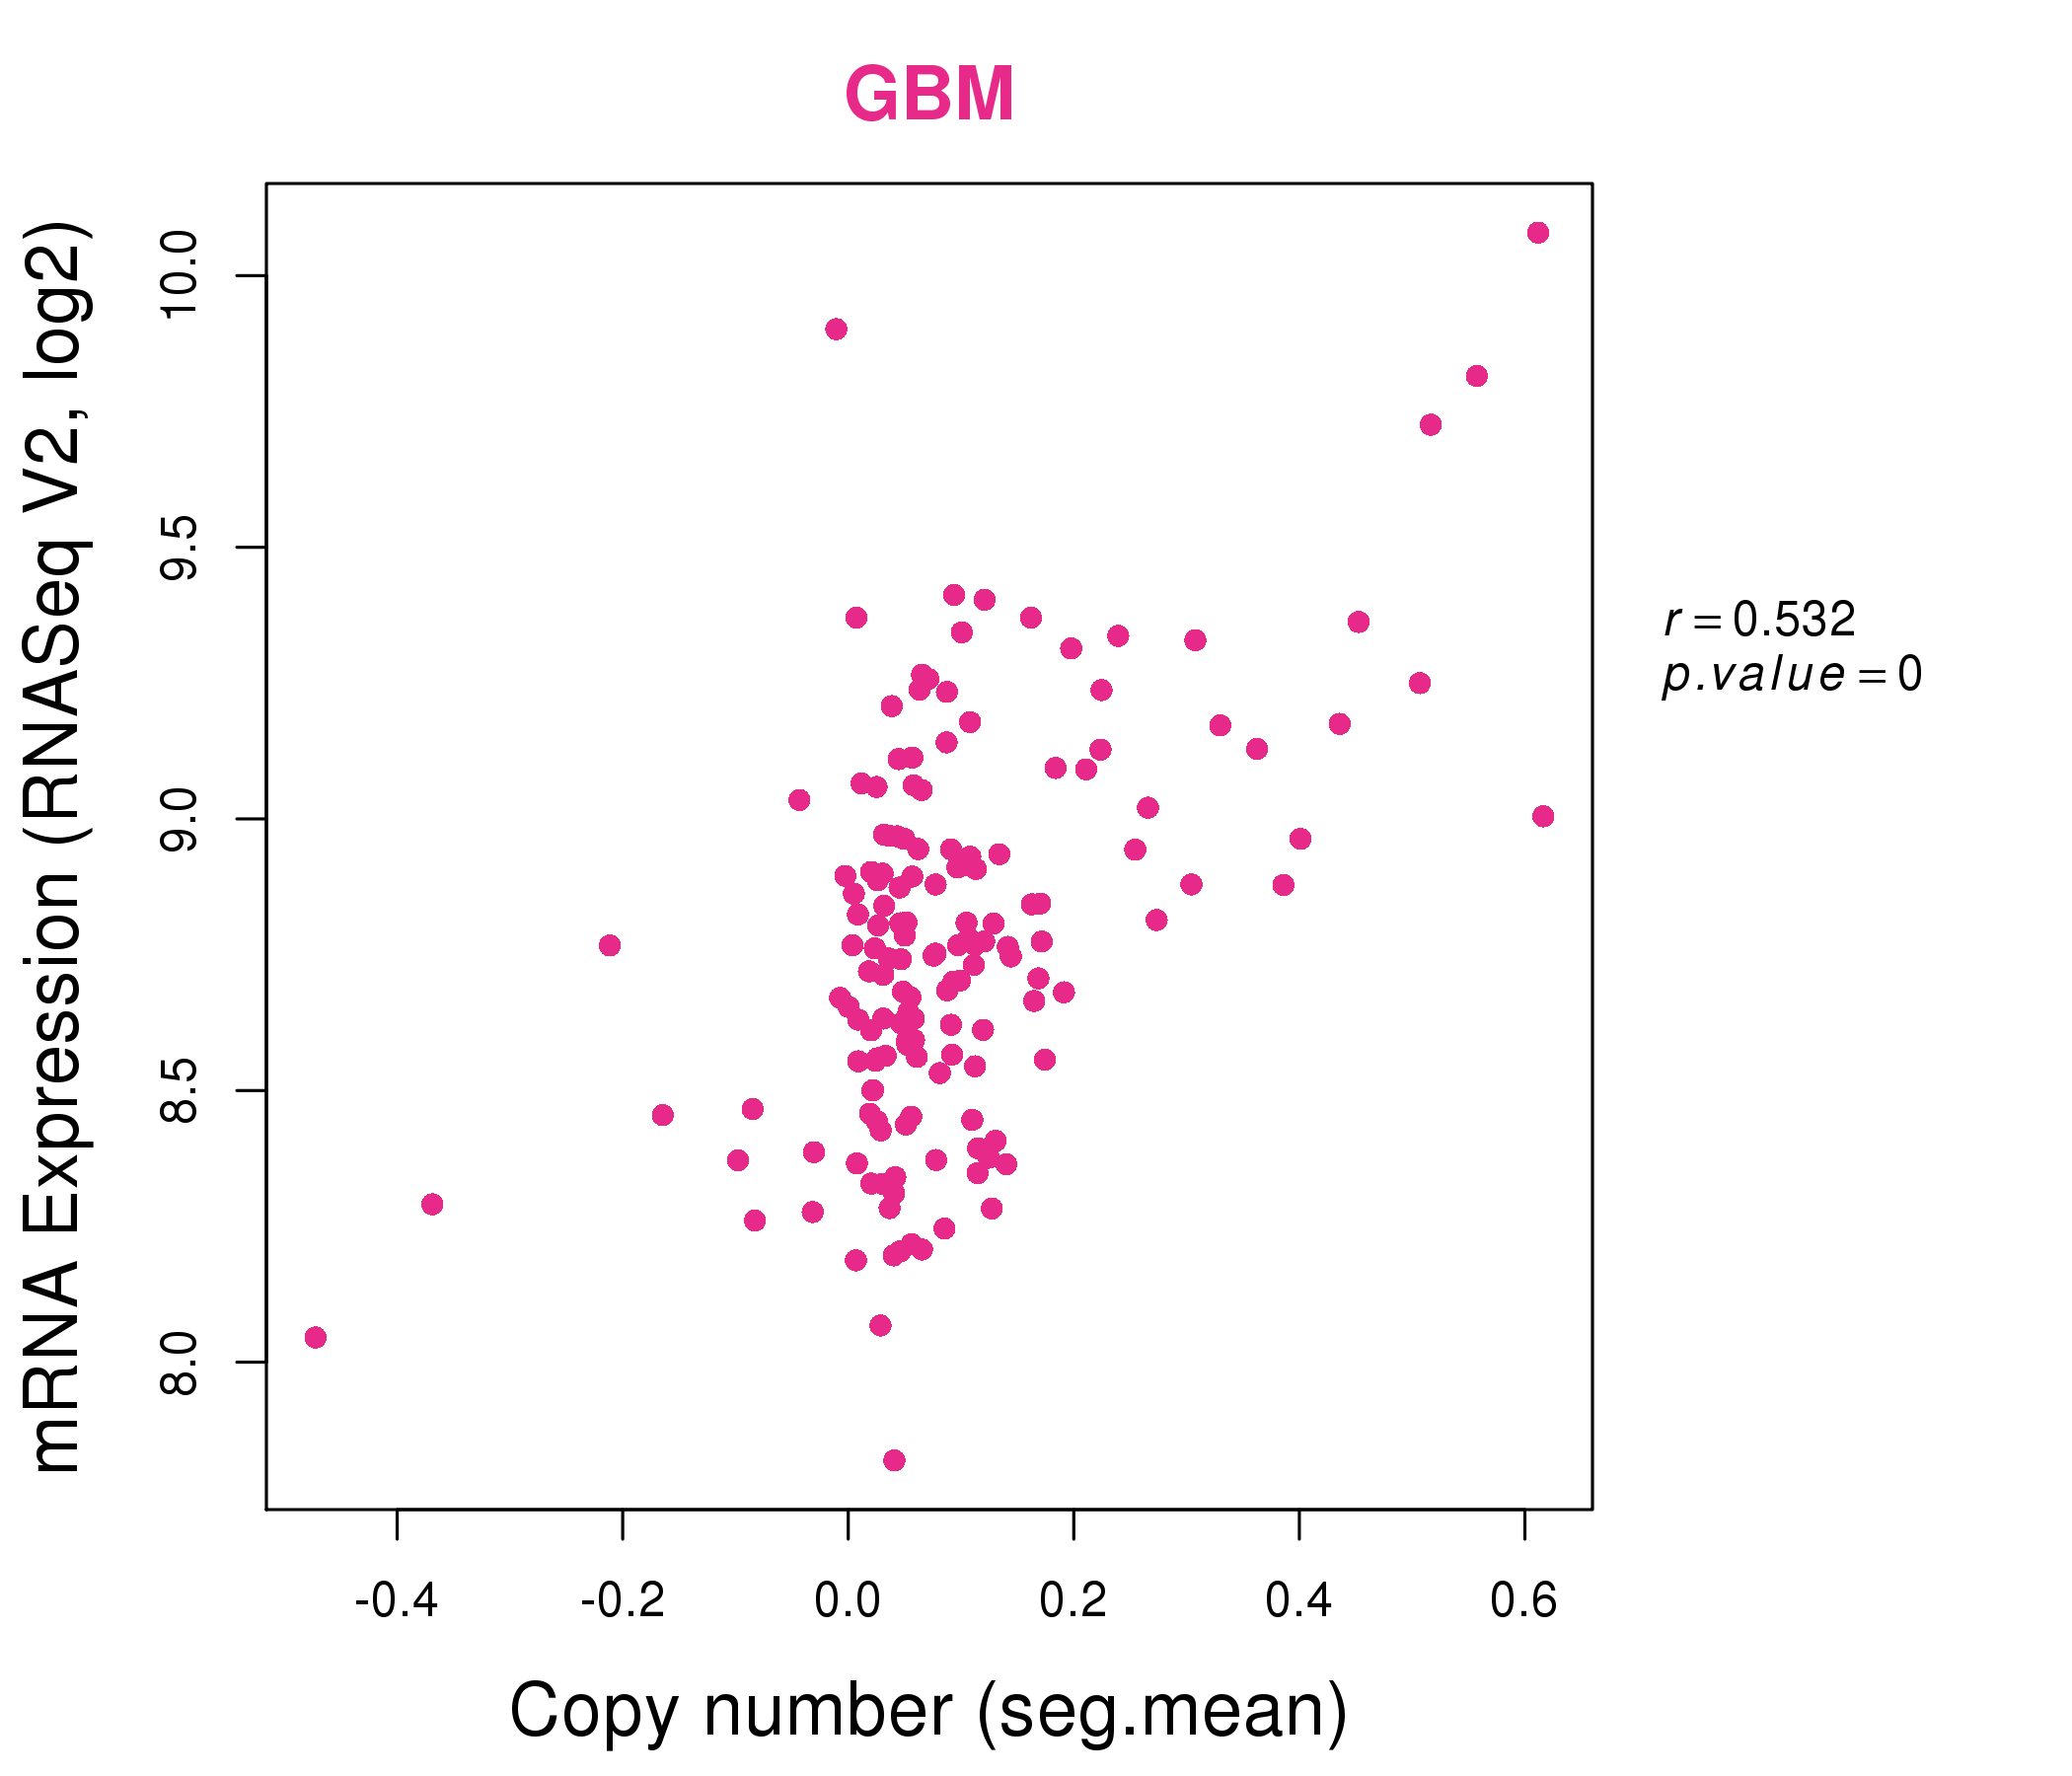
| * Normalized gene expression data of RNASeqV2 was extracted from TCGA using R package TCGA-Assembler. The URLs of all public data files on TCGA DCC data server were gathered at Jan-05-2015. Only eight cancer types have enough normal control samples for differential expression analysis. (t test, adjusted p<0.05 (using Benjamini-Hochberg FDR)) |
 |
| Top |
| * This plots show the correlation between CNV and gene expression. |
: Open all plots for all cancer types
 |
|
 |
|
| Top |
| Gene-Gene Network Information |
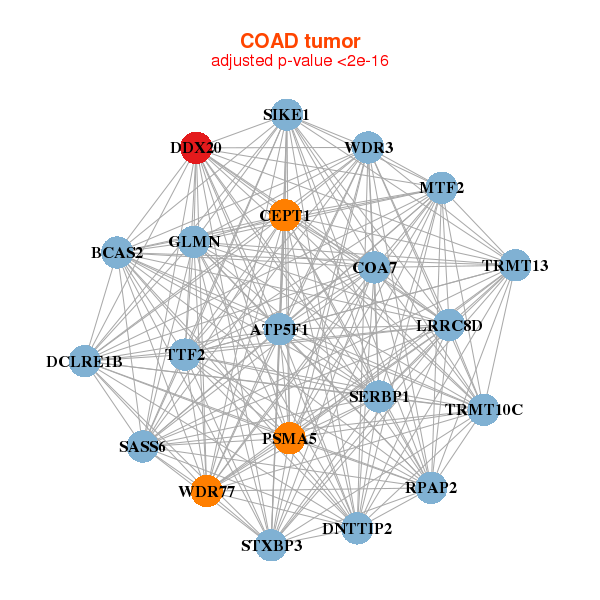
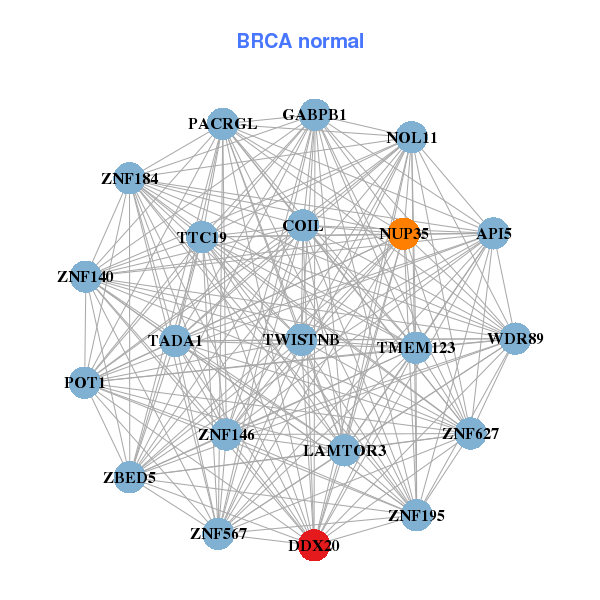
| * Co-Expression network figures were drawn using R package igraph. Only the top 20 genes with the highest correlations were shown. Red circle: input gene, orange circle: cell metabolism gene, sky circle: other gene |
: Open all plots for all cancer types
 |
|
| ATP5F1,CAPZA1,CLCC1,CSDE1,DDX20,DNTTIP2,GLMN, GNAI3,LRIG2,PKN2,PRPF38B,RAP1A,RBMXL1,RPAP2, RSBN1,SASS6,SIKE1,STXBP3,WDR77,ZNF326,ZNF644 | API5,COIL,DDX20,GABPB1,LAMTOR3,NOL11,NUP35, PACRGL,POT1,TADA1,TMEM123,TTC19,TWISTNB,WDR89, ZBED5,ZNF140,ZNF146,ZNF184,ZNF195,ZNF567,ZNF627 |
 |
|
| ATP5F1,BCAS2,COA7,TRMT13,CEPT1,DCLRE1B,DDX20, DNTTIP2,GLMN,LRRC8D,MTF2,PSMA5,TRMT10C,RPAP2, SASS6,SERBP1,SIKE1,STXBP3,TTF2,WDR3,WDR77 | ALDH1B1,TPGS2,DBR1,DCLRE1B,DDX20,DSE,FAM175B, FIGNL1,FTSJ2,IPO11,LOC339524,MCPH1,NOL11,NUP160, OGFOD1,RBMXL1,SF3A3,SRRD,TEX10,TRMT5,USP1 |
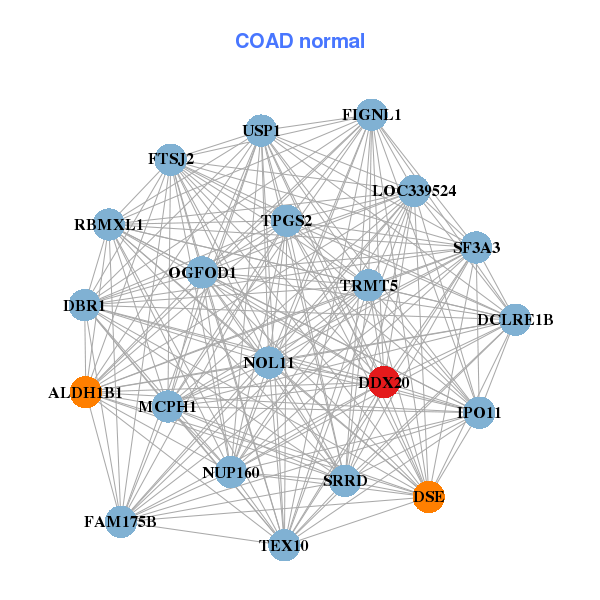
| * Co-Expression network figures were drawn using R package igraph. Only the top 20 genes with the highest correlations were shown. Red circle: input gene, orange circle: cell metabolism gene, sky circle: other gene |
: Open all plots for all cancer types
| Top |
: Open all interacting genes' information including KEGG pathway for all interacting genes from DAVID
| Top |
| Pharmacological Information for DDX20 |
| There's no related Drug. |
| Top |
| Cross referenced IDs for DDX20 |
| * We obtained these cross-references from Uniprot database. It covers 150 different DBs, 18 categories. http://www.uniprot.org/help/cross_references_section |
: Open all cross reference information
|
Copyright © 2016-Present - The Univsersity of Texas Health Science Center at Houston @ |