|
||||||||||||||||||||||||||||||||||||||||||||||||||||||||||||||||||||||||||||||||||||||||||||||||||||||||||||||||||||||||||||||||||||||||||||||||||||||||||||||||||||||||||||||||||||||||||||||||||||||||||||||||||||||||||||||||||||||||||||||||||||||||||||||||||||||||||||||||||||||||||||||||||||||||||||||||||||||||||
| |
| Phenotypic Information (metabolism pathway, cancer, disease, phenome) |
| |
| |
| Gene-Gene Network Information: Co-Expression Network, Interacting Genes & KEGG |
| |
|


| Gene Summary for GALNT5 |
| Basic gene info. | Gene symbol | GALNT5 |
| Gene name | polypeptide N-acetylgalactosaminyltransferase 5 | |
| Synonyms | GALNAC-T5|GALNACT5 | |
| Cytomap | UCSC genome browser: 2q24.1 | |
| Genomic location | chr2 :158114339-158167913 | |
| Type of gene | protein-coding | |
| RefGenes | NM_014568.1, | |
| Ensembl id | ENSG00000136542 | |
| Description | UDP-GalNAc:polypeptide N-acetylgalactosaminyltransferase 5UDP-N-acetyl-alpha-D-galactosamine:polypeptide N-acetylgalactosaminyltransferase 5 (GalNAc-T5)polypeptide GalNAc transferase 5pp-GaNTase 5protein-UDP acetylgalactosaminyltransferase 5 | |
| Modification date | 20141207 | |
| dbXrefs | MIM : 615129 | |
| HGNC : HGNC | ||
| HPRD : 09970 | ||
| Protein | UniProt: Q7Z7M9 go to UniProt's Cross Reference DB Table | |
| Expression | CleanEX: HS_GALNT5 | |
| BioGPS: 11227 | ||
| Gene Expression Atlas: ENSG00000136542 | ||
| The Human Protein Atlas: ENSG00000136542 | ||
| Pathway | NCI Pathway Interaction Database: GALNT5 | |
| KEGG: GALNT5 | ||
| REACTOME: GALNT5 | ||
| ConsensusPathDB | ||
| Pathway Commons: GALNT5 | ||
| Metabolism | MetaCyc: GALNT5 | |
| HUMANCyc: GALNT5 | ||
| Regulation | Ensembl's Regulation: ENSG00000136542 | |
| miRBase: chr2 :158,114,339-158,167,913 | ||
| TargetScan: NM_014568 | ||
| cisRED: ENSG00000136542 | ||
| Context | iHOP: GALNT5 | |
| cancer metabolism search in PubMed: GALNT5 | ||
| UCL Cancer Institute: GALNT5 | ||
| Assigned class in ccmGDB | B - This gene belongs to cancer gene. | |
| Top |
| Phenotypic Information for GALNT5(metabolism pathway, cancer, disease, phenome) |
| Cancer | CGAP: GALNT5 |
| Familial Cancer Database: GALNT5 | |
| * This gene is included in those cancer gene databases. |
|
|
|
|
|
| . | ||||||||||||||||||||||||||||||||||||||||||||||||||||||||||||||||||||||||||||||||||||||||||||||||||||||||||||||||||||||||||||||||||||||||||||||||||||||||||||||||||||||||||||||||||||||||||||||||||||||||||||||||||||||||||||||||||||||||||||||||||||||||||||||||||||||||||||||||||||||||||||||||||||||||||||||||||||
Oncogene 1 | Significant driver gene in | |||||||||||||||||||||||||||||||||||||||||||||||||||||||||||||||||||||||||||||||||||||||||||||||||||||||||||||||||||||||||||||||||||||||||||||||||||||||||||||||||||||||||||||||||||||||||||||||||||||||||||||||||||||||||||||||||||||||||||||||||||||||||||||||||||||||||||||||||||||||||||||||||||||||||||||||||||||||||
| cf) number; DB name 1 Oncogene; http://nar.oxfordjournals.org/content/35/suppl_1/D721.long, 2 Tumor Suppressor gene; https://bioinfo.uth.edu/TSGene/, 3 Cancer Gene Census; http://www.nature.com/nrc/journal/v4/n3/abs/nrc1299.html, 4 CancerGenes; http://nar.oxfordjournals.org/content/35/suppl_1/D721.long, 5 Network of Cancer Gene; http://ncg.kcl.ac.uk/index.php, 1Therapeutic Vulnerabilities in Cancer; http://cbio.mskcc.org/cancergenomics/statius/ |
| REACTOME_METABOLISM_OF_PROTEINS | |
| OMIM | |
| Orphanet | |
| Disease | KEGG Disease: GALNT5 |
| MedGen: GALNT5 (Human Medical Genetics with Condition) | |
| ClinVar: GALNT5 | |
| Phenotype | MGI: GALNT5 (International Mouse Phenotyping Consortium) |
| PhenomicDB: GALNT5 | |
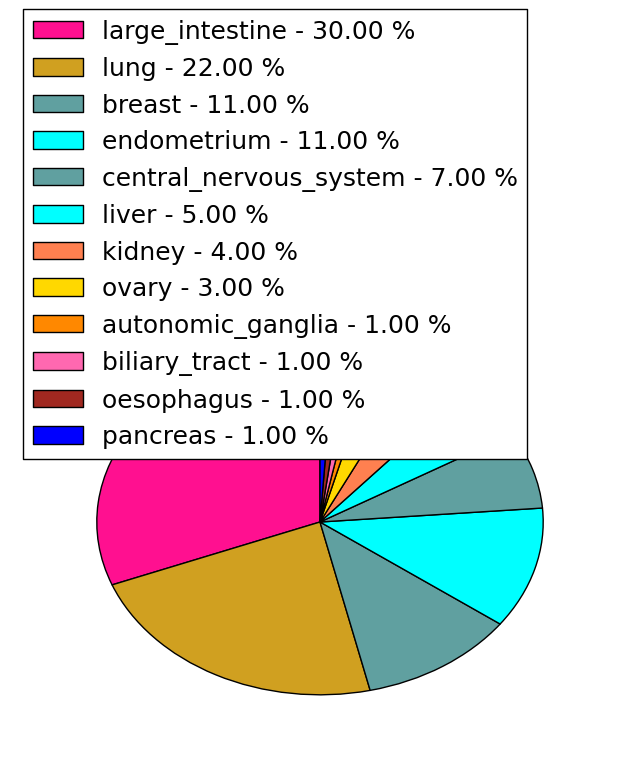
| Mutations for GALNT5 |
| * Under tables are showing count per each tissue to give us broad intuition about tissue specific mutation patterns.You can go to the detailed page for each mutation database's web site. |
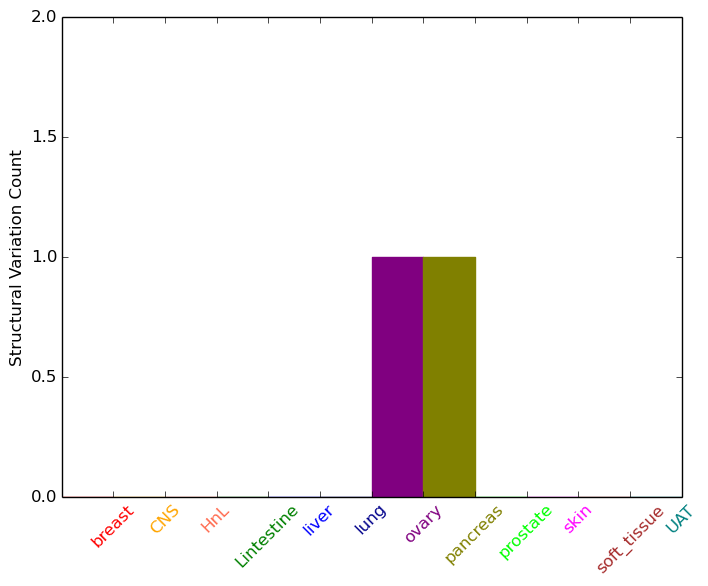
| - Statistics for Tissue and Mutation type | Top |
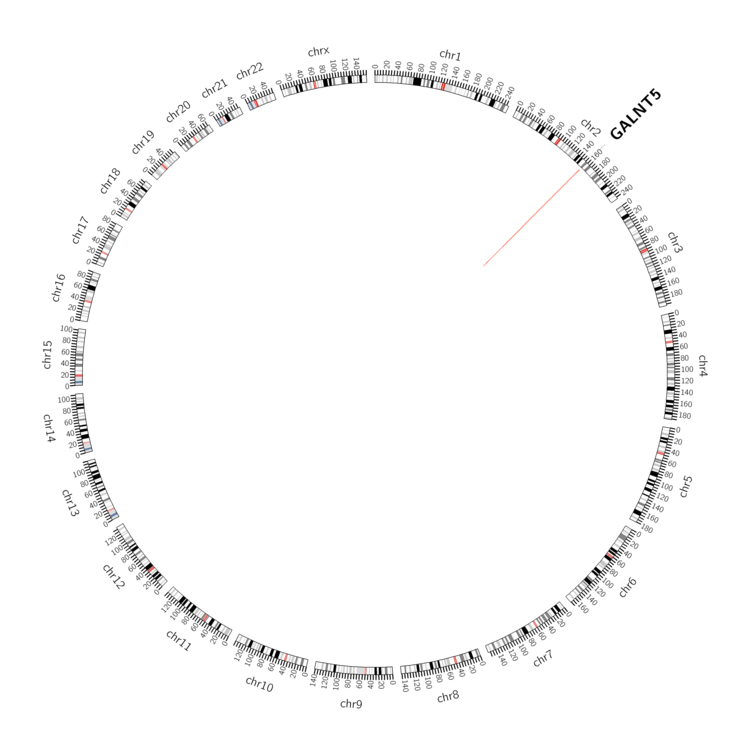 |
| - For Inter-chromosomal Variations |
| There's no inter-chromosomal structural variation. |
| - For Intra-chromosomal Variations |
| * Intra-chromosomal variantions includes 'intrachromosomal amplicon to amplicon', 'intrachromosomal amplicon to non-amplified dna', 'intrachromosomal deletion', 'intrachromosomal fold-back inversion', 'intrachromosomal inversion', 'intrachromosomal tandem duplication', 'Intrachromosomal unknown type', 'intrachromosomal with inverted orientation', 'intrachromosomal with non-inverted orientation'. |
 |
| Sample | Symbol_a | Chr_a | Start_a | End_a | Symbol_b | Chr_b | Start_b | End_b |
| ovary | GALNT5 | chr2 | 158114577 | 158114597 | chr2 | 157076182 | 157076202 | |
| pancreas | GALNT5 | chr2 | 158147128 | 158147148 | GALNT5 | chr2 | 158147798 | 158147818 |
| cf) Tissue number; Tissue name (1;Breast, 2;Central_nervous_system, 3;Haematopoietic_and_lymphoid_tissue, 4;Large_intestine, 5;Liver, 6;Lung, 7;Ovary, 8;Pancreas, 9;Prostate, 10;Skin, 11;Soft_tissue, 12;Upper_aerodigestive_tract) |
| * From mRNA Sanger sequences, Chitars2.0 arranged chimeric transcripts. This table shows GALNT5 related fusion information. |
| ID | Head Gene | Tail Gene | Accession | Gene_a | qStart_a | qEnd_a | Chromosome_a | tStart_a | tEnd_a | Gene_a | qStart_a | qEnd_a | Chromosome_a | tStart_a | tEnd_a |
| BF109407 | PABPC4 | 69 | 191 | 1 | 40033471 | 40034548 | GALNT5 | 178 | 351 | 2 | 158115681 | 158115854 | |
| Top |
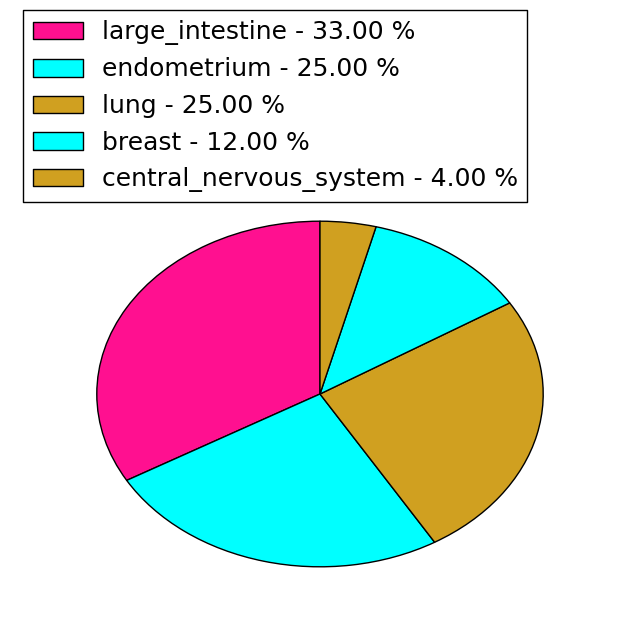
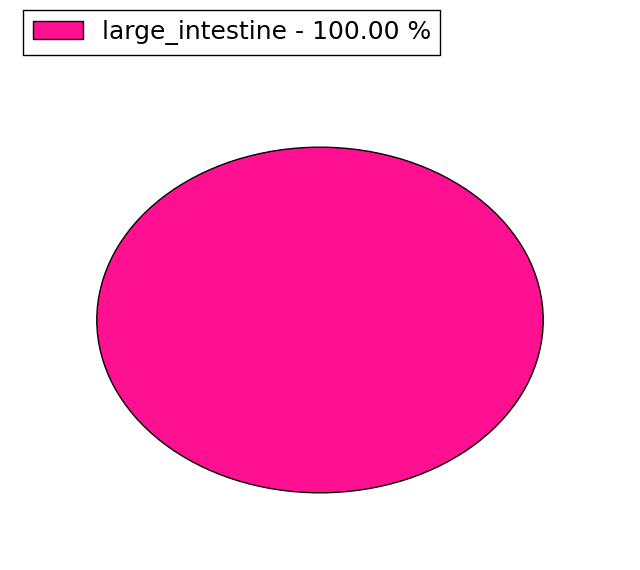
| Mutation type/ Tissue ID | brca | cns | cerv | endome | haematopo | kidn | Lintest | liver | lung | ns | ovary | pancre | prost | skin | stoma | thyro | urina | |||
| Total # sample | 1 | 1 | ||||||||||||||||||
| GAIN (# sample) | 1 | |||||||||||||||||||
| LOSS (# sample) | 1 |
| cf) Tissue ID; Tissue type (1; Breast, 2; Central_nervous_system, 3; Cervix, 4; Endometrium, 5; Haematopoietic_and_lymphoid_tissue, 6; Kidney, 7; Large_intestine, 8; Liver, 9; Lung, 10; NS, 11; Ovary, 12; Pancreas, 13; Prostate, 14; Skin, 15; Stomach, 16; Thyroid, 17; Urinary_tract) |
| Top |
|
 |
| Top |
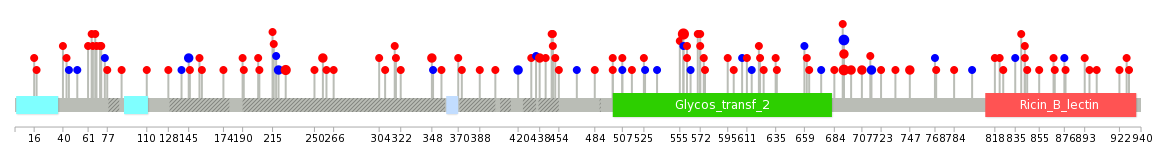
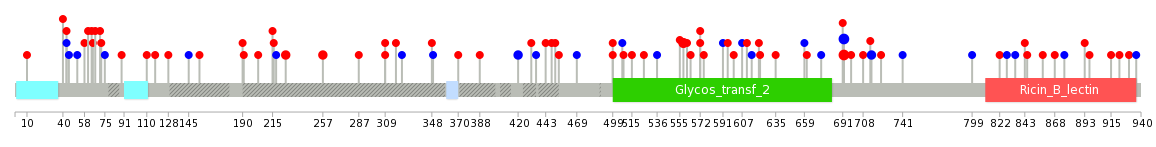
| Stat. for Non-Synonymous SNVs (# total SNVs=90) | (# total SNVs=24) |
 |  |
(# total SNVs=0) | (# total SNVs=1) |
 |
| Top |
| * When you move the cursor on each content, you can see more deailed mutation information on the Tooltip. Those are primary_site,primary_histology,mutation(aa),pubmedID. |
| GRCh37 position | Mutation(aa) | Unique sampleID count |
| chr2:158142577-158142577 | p.R558W | 5 |
| chr2:158156137-158156137 | p.L692P | 4 |
| chr2:158156138-158156138 | p.L692L | 4 |
| chr2:158157422-158157422 | p.R784* | 3 |
| chr2:158115271-158115271 | p.R226K | 3 |
| chr2:158157311-158157311 | p.R747W | 2 |
| chr2:158156136-158156136 | p.L692F | 2 |
| chr2:158115029-158115029 | p.D145D | 2 |
| chr2:158115854-158115854 | p.T420T | 2 |
| chr2:158156154-158156154 | p.E698K | 2 |
| Top |
|
 |
| Point Mutation/ Tissue ID | 1 | 2 | 3 | 4 | 5 | 6 | 7 | 8 | 9 | 10 | 11 | 12 | 13 | 14 | 15 | 16 | 17 | 18 | 19 | 20 |
| # sample | 3 | 5 | 3 | 22 | 2 | 5 | 4 | 11 | 7 | 1 | 11 | 9 | 12 | |||||||
| # mutation | 3 | 5 | 3 | 20 | 2 | 5 | 4 | 11 | 7 | 1 | 12 | 11 | 12 | |||||||
| nonsynonymous SNV | 3 | 3 | 2 | 16 | 1 | 3 | 4 | 8 | 6 | 8 | 8 | 6 | ||||||||
| synonymous SNV | 2 | 1 | 4 | 1 | 2 | 3 | 1 | 1 | 4 | 3 | 6 |
| cf) Tissue ID; Tissue type (1; BLCA[Bladder Urothelial Carcinoma], 2; BRCA[Breast invasive carcinoma], 3; CESC[Cervical squamous cell carcinoma and endocervical adenocarcinoma], 4; COAD[Colon adenocarcinoma], 5; GBM[Glioblastoma multiforme], 6; Glioma Low Grade, 7; HNSC[Head and Neck squamous cell carcinoma], 8; KICH[Kidney Chromophobe], 9; KIRC[Kidney renal clear cell carcinoma], 10; KIRP[Kidney renal papillary cell carcinoma], 11; LAML[Acute Myeloid Leukemia], 12; LUAD[Lung adenocarcinoma], 13; LUSC[Lung squamous cell carcinoma], 14; OV[Ovarian serous cystadenocarcinoma ], 15; PAAD[Pancreatic adenocarcinoma], 16; PRAD[Prostate adenocarcinoma], 17; SKCM[Skin Cutaneous Melanoma], 18:STAD[Stomach adenocarcinoma], 19:THCA[Thyroid carcinoma], 20:UCEC[Uterine Corpus Endometrial Carcinoma]) |
| Top |
| * We represented just top 10 SNVs. When you move the cursor on each content, you can see more deailed mutation information on the Tooltip. Those are primary_site, primary_histology, mutation(aa), pubmedID. |
| Genomic Position | Mutation(aa) | Unique sampleID count |
| chr2:158156137 | p.L692P | 4 |
| chr2:158156138 | p.L692L | 4 |
| chr2:158142577 | p.R558W | 3 |
| chr2:158115271 | p.R226K | 2 |
| chr2:158115364 | p.K257T | 2 |
| chr2:158115519 | p.I715I | 2 |
| chr2:158157217 | p.G309R | 2 |
| chr2:158115854 | p.T420T | 2 |
| chr2:158152206 | p.R876R | 1 |
| chr2:158167780 | p.P61S | 1 |
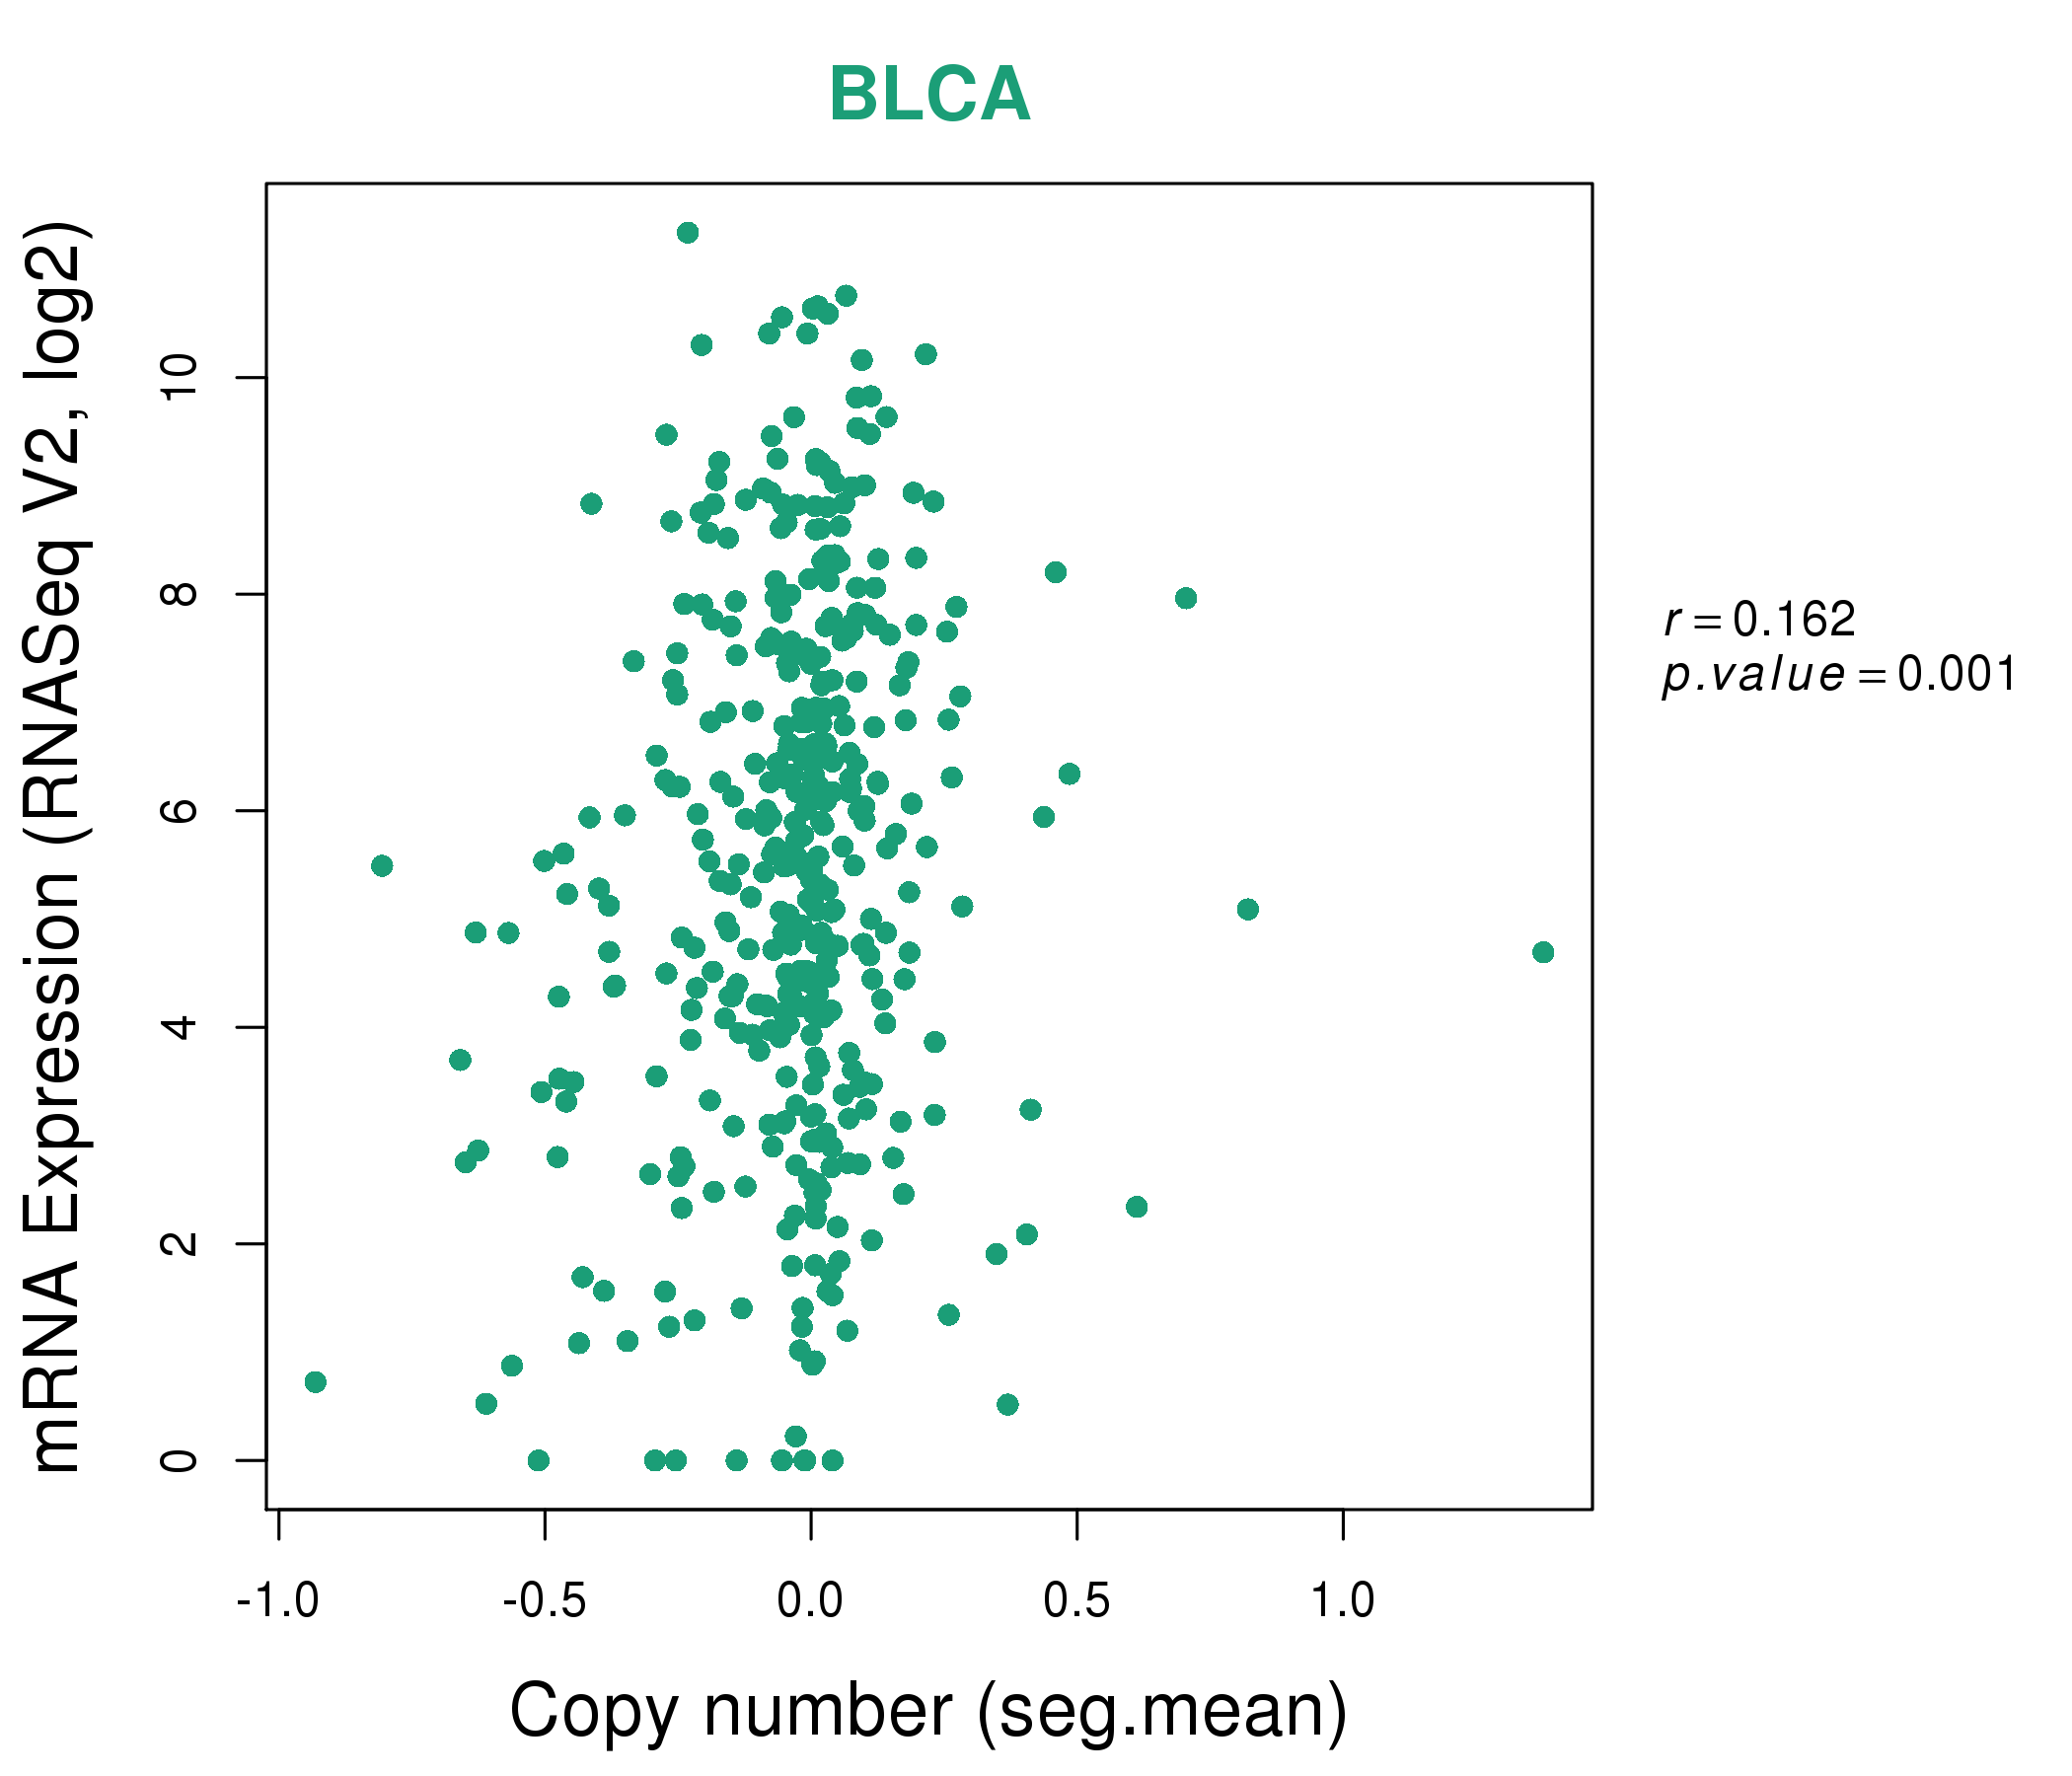
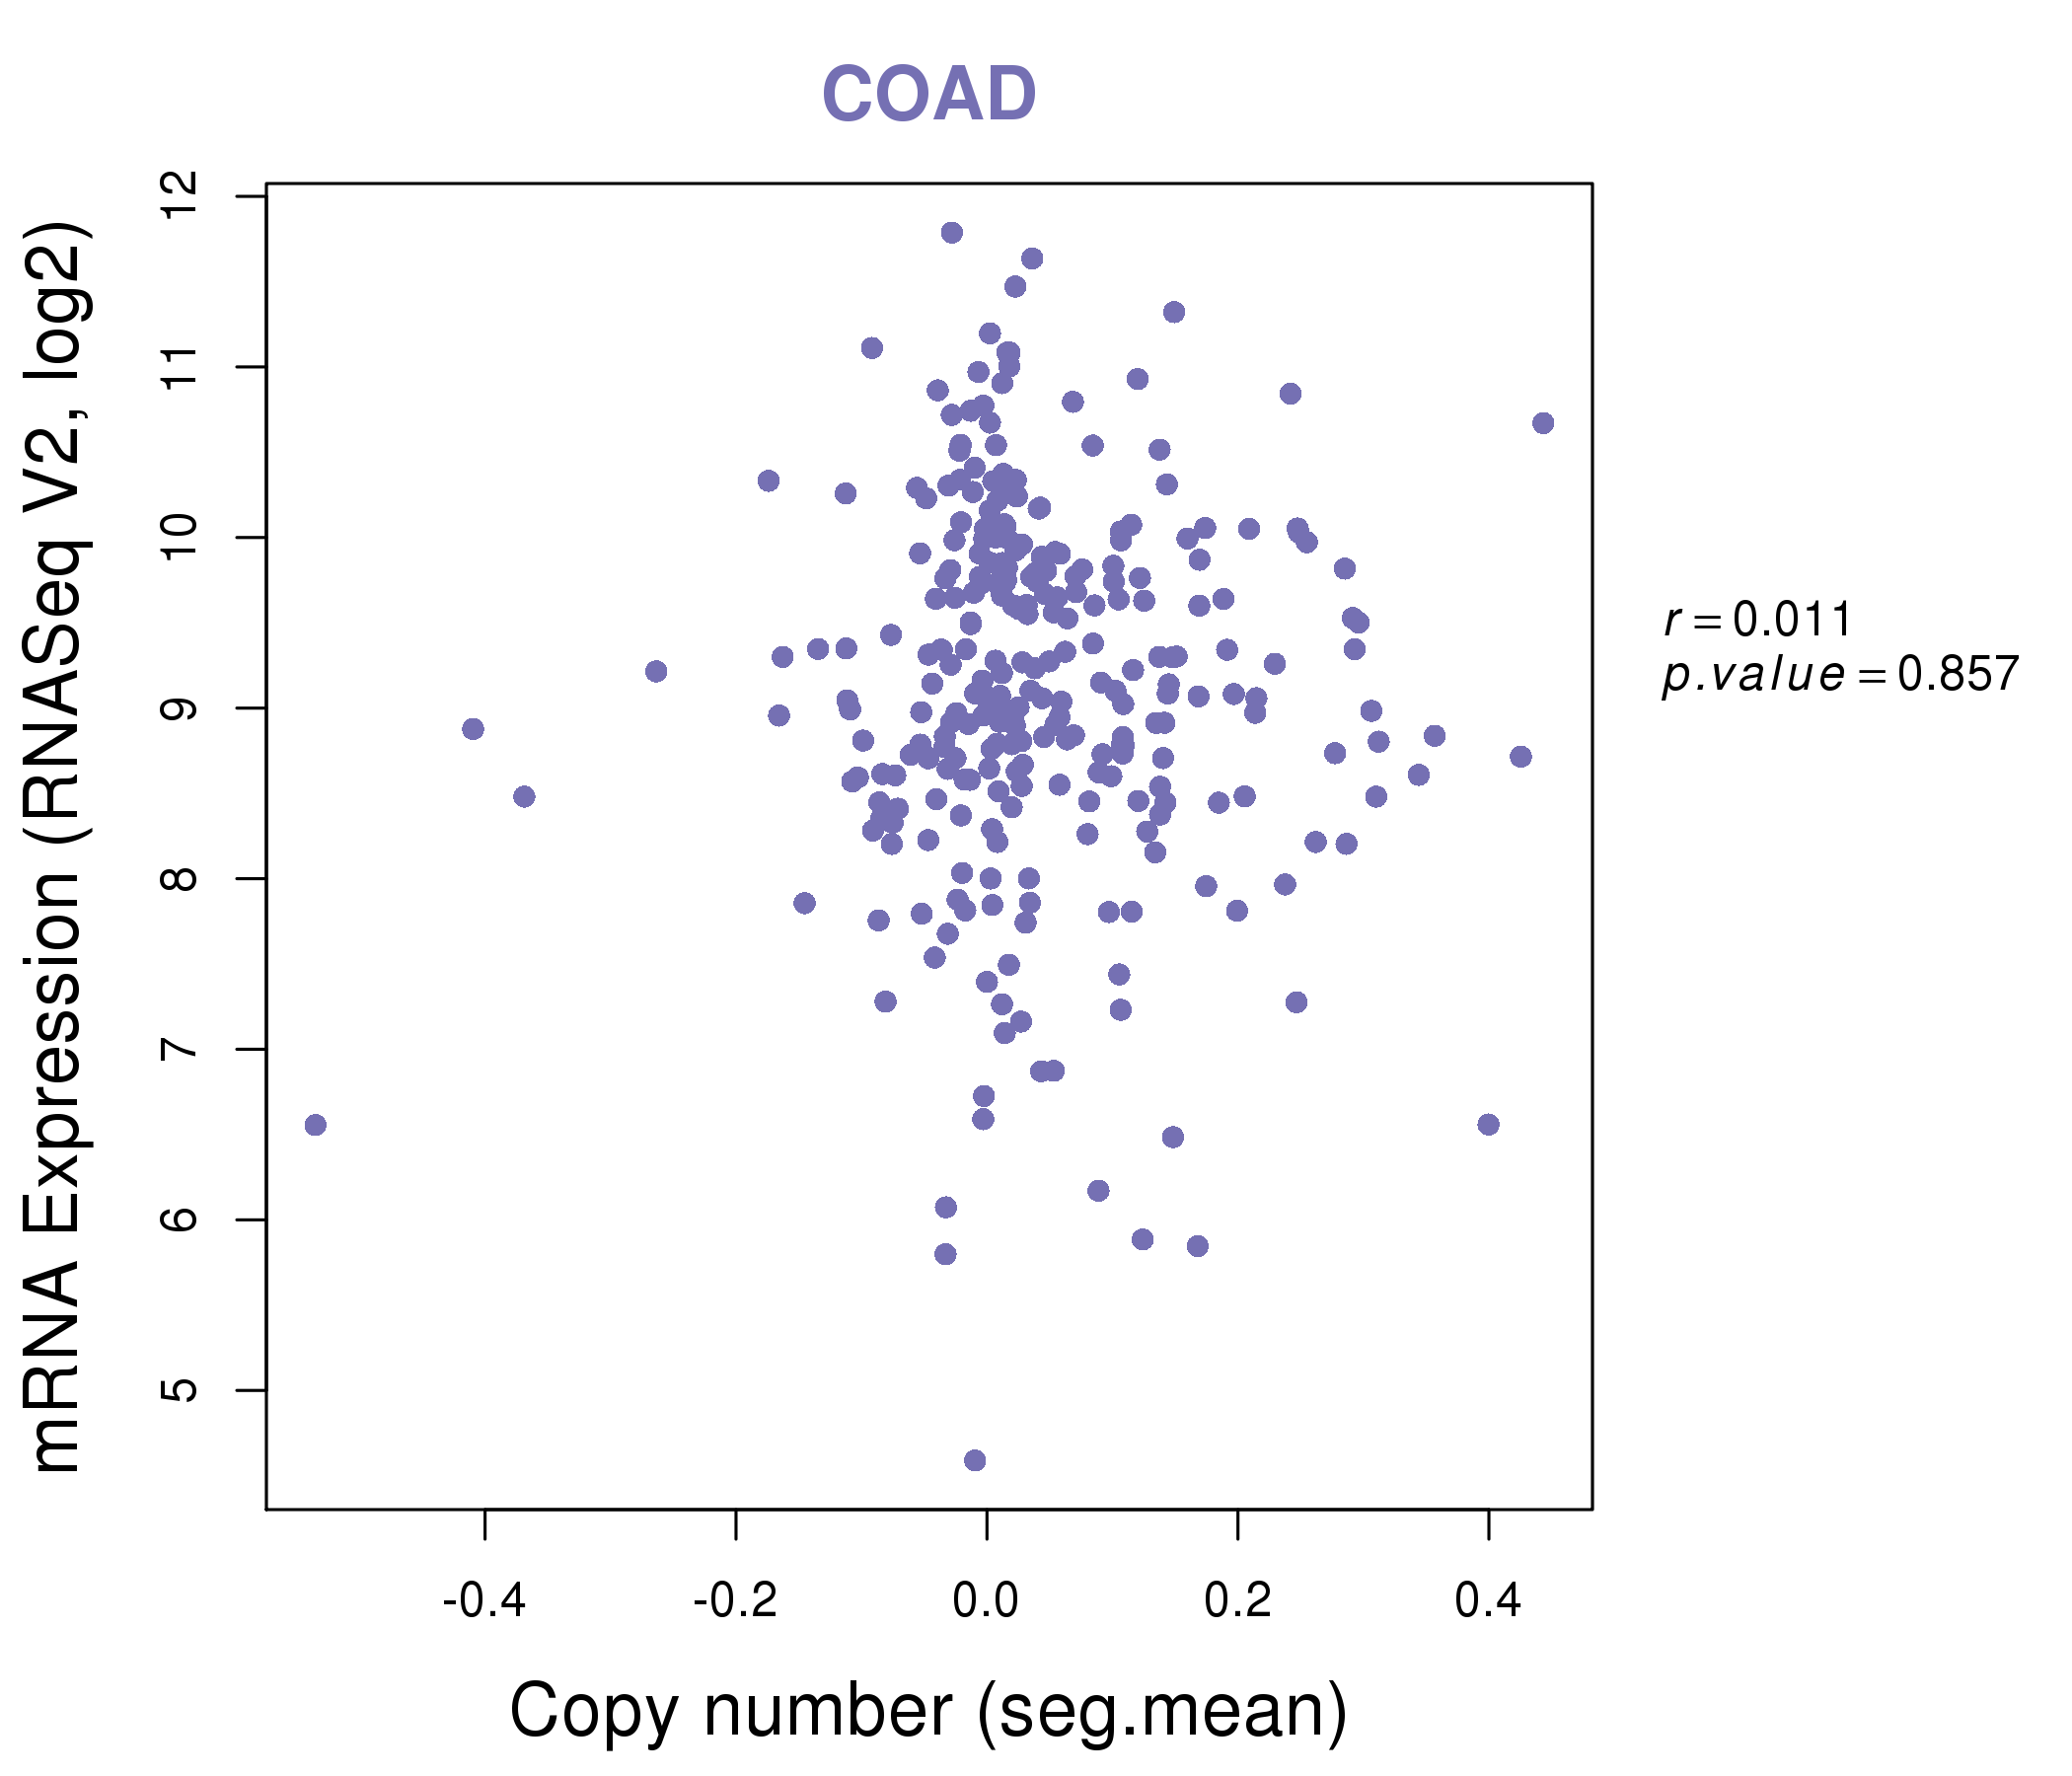
| * Copy number data were extracted from TCGA using R package TCGA-Assembler. The URLs of all public data files on TCGA DCC data server were gathered on Jan-05-2015. Function ProcessCNAData in TCGA-Assembler package was used to obtain gene-level copy number value which is calculated as the average copy number of the genomic region of a gene. |
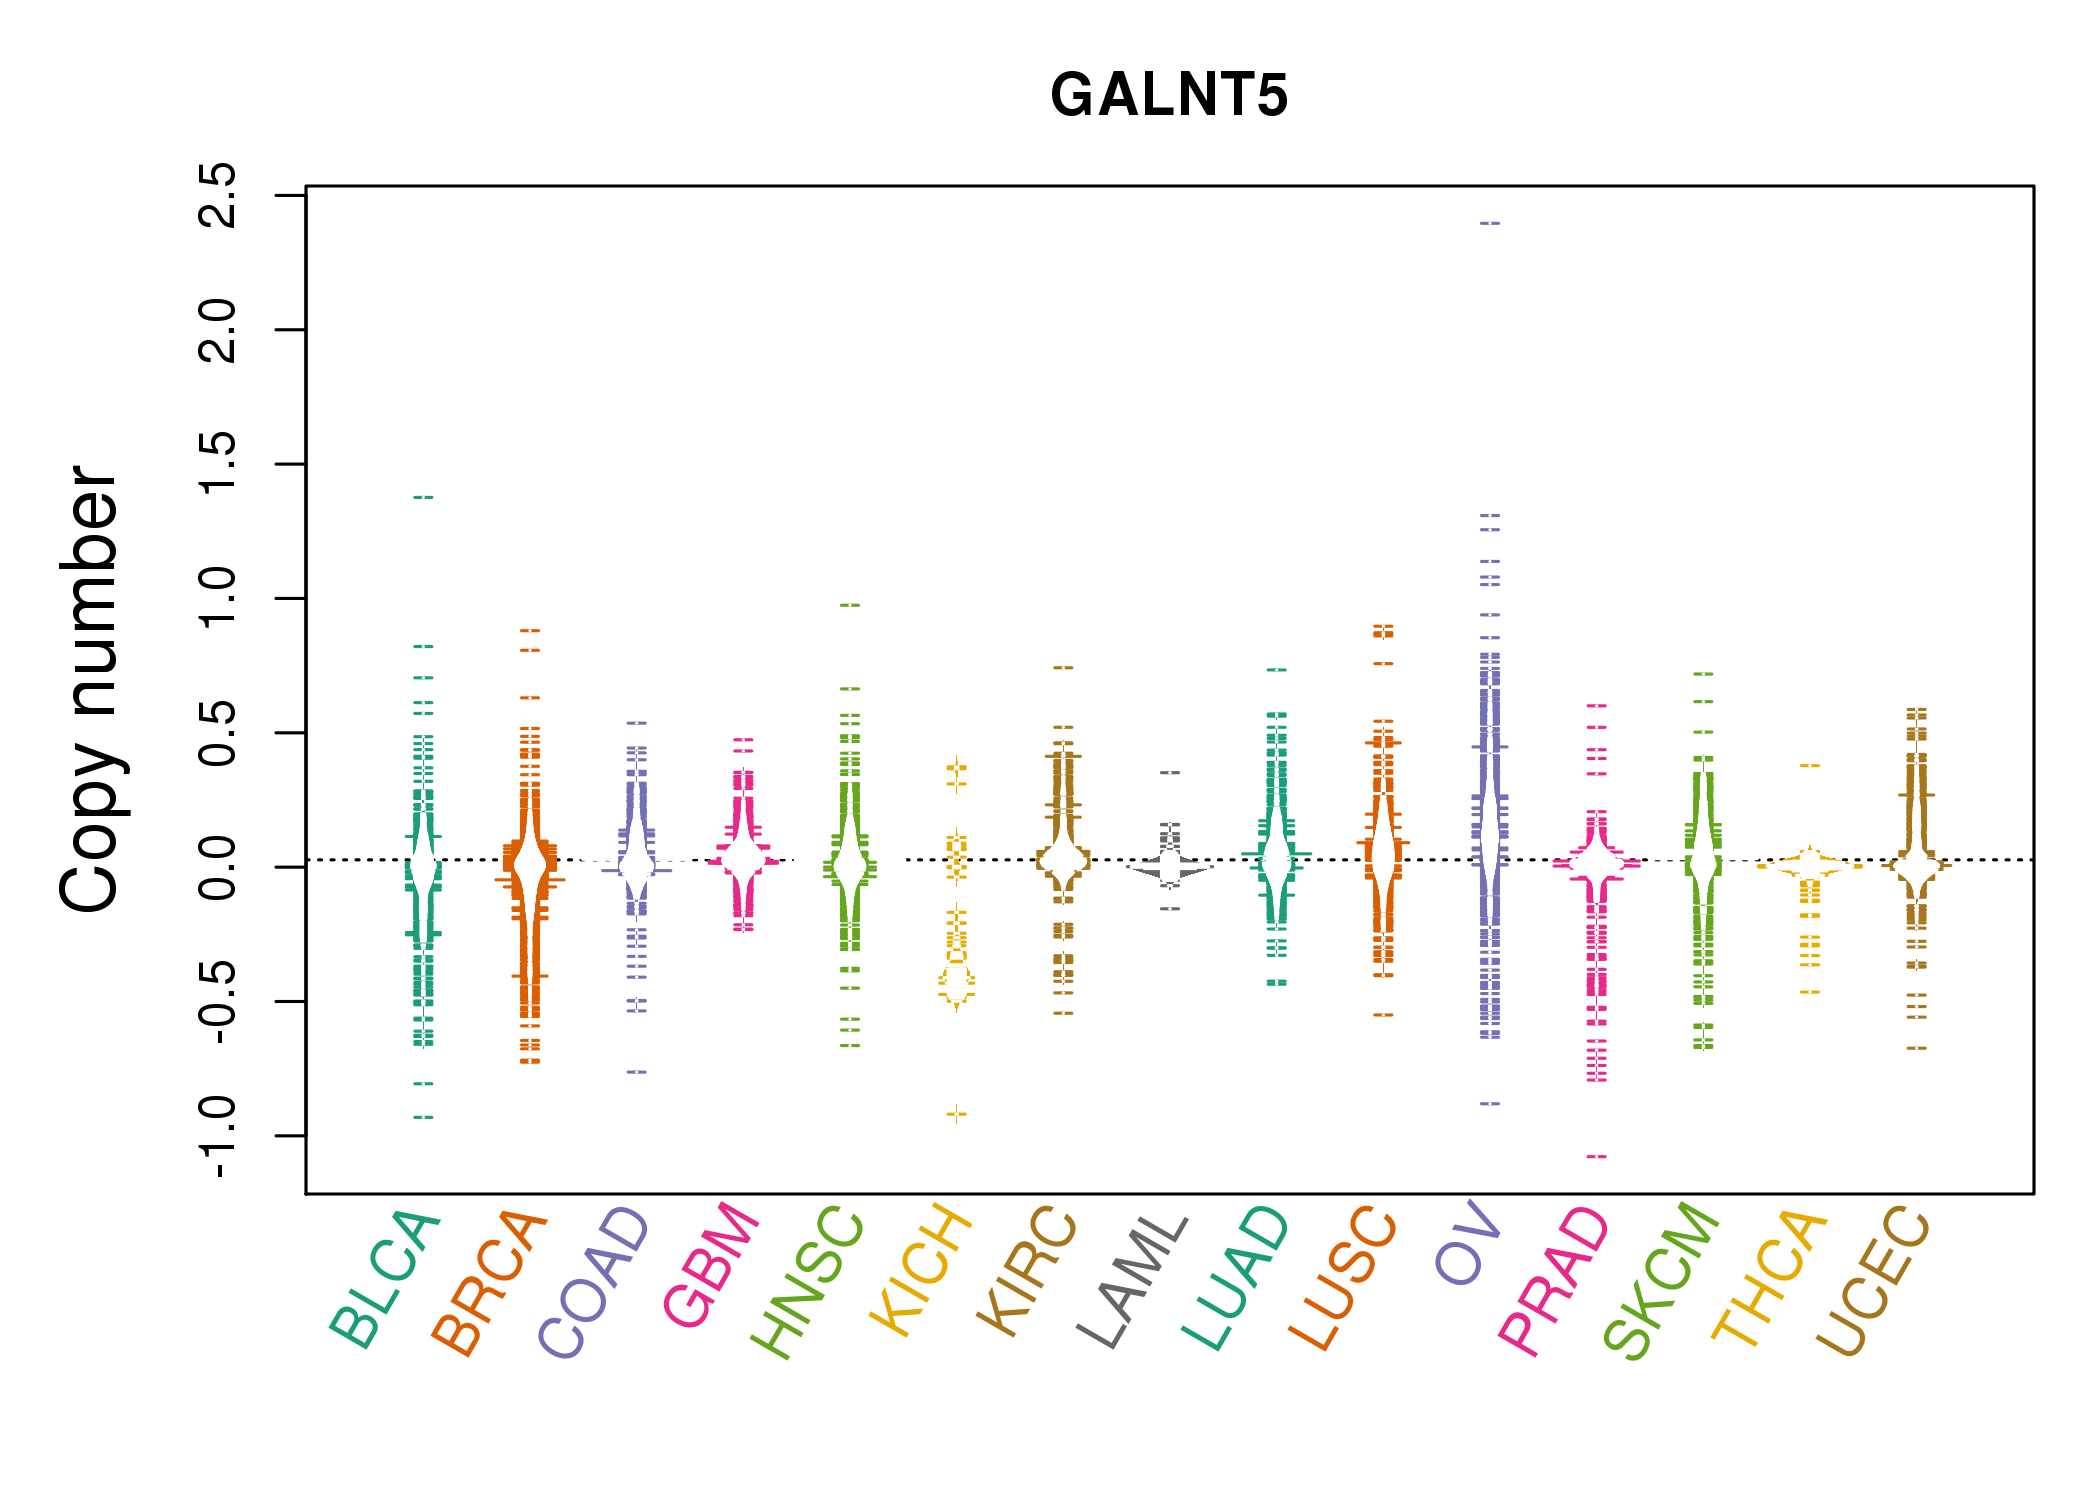 |
| cf) Tissue ID[Tissue type]: BLCA[Bladder Urothelial Carcinoma], BRCA[Breast invasive carcinoma], CESC[Cervical squamous cell carcinoma and endocervical adenocarcinoma], COAD[Colon adenocarcinoma], GBM[Glioblastoma multiforme], Glioma Low Grade, HNSC[Head and Neck squamous cell carcinoma], KICH[Kidney Chromophobe], KIRC[Kidney renal clear cell carcinoma], KIRP[Kidney renal papillary cell carcinoma], LAML[Acute Myeloid Leukemia], LUAD[Lung adenocarcinoma], LUSC[Lung squamous cell carcinoma], OV[Ovarian serous cystadenocarcinoma ], PAAD[Pancreatic adenocarcinoma], PRAD[Prostate adenocarcinoma], SKCM[Skin Cutaneous Melanoma], STAD[Stomach adenocarcinoma], THCA[Thyroid carcinoma], UCEC[Uterine Corpus Endometrial Carcinoma] |
| Top |
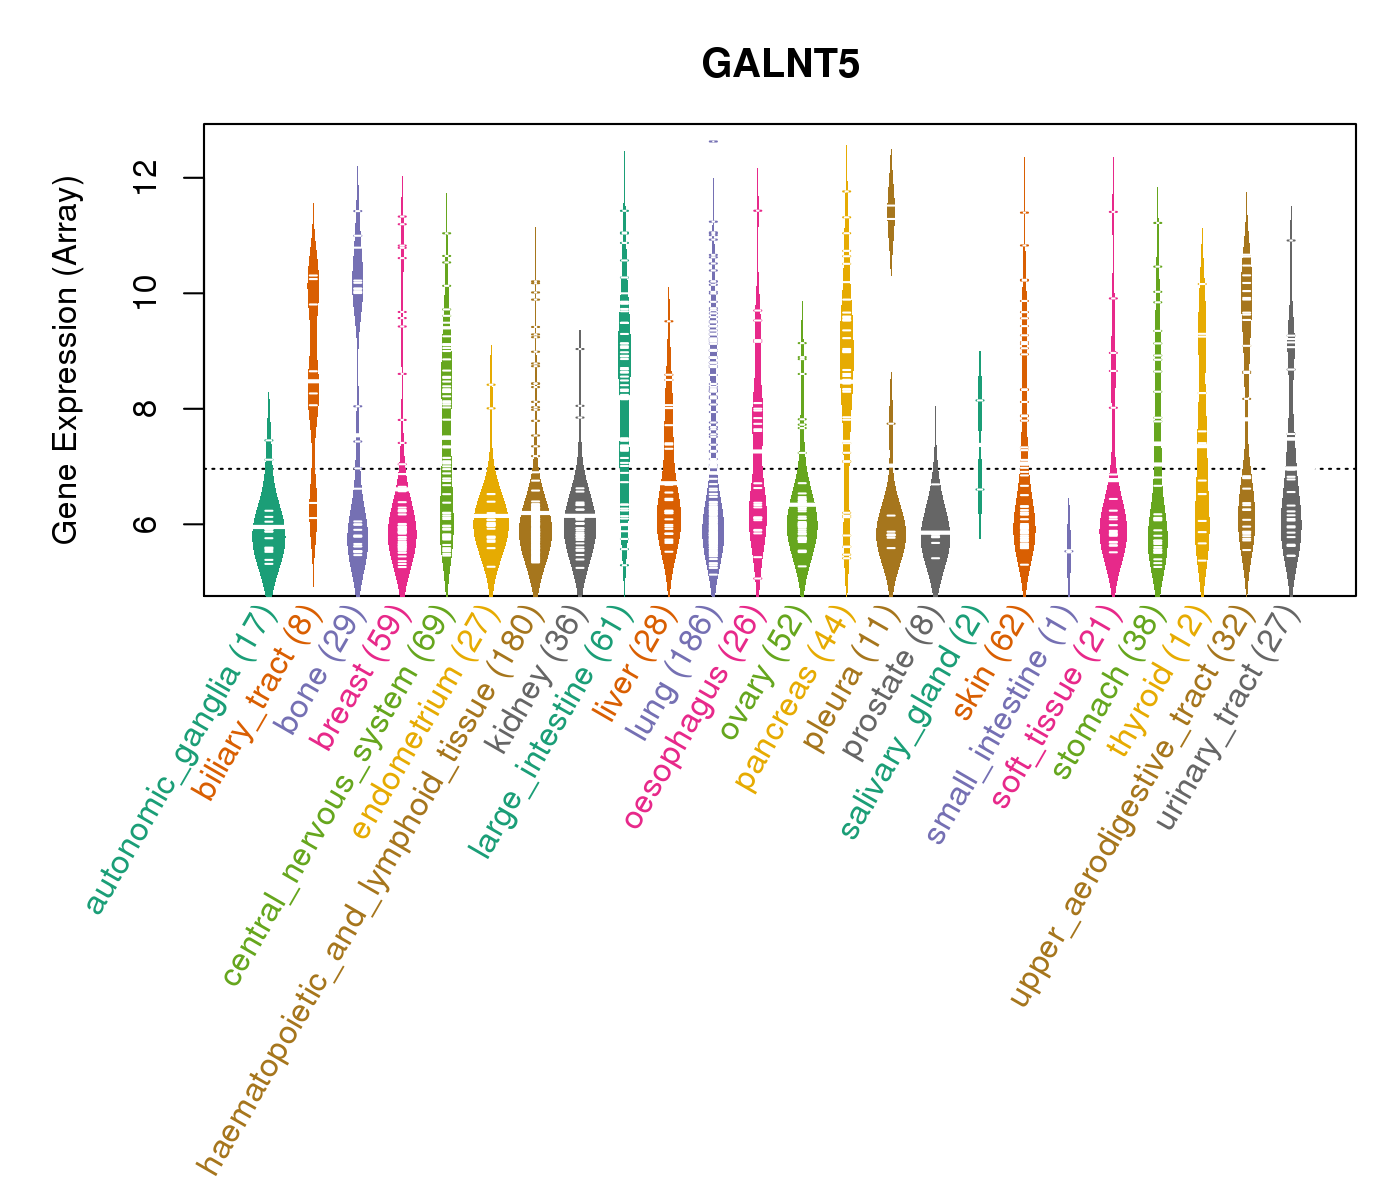
| Gene Expression for GALNT5 |
| * CCLE gene expression data were extracted from CCLE_Expression_Entrez_2012-10-18.res: Gene-centric RMA-normalized mRNA expression data. |
 |
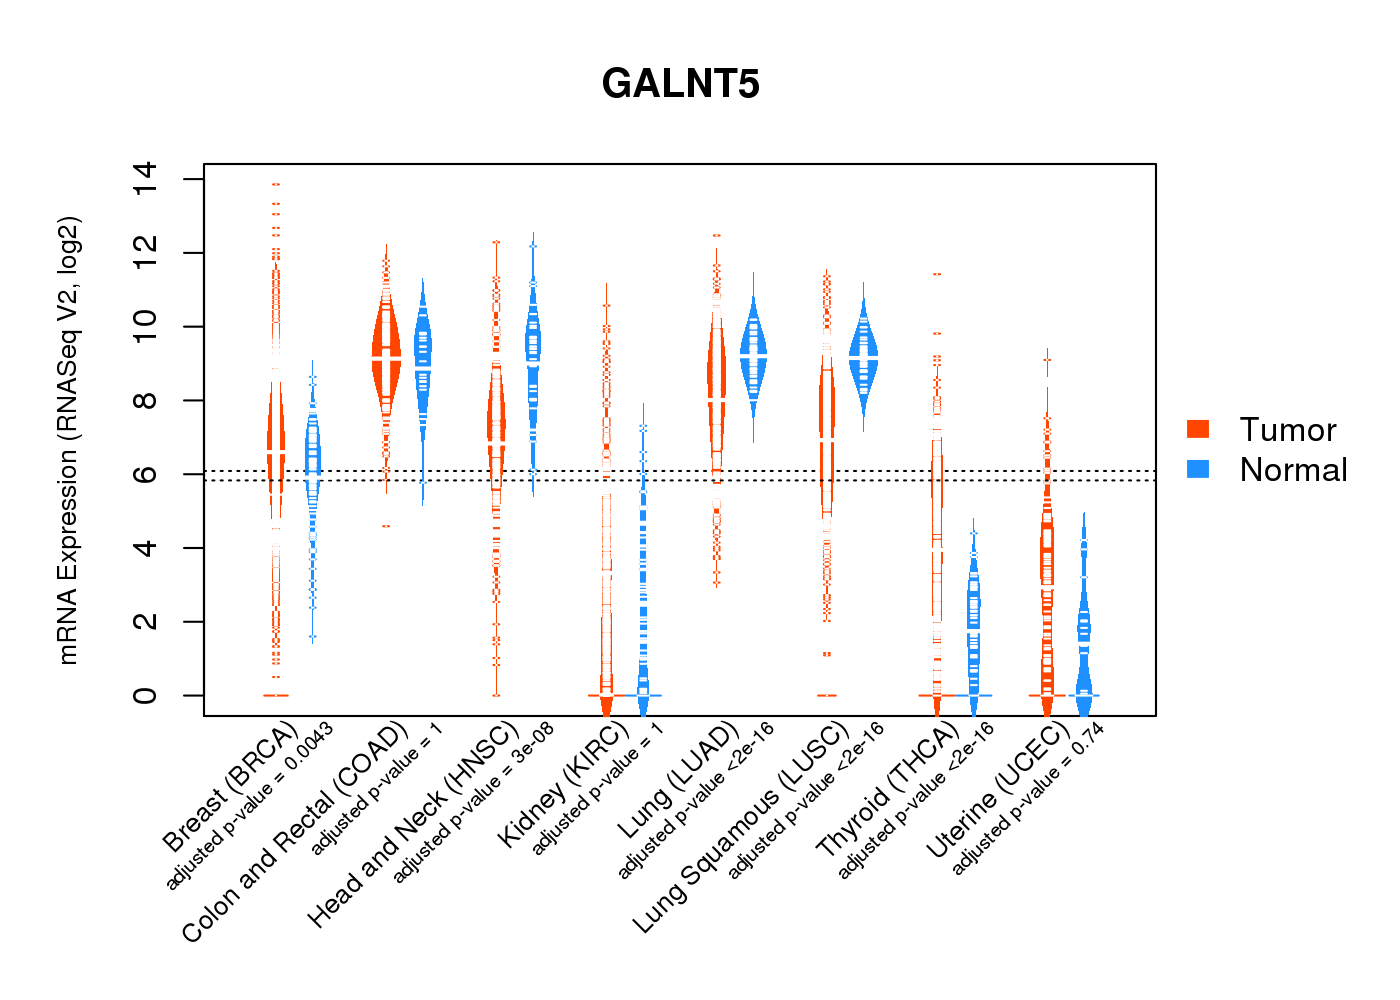
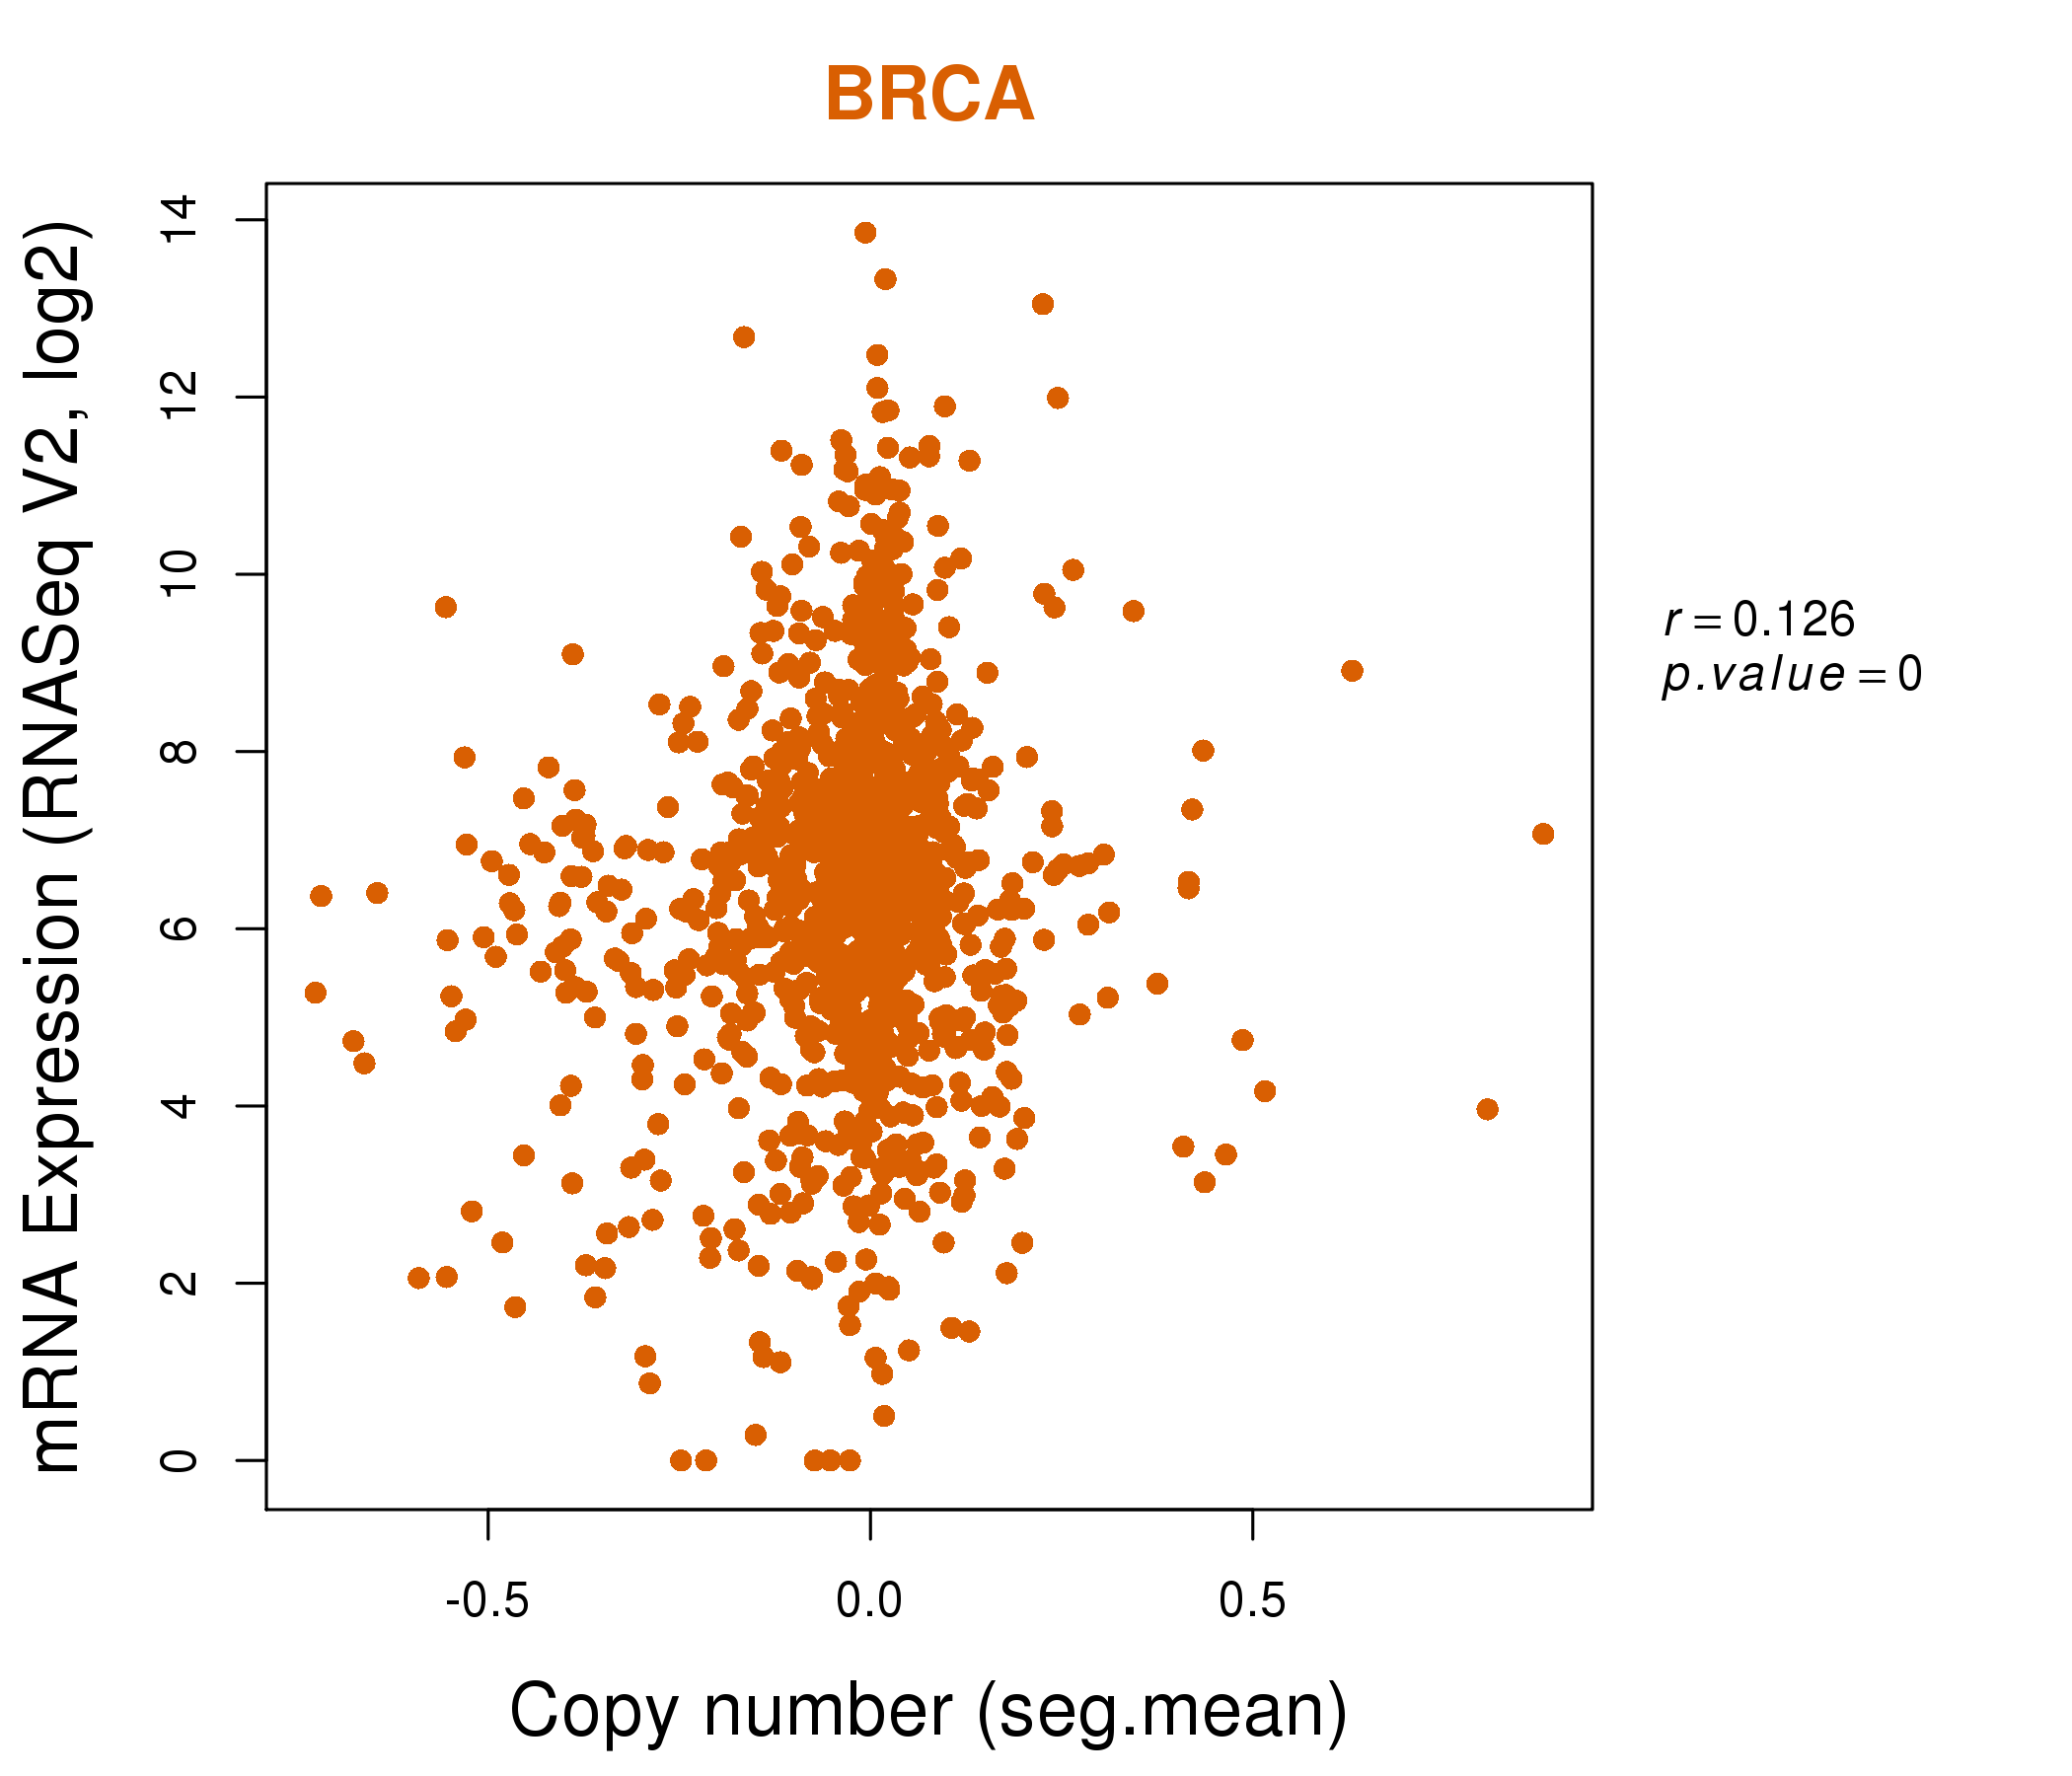
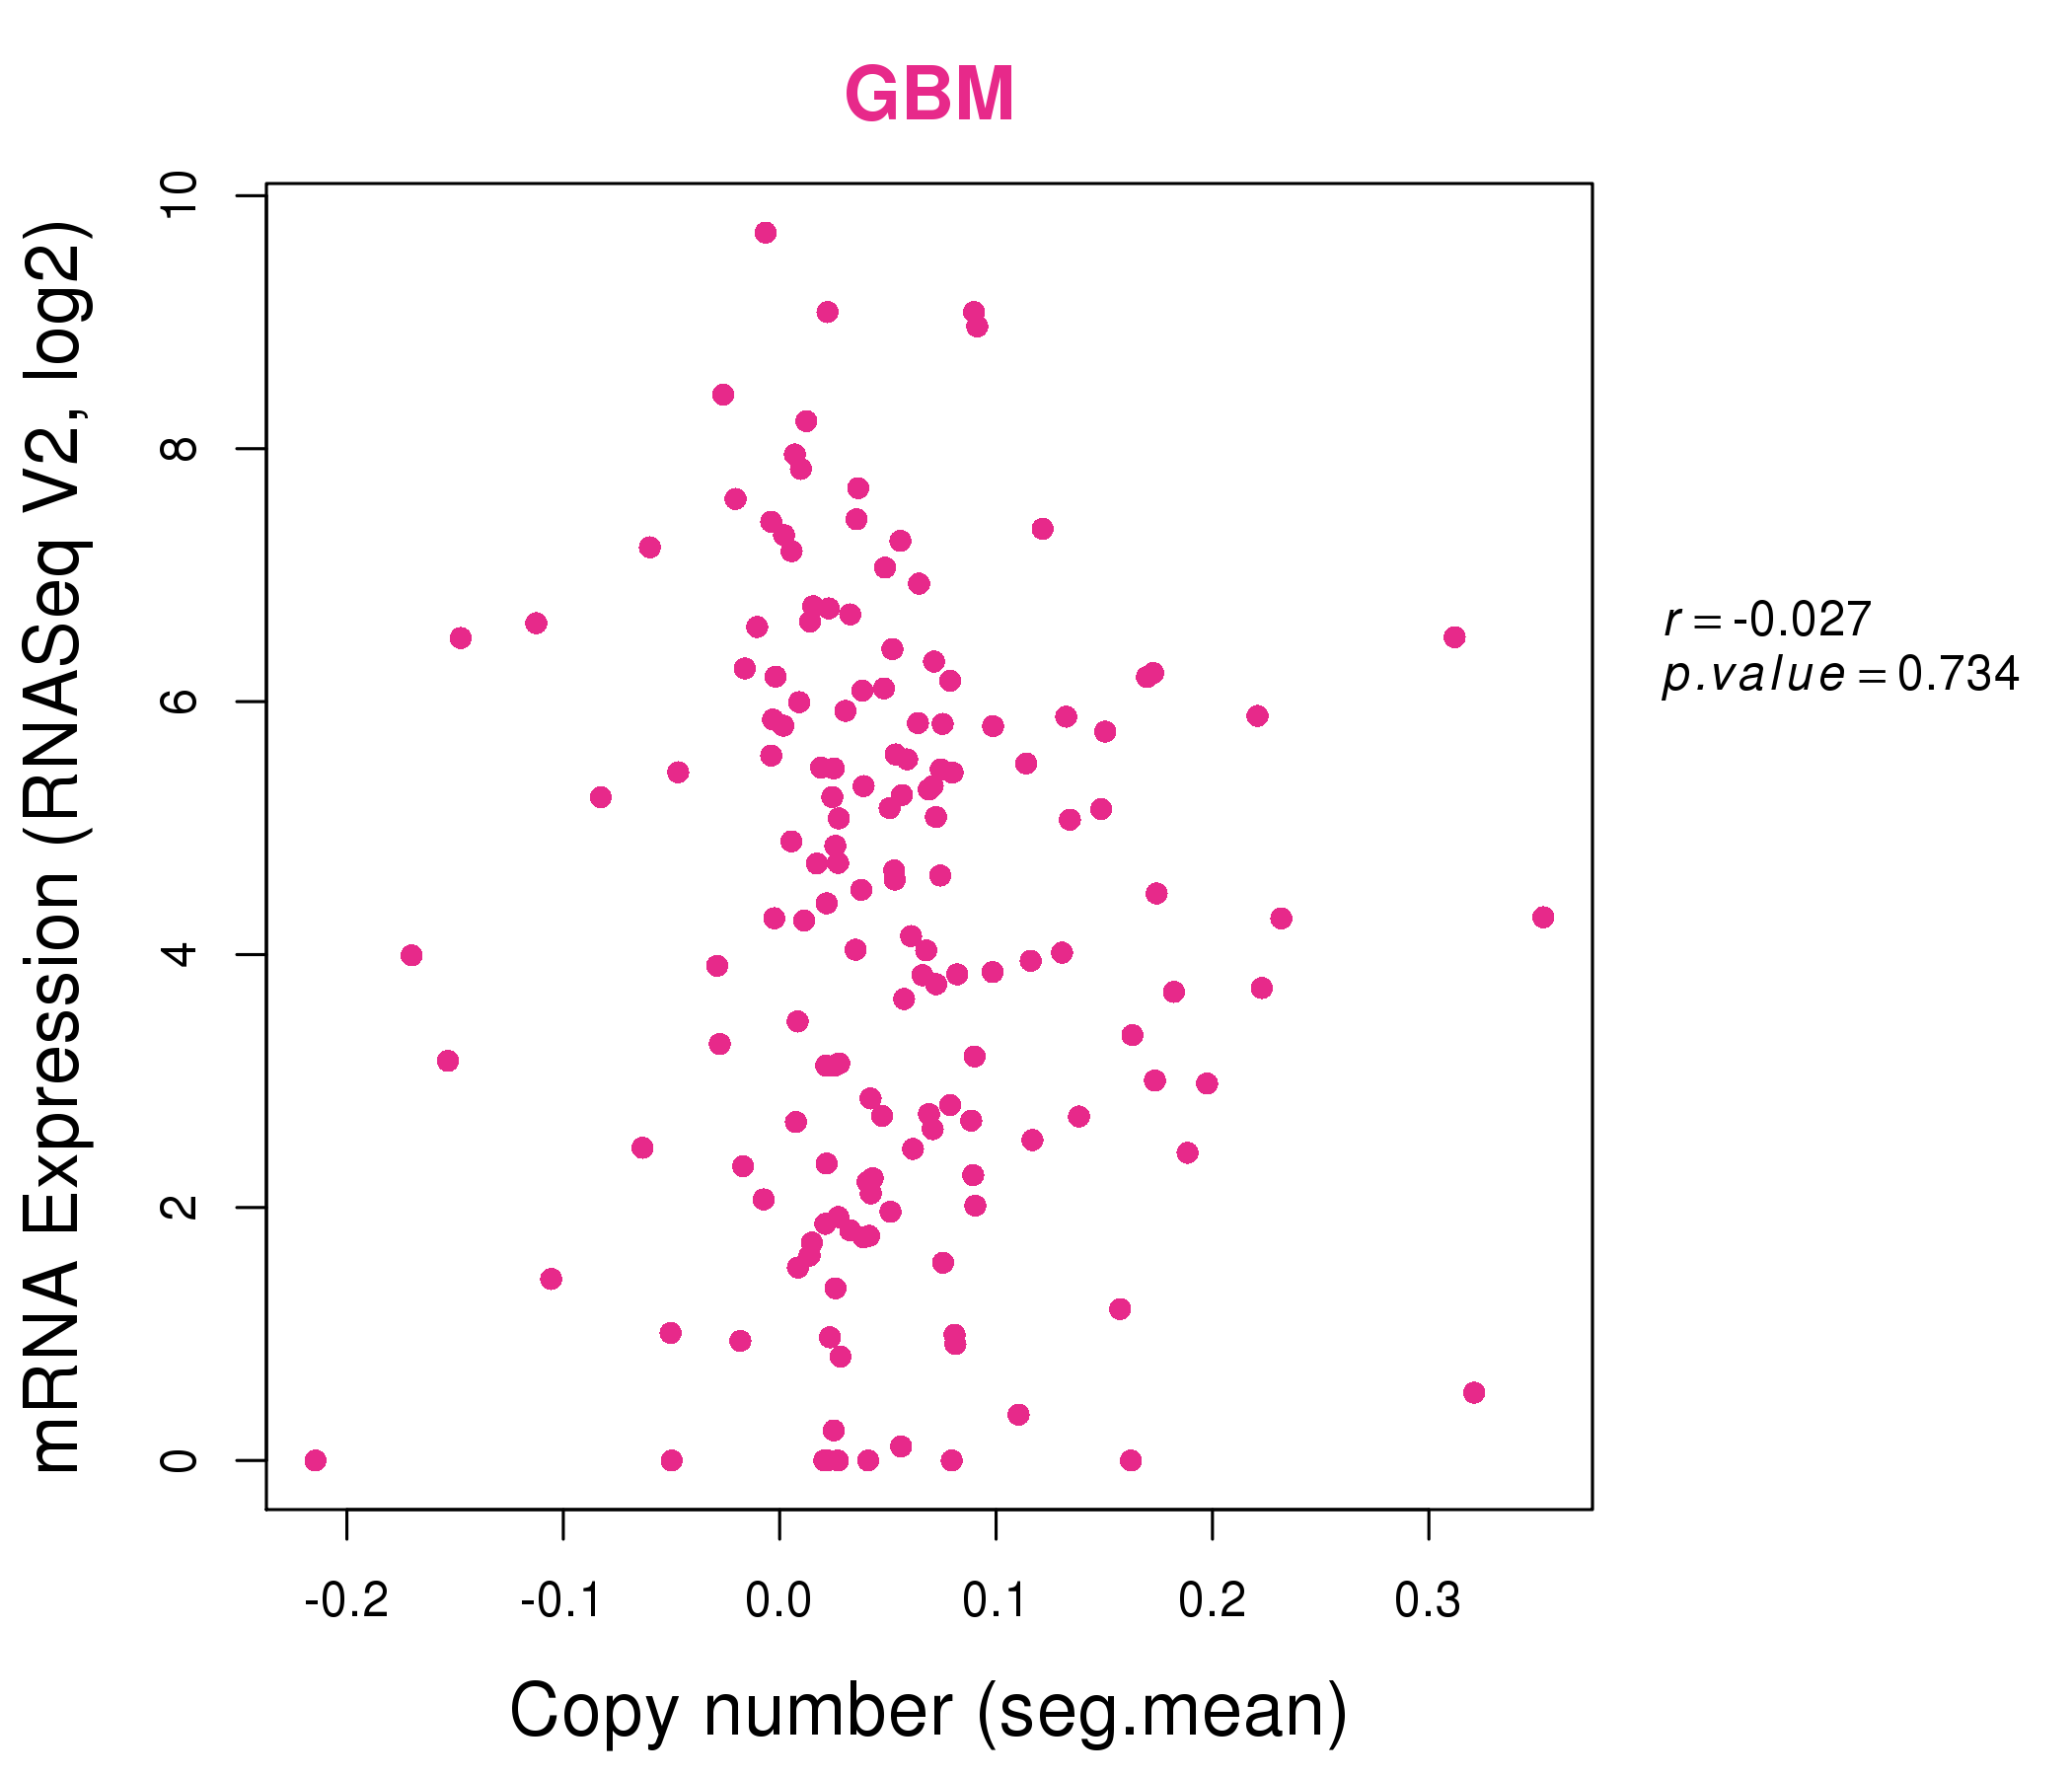
| * Normalized gene expression data of RNASeqV2 was extracted from TCGA using R package TCGA-Assembler. The URLs of all public data files on TCGA DCC data server were gathered at Jan-05-2015. Only eight cancer types have enough normal control samples for differential expression analysis. (t test, adjusted p<0.05 (using Benjamini-Hochberg FDR)) |
 |
| Top |
| * This plots show the correlation between CNV and gene expression. |
: Open all plots for all cancer types
 |
|
 |
|
| Top |
| Gene-Gene Network Information |
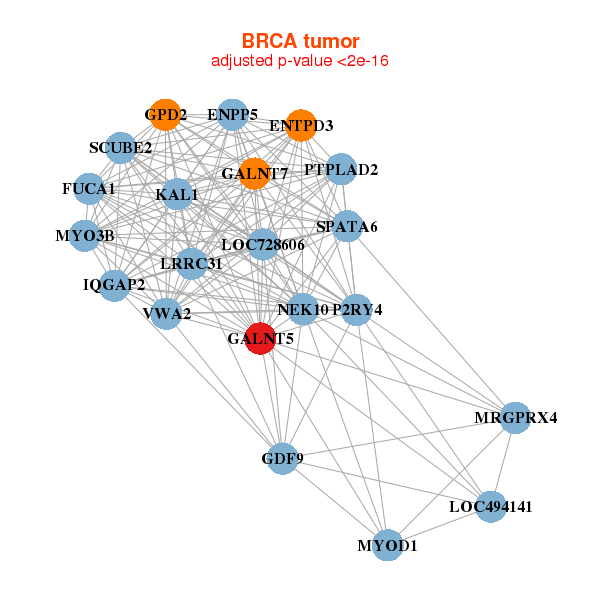
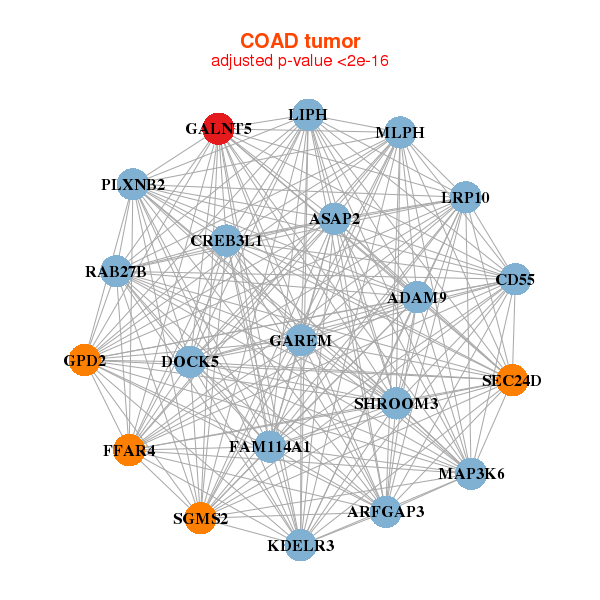
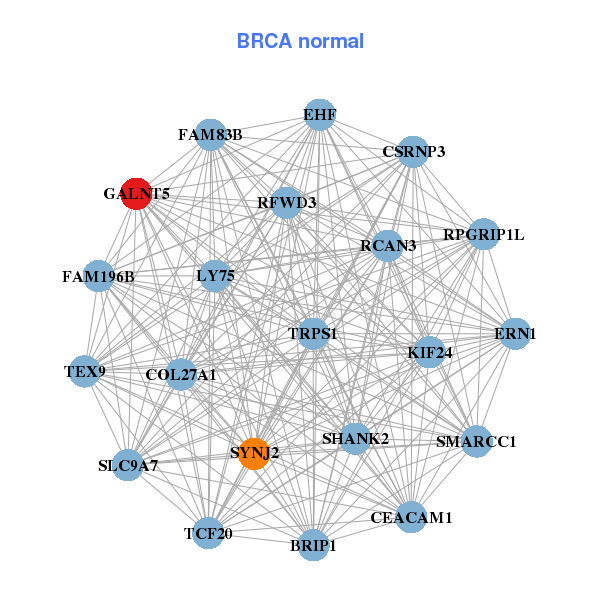
| * Co-Expression network figures were drawn using R package igraph. Only the top 20 genes with the highest correlations were shown. Red circle: input gene, orange circle: cell metabolism gene, sky circle: other gene |
: Open all plots for all cancer types
 |
|
| ENPP5,ENTPD3,FUCA1,GALNT5,GALNT7,GDF9,GPD2, IQGAP2,KAL1,LOC494141,LOC728606,LRRC31,MRGPRX4,MYO3B, MYOD1,NEK10,P2RY4,PTPLAD2,SCUBE2,SPATA6,VWA2 | BRIP1,CEACAM1,COL27A1,CSRNP3,EHF,ERN1,FAM196B, FAM83B,GALNT5,KIF24,LY75,RCAN3,RFWD3,RPGRIP1L, SHANK2,SLC9A7,SMARCC1,SYNJ2,TCF20,TEX9,TRPS1 |
 |
|
| ADAM9,ARFGAP3,ASAP2,CD55,CREB3L1,DOCK5,FAM114A1, GAREM,GALNT5,GPD2,FFAR4,KDELR3,LIPH,LRP10, MAP3K6,MLPH,PLXNB2,RAB27B,SEC24D,SGMS2,SHROOM3 | CKAP4,CREB3L1,FAM177B,FOXA2,GALNT5,FFAR4,JPH1, MAP3K5,MCF2L,MLPH,MUC12,QSOX1,SCEL,SIDT1, SLC12A8,SLC17A9,SLC39A7,SLC45A3,SPON1,ST3GAL4,TTC39A |
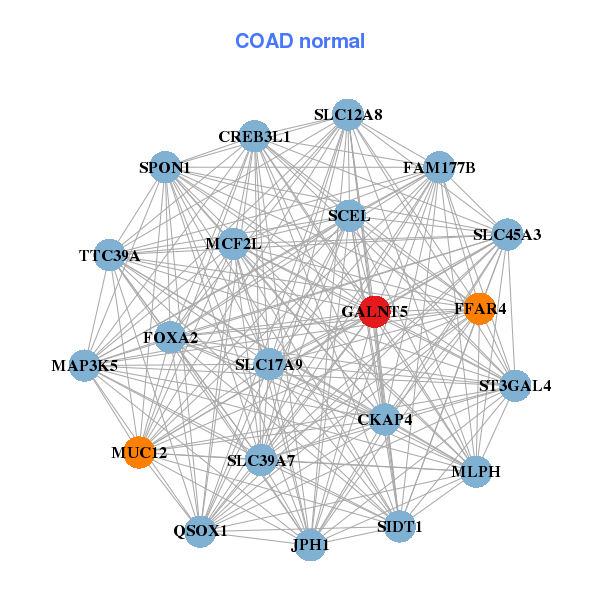
| * Co-Expression network figures were drawn using R package igraph. Only the top 20 genes with the highest correlations were shown. Red circle: input gene, orange circle: cell metabolism gene, sky circle: other gene |
: Open all plots for all cancer types
| Top |
: Open all interacting genes' information including KEGG pathway for all interacting genes from DAVID
| Top |
| Pharmacological Information for GALNT5 |
| There's no related Drug. |
| Top |
| Cross referenced IDs for GALNT5 |
| * We obtained these cross-references from Uniprot database. It covers 150 different DBs, 18 categories. http://www.uniprot.org/help/cross_references_section |
: Open all cross reference information
|
Copyright © 2016-Present - The Univsersity of Texas Health Science Center at Houston @ |