|
|||||||||||||||||||||||||||||||||||||||||||||||||||||||||||||||||||||||||||||||||||||||||||||||||||||||||||||||||||||||||||||||||||||||||||||||||||||||||||||||||||||||||||||||||||||||||||||||||||||||||||||||||||||||||||||||||||||||||||||||||||||||||||||||||||||||||||||||||||||||||||||||||||||||||||||||||||||||||||||||||||||||||||||||||||||||||||||||||||||||||||
| |
| Phenotypic Information (metabolism pathway, cancer, disease, phenome) |
| |
| |
| Gene-Gene Network Information: Co-Expression Network, Interacting Genes & KEGG |
| |
|


| Gene Summary for MAN1B1 |
| Basic gene info. | Gene symbol | MAN1B1 |
| Gene name | mannosidase, alpha, class 1B, member 1 | |
| Synonyms | ERMAN1|MANA-ER|MRT15 | |
| Cytomap | UCSC genome browser: 9q34 | |
| Genomic location | chr9 :139981378-140003639 | |
| Type of gene | protein-coding | |
| RefGenes | NM_016219.4, NR_045720.1,NR_045721.1, | |
| Ensembl id | ENSG00000177239 | |
| Description | ER alpha 1,2-mannosidaseMan9GlcNAc2-specific processing alpha-mannosidaseendoplasmic reticulum mannosyl-oligosaccharide 1,2-alpha-mannosidaseendoplasmic reticulum mannosyl-oligosaccharide 1,2-alpha-mannosidase 1 | |
| Modification date | 20141219 | |
| dbXrefs | MIM : 604346 | |
| HGNC : HGNC | ||
| Ensembl : ENSG00000177239 | ||
| HPRD : 05068 | ||
| Vega : OTTHUMG00000020978 | ||
| Protein | UniProt: go to UniProt's Cross Reference DB Table | |
| Expression | CleanEX: HS_MAN1B1 | |
| BioGPS: 11253 | ||
| Gene Expression Atlas: ENSG00000177239 | ||
| The Human Protein Atlas: ENSG00000177239 | ||
| Pathway | NCI Pathway Interaction Database: MAN1B1 | |
| KEGG: MAN1B1 | ||
| REACTOME: MAN1B1 | ||
| ConsensusPathDB | ||
| Pathway Commons: MAN1B1 | ||
| Metabolism | MetaCyc: MAN1B1 | |
| HUMANCyc: MAN1B1 | ||
| Regulation | Ensembl's Regulation: ENSG00000177239 | |
| miRBase: chr9 :139,981,378-140,003,639 | ||
| TargetScan: NM_016219 | ||
| cisRED: ENSG00000177239 | ||
| Context | iHOP: MAN1B1 | |
| cancer metabolism search in PubMed: MAN1B1 | ||
| UCL Cancer Institute: MAN1B1 | ||
| Assigned class in ccmGDB | C | |
| Top |
| Phenotypic Information for MAN1B1(metabolism pathway, cancer, disease, phenome) |
| Cancer | CGAP: MAN1B1 |
| Familial Cancer Database: MAN1B1 | |
| * This gene is included in those cancer gene databases. |
|
|
|
|
|
|
| |||||||||||||||||||||||||||||||||||||||||||||||||||||||||||||||||||||||||||||||||||||||||||||||||||||||||||||||||||||||||||||||||||||||||||||||||||||||||||||||||||||||||||||||||||||||||||||||||||||||||||||||||||||||||||||||||||||||||||||||||||||||||||||||||||||||||||||||||||||||||||||||||||||||||||||||||||||||||||||||||||||||||||||||||||||||||||||||||||||
Oncogene 1 | Significant driver gene in | ||||||||||||||||||||||||||||||||||||||||||||||||||||||||||||||||||||||||||||||||||||||||||||||||||||||||||||||||||||||||||||||||||||||||||||||||||||||||||||||||||||||||||||||||||||||||||||||||||||||||||||||||||||||||||||||||||||||||||||||||||||||||||||||||||||||||||||||||||||||||||||||||||||||||||||||||||||||||||||||||||||||||||||||||||||||||||||||||||||||||||
| cf) number; DB name 1 Oncogene; http://nar.oxfordjournals.org/content/35/suppl_1/D721.long, 2 Tumor Suppressor gene; https://bioinfo.uth.edu/TSGene/, 3 Cancer Gene Census; http://www.nature.com/nrc/journal/v4/n3/abs/nrc1299.html, 4 CancerGenes; http://nar.oxfordjournals.org/content/35/suppl_1/D721.long, 5 Network of Cancer Gene; http://ncg.kcl.ac.uk/index.php, 1Therapeutic Vulnerabilities in Cancer; http://cbio.mskcc.org/cancergenomics/statius/ |
| REACTOME_METABOLISM_OF_PROTEINS | |
| OMIM | |
| Orphanet | |
| Disease | KEGG Disease: MAN1B1 |
| MedGen: MAN1B1 (Human Medical Genetics with Condition) | |
| ClinVar: MAN1B1 | |
| Phenotype | MGI: MAN1B1 (International Mouse Phenotyping Consortium) |
| PhenomicDB: MAN1B1 | |
| Mutations for MAN1B1 |
| * Under tables are showing count per each tissue to give us broad intuition about tissue specific mutation patterns.You can go to the detailed page for each mutation database's web site. |
| - Statistics for Tissue and Mutation type | Top |
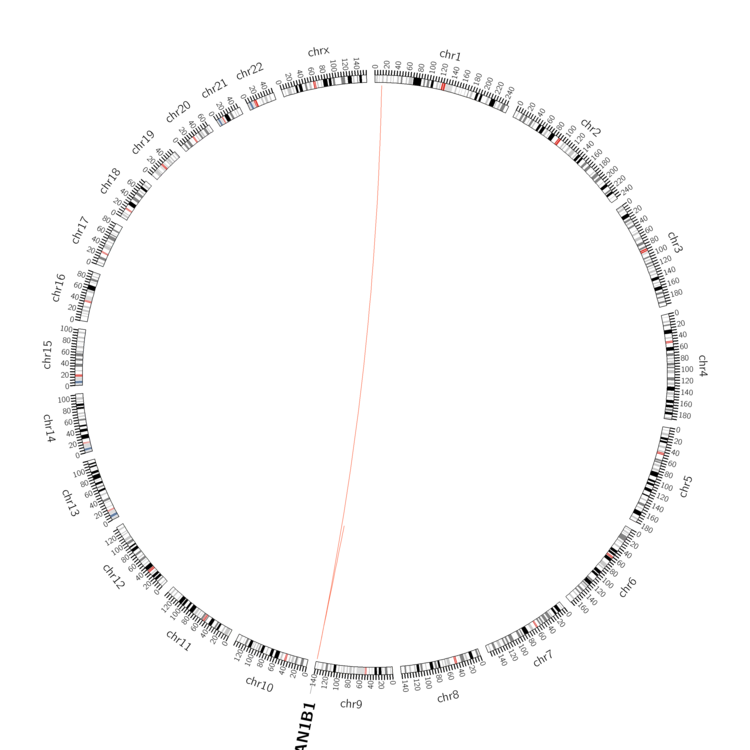 |
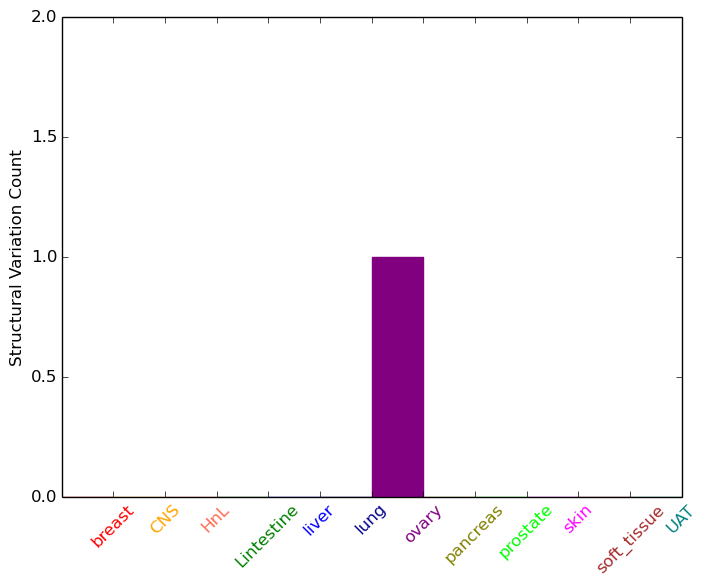
| - For Inter-chromosomal Variations |
| * Inter-chromosomal variantions includes 'interchromosomal amplicon to amplicon', 'interchromosomal amplicon to non-amplified dna', 'interchromosomal insertion', 'Interchromosomal unknown type'. |
 |
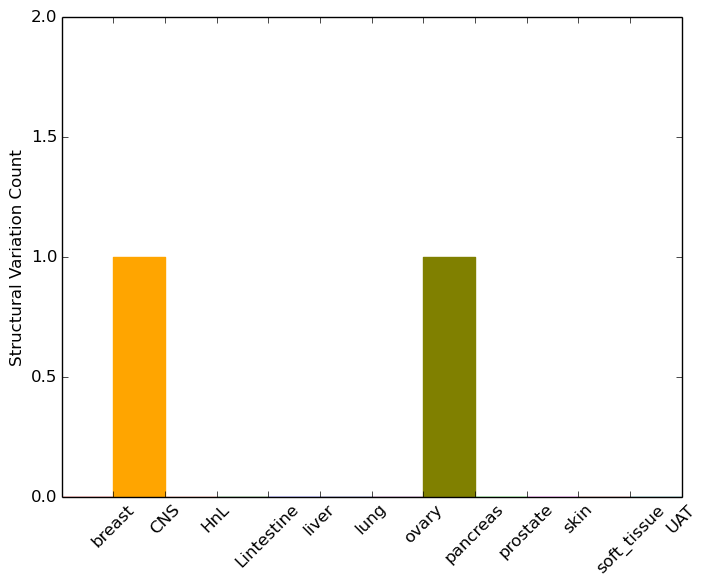
| - For Intra-chromosomal Variations |
| * Intra-chromosomal variantions includes 'intrachromosomal amplicon to amplicon', 'intrachromosomal amplicon to non-amplified dna', 'intrachromosomal deletion', 'intrachromosomal fold-back inversion', 'intrachromosomal inversion', 'intrachromosomal tandem duplication', 'Intrachromosomal unknown type', 'intrachromosomal with inverted orientation', 'intrachromosomal with non-inverted orientation'. |
 |
| Sample | Symbol_a | Chr_a | Start_a | End_a | Symbol_b | Chr_b | Start_b | End_b |
| central_nervous_system | MAN1B1 | chr9 | 139996694 | 139996694 | MAN1B1 | chr9 | 139997341 | 139997341 |
| ovary | MAN1B1 | chr9 | 139994937 | 139994957 | chr1 | 12770646 | 12770666 | |
| pancreas | MAN1B1 | chr9 | 139996763 | 139996783 | MAN1B1 | chr9 | 139996529 | 139996549 |
| cf) Tissue number; Tissue name (1;Breast, 2;Central_nervous_system, 3;Haematopoietic_and_lymphoid_tissue, 4;Large_intestine, 5;Liver, 6;Lung, 7;Ovary, 8;Pancreas, 9;Prostate, 10;Skin, 11;Soft_tissue, 12;Upper_aerodigestive_tract) |
| * From mRNA Sanger sequences, Chitars2.0 arranged chimeric transcripts. This table shows MAN1B1 related fusion information. |
| ID | Head Gene | Tail Gene | Accession | Gene_a | qStart_a | qEnd_a | Chromosome_a | tStart_a | tEnd_a | Gene_a | qStart_a | qEnd_a | Chromosome_a | tStart_a | tEnd_a |
| BF915326 | AMPD3 | 19 | 251 | 11 | 10494805 | 10495037 | MAN1B1 | 250 | 541 | 9 | 139981514 | 139983346 | |
| Top |
| Mutation type/ Tissue ID | brca | cns | cerv | endome | haematopo | kidn | Lintest | liver | lung | ns | ovary | pancre | prost | skin | stoma | thyro | urina | |||
| Total # sample | 1 | |||||||||||||||||||
| GAIN (# sample) | 1 | |||||||||||||||||||
| LOSS (# sample) |
| cf) Tissue ID; Tissue type (1; Breast, 2; Central_nervous_system, 3; Cervix, 4; Endometrium, 5; Haematopoietic_and_lymphoid_tissue, 6; Kidney, 7; Large_intestine, 8; Liver, 9; Lung, 10; NS, 11; Ovary, 12; Pancreas, 13; Prostate, 14; Skin, 15; Stomach, 16; Thyroid, 17; Urinary_tract) |
| Top |
|
 |
| Top |
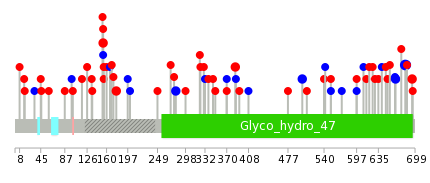
| Stat. for Non-Synonymous SNVs (# total SNVs=34) | (# total SNVs=14) |
 |  |
(# total SNVs=2) | (# total SNVs=0) |
 |
| Top |
| * When you move the cursor on each content, you can see more deailed mutation information on the Tooltip. Those are primary_site,primary_histology,mutation(aa),pubmedID. |
| GRCh37 position | Mutation(aa) | Unique sampleID count |
| chr9:140002989-140002989 | p.D682D | 4 |
| chr9:139983453-139983453 | p.S154L | 2 |
| chr9:140001201-140001201 | p.S502S | 2 |
| chr9:140002995-140002995 | p.Y684Y | 2 |
| chr9:139994260-139994260 | p.F281F | 2 |
| chr9:140003024-140003024 | p.P694R | 2 |
| chr9:139996024-139996024 | p.H385P | 2 |
| chr9:139990753-139990753 | p.L177R | 2 |
| chr9:139995548-139995548 | p.L339fs*2 | 2 |
| chr9:140002938-140002938 | p.L665L | 2 |
| Top |
|
 |
| Point Mutation/ Tissue ID | 1 | 2 | 3 | 4 | 5 | 6 | 7 | 8 | 9 | 10 | 11 | 12 | 13 | 14 | 15 | 16 | 17 | 18 | 19 | 20 |
| # sample | 4 | 2 | 5 | 2 | 1 | 5 | 1 | 2 | 5 | 8 | 3 | |||||||||
| # mutation | 5 | 2 | 5 | 2 | 1 | 5 | 1 | 2 | 5 | 9 | 5 | |||||||||
| nonsynonymous SNV | 5 | 2 | 2 | 1 | 4 | 1 | 4 | 6 | 5 | |||||||||||
| synonymous SNV | 3 | 1 | 1 | 1 | 1 | 1 | 1 | 3 |
| cf) Tissue ID; Tissue type (1; BLCA[Bladder Urothelial Carcinoma], 2; BRCA[Breast invasive carcinoma], 3; CESC[Cervical squamous cell carcinoma and endocervical adenocarcinoma], 4; COAD[Colon adenocarcinoma], 5; GBM[Glioblastoma multiforme], 6; Glioma Low Grade, 7; HNSC[Head and Neck squamous cell carcinoma], 8; KICH[Kidney Chromophobe], 9; KIRC[Kidney renal clear cell carcinoma], 10; KIRP[Kidney renal papillary cell carcinoma], 11; LAML[Acute Myeloid Leukemia], 12; LUAD[Lung adenocarcinoma], 13; LUSC[Lung squamous cell carcinoma], 14; OV[Ovarian serous cystadenocarcinoma ], 15; PAAD[Pancreatic adenocarcinoma], 16; PRAD[Prostate adenocarcinoma], 17; SKCM[Skin Cutaneous Melanoma], 18:STAD[Stomach adenocarcinoma], 19:THCA[Thyroid carcinoma], 20:UCEC[Uterine Corpus Endometrial Carcinoma]) |
| Top |
| * We represented just top 10 SNVs. When you move the cursor on each content, you can see more deailed mutation information on the Tooltip. Those are primary_site, primary_histology, mutation(aa), pubmedID. |
| Genomic Position | Mutation(aa) | Unique sampleID count |
| chr9:139994250 | p.P386P | 1 |
| chr9:139996044 | p.I695M | 1 |
| chr9:140002935 | p.S153L | 1 |
| chr9:139982623 | p.R388W | 1 |
| chr9:139994310 | p.H160Q | 1 |
| chr9:140000631 | p.D392N | 1 |
| chr9:140002967 | p.Q169K | 1 |
| chr9:139983342 | p.G437W | 1 |
| chr9:139995507 | p.P172H | 1 |
| chr9:140001201 | p.S502S | 1 |
| * Copy number data were extracted from TCGA using R package TCGA-Assembler. The URLs of all public data files on TCGA DCC data server were gathered on Jan-05-2015. Function ProcessCNAData in TCGA-Assembler package was used to obtain gene-level copy number value which is calculated as the average copy number of the genomic region of a gene. |
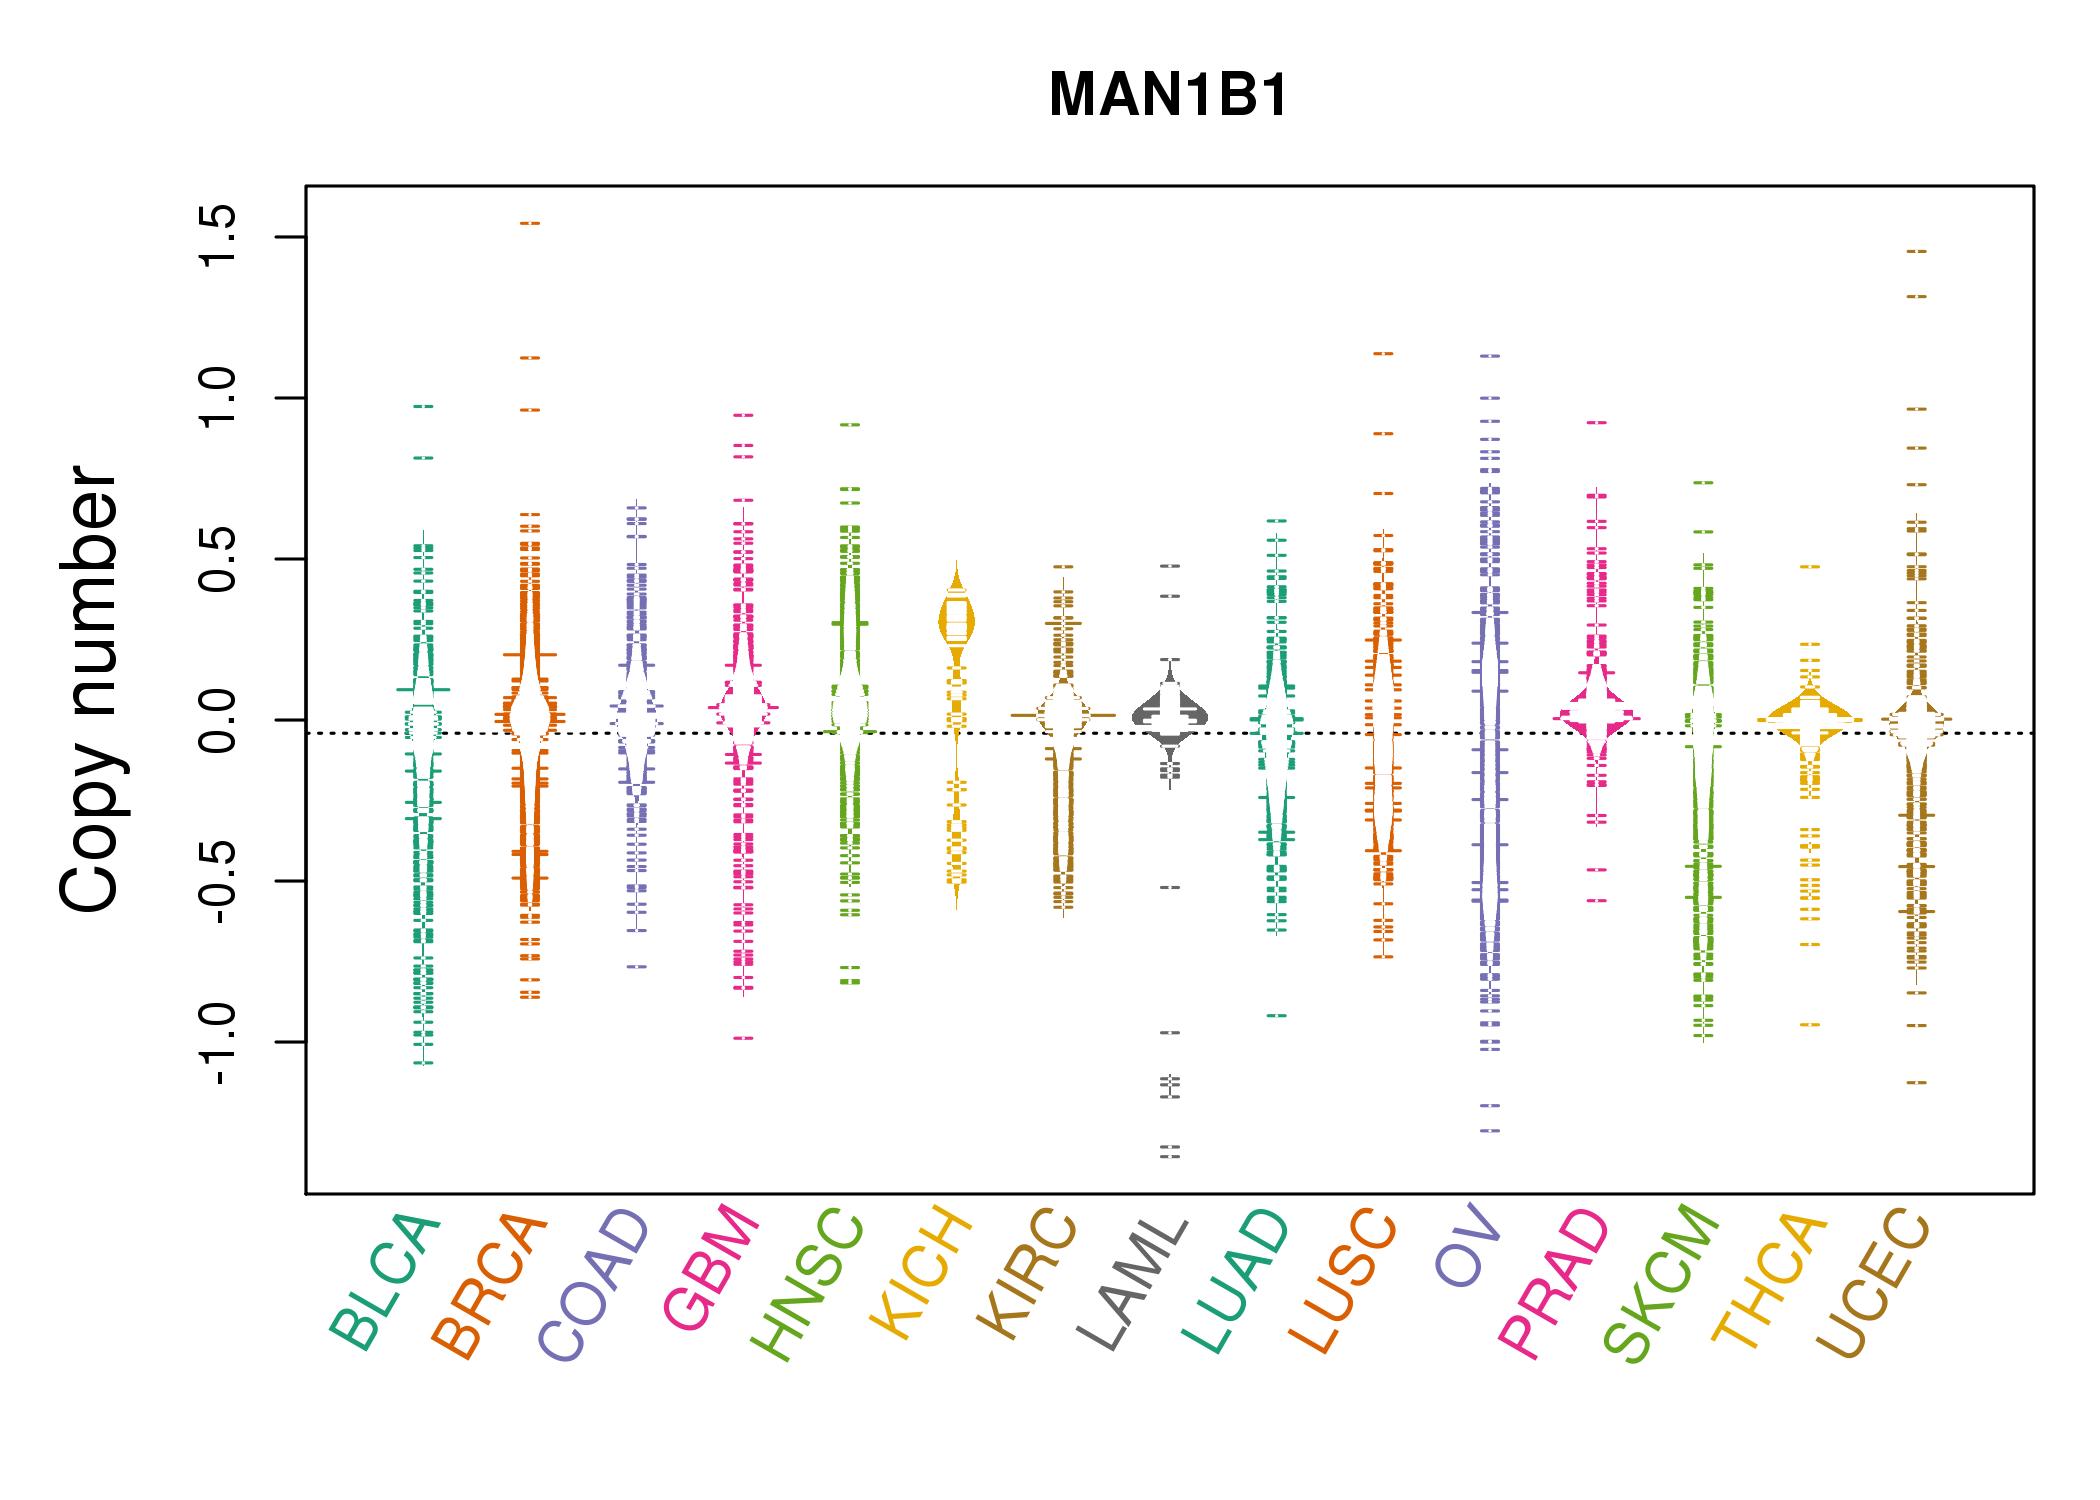 |
| cf) Tissue ID[Tissue type]: BLCA[Bladder Urothelial Carcinoma], BRCA[Breast invasive carcinoma], CESC[Cervical squamous cell carcinoma and endocervical adenocarcinoma], COAD[Colon adenocarcinoma], GBM[Glioblastoma multiforme], Glioma Low Grade, HNSC[Head and Neck squamous cell carcinoma], KICH[Kidney Chromophobe], KIRC[Kidney renal clear cell carcinoma], KIRP[Kidney renal papillary cell carcinoma], LAML[Acute Myeloid Leukemia], LUAD[Lung adenocarcinoma], LUSC[Lung squamous cell carcinoma], OV[Ovarian serous cystadenocarcinoma ], PAAD[Pancreatic adenocarcinoma], PRAD[Prostate adenocarcinoma], SKCM[Skin Cutaneous Melanoma], STAD[Stomach adenocarcinoma], THCA[Thyroid carcinoma], UCEC[Uterine Corpus Endometrial Carcinoma] |
| Top |
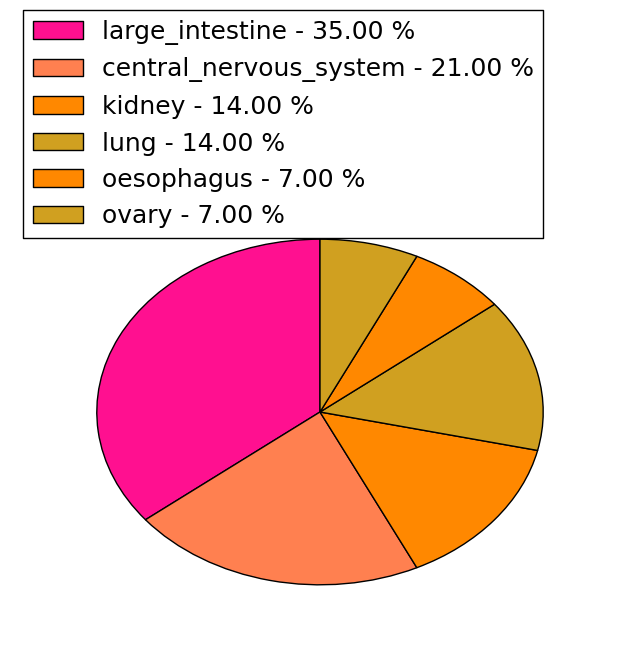
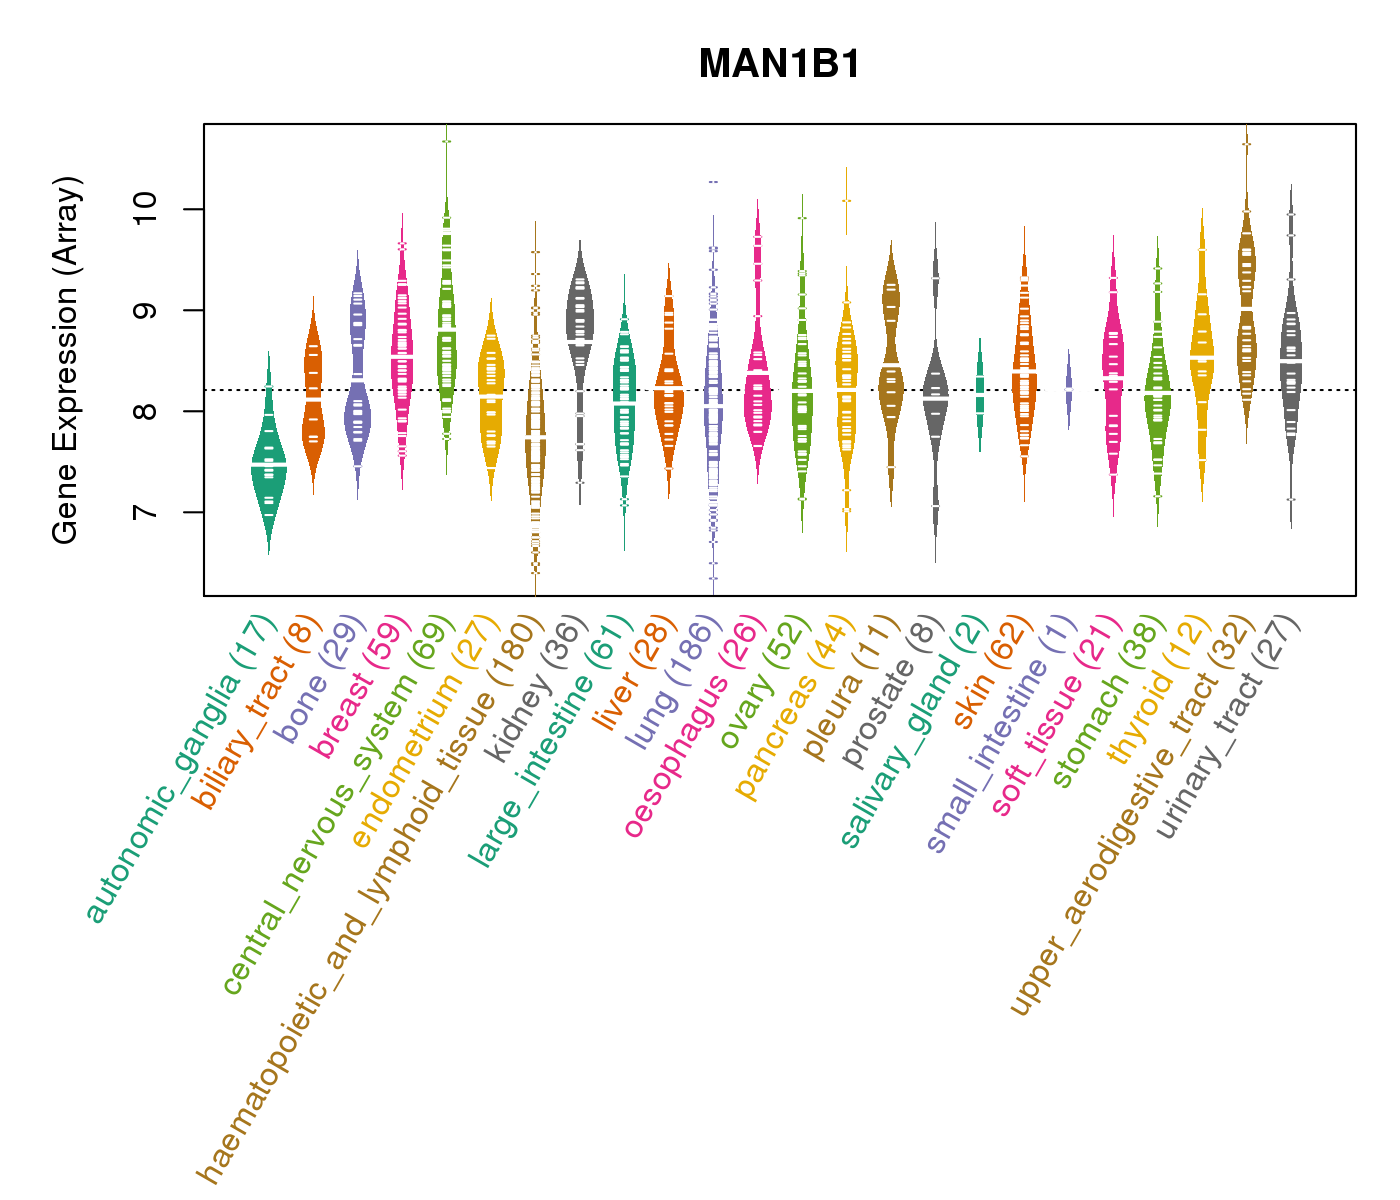
| Gene Expression for MAN1B1 |
| * CCLE gene expression data were extracted from CCLE_Expression_Entrez_2012-10-18.res: Gene-centric RMA-normalized mRNA expression data. |
 |
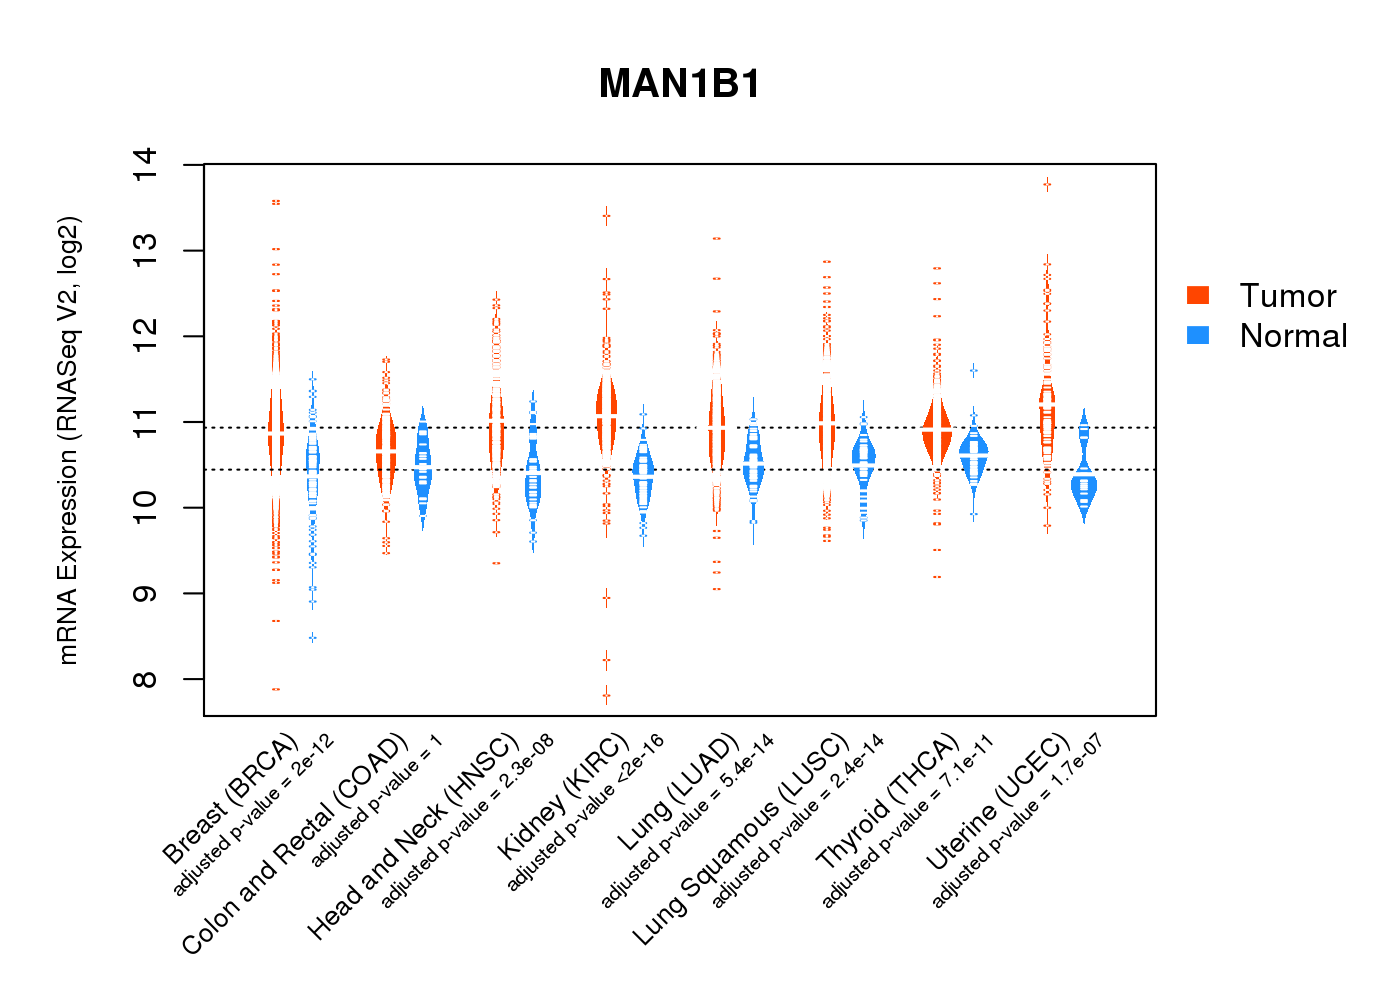
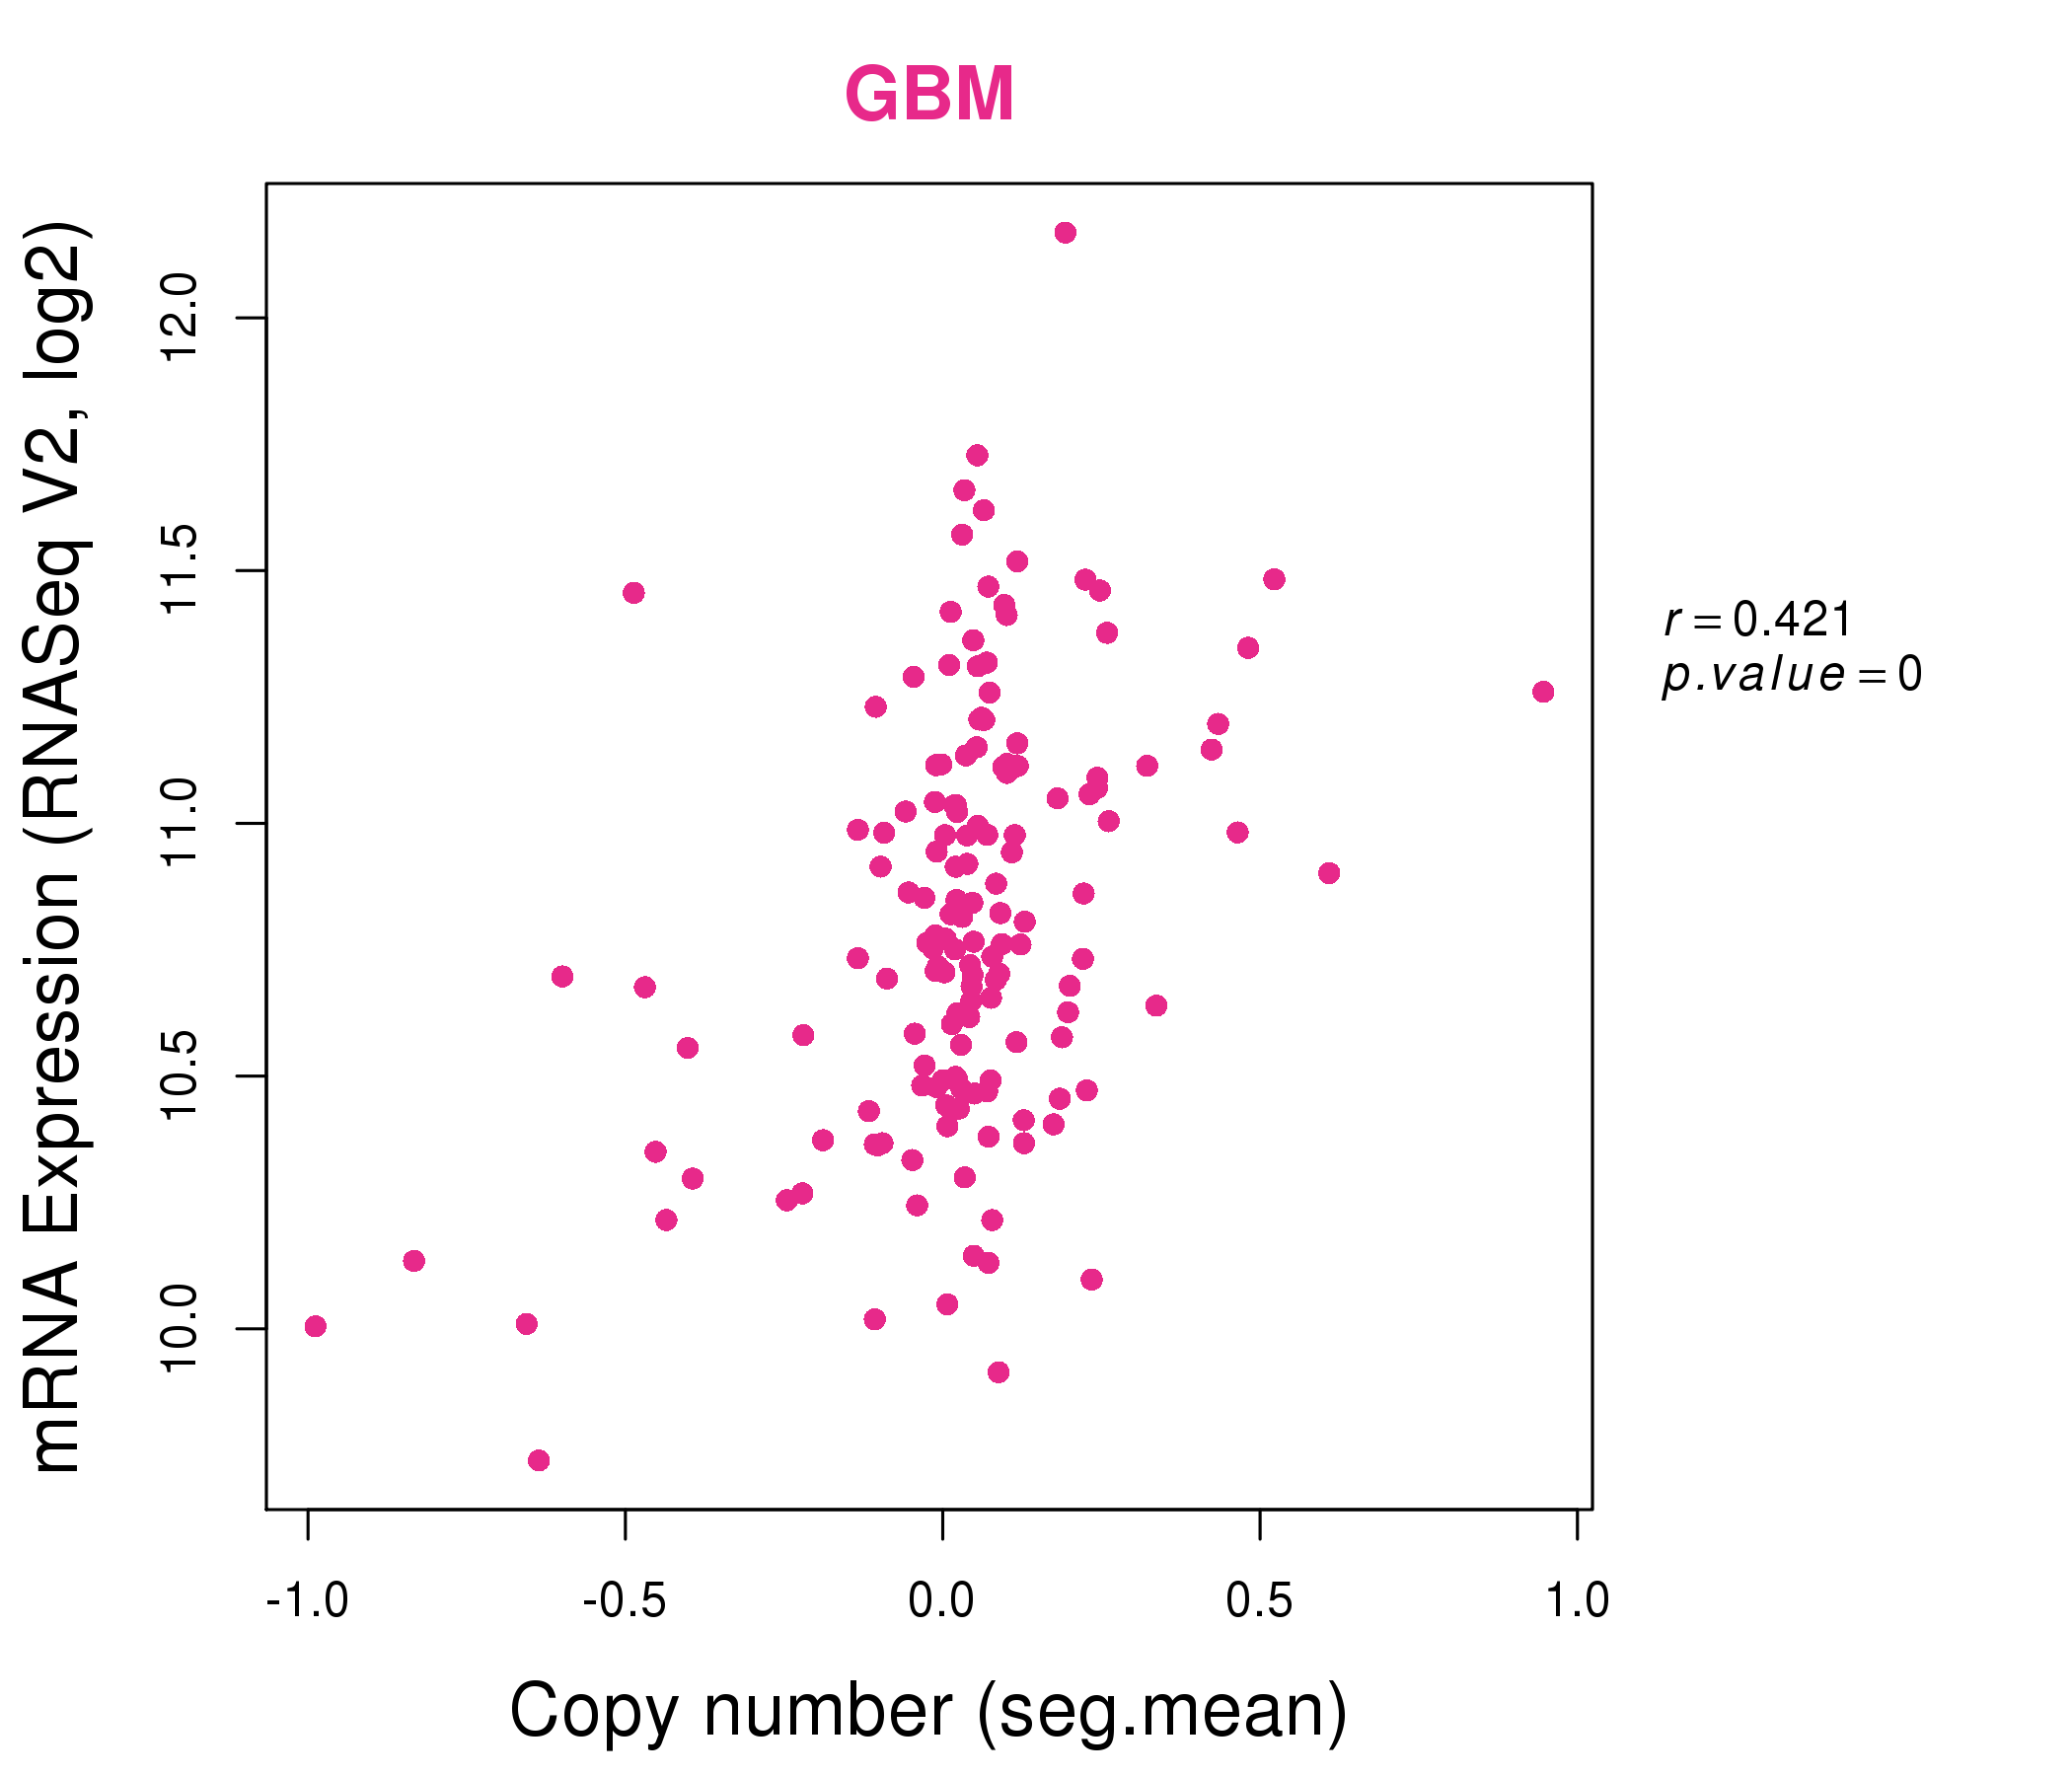
| * Normalized gene expression data of RNASeqV2 was extracted from TCGA using R package TCGA-Assembler. The URLs of all public data files on TCGA DCC data server were gathered at Jan-05-2015. Only eight cancer types have enough normal control samples for differential expression analysis. (t test, adjusted p<0.05 (using Benjamini-Hochberg FDR)) |
 |
| Top |
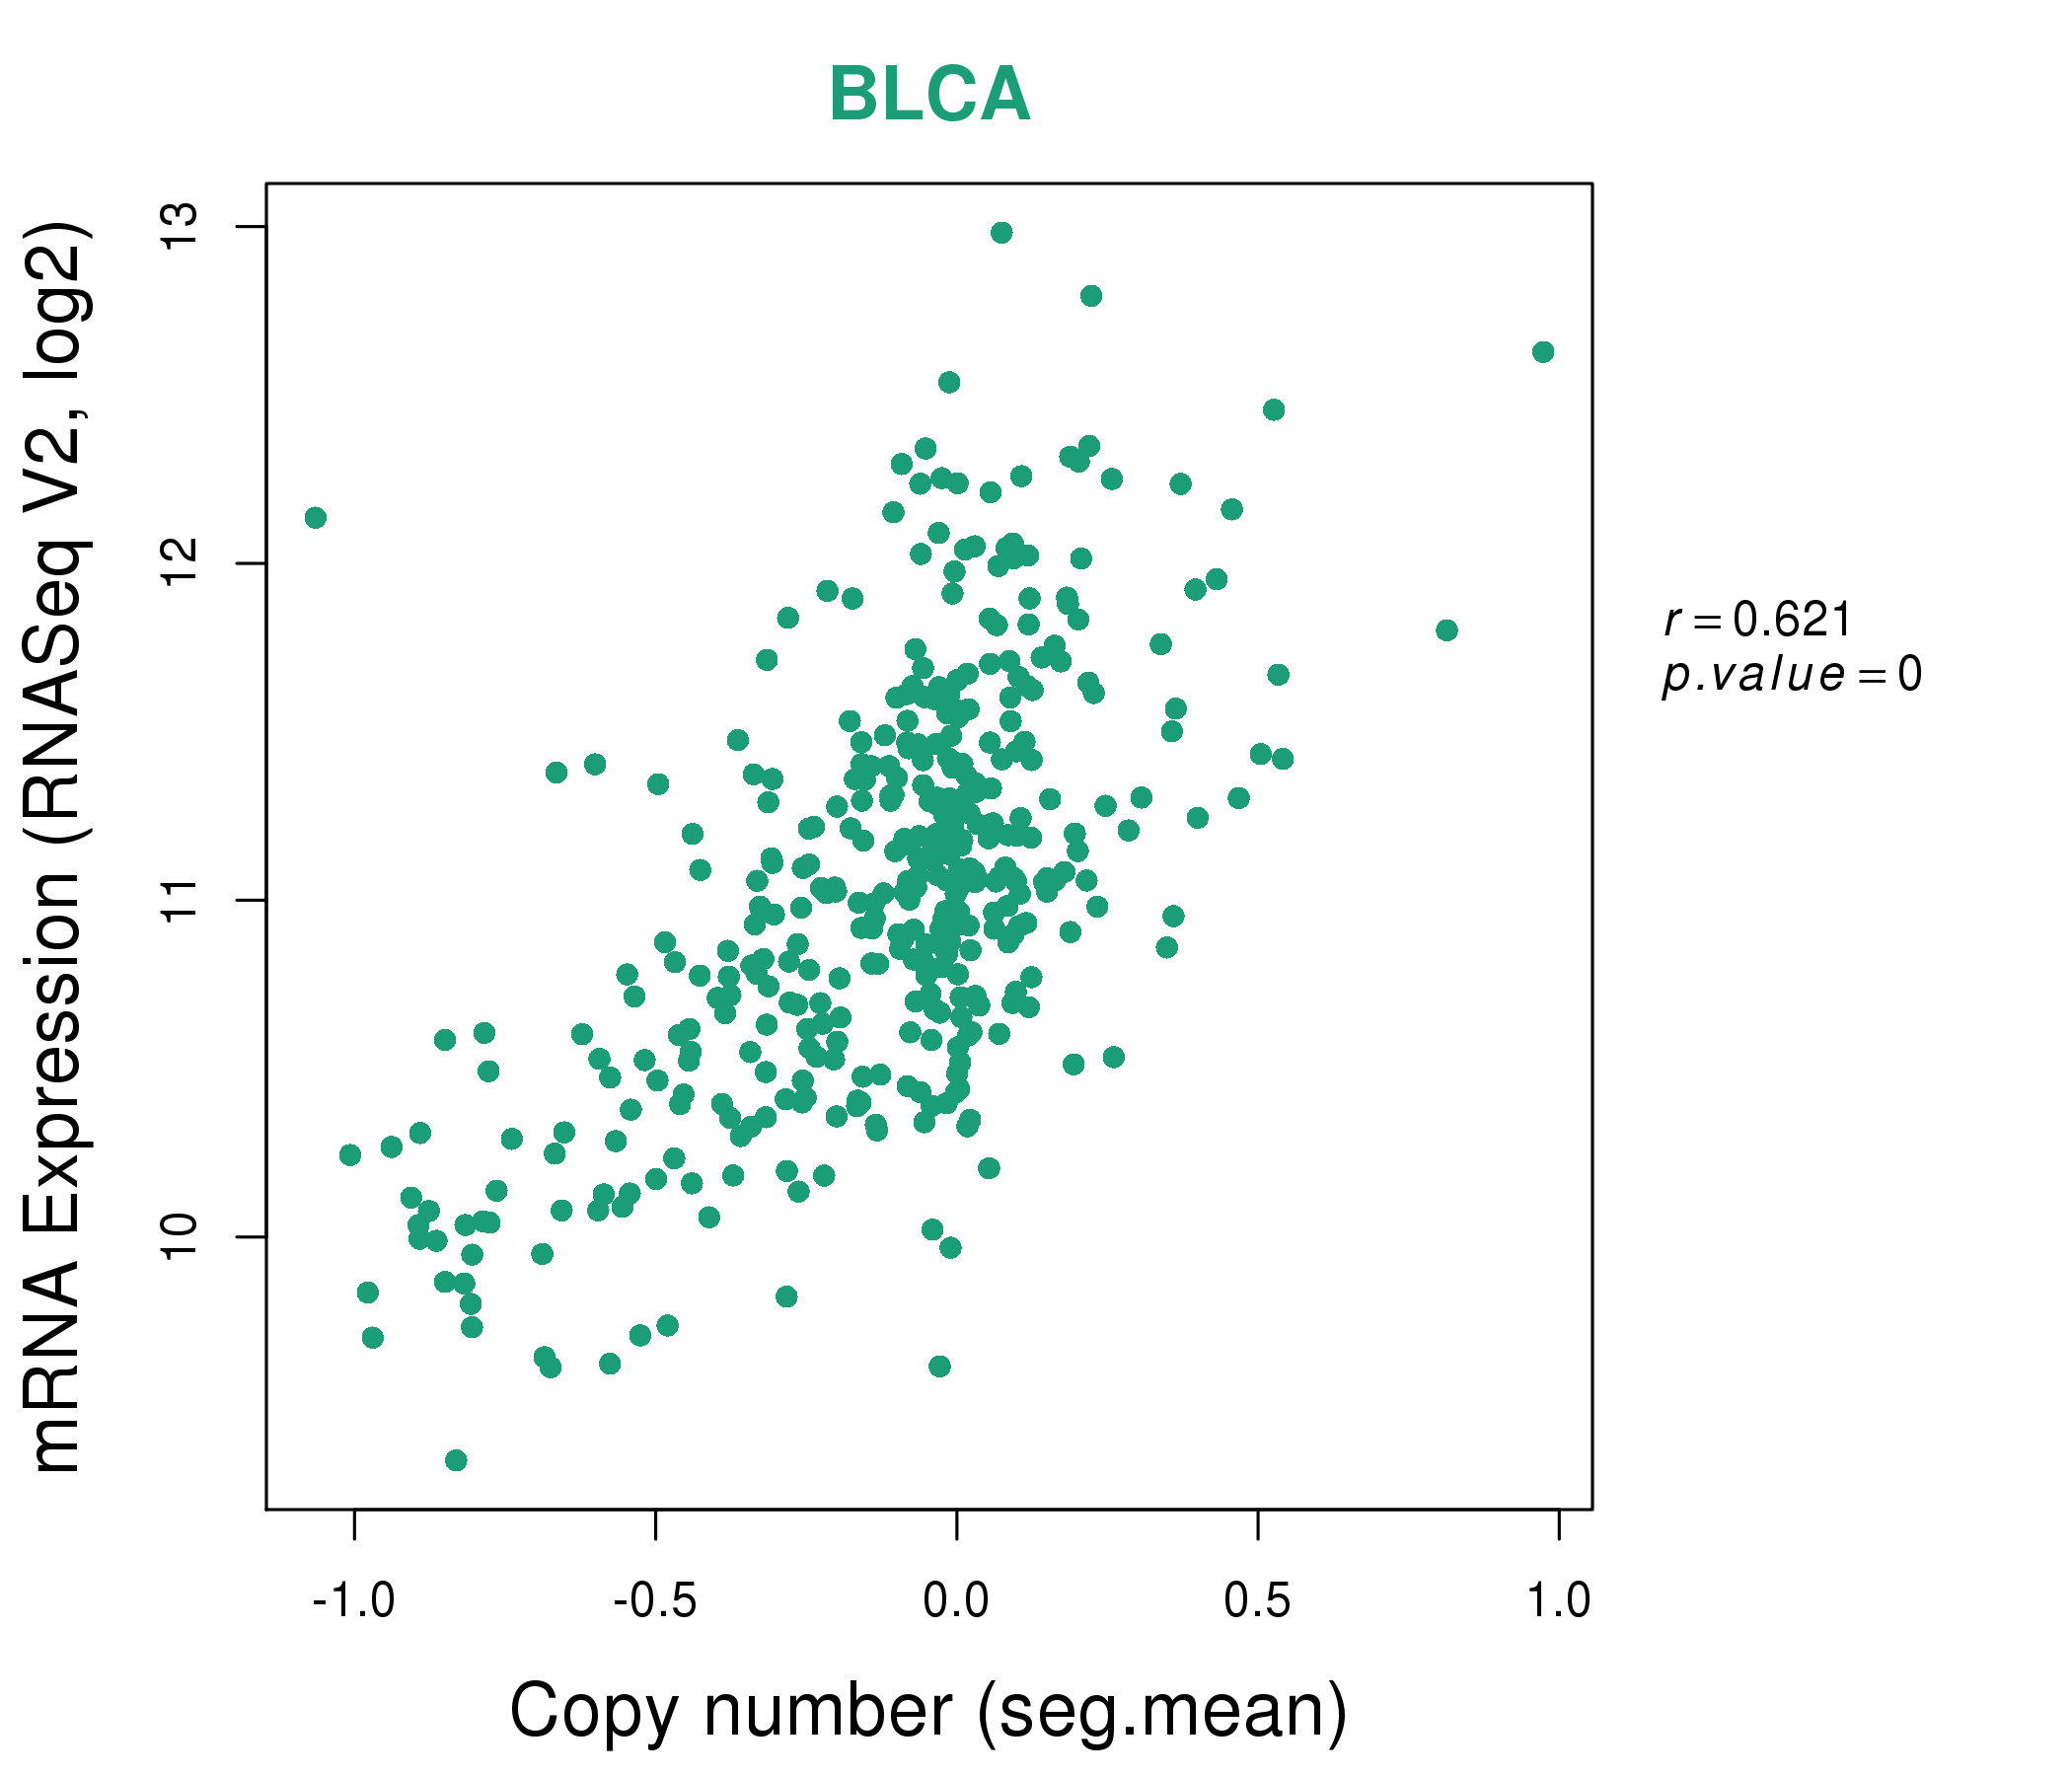
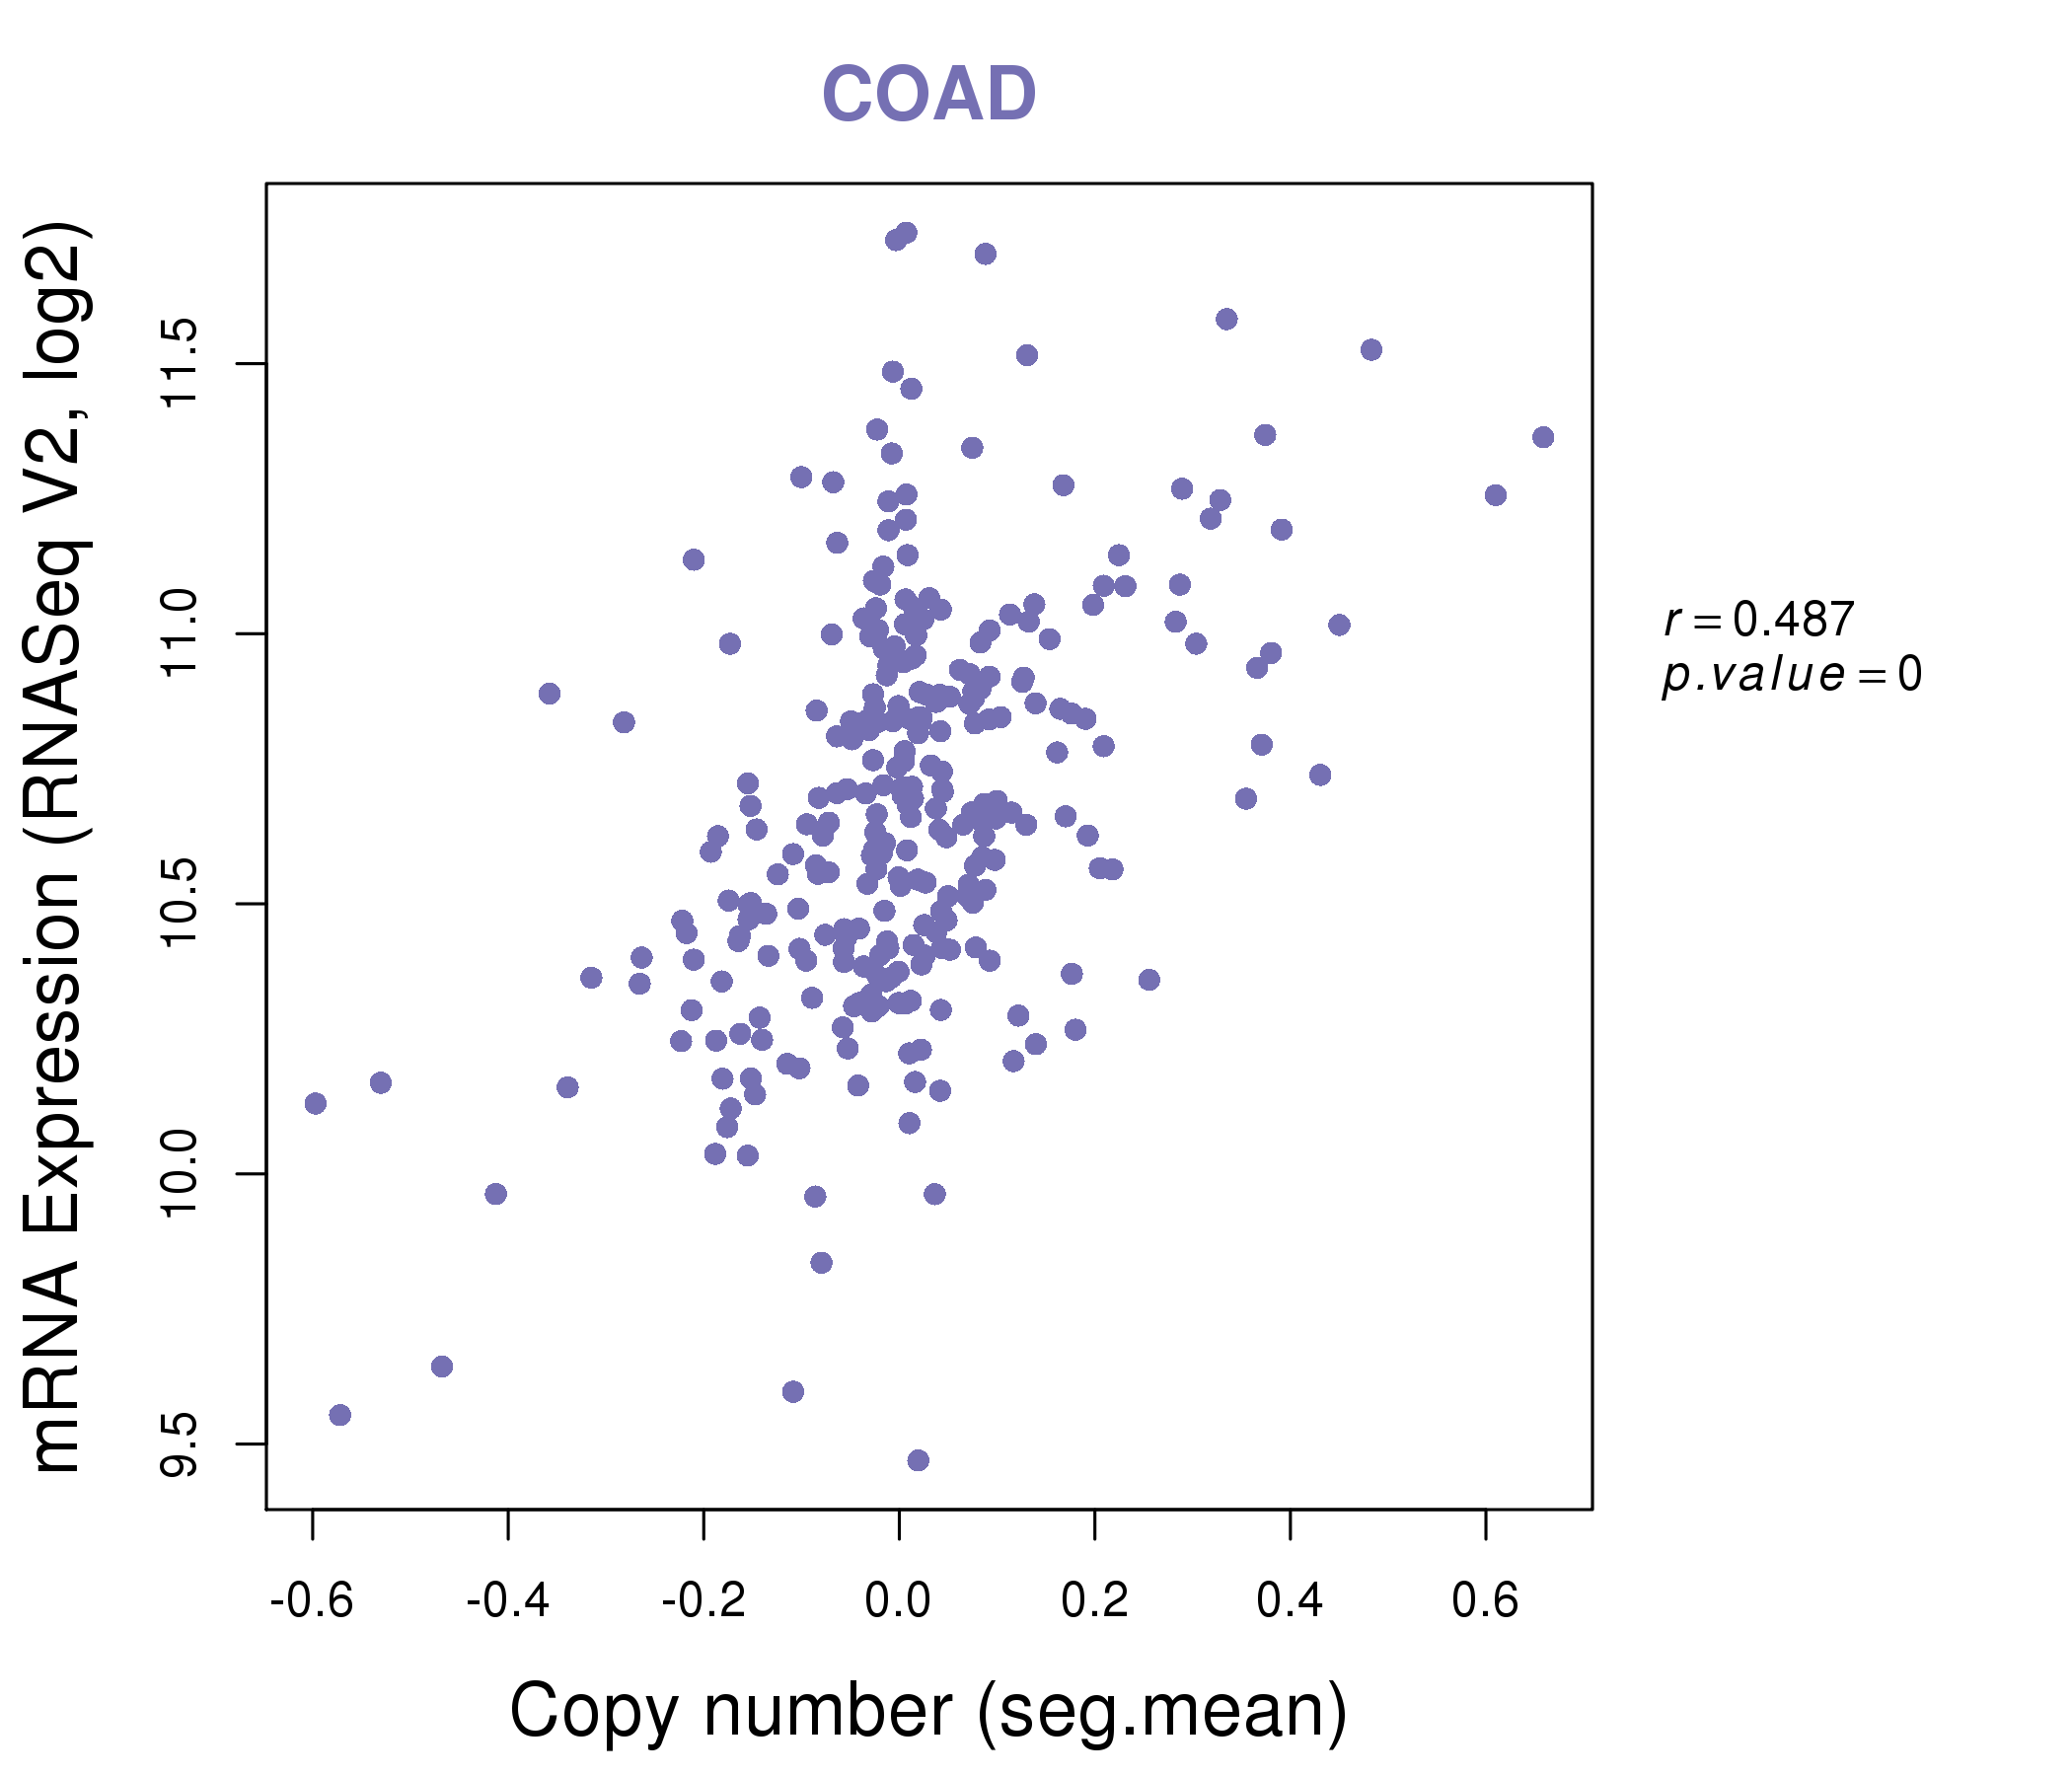
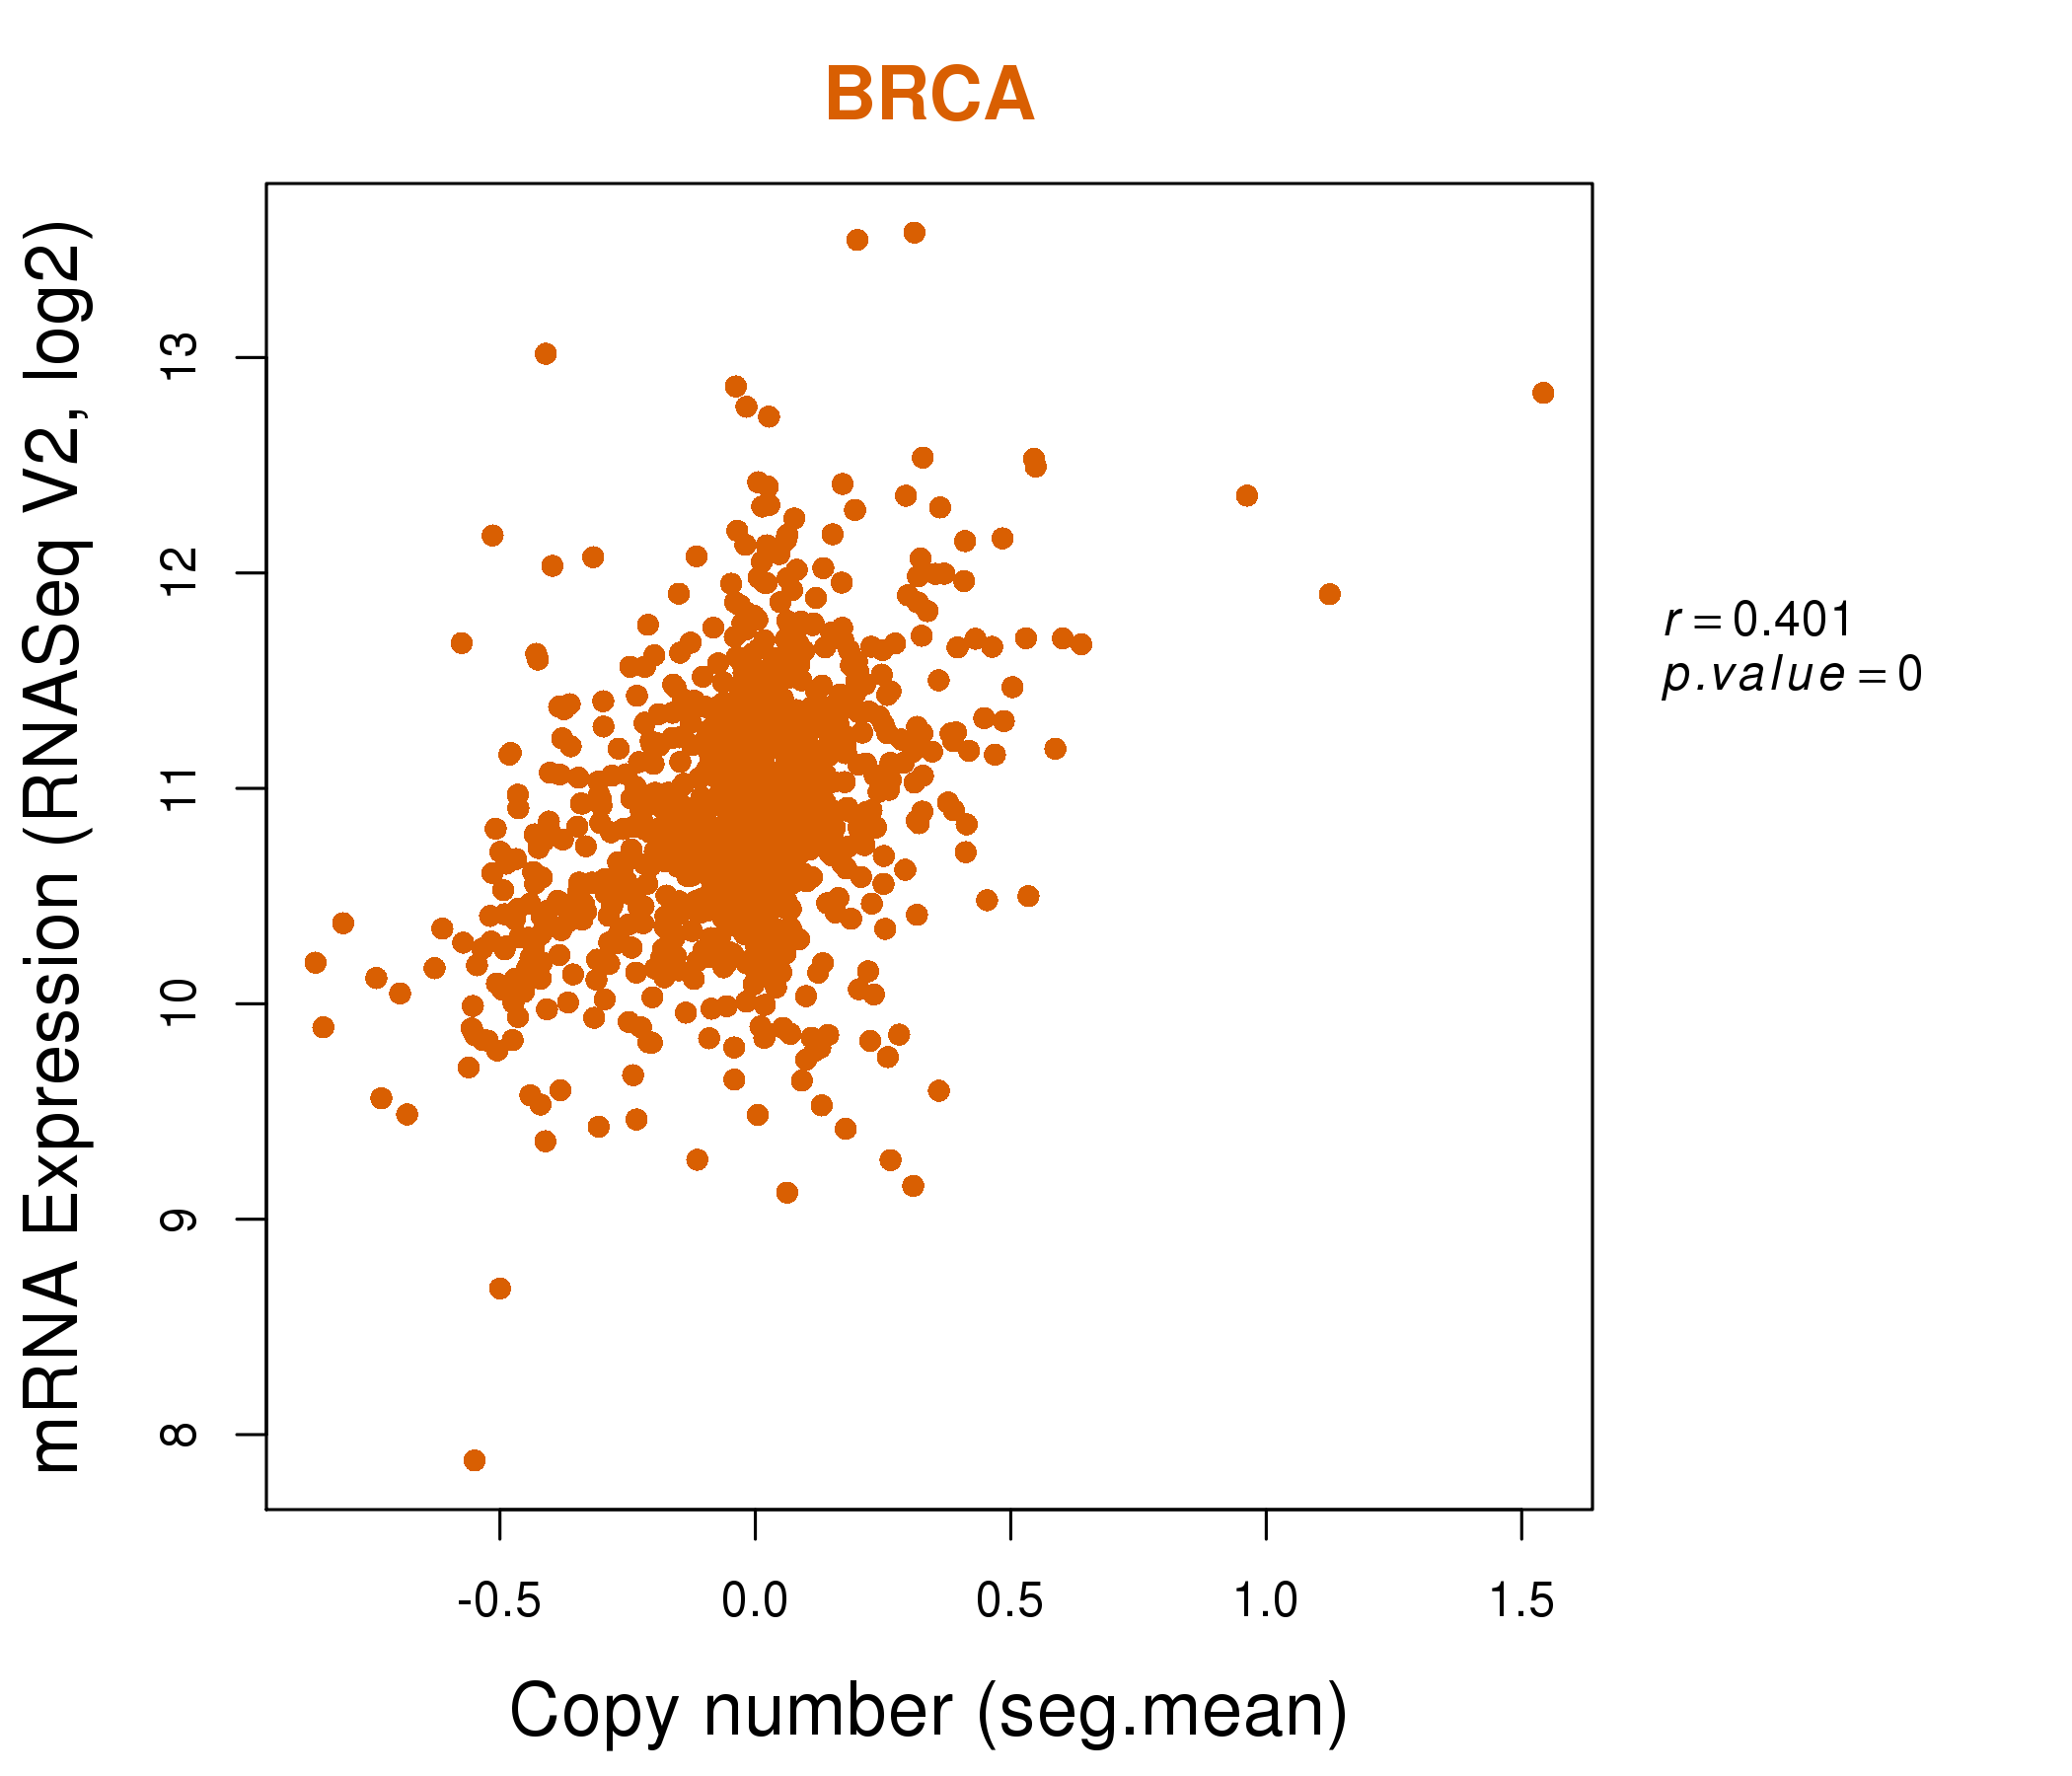
| * This plots show the correlation between CNV and gene expression. |
: Open all plots for all cancer types
 |
|
 |
|
| Top |
| Gene-Gene Network Information |
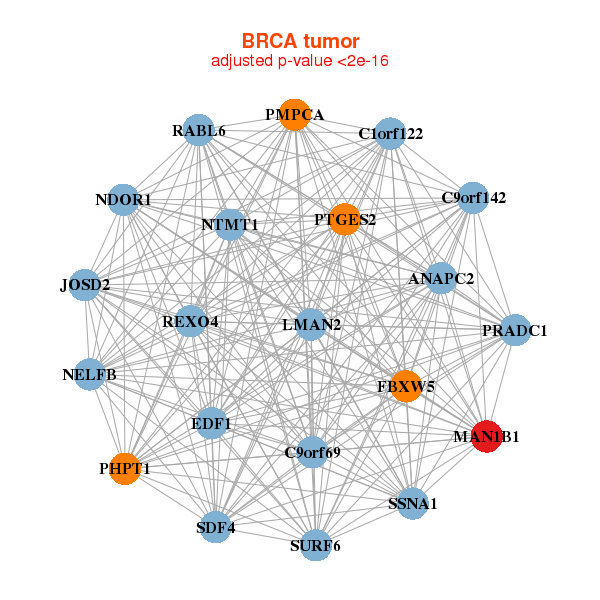
| * Co-Expression network figures were drawn using R package igraph. Only the top 20 genes with the highest correlations were shown. Red circle: input gene, orange circle: cell metabolism gene, sky circle: other gene |
: Open all plots for all cancer types
 |
| ||||
| ANAPC2,C1orf122,PRADC1,C9orf142,C9orf69,RABL6,NELFB, EDF1,FBXW5,JOSD2,LMAN2,MAN1B1,NTMT1,NDOR1, PHPT1,PMPCA,PTGES2,REXO4,SDF4,SSNA1,SURF6 | ARFGAP1,COQ4,CORO1B,DAK,DDX41,ERP29,GAK, HMG20B,LRRC45,MAN1B1,NDOR1,NMRAL1,POMT1,PRKCSH, RANGAP1,RUVBL2,SLC12A9,TRIM11,U2AF2,WDR46,YIPF2 | ||||
 |
| ||||
| ANAPC2,B3GAT3,C11orf68,C9orf142,NELFB,COQ4,DPP7, EDF1,FBXW5,FPGS,LRSAM1,MAN1B1,MPG,NDOR1, PHPT1,RNF208,SH3GLB2,SSNA1,SURF1,THAP3,TMEM203 | B3GALT4,KDF1,DALRD3,DUSP23,ERGIC3,FCGRT,HMGCL, HPS6,IMPA2,MAN1B1,C8orf82,PGLS,PXMP2,SLC35C2, STAP2,TEX264,THAP4,TMEM134,ZDHHC12,ZDHHC24,ZNF524 |
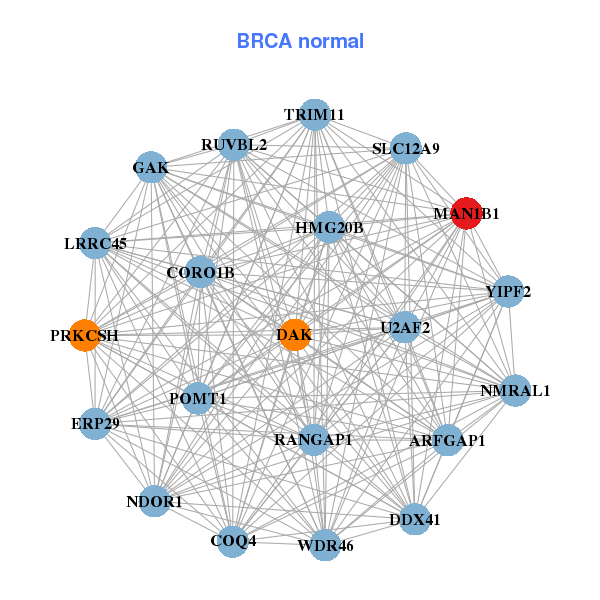

| * Co-Expression network figures were drawn using R package igraph. Only the top 20 genes with the highest correlations were shown. Red circle: input gene, orange circle: cell metabolism gene, sky circle: other gene |
: Open all plots for all cancer types
| Top |
: Open all interacting genes' information including KEGG pathway for all interacting genes from DAVID
| Top |
| Pharmacological Information for MAN1B1 |
| DB Category | DB Name | DB's ID and Url link |
| * Gene Centered Interaction Network. |
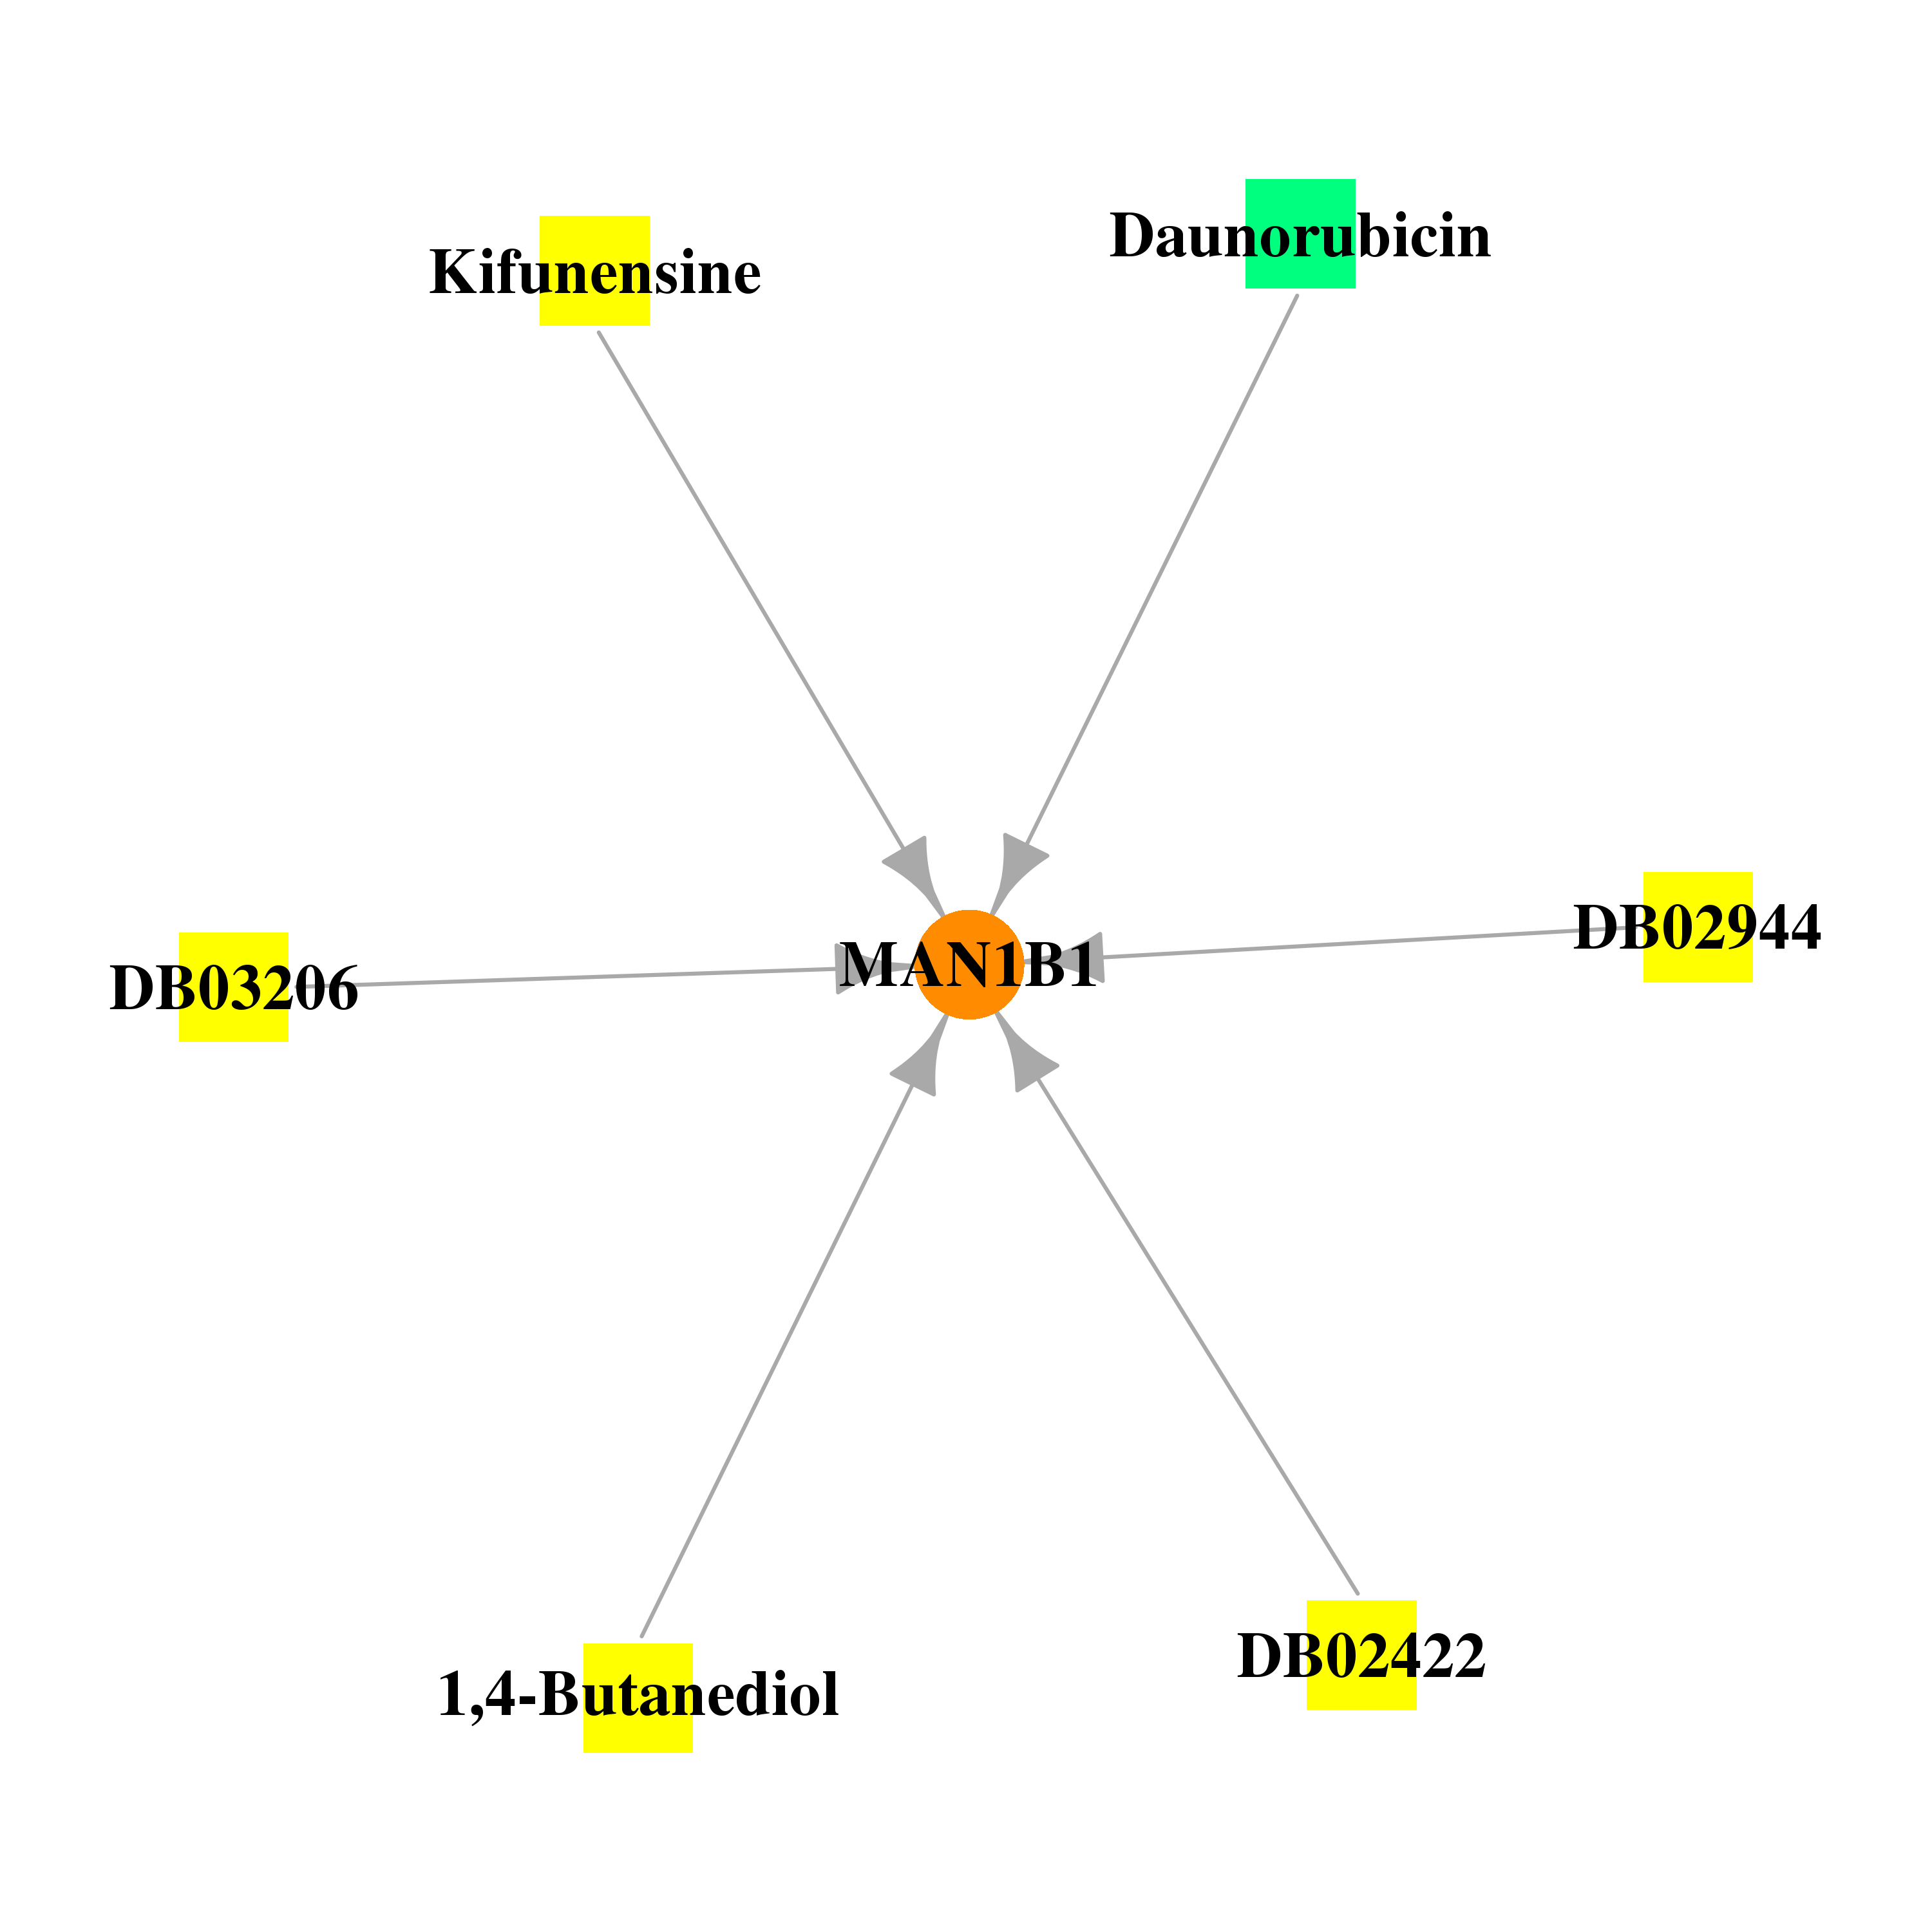 |
| * Drug Centered Interaction Network. |
| DrugBank ID | Target Name | Drug Groups | Generic Name | Drug Centered Network | Drug Structure |
| DB01955 | mannosidase, alpha, class 1B, member 1 | experimental | 1,4-Butanediol | 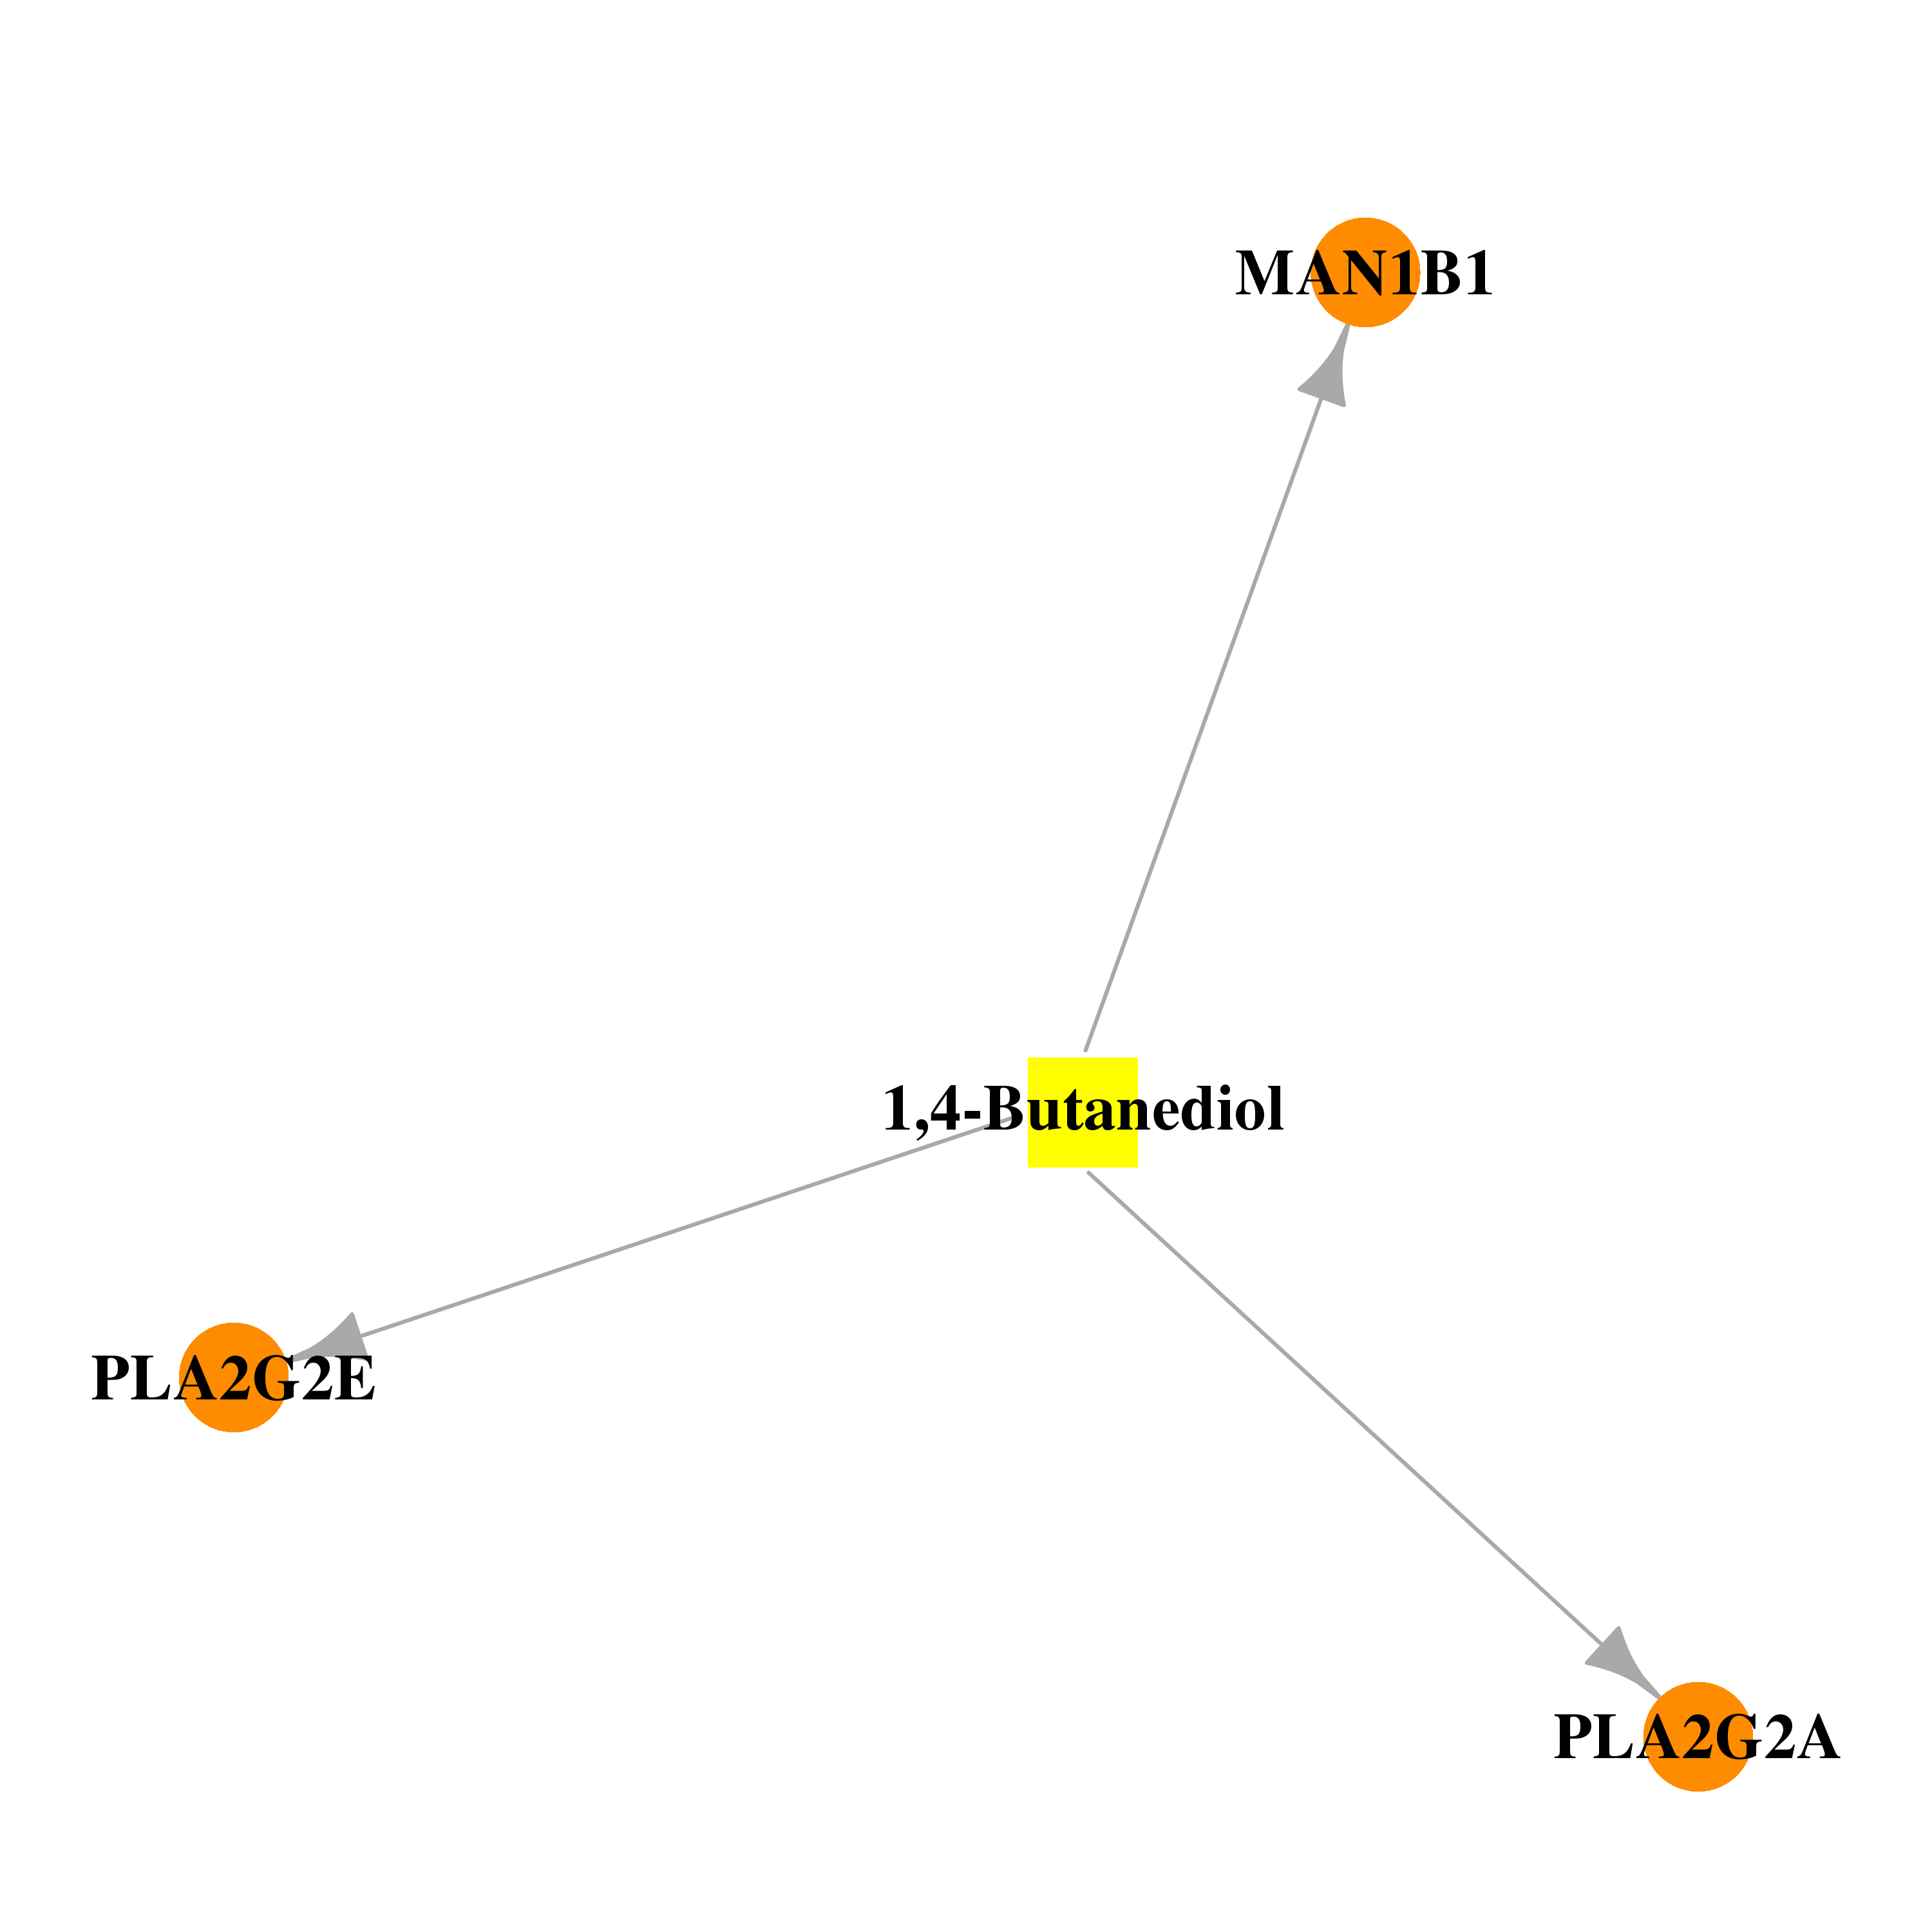 |  |
| DB02422 | mannosidase, alpha, class 1B, member 1 | experimental | Methyl-2-S-(Alpha-D-Mannopyranosyl)-2-Thio-Alpha-D-Mannopyranoside |  | 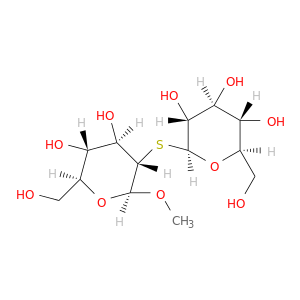 |
| DB02742 | mannosidase, alpha, class 1B, member 1 | experimental | Kifunensine | 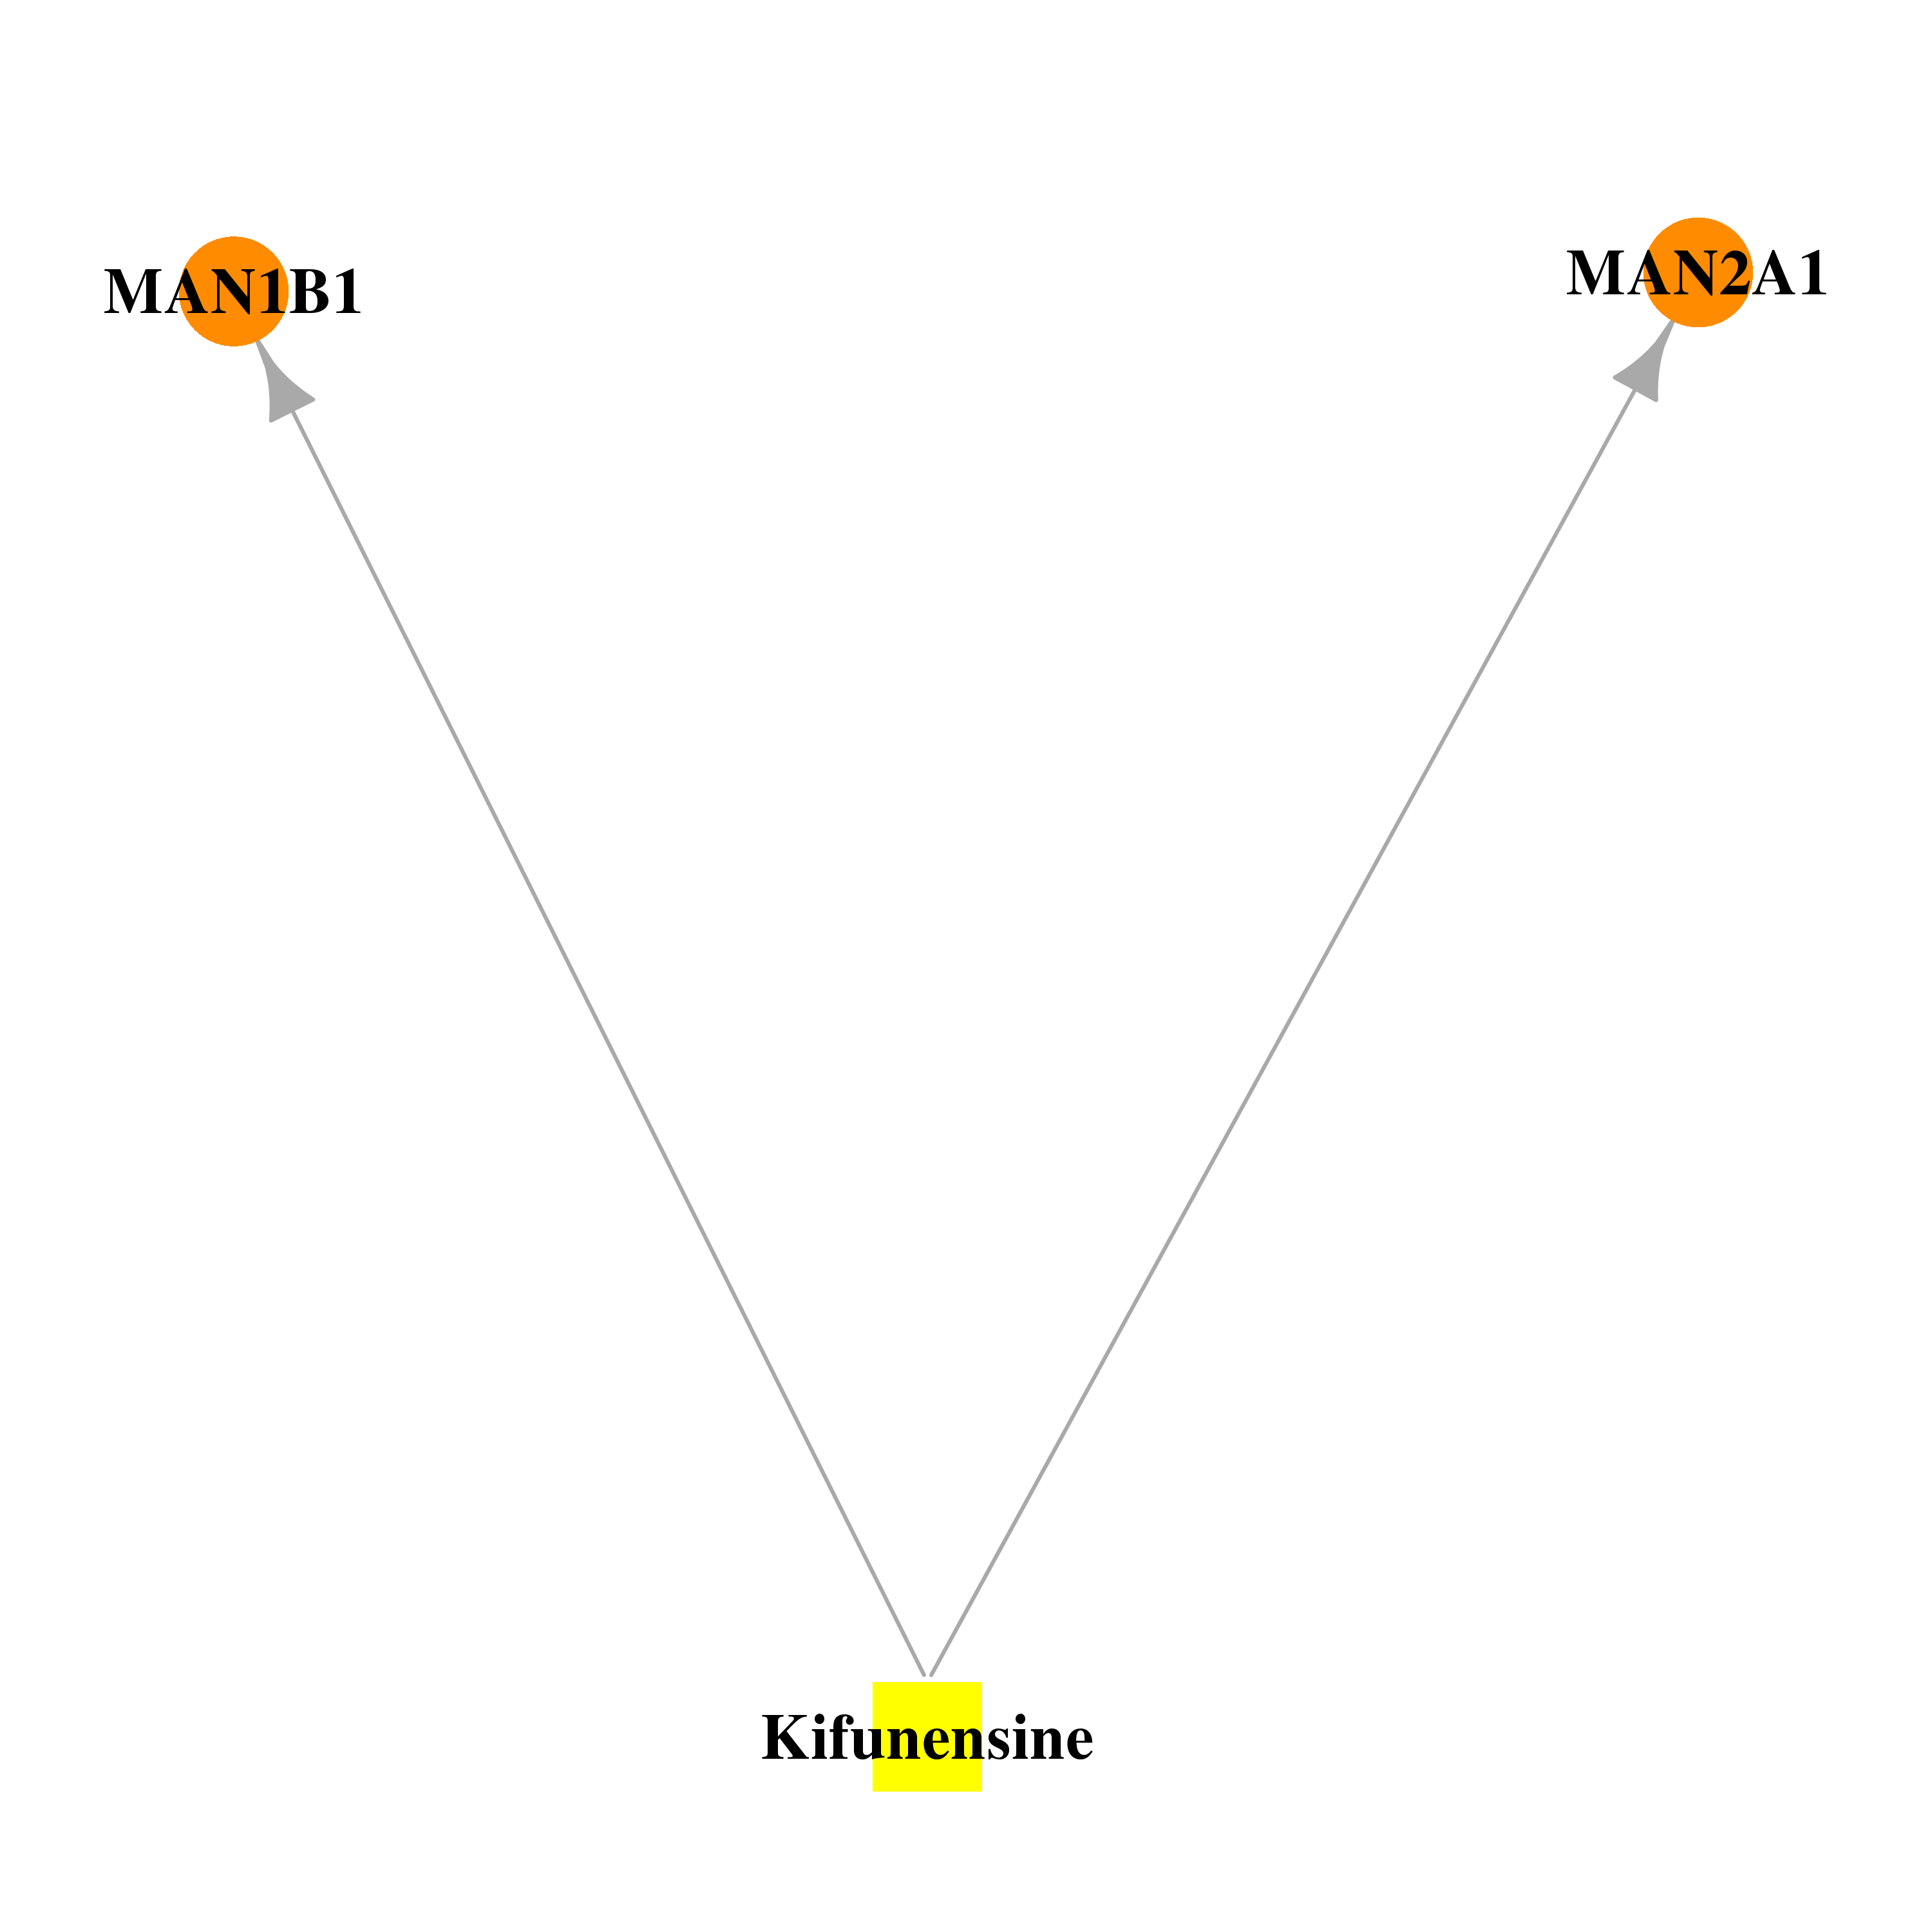 | 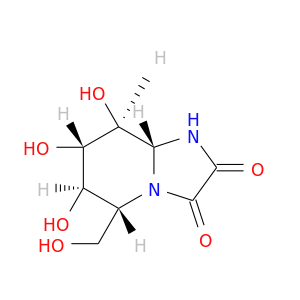 |
| DB02944 | mannosidase, alpha, class 1B, member 1 | experimental | Alpha-D-Mannose |  |  |
| DB03206 | mannosidase, alpha, class 1B, member 1 | experimental | 1-Deoxynojirimycin | 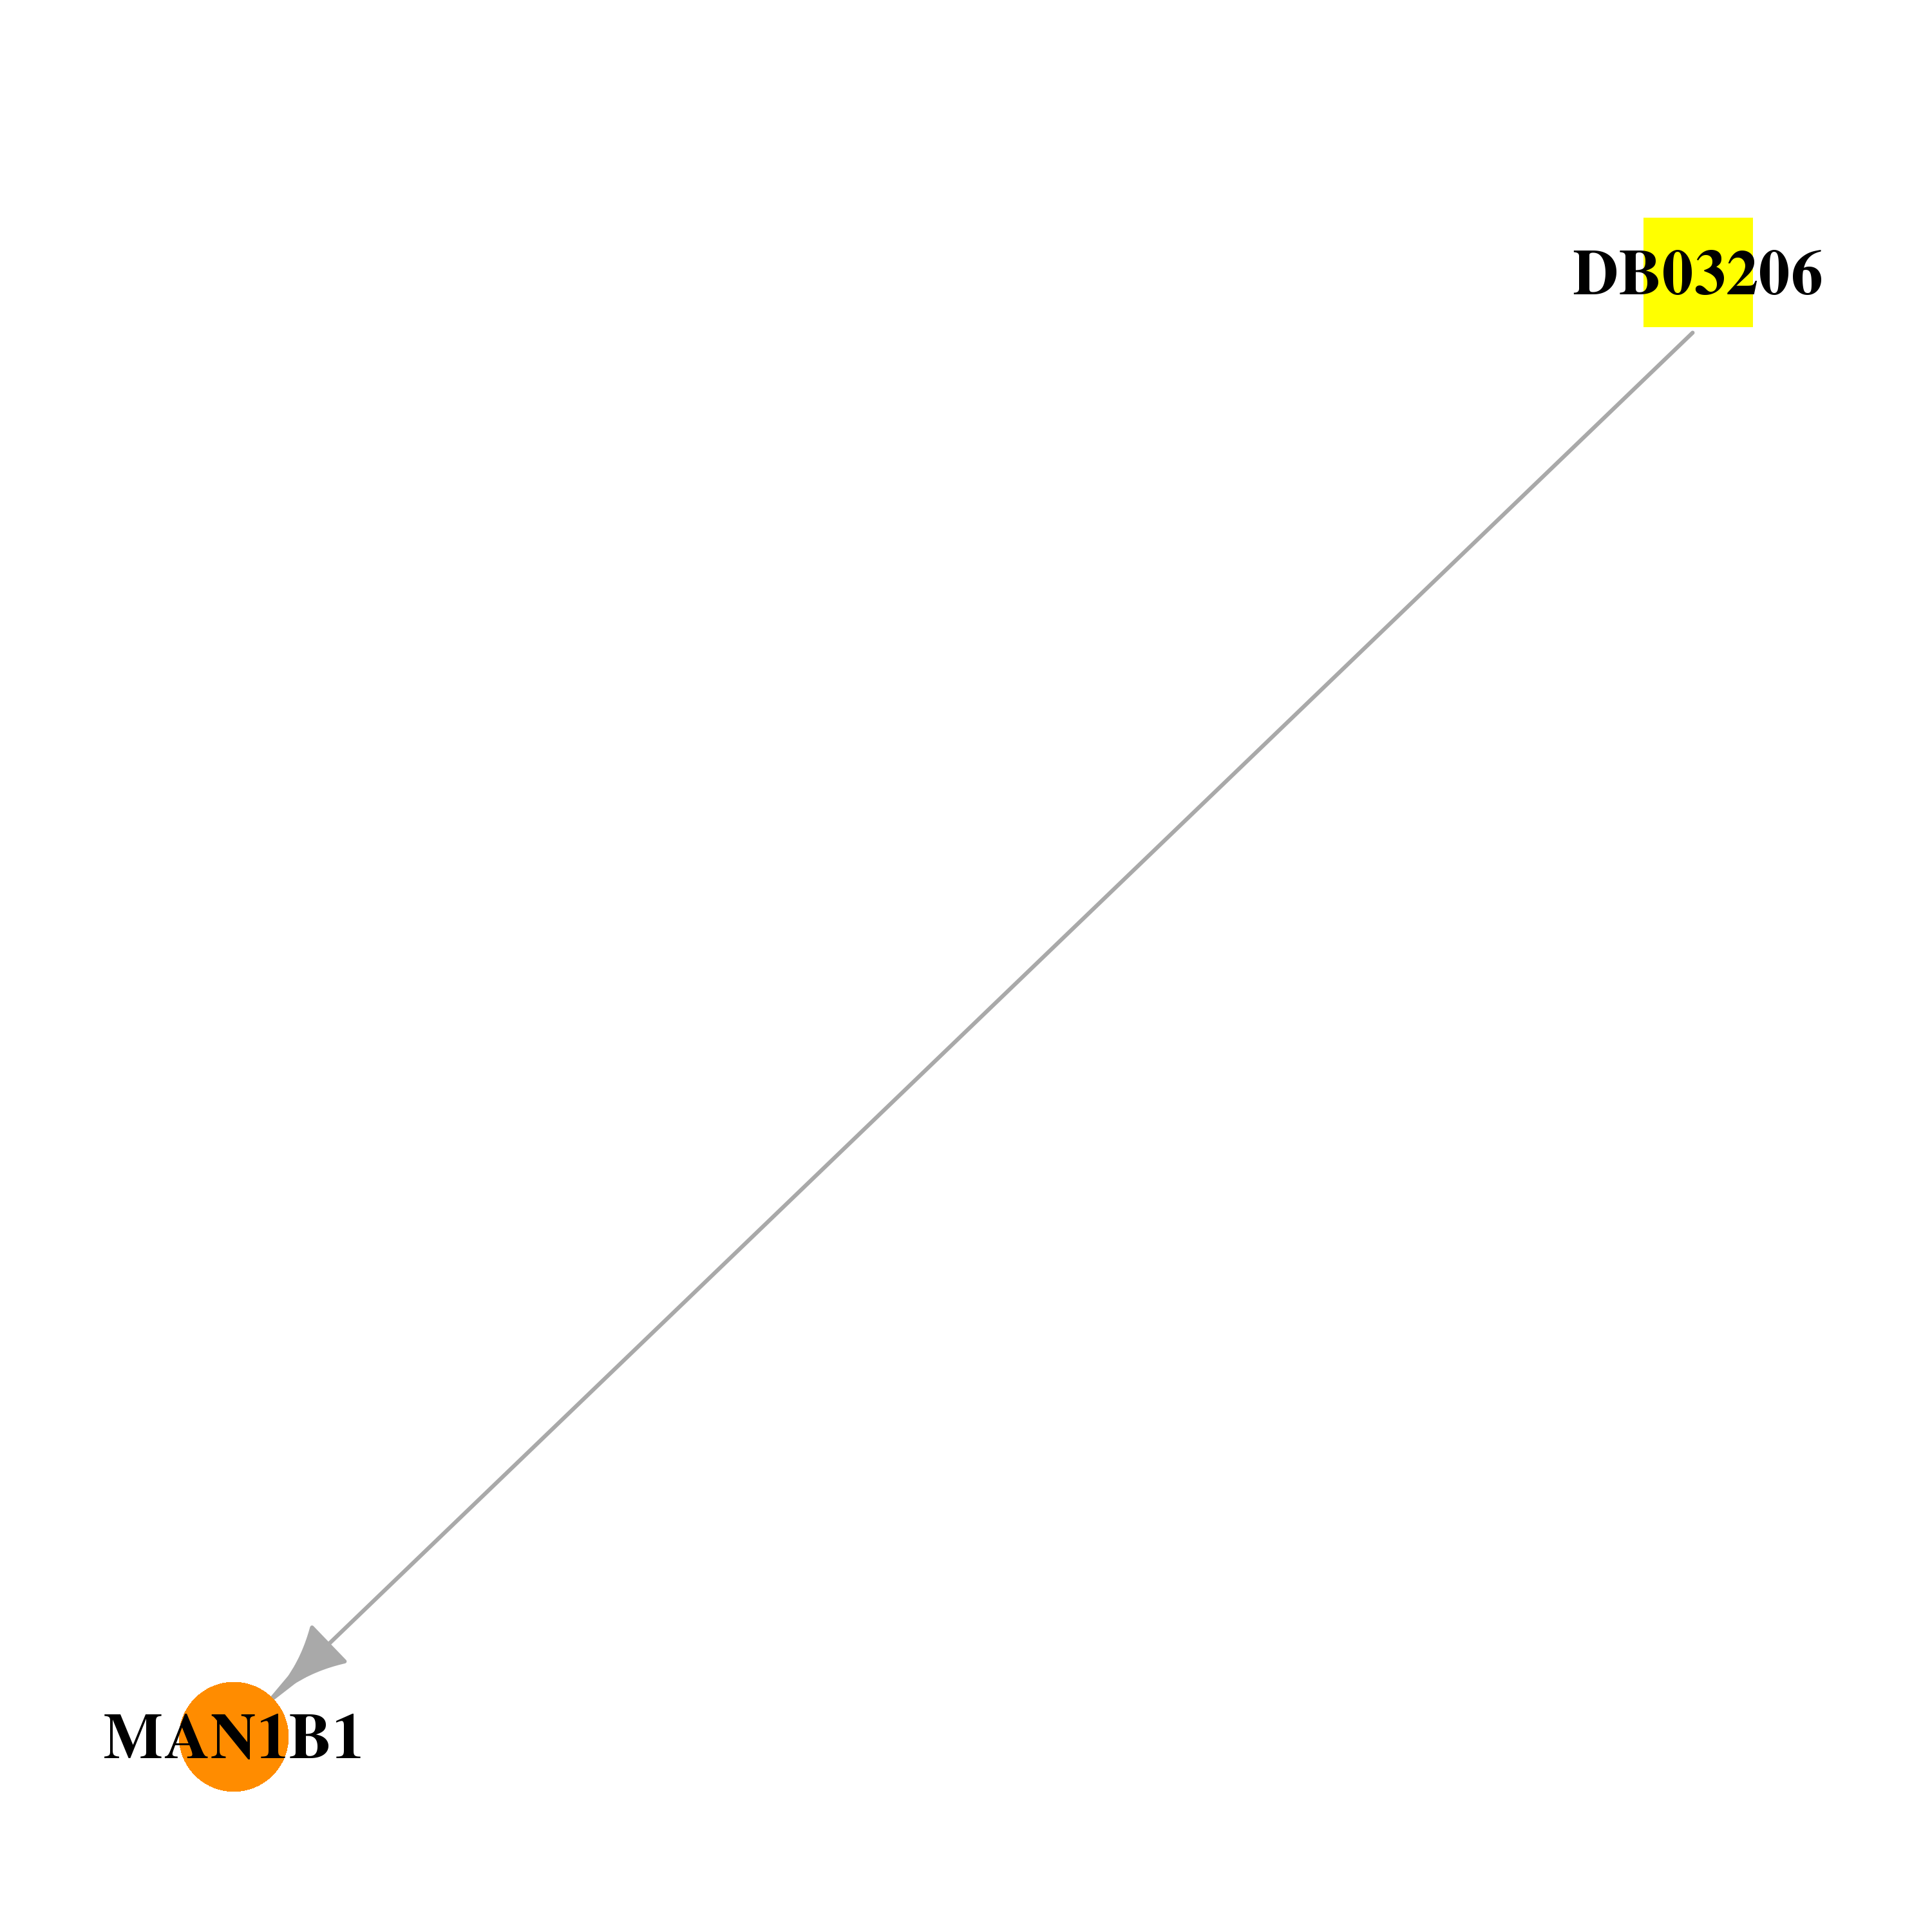 | 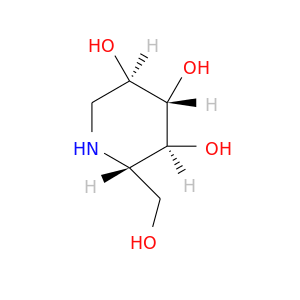 |
| DB00694 | mannosidase, alpha, class 1B, member 1 | approved | Daunorubicin | 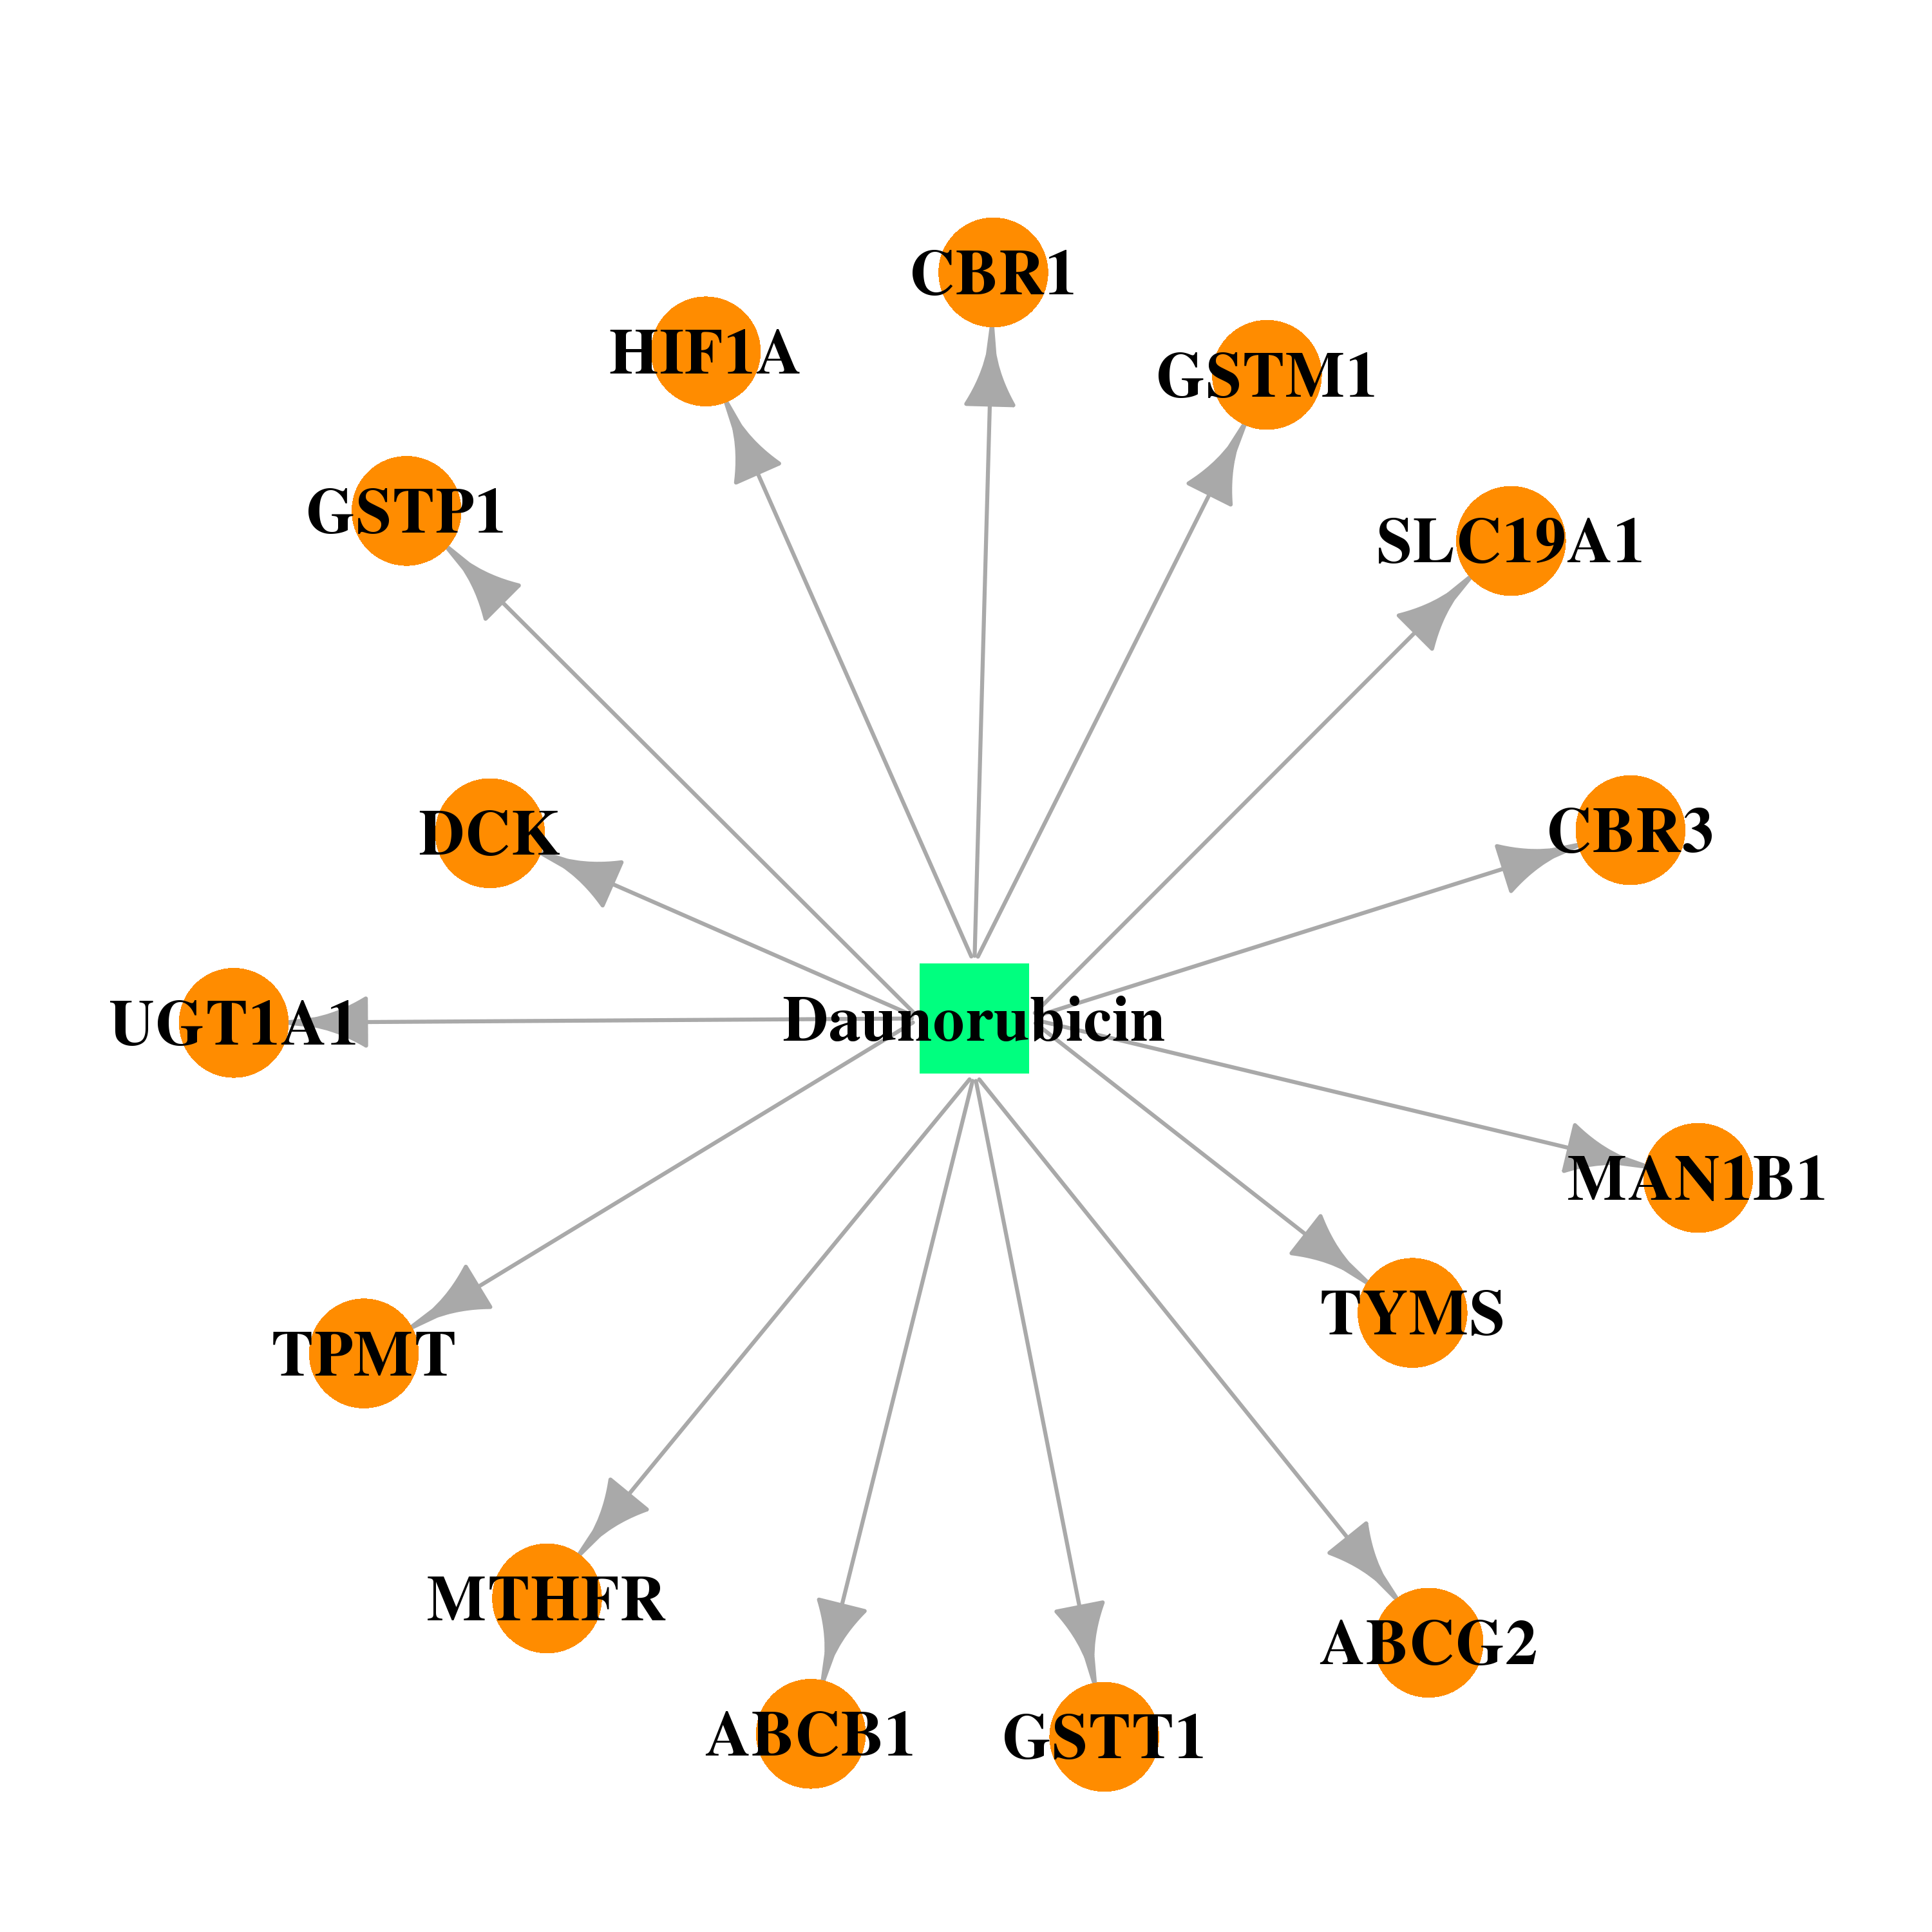 | 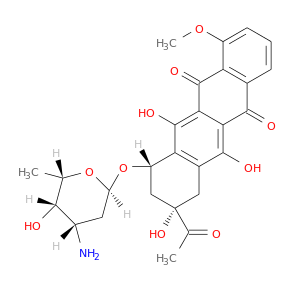 |
| Top |
| Cross referenced IDs for MAN1B1 |
| * We obtained these cross-references from Uniprot database. It covers 150 different DBs, 18 categories. http://www.uniprot.org/help/cross_references_section |
: Open all cross reference information
|
Copyright © 2016-Present - The Univsersity of Texas Health Science Center at Houston @ |