|
||||||||||||||||||||||||||||||||||||||||||||||||||||||||||||||||||||||||||||||||||||||||||||||||||||||||||||||||||||||||||||||||||||||||||||||||||||||||||||||||||||||||||||||||||||||||||||||||||||||||||||||||||||||||||||||||||||||||||||||||||||||||||||||||||||||||||||||||||||||||||||||||||||||||||||||||||||||||||
| |
| Phenotypic Information (metabolism pathway, cancer, disease, phenome) |
| |
| |
| Gene-Gene Network Information: Co-Expression Network, Interacting Genes & KEGG |
| |
|


| Gene Summary for MGAT4A |
| Basic gene info. | Gene symbol | MGAT4A |
| Gene name | mannosyl (alpha-1,3-)-glycoprotein beta-1,4-N-acetylglucosaminyltransferase, isozyme A | |
| Synonyms | GNT-IV|GNT-IVA|GnT-4a | |
| Cytomap | UCSC genome browser: 2q12 | |
| Genomic location | chr2 :99235568-99347589 | |
| Type of gene | protein-coding | |
| RefGenes | NM_001160154.1, NM_012214.2, | |
| Ensembl id | ENSG00000071073 | |
| Description | N-acetylglucosaminyltransferase IVaN-glycosyl-oligosaccharide-glycoprotein N-acetylglucosaminyltransferase IVaUDP-GlcNAc:a-1,3-D-mannoside b-1,4-acetylglucosaminyltransferase IVUDP-N-acetylglucosamine: alpha-1,3-D-mannoside beta-1,4-N-acetylglucosaminy | |
| Modification date | 20141207 | |
| dbXrefs | MIM : 604623 | |
| HGNC : HGNC | ||
| Ensembl : ENSG00000071073 | ||
| HPRD : 06860 | ||
| Vega : OTTHUMG00000130563 | ||
| Protein | UniProt: go to UniProt's Cross Reference DB Table | |
| Expression | CleanEX: HS_MGAT4A | |
| BioGPS: 11320 | ||
| Gene Expression Atlas: ENSG00000071073 | ||
| The Human Protein Atlas: ENSG00000071073 | ||
| Pathway | NCI Pathway Interaction Database: MGAT4A | |
| KEGG: MGAT4A | ||
| REACTOME: MGAT4A | ||
| ConsensusPathDB | ||
| Pathway Commons: MGAT4A | ||
| Metabolism | MetaCyc: MGAT4A | |
| HUMANCyc: MGAT4A | ||
| Regulation | Ensembl's Regulation: ENSG00000071073 | |
| miRBase: chr2 :99,235,568-99,347,589 | ||
| TargetScan: NM_001160154 | ||
| cisRED: ENSG00000071073 | ||
| Context | iHOP: MGAT4A | |
| cancer metabolism search in PubMed: MGAT4A | ||
| UCL Cancer Institute: MGAT4A | ||
| Assigned class in ccmGDB | C | |
| Top |
| Phenotypic Information for MGAT4A(metabolism pathway, cancer, disease, phenome) |
| Cancer | CGAP: MGAT4A |
| Familial Cancer Database: MGAT4A | |
| * This gene is included in those cancer gene databases. |
|
|
|
|
|
|
| ||||||||||||||||||||||||||||||||||||||||||||||||||||||||||||||||||||||||||||||||||||||||||||||||||||||||||||||||||||||||||||||||||||||||||||||||||||||||||||||||||||||||||||||||||||||||||||||||||||||||||||||||||||||||||||||||||||||||||||||||||||||||||||||||||||||||||||||||||||||||||||||||||||||||||||||||||||
Oncogene 1 | Significant driver gene in | |||||||||||||||||||||||||||||||||||||||||||||||||||||||||||||||||||||||||||||||||||||||||||||||||||||||||||||||||||||||||||||||||||||||||||||||||||||||||||||||||||||||||||||||||||||||||||||||||||||||||||||||||||||||||||||||||||||||||||||||||||||||||||||||||||||||||||||||||||||||||||||||||||||||||||||||||||||||||
| cf) number; DB name 1 Oncogene; http://nar.oxfordjournals.org/content/35/suppl_1/D721.long, 2 Tumor Suppressor gene; https://bioinfo.uth.edu/TSGene/, 3 Cancer Gene Census; http://www.nature.com/nrc/journal/v4/n3/abs/nrc1299.html, 4 CancerGenes; http://nar.oxfordjournals.org/content/35/suppl_1/D721.long, 5 Network of Cancer Gene; http://ncg.kcl.ac.uk/index.php, 1Therapeutic Vulnerabilities in Cancer; http://cbio.mskcc.org/cancergenomics/statius/ |
| REACTOME_METABOLISM_OF_PROTEINS | |
| OMIM | |
| Orphanet | |
| Disease | KEGG Disease: MGAT4A |
| MedGen: MGAT4A (Human Medical Genetics with Condition) | |
| ClinVar: MGAT4A | |
| Phenotype | MGI: MGAT4A (International Mouse Phenotyping Consortium) |
| PhenomicDB: MGAT4A | |
| Mutations for MGAT4A |
| * Under tables are showing count per each tissue to give us broad intuition about tissue specific mutation patterns.You can go to the detailed page for each mutation database's web site. |
| - Statistics for Tissue and Mutation type | Top |
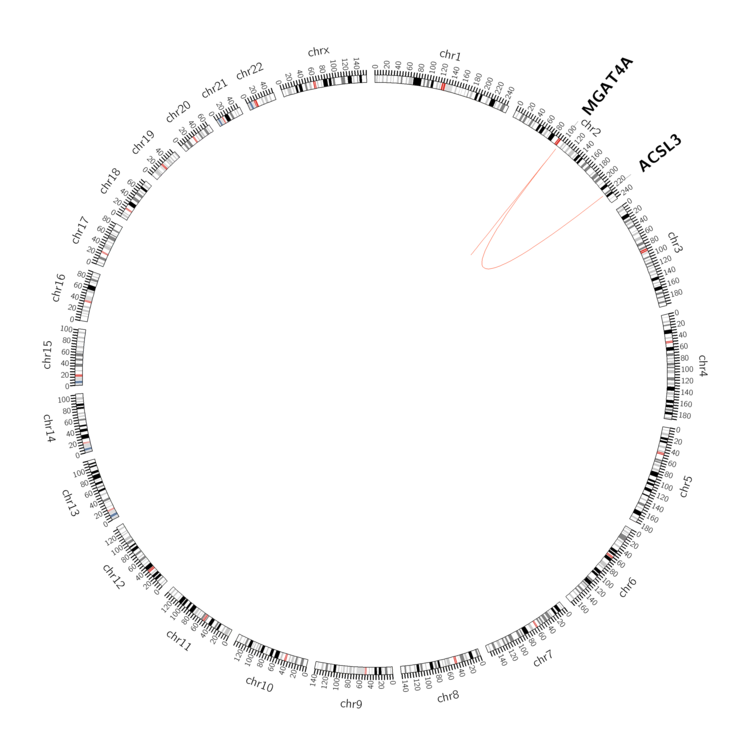 |
| - For Inter-chromosomal Variations |
| There's no inter-chromosomal structural variation. |
| - For Intra-chromosomal Variations |
| * Intra-chromosomal variantions includes 'intrachromosomal amplicon to amplicon', 'intrachromosomal amplicon to non-amplified dna', 'intrachromosomal deletion', 'intrachromosomal fold-back inversion', 'intrachromosomal inversion', 'intrachromosomal tandem duplication', 'Intrachromosomal unknown type', 'intrachromosomal with inverted orientation', 'intrachromosomal with non-inverted orientation'. |
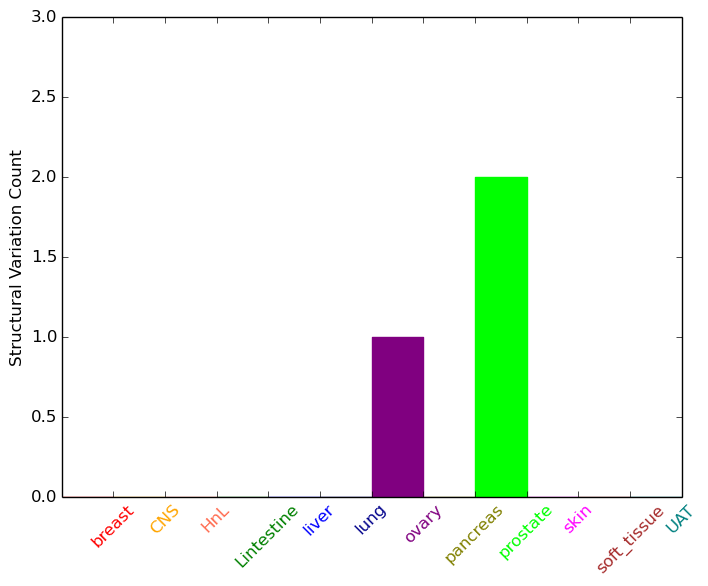 |
| Sample | Symbol_a | Chr_a | Start_a | End_a | Symbol_b | Chr_b | Start_b | End_b |
| ovary | MGAT4A | chr2 | 99297104 | 99297124 | MGAT4A | chr2 | 99310628 | 99310648 |
| prostate | MGAT4A | chr2 | 99290293 | 99290293 | ACSL3 | chr2 | 223803266 | 223803266 |
| cf) Tissue number; Tissue name (1;Breast, 2;Central_nervous_system, 3;Haematopoietic_and_lymphoid_tissue, 4;Large_intestine, 5;Liver, 6;Lung, 7;Ovary, 8;Pancreas, 9;Prostate, 10;Skin, 11;Soft_tissue, 12;Upper_aerodigestive_tract) |
| * From mRNA Sanger sequences, Chitars2.0 arranged chimeric transcripts. This table shows MGAT4A related fusion information. |
| ID | Head Gene | Tail Gene | Accession | Gene_a | qStart_a | qEnd_a | Chromosome_a | tStart_a | tEnd_a | Gene_a | qStart_a | qEnd_a | Chromosome_a | tStart_a | tEnd_a |
| AU253288 | AUTS2 | 19 | 311 | 7 | 69637782 | 69638074 | MGAT4A | 306 | 625 | 2 | 99239043 | 99239368 | |
| Top |
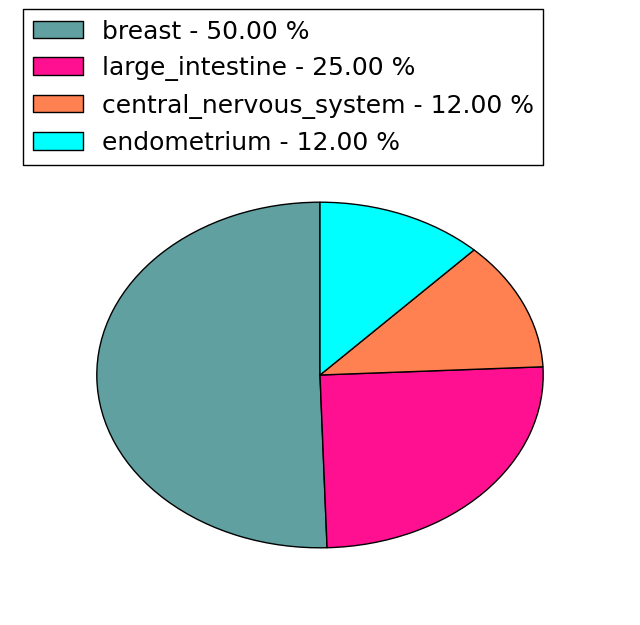
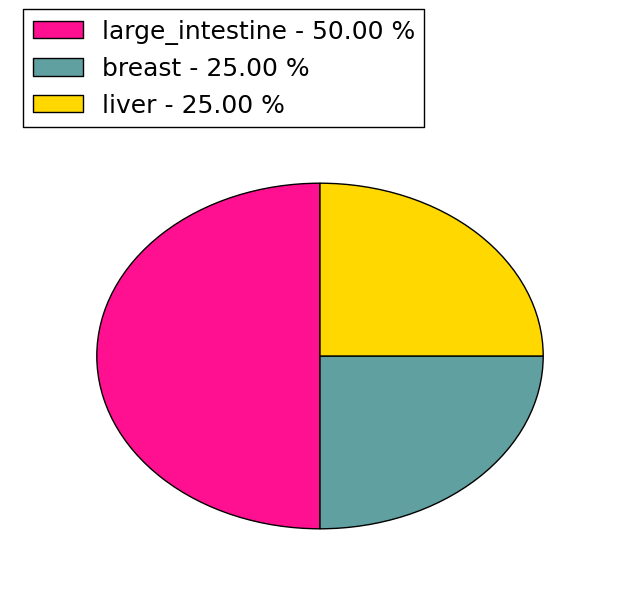
| Mutation type/ Tissue ID | brca | cns | cerv | endome | haematopo | kidn | Lintest | liver | lung | ns | ovary | pancre | prost | skin | stoma | thyro | urina | |||
| Total # sample | 2 | |||||||||||||||||||
| GAIN (# sample) | 2 | |||||||||||||||||||
| LOSS (# sample) |
| cf) Tissue ID; Tissue type (1; Breast, 2; Central_nervous_system, 3; Cervix, 4; Endometrium, 5; Haematopoietic_and_lymphoid_tissue, 6; Kidney, 7; Large_intestine, 8; Liver, 9; Lung, 10; NS, 11; Ovary, 12; Pancreas, 13; Prostate, 14; Skin, 15; Stomach, 16; Thyroid, 17; Urinary_tract) |
| Top |
|
 |
| Top |
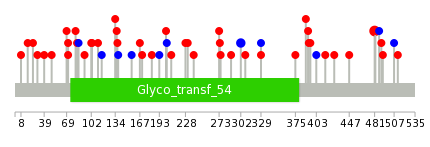
| Stat. for Non-Synonymous SNVs (# total SNVs=30) | (# total SNVs=8) |
 |  |
(# total SNVs=4) | (# total SNVs=0) |
 |
| Top |
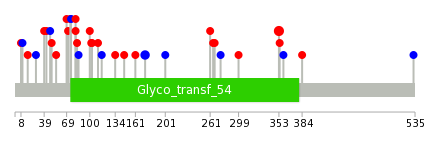
| * When you move the cursor on each content, you can see more deailed mutation information on the Tooltip. Those are primary_site,primary_histology,mutation(aa),pubmedID. |
| GRCh37 position | Mutation(aa) | Unique sampleID count |
| chr2:99251711-99251711 | p.R481Q | 4 |
| chr2:99260500-99260500 | p.A302A | 2 |
| chr2:99256692-99256692 | p.? | 2 |
| chr2:99272887-99272887 | p.S209L | 1 |
| chr2:99342746-99342746 | p.S17F | 1 |
| chr2:99291495-99291495 | p.? | 1 |
| chr2:99256350-99256350 | p.E415K | 1 |
| chr2:99260421-99260421 | p.L329F | 1 |
| chr2:99294818-99294818 | p.R71S | 1 |
| chr2:99272904-99272904 | p.G203G | 1 |
| Top |
|
 |
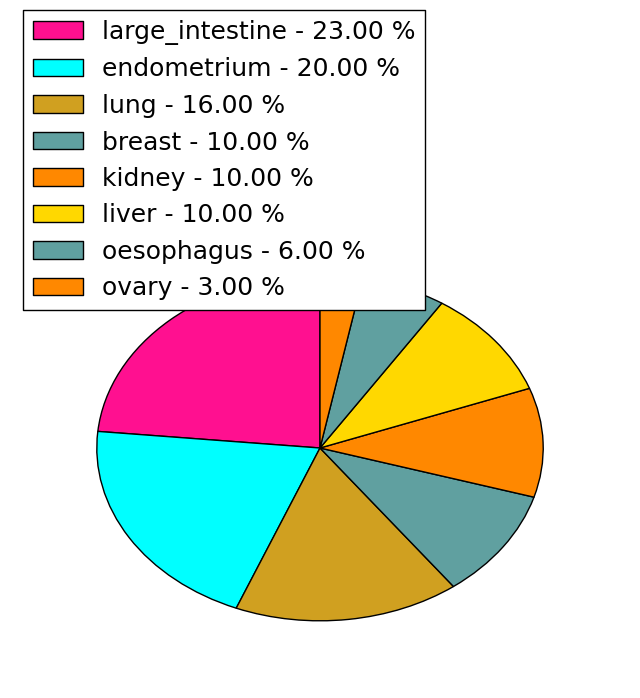
| Point Mutation/ Tissue ID | 1 | 2 | 3 | 4 | 5 | 6 | 7 | 8 | 9 | 10 | 11 | 12 | 13 | 14 | 15 | 16 | 17 | 18 | 19 | 20 |
| # sample | 1 | 2 | 7 | 1 | 3 | 2 | 2 | 1 | 11 | 2 | 7 | |||||||||
| # mutation | 1 | 2 | 7 | 1 | 3 | 2 | 2 | 1 | 11 | 2 | 7 | |||||||||
| nonsynonymous SNV | 1 | 4 | 3 | 2 | 2 | 1 | 8 | 1 | 6 | |||||||||||
| synonymous SNV | 2 | 3 | 1 | 3 | 1 | 1 |
| cf) Tissue ID; Tissue type (1; BLCA[Bladder Urothelial Carcinoma], 2; BRCA[Breast invasive carcinoma], 3; CESC[Cervical squamous cell carcinoma and endocervical adenocarcinoma], 4; COAD[Colon adenocarcinoma], 5; GBM[Glioblastoma multiforme], 6; Glioma Low Grade, 7; HNSC[Head and Neck squamous cell carcinoma], 8; KICH[Kidney Chromophobe], 9; KIRC[Kidney renal clear cell carcinoma], 10; KIRP[Kidney renal papillary cell carcinoma], 11; LAML[Acute Myeloid Leukemia], 12; LUAD[Lung adenocarcinoma], 13; LUSC[Lung squamous cell carcinoma], 14; OV[Ovarian serous cystadenocarcinoma ], 15; PAAD[Pancreatic adenocarcinoma], 16; PRAD[Prostate adenocarcinoma], 17; SKCM[Skin Cutaneous Melanoma], 18:STAD[Stomach adenocarcinoma], 19:THCA[Thyroid carcinoma], 20:UCEC[Uterine Corpus Endometrial Carcinoma]) |
| Top |
| * We represented just top 10 SNVs. When you move the cursor on each content, you can see more deailed mutation information on the Tooltip. Those are primary_site, primary_histology, mutation(aa), pubmedID. |
| Genomic Position | Mutation(aa) | Unique sampleID count |
| chr2:99251711 | p.R353Q,MGAT4A | 3 |
| chr2:99260500 | p.A174A,MGAT4A | 2 |
| chr2:99294774 | p.K146N,MGAT4A | 1 |
| chr2:99256428 | p.S102F | 1 |
| chr2:99274717 | p.N111H,MGAT4A | 1 |
| chr2:99294780 | p.K85K | 1 |
| chr2:99260419 | p.R103K,MGAT4A | 1 |
| chr2:99279521 | p.L83F | 1 |
| chr2:99294786 | p.S100F,MGAT4A | 1 |
| chr2:99242038 | p.D81E | 1 |
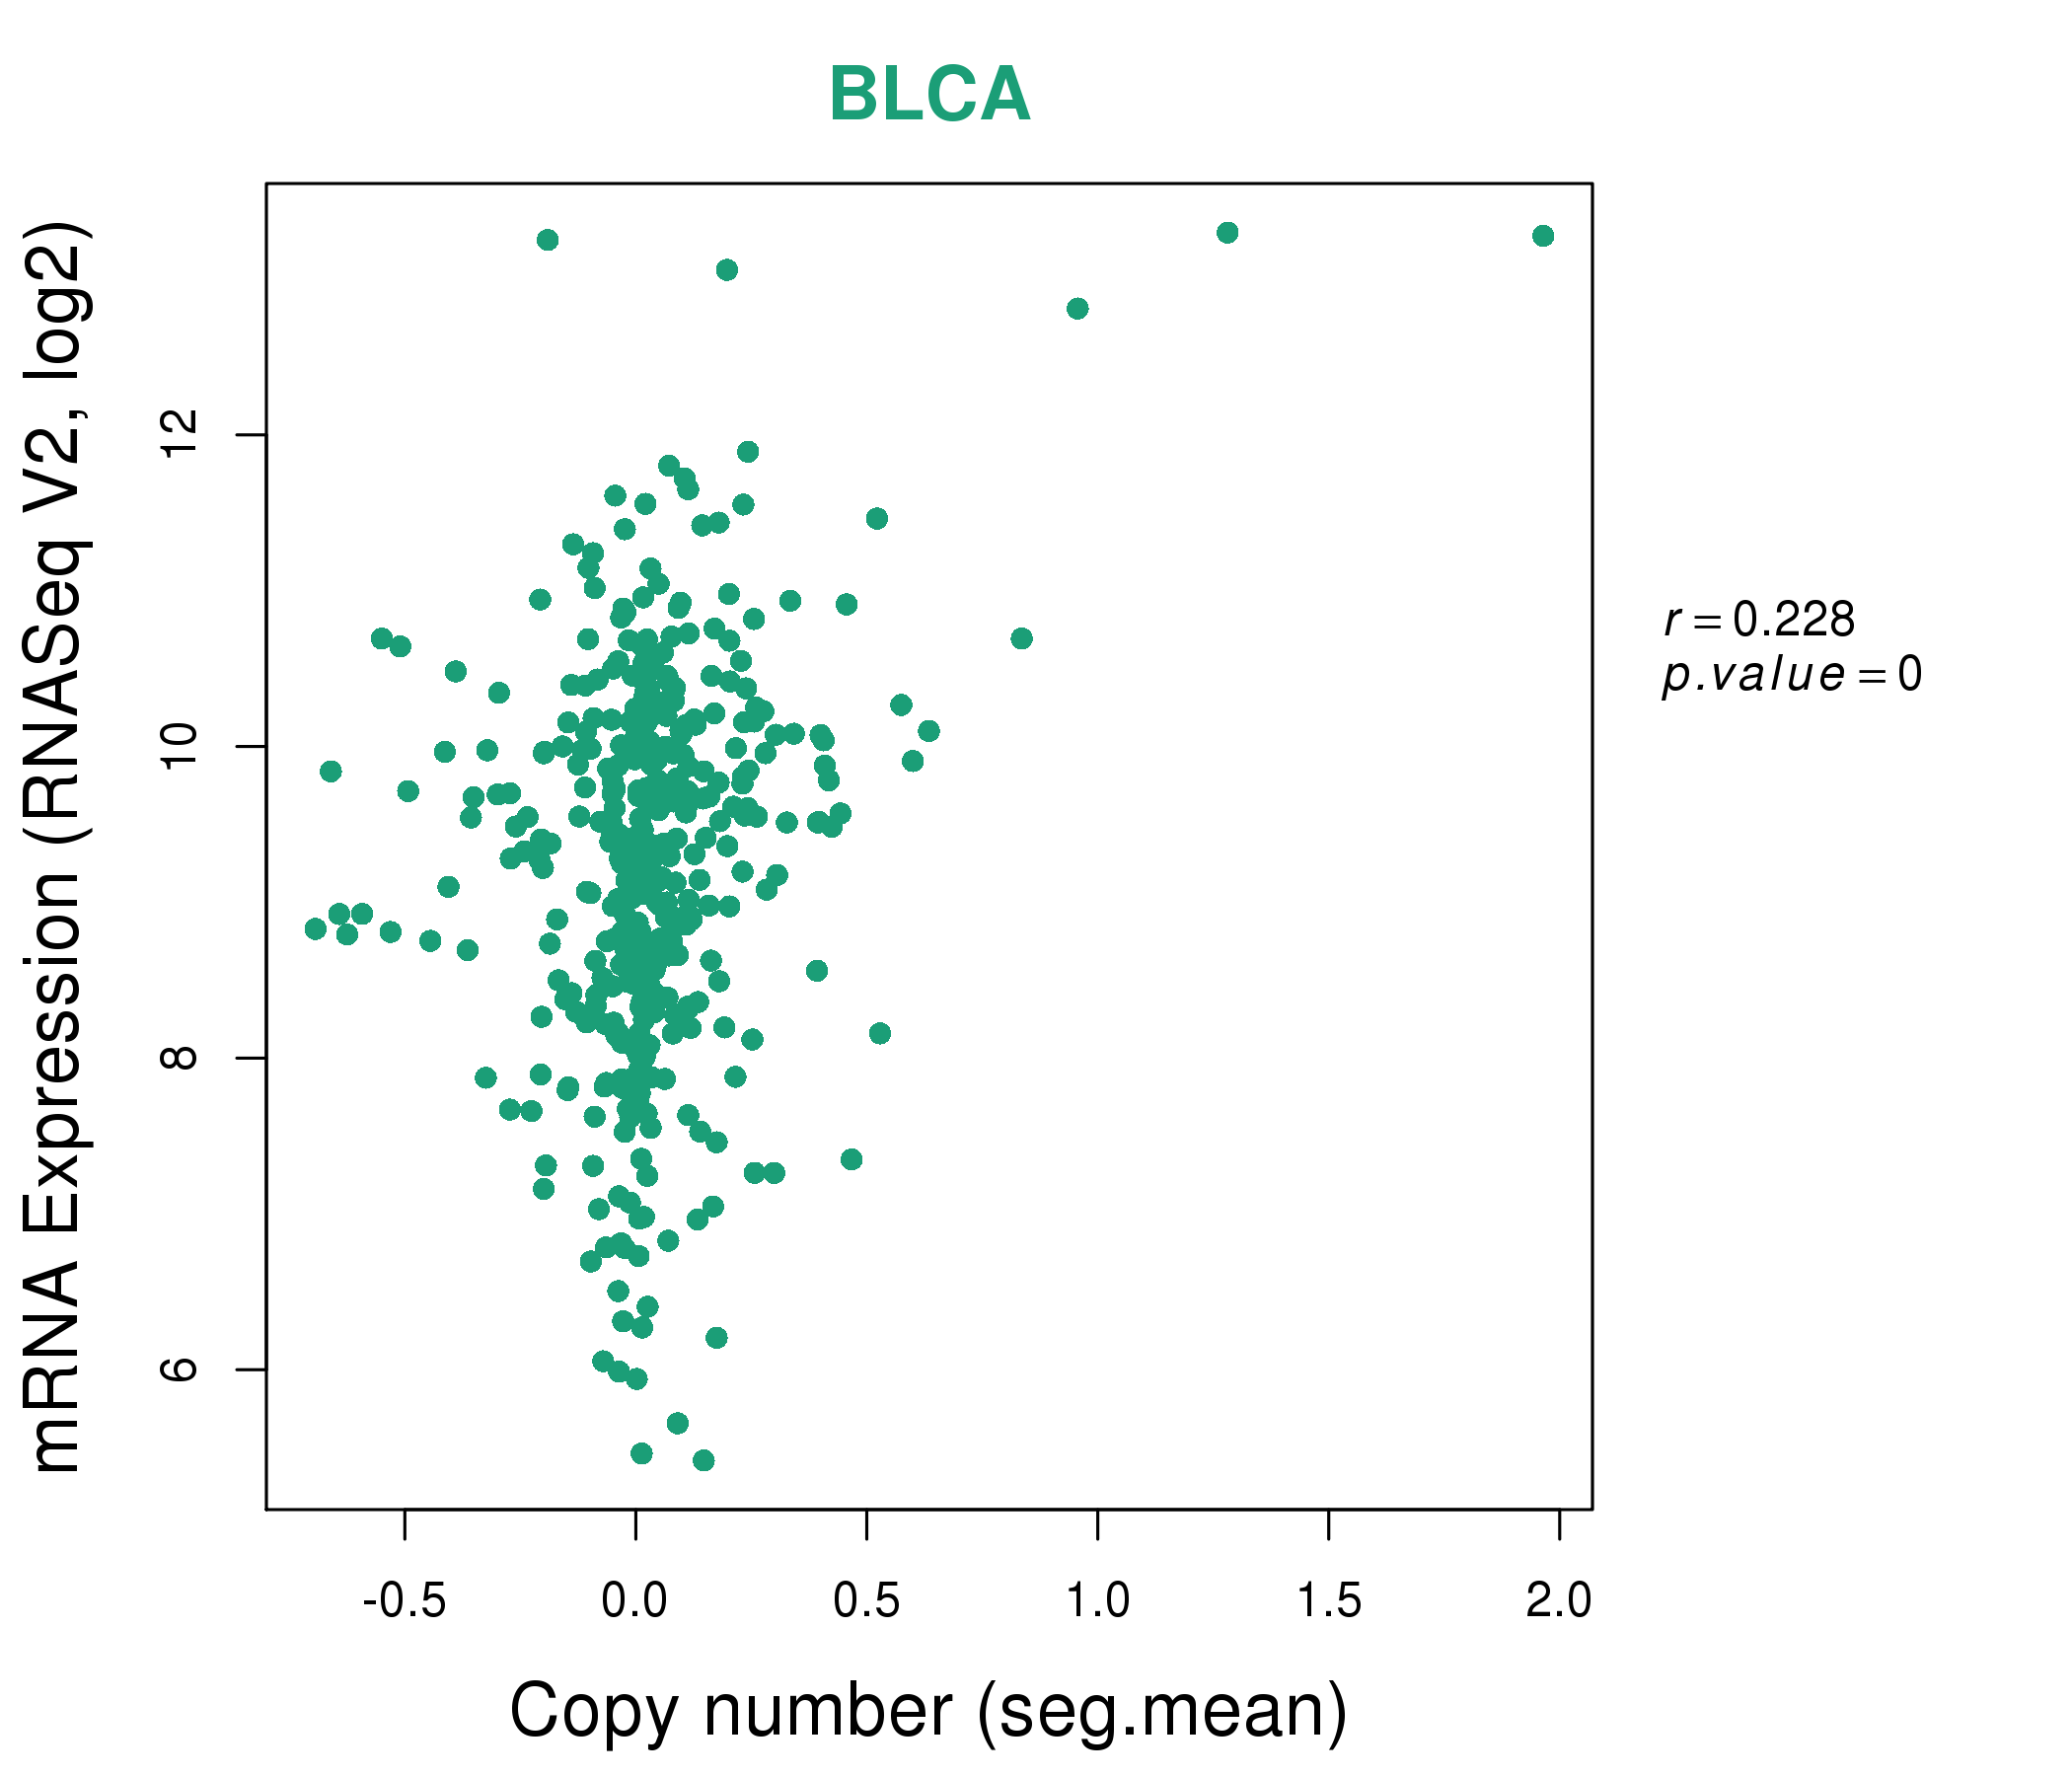
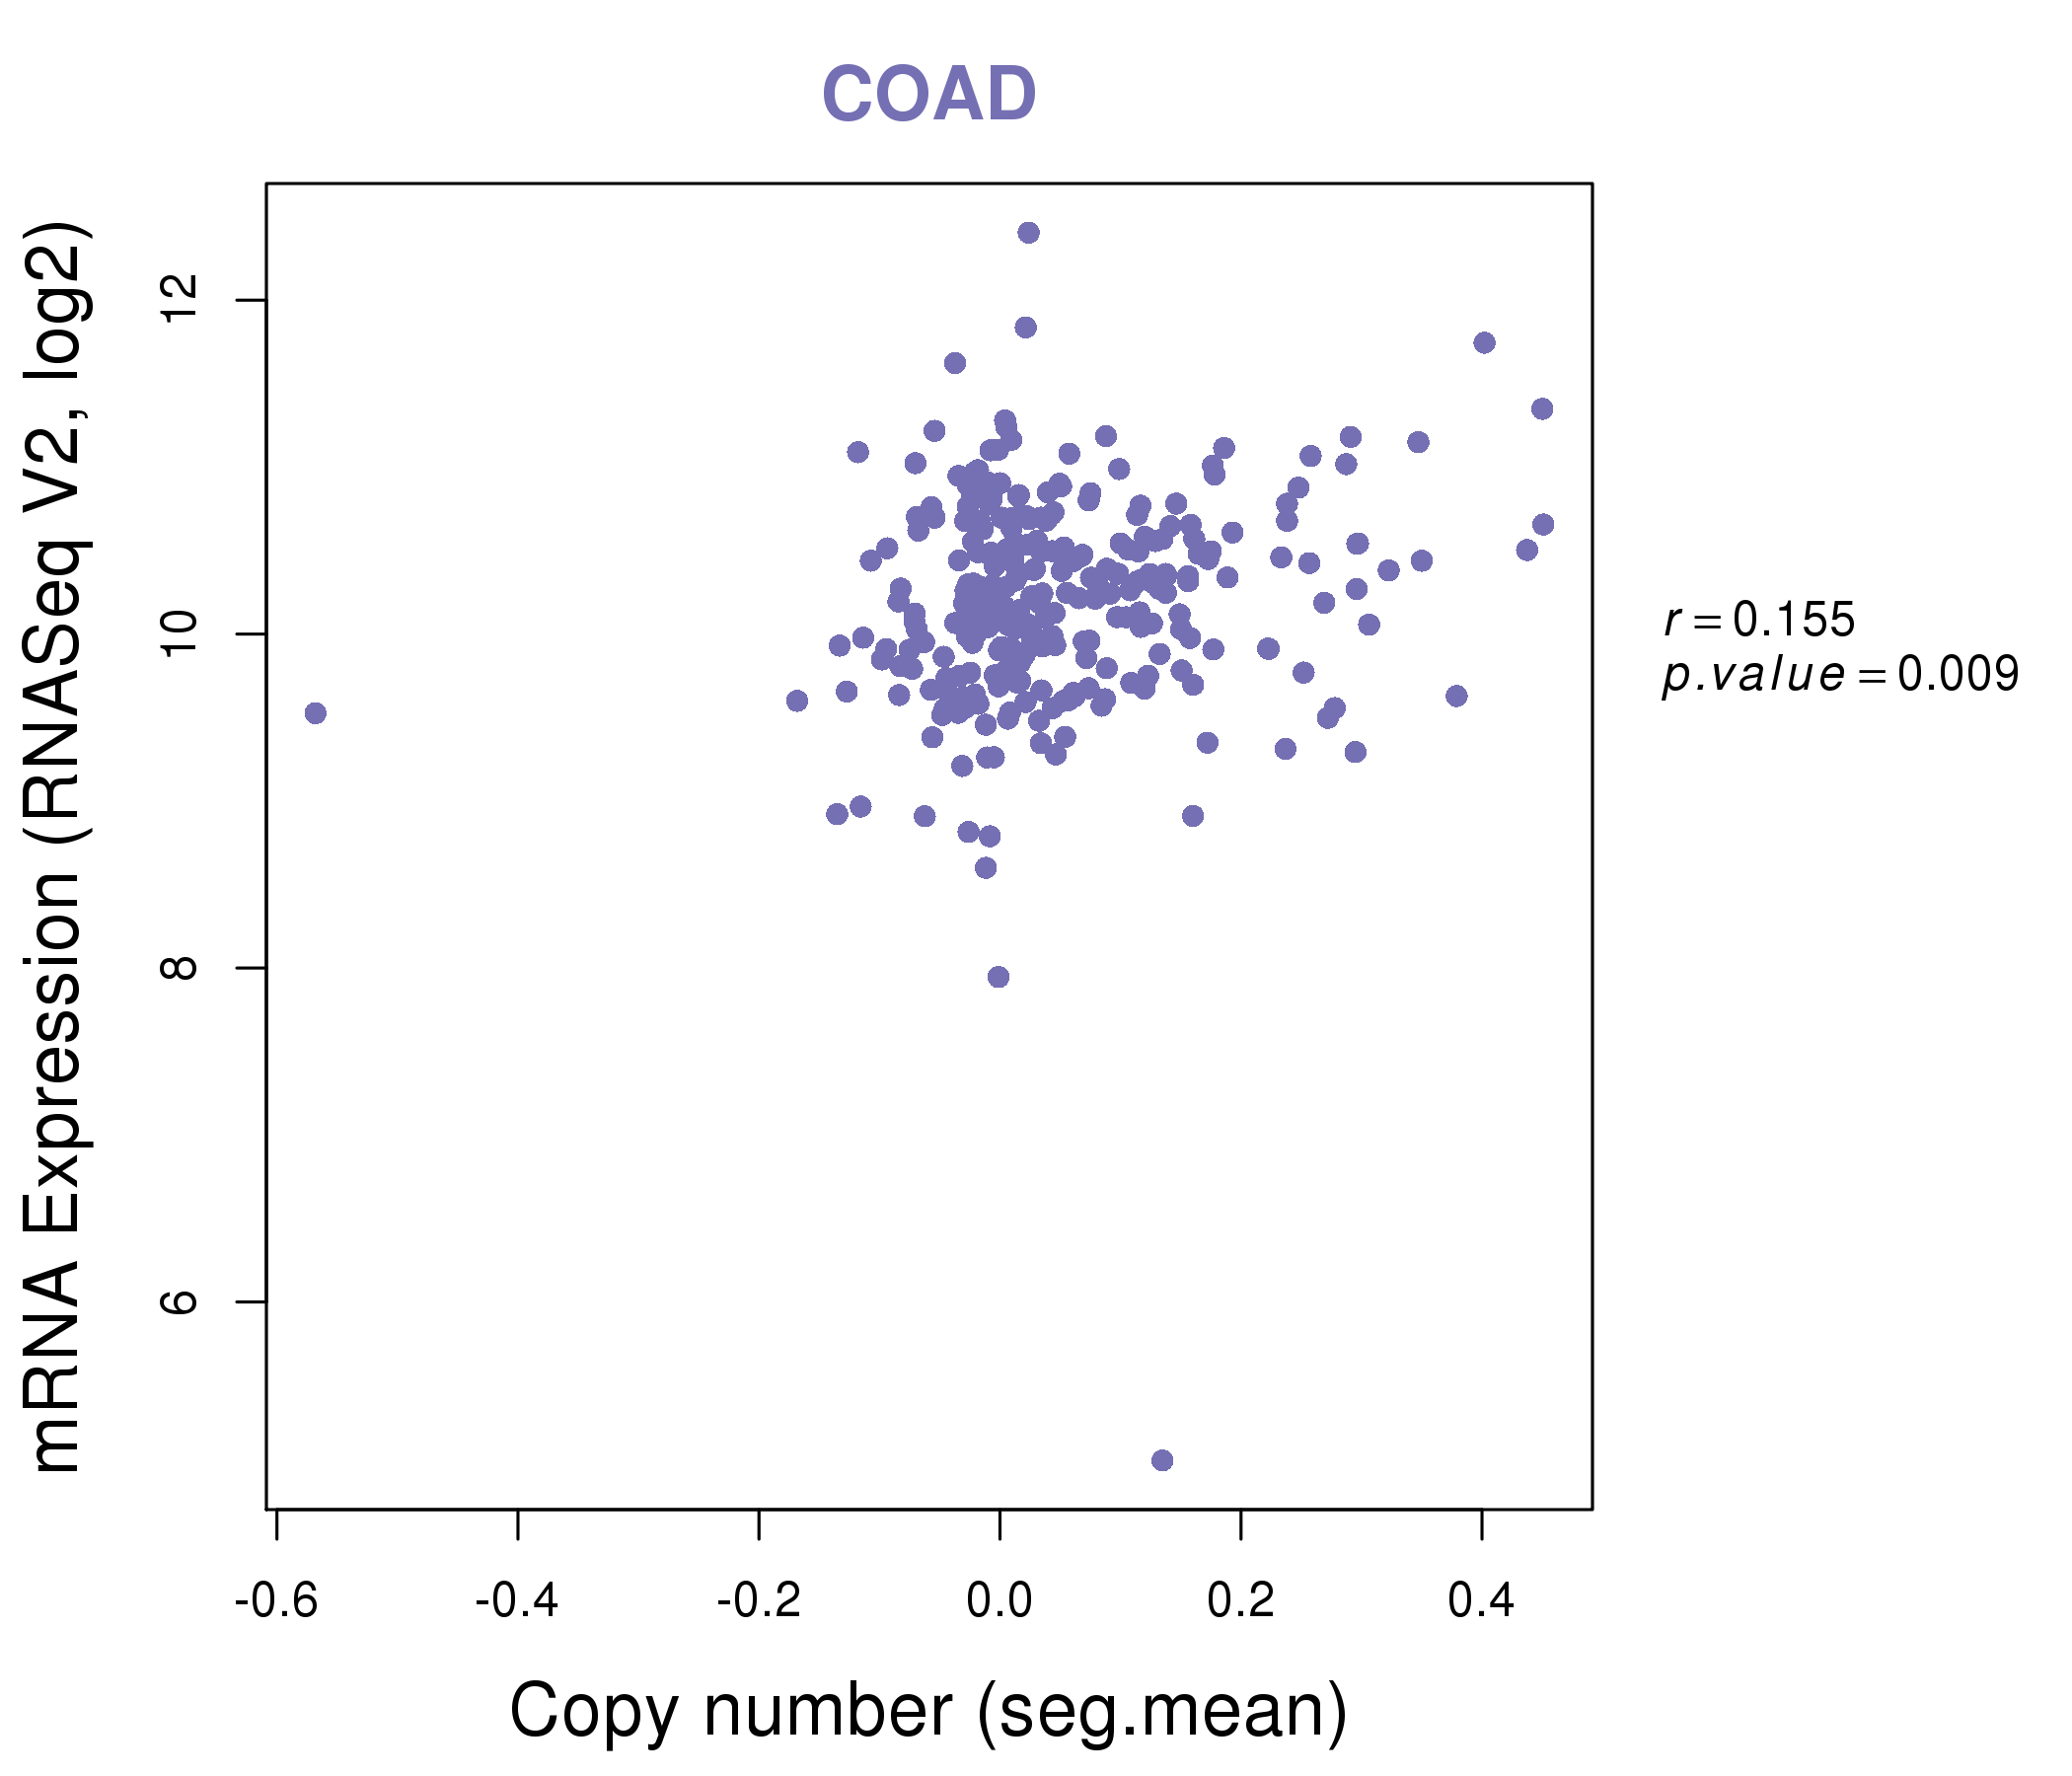
| * Copy number data were extracted from TCGA using R package TCGA-Assembler. The URLs of all public data files on TCGA DCC data server were gathered on Jan-05-2015. Function ProcessCNAData in TCGA-Assembler package was used to obtain gene-level copy number value which is calculated as the average copy number of the genomic region of a gene. |
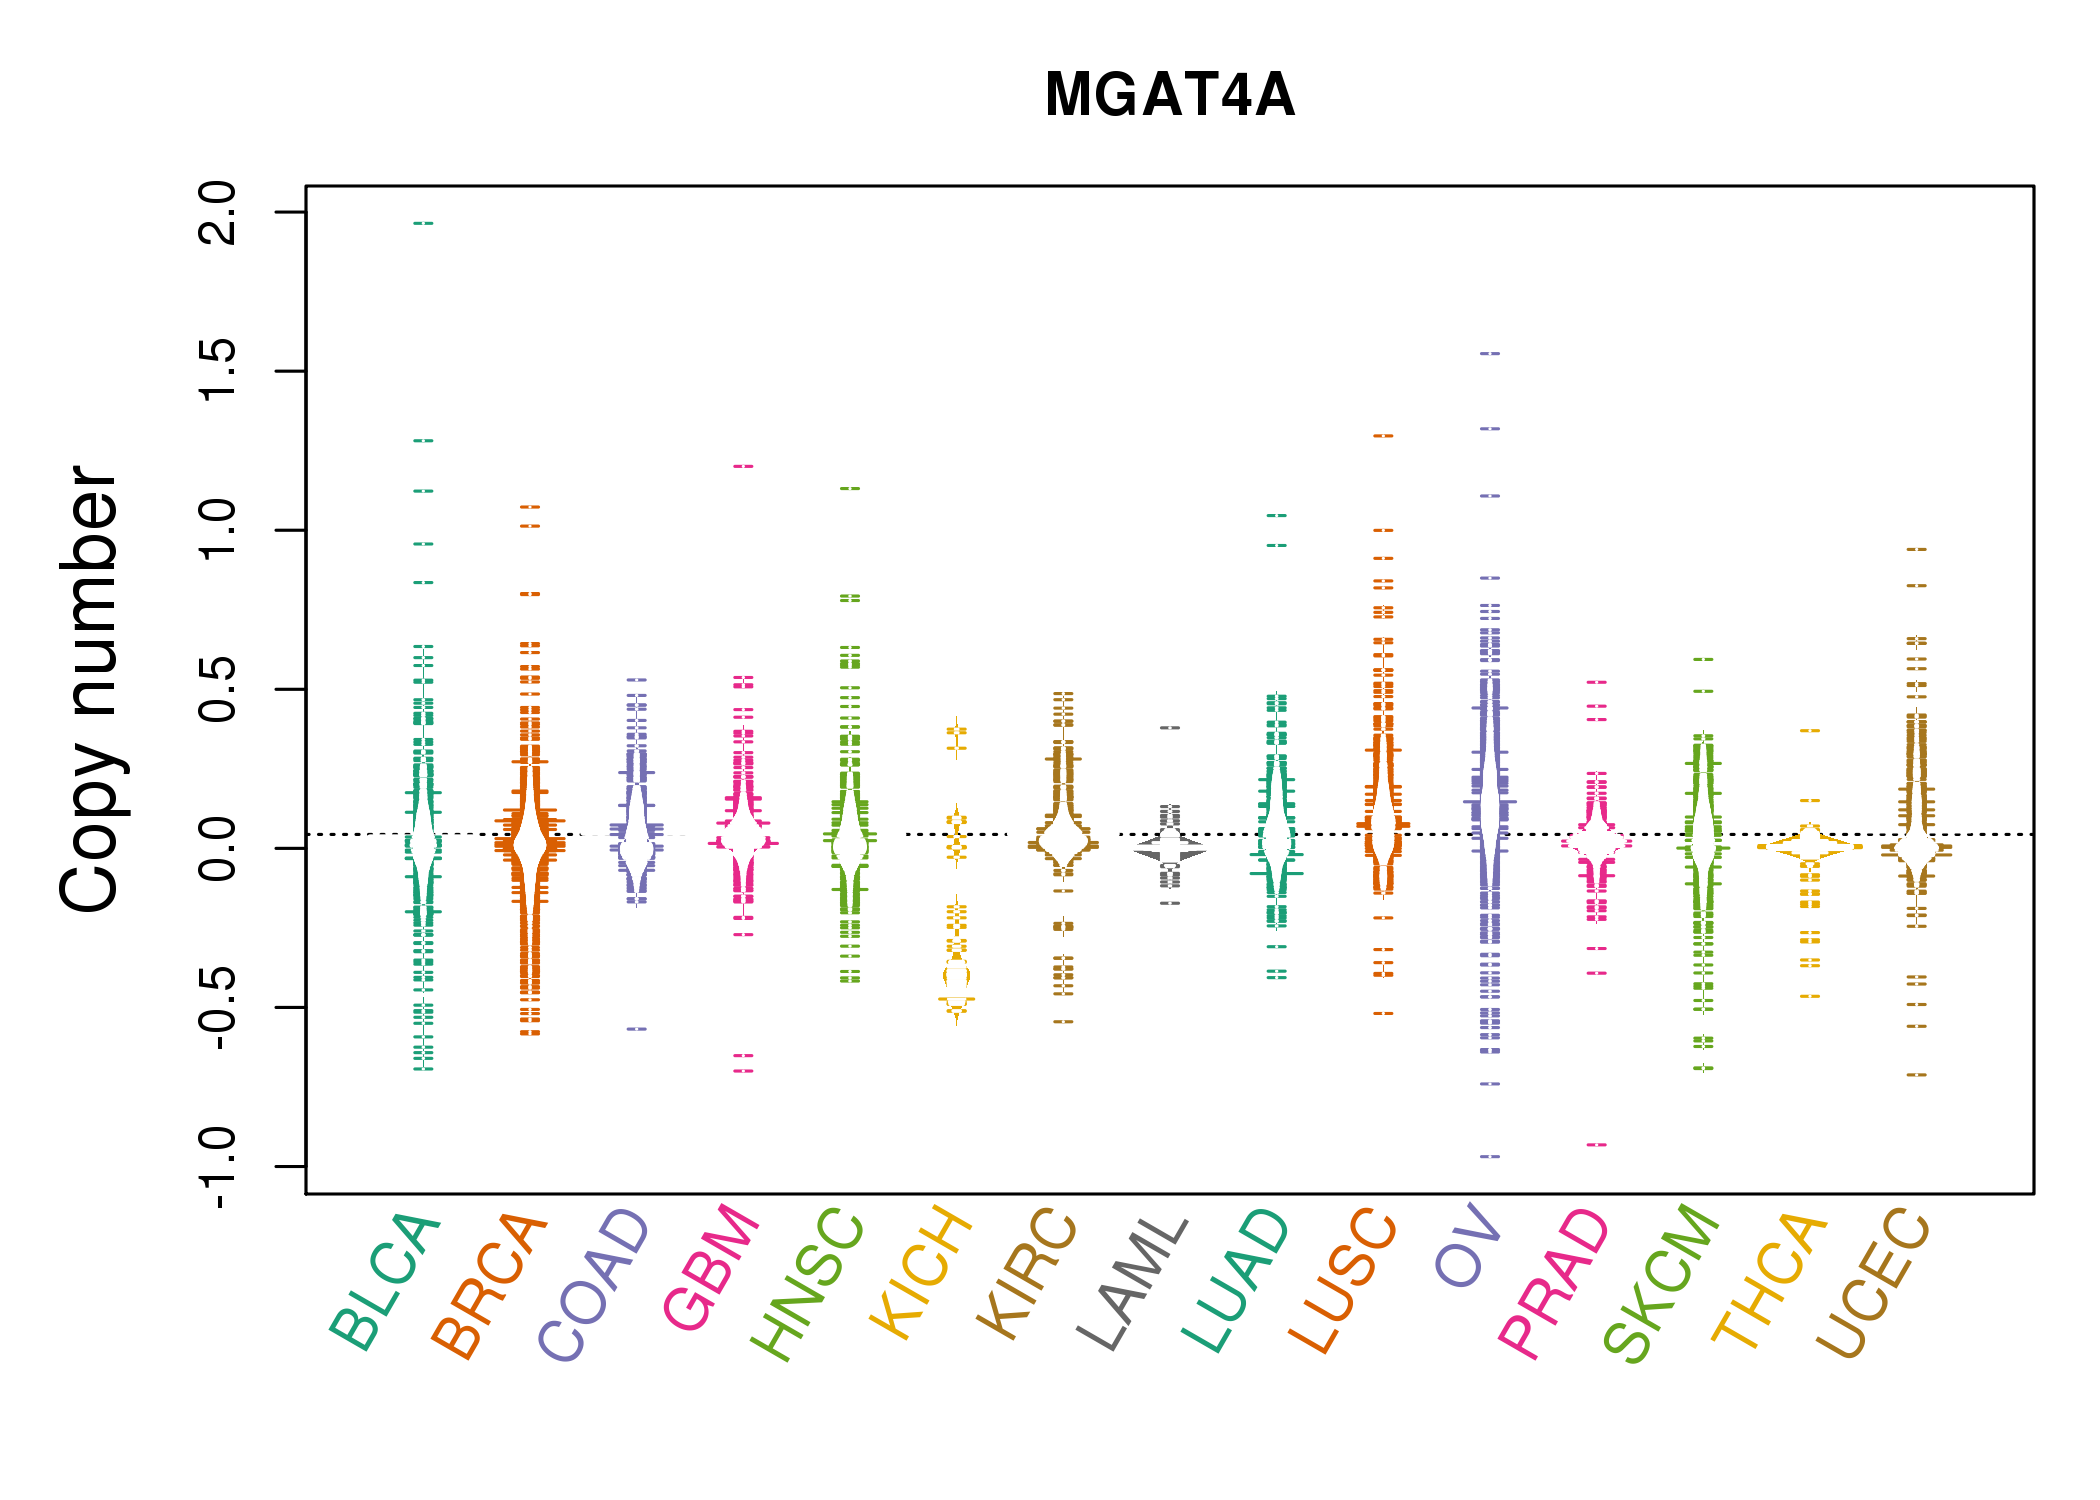 |
| cf) Tissue ID[Tissue type]: BLCA[Bladder Urothelial Carcinoma], BRCA[Breast invasive carcinoma], CESC[Cervical squamous cell carcinoma and endocervical adenocarcinoma], COAD[Colon adenocarcinoma], GBM[Glioblastoma multiforme], Glioma Low Grade, HNSC[Head and Neck squamous cell carcinoma], KICH[Kidney Chromophobe], KIRC[Kidney renal clear cell carcinoma], KIRP[Kidney renal papillary cell carcinoma], LAML[Acute Myeloid Leukemia], LUAD[Lung adenocarcinoma], LUSC[Lung squamous cell carcinoma], OV[Ovarian serous cystadenocarcinoma ], PAAD[Pancreatic adenocarcinoma], PRAD[Prostate adenocarcinoma], SKCM[Skin Cutaneous Melanoma], STAD[Stomach adenocarcinoma], THCA[Thyroid carcinoma], UCEC[Uterine Corpus Endometrial Carcinoma] |
| Top |
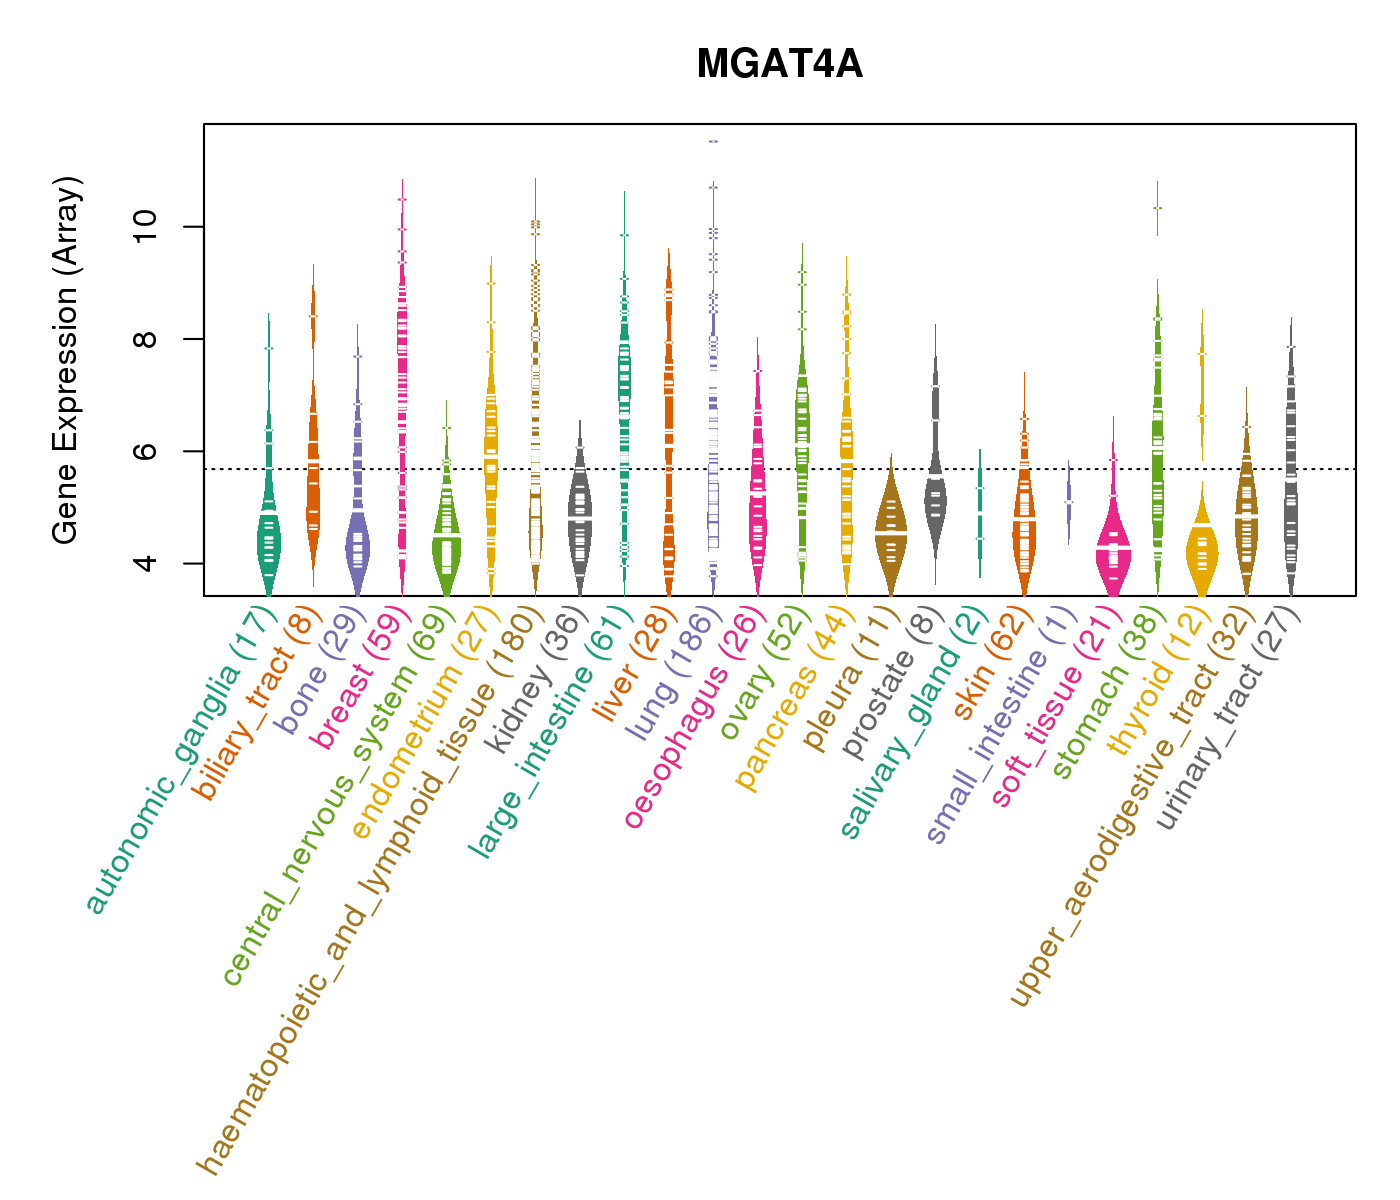
| Gene Expression for MGAT4A |
| * CCLE gene expression data were extracted from CCLE_Expression_Entrez_2012-10-18.res: Gene-centric RMA-normalized mRNA expression data. |
 |
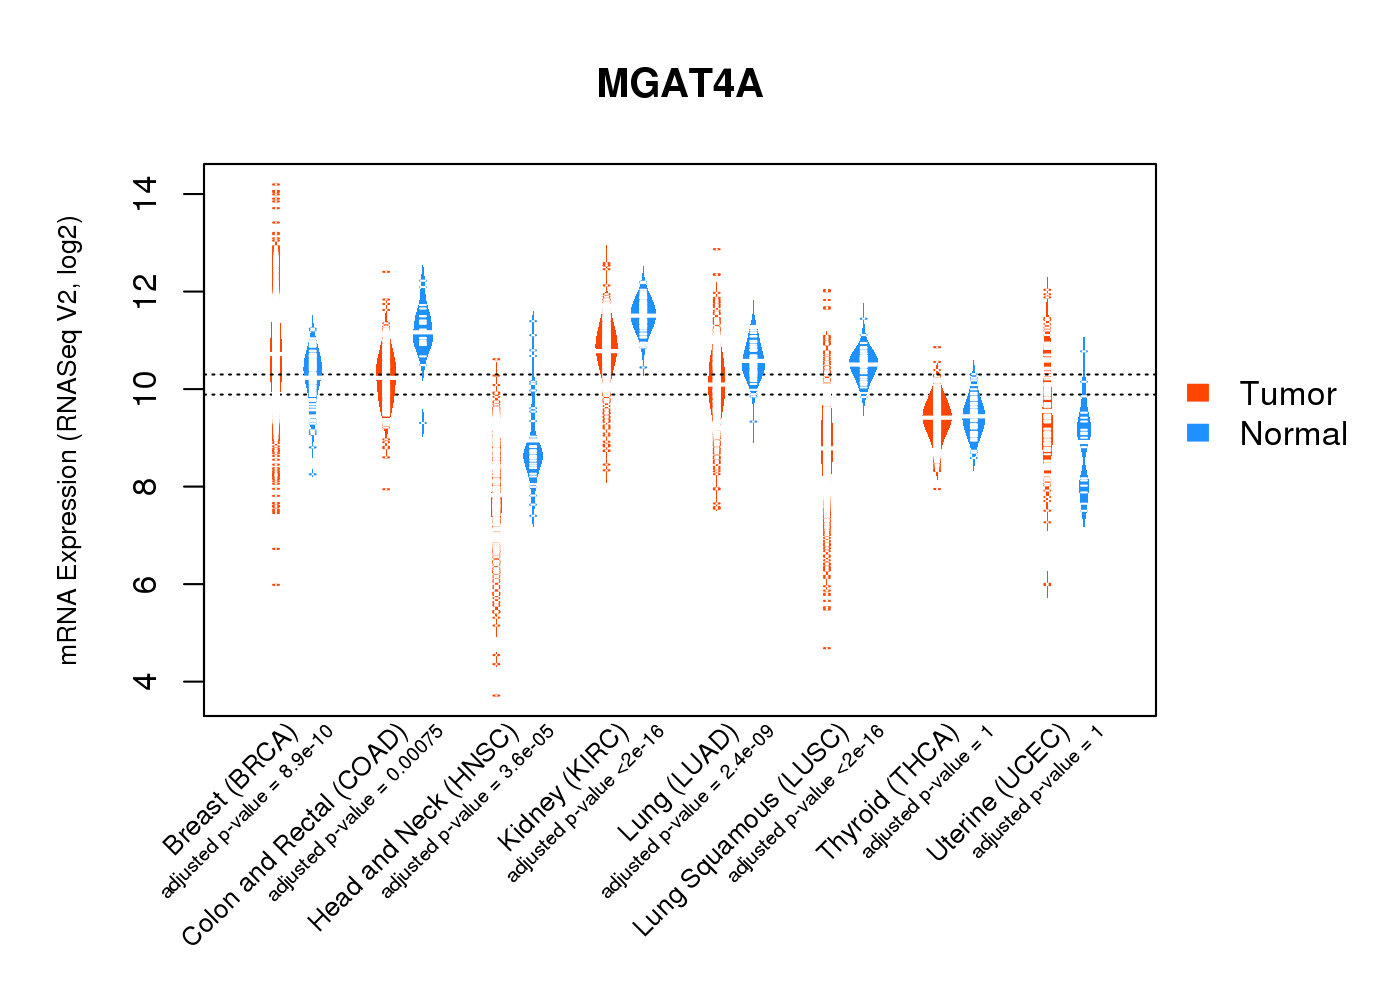
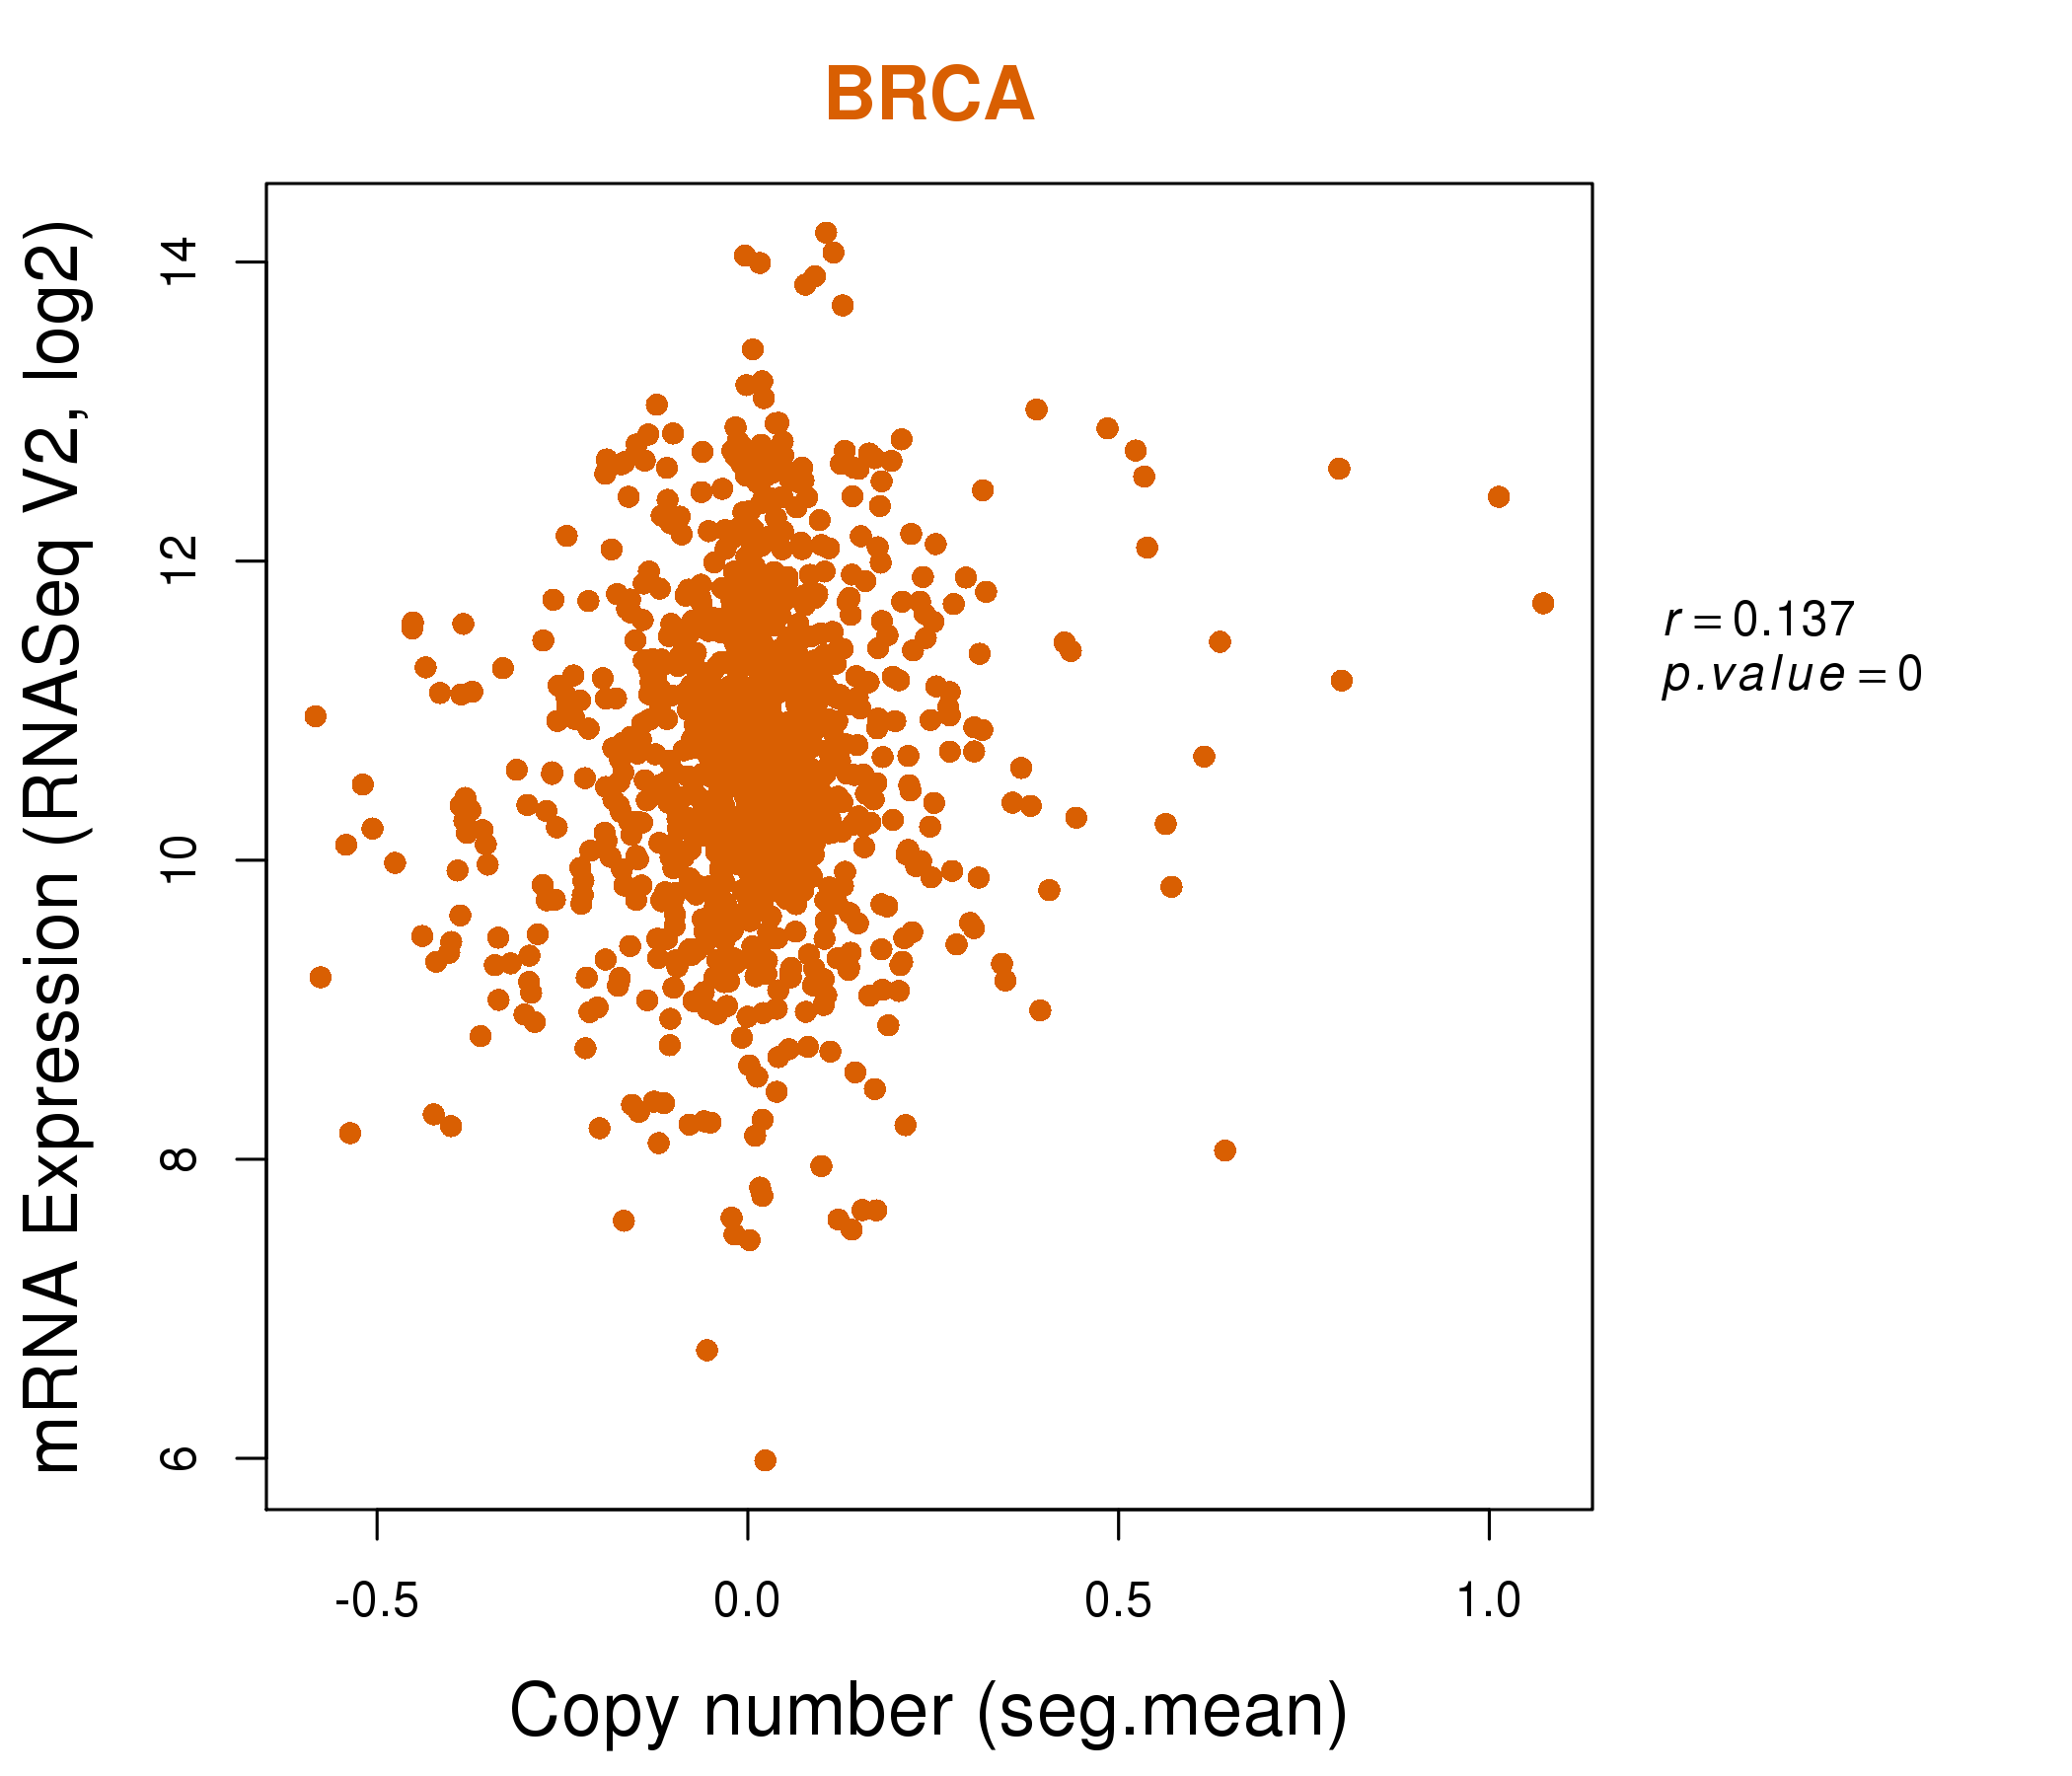
| * Normalized gene expression data of RNASeqV2 was extracted from TCGA using R package TCGA-Assembler. The URLs of all public data files on TCGA DCC data server were gathered at Jan-05-2015. Only eight cancer types have enough normal control samples for differential expression analysis. (t test, adjusted p<0.05 (using Benjamini-Hochberg FDR)) |
 |
| Top |
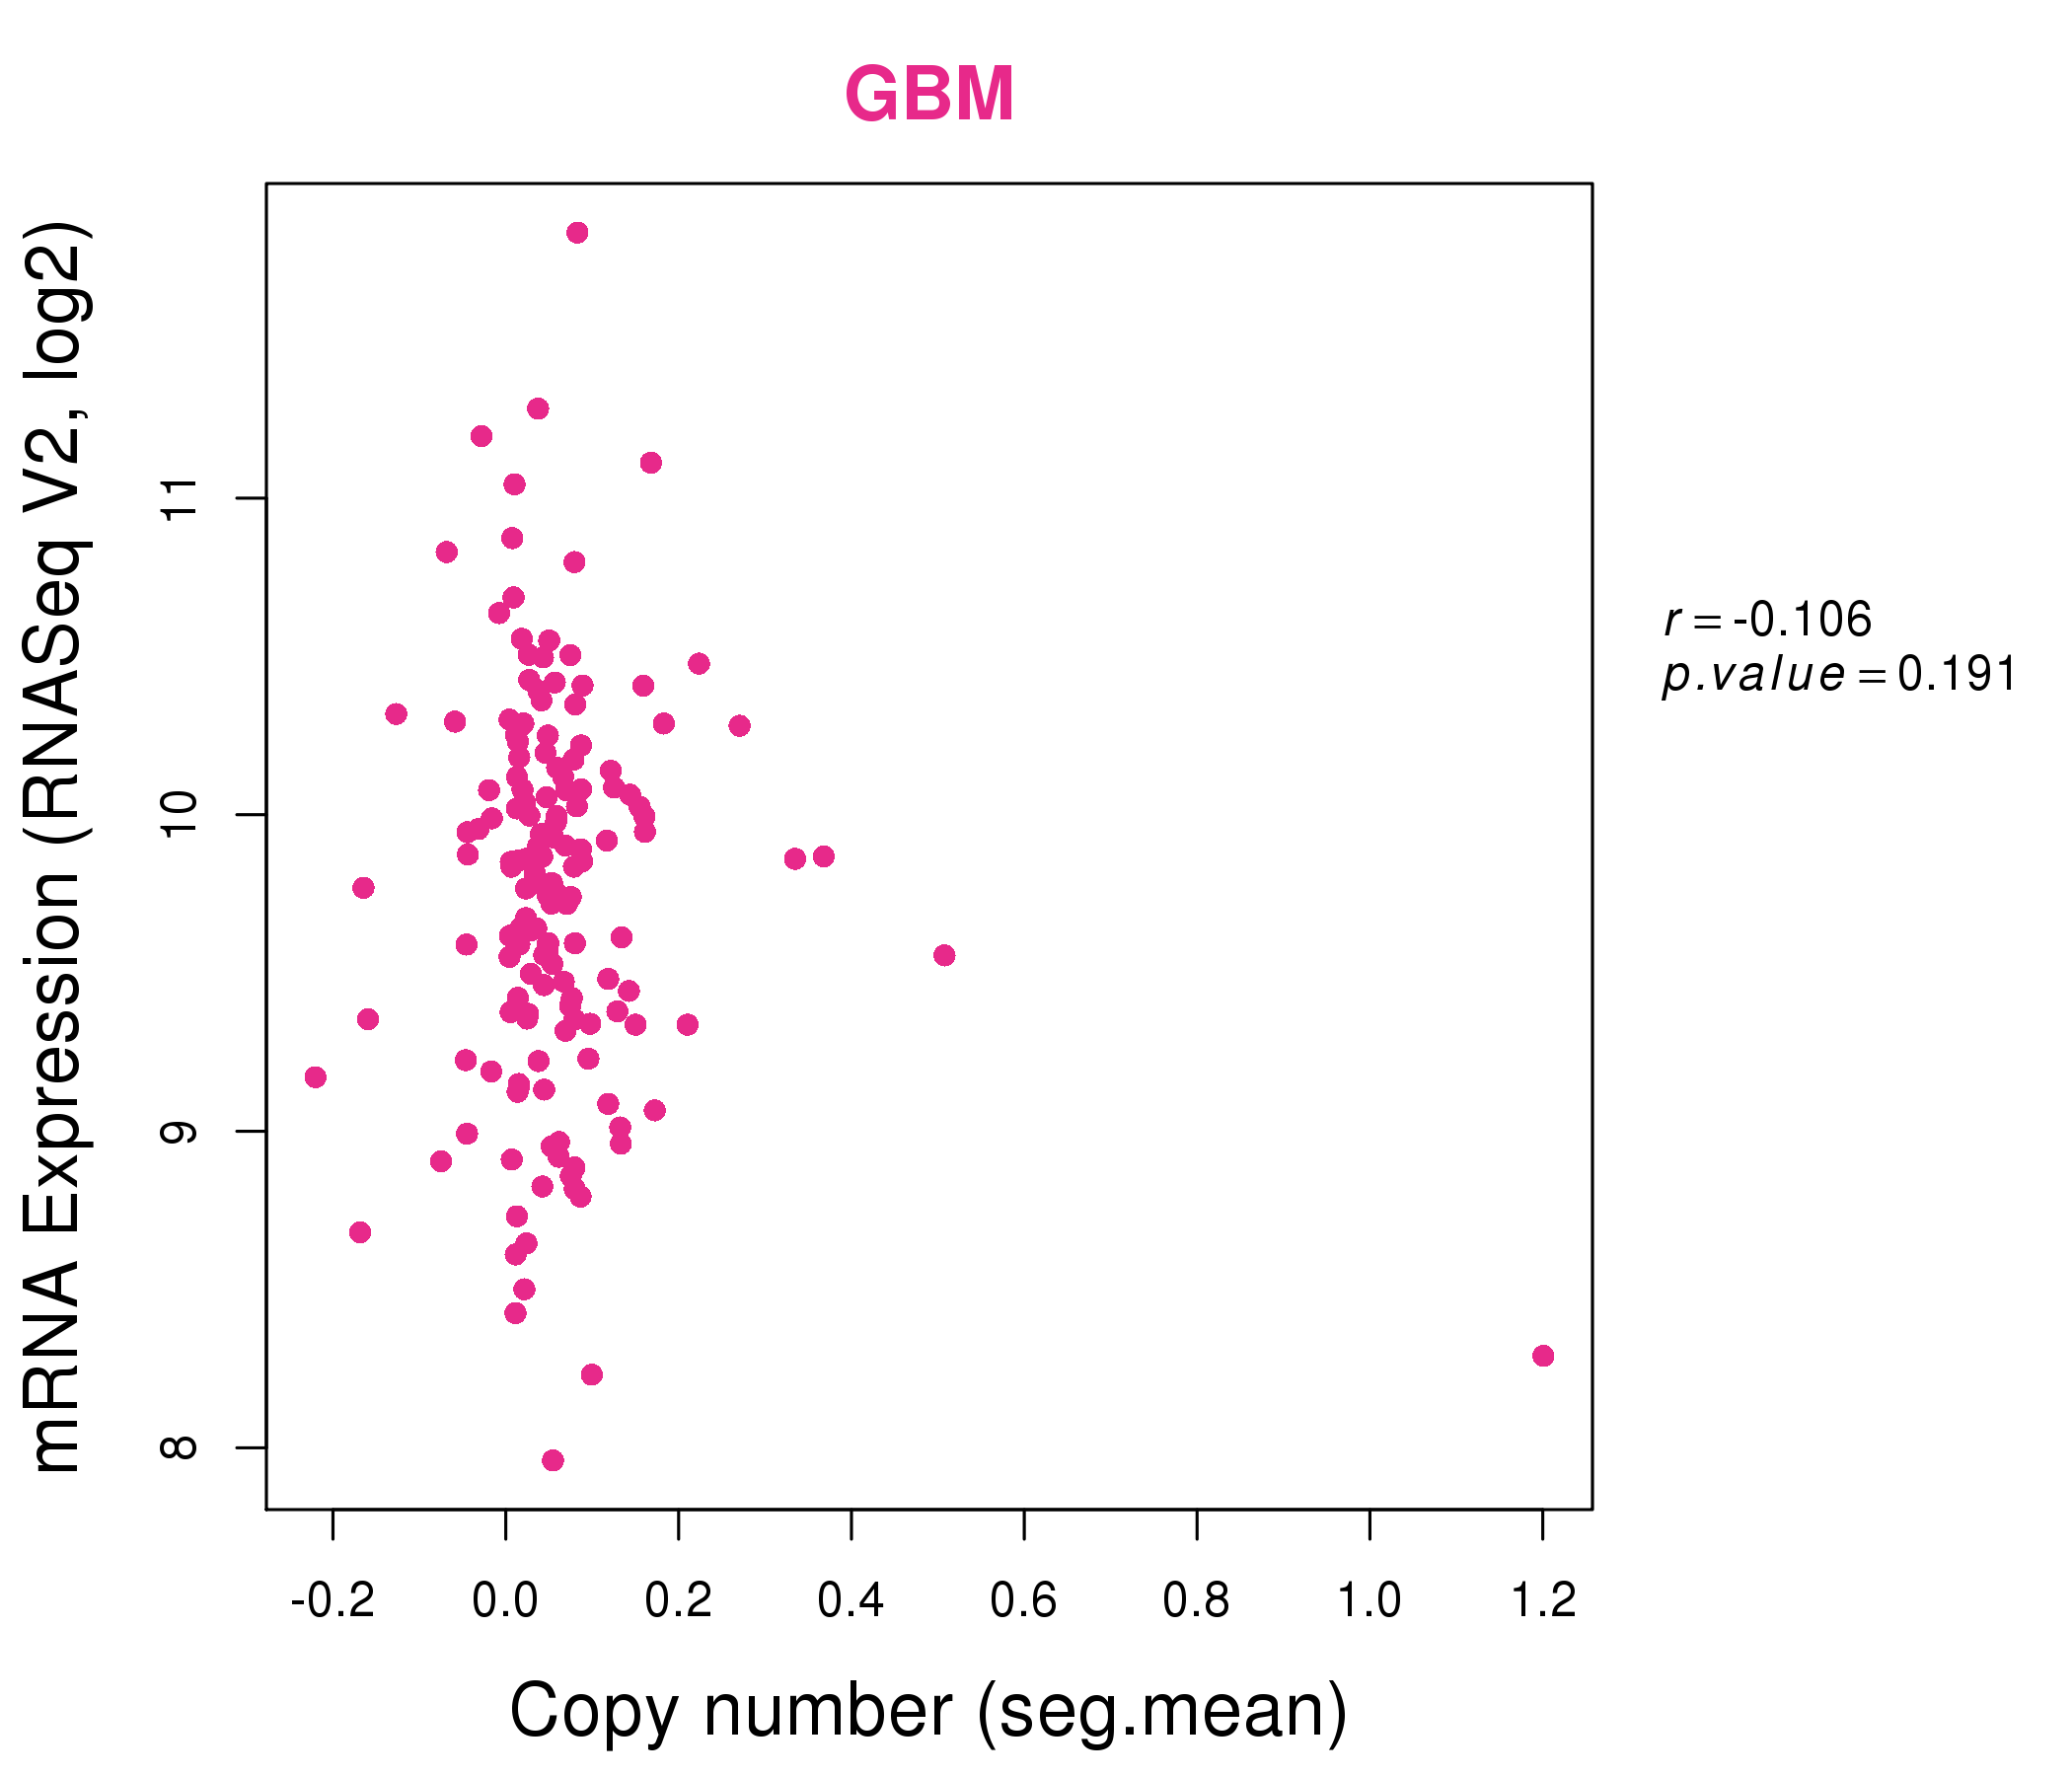
| * This plots show the correlation between CNV and gene expression. |
: Open all plots for all cancer types
 |
|
 |
|
| Top |
| Gene-Gene Network Information |
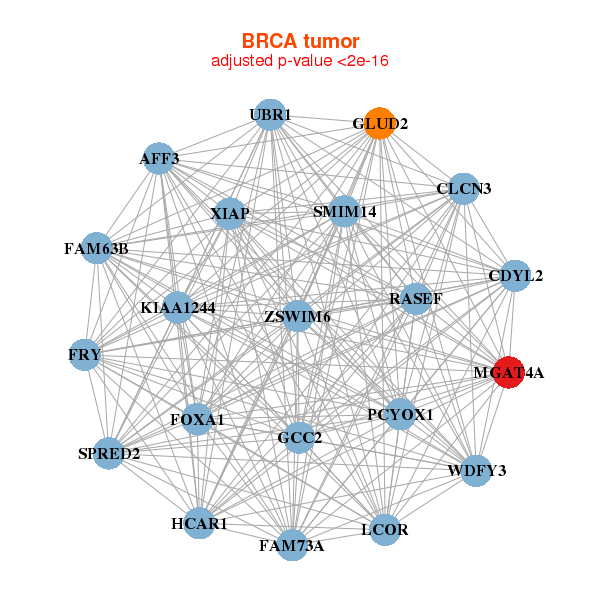
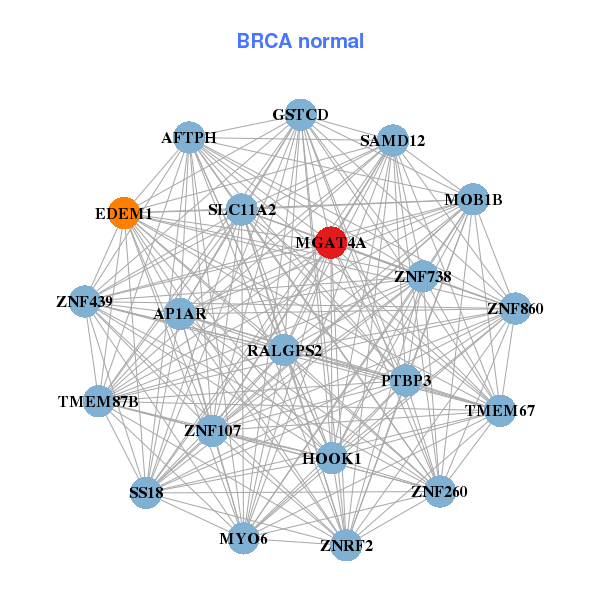
| * Co-Expression network figures were drawn using R package igraph. Only the top 20 genes with the highest correlations were shown. Red circle: input gene, orange circle: cell metabolism gene, sky circle: other gene |
: Open all plots for all cancer types
 |
|
| AFF3,SMIM14,CDYL2,CLCN3,FAM63B,FAM73A,FOXA1, FRY,GCC2,GLUD2,HCAR1,KIAA1244,LCOR,MGAT4A, PCYOX1,RASEF,SPRED2,UBR1,WDFY3,XIAP,ZSWIM6 | AFTPH,AP1AR,EDEM1,GSTCD,HOOK1,MGAT4A,MOB1B, MYO6,RALGPS2,PTBP3,SAMD12,SLC11A2,SS18,TMEM67, TMEM87B,ZNF107,ZNF260,ZNF439,ZNF738,ZNF860,ZNRF2 |
 |
|
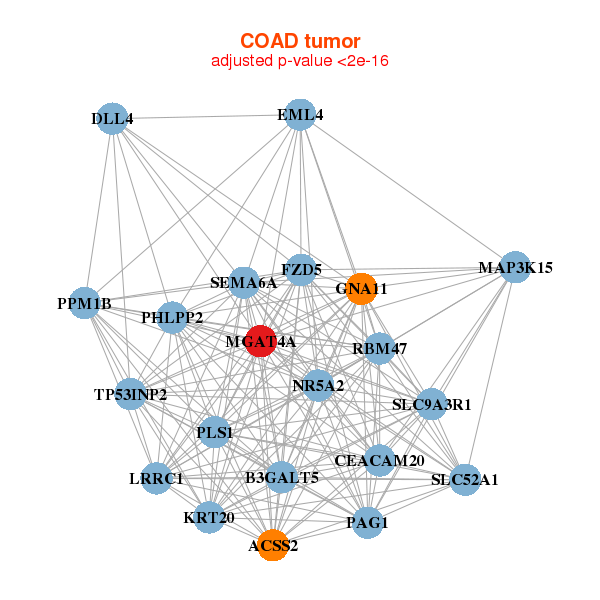
| ACSS2,B3GALT5,CEACAM20,DLL4,EML4,FZD5,GNA11, SLC52A1,KRT20,LRRC1,MAP3K15,MGAT4A,NR5A2,PAG1, PHLPP2,PLS1,PPM1B,RBM47,SEMA6A,SLC9A3R1,TP53INP2 | ACSL5,ANKS4B,ANO10,LINC00483,C1orf106,CXADR,DOLPP1, TMEM236,FMO4,HECTD3,KALRN,KIAA0247,LASP1,MGAT4A, MPP5,PHLPP2,PSEN1,PTPRJ,RETSAT,SLC41A2,TRIM36 |
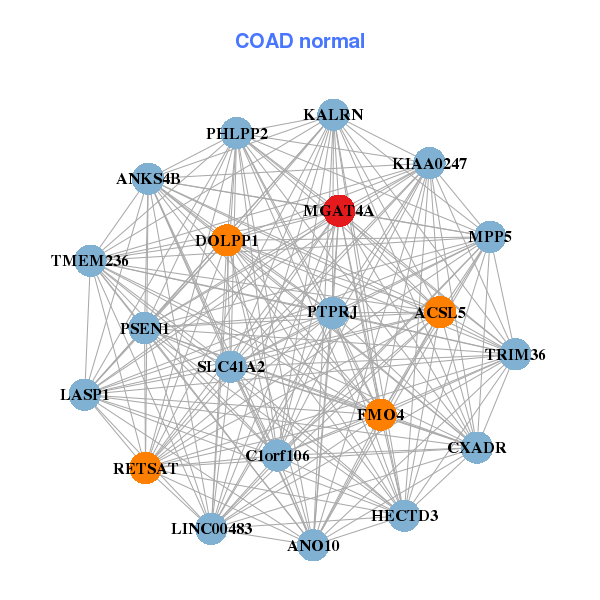
| * Co-Expression network figures were drawn using R package igraph. Only the top 20 genes with the highest correlations were shown. Red circle: input gene, orange circle: cell metabolism gene, sky circle: other gene |
: Open all plots for all cancer types
| Top |
: Open all interacting genes' information including KEGG pathway for all interacting genes from DAVID
| Top |
| Pharmacological Information for MGAT4A |
| There's no related Drug. |
| Top |
| Cross referenced IDs for MGAT4A |
| * We obtained these cross-references from Uniprot database. It covers 150 different DBs, 18 categories. http://www.uniprot.org/help/cross_references_section |
: Open all cross reference information
|
Copyright © 2016-Present - The Univsersity of Texas Health Science Center at Houston @ |