|
||||||||||||||||||||
| |
| Phenotypic Information (metabolism pathway, cancer, disease, phenome) |
| |
| |
| Gene-Gene Network Information: Co-Expression Network, Interacting Genes & KEGG |
| |
|


| Gene Summary for TUBA3D |
| Basic gene info. | Gene symbol | TUBA3D |
| Gene name | tubulin, alpha 3d | |
| Synonyms | H2-ALPHA | |
| Cytomap | UCSC genome browser: 2q21.1 | |
| Genomic location | chr2 :132233579-132240507 | |
| Type of gene | protein-coding | |
| RefGenes | NM_080386.3, | |
| Ensembl id | ENSG00000075886 | |
| Description | alpha-tubulin isotype H2-alphatubulin alpha-2 chaintubulin alpha-3C/D chain | |
| Modification date | 20141207 | |
| dbXrefs | HGNC : HGNC | |
| Ensembl : ENSG00000075886 | ||
| HPRD : 17085 | ||
| Vega : OTTHUMG00000153600 | ||
| Protein | UniProt: go to UniProt's Cross Reference DB Table | |
| Expression | CleanEX: HS_TUBA3D | |
| BioGPS: 113457 | ||
| Gene Expression Atlas: ENSG00000075886 | ||
| The Human Protein Atlas: ENSG00000075886 | ||
| Pathway | NCI Pathway Interaction Database: TUBA3D | |
| KEGG: TUBA3D | ||
| REACTOME: TUBA3D | ||
| ConsensusPathDB | ||
| Pathway Commons: TUBA3D | ||
| Metabolism | MetaCyc: TUBA3D | |
| HUMANCyc: TUBA3D | ||
| Regulation | Ensembl's Regulation: ENSG00000075886 | |
| miRBase: chr2 :132,233,579-132,240,507 | ||
| TargetScan: NM_080386 | ||
| cisRED: ENSG00000075886 | ||
| Context | iHOP: TUBA3D | |
| cancer metabolism search in PubMed: TUBA3D | ||
| UCL Cancer Institute: TUBA3D | ||
| Assigned class in ccmGDB | C | |
| Top |
| Phenotypic Information for TUBA3D(metabolism pathway, cancer, disease, phenome) |
| Cancer | CGAP: TUBA3D |
| Familial Cancer Database: TUBA3D | |
| * This gene is included in those cancer gene databases. |
|
|
|
|
|
| . | ||||||||||||||
Oncogene 1 | Significant driver gene in | |||||||||||||||||||
| cf) number; DB name 1 Oncogene; http://nar.oxfordjournals.org/content/35/suppl_1/D721.long, 2 Tumor Suppressor gene; https://bioinfo.uth.edu/TSGene/, 3 Cancer Gene Census; http://www.nature.com/nrc/journal/v4/n3/abs/nrc1299.html, 4 CancerGenes; http://nar.oxfordjournals.org/content/35/suppl_1/D721.long, 5 Network of Cancer Gene; http://ncg.kcl.ac.uk/index.php, 1Therapeutic Vulnerabilities in Cancer; http://cbio.mskcc.org/cancergenomics/statius/ |
| REACTOME_METABOLISM_OF_PROTEINS | |
| OMIM | |
| Orphanet | |
| Disease | KEGG Disease: TUBA3D |
| MedGen: TUBA3D (Human Medical Genetics with Condition) | |
| ClinVar: TUBA3D | |
| Phenotype | MGI: TUBA3D (International Mouse Phenotyping Consortium) |
| PhenomicDB: TUBA3D | |
| Mutations for TUBA3D |
| * Under tables are showing count per each tissue to give us broad intuition about tissue specific mutation patterns.You can go to the detailed page for each mutation database's web site. |
| There's no structural variation information in COSMIC data for this gene. |
| * From mRNA Sanger sequences, Chitars2.0 arranged chimeric transcripts. This table shows TUBA3D related fusion information. |
| ID | Head Gene | Tail Gene | Accession | Gene_a | qStart_a | qEnd_a | Chromosome_a | tStart_a | tEnd_a | Gene_a | qStart_a | qEnd_a | Chromosome_a | tStart_a | tEnd_a |
| Top |
| There's no copy number variation information in COSMIC data for this gene. |
| Top |
|
 |
| Top |
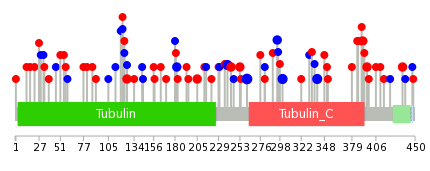
| Stat. for Non-Synonymous SNVs (# total SNVs=38) | (# total SNVs=30) |
 |  |
(# total SNVs=1) | (# total SNVs=0) |
 |
| Top |
| * When you move the cursor on each content, you can see more deailed mutation information on the Tooltip. Those are primary_site,primary_histology,mutation(aa),pubmedID. |
| GRCh37 position | Mutation(aa) | Unique sampleID count |
| chr2:132238049-132238049 | p.P261P | 4 |
| chr2:132238169-132238169 | p.Q301Q | 3 |
| chr2:132238286-132238286 | p.T340T | 3 |
| chr2:132237983-132237983 | p.T239T | 3 |
| chr2:132238024-132238024 | p.T253M | 2 |
| chr2:132237879-132237879 | p.D205N | 2 |
| chr2:132240374-132240374 | p.G436S | 2 |
| chr2:132237015-132237015 | p.R121W | 2 |
| chr2:132240240-132240240 | p.L391Q | 2 |
| chr2:132240254-132240254 | p.D396N | 2 |
| Top |
|
 |
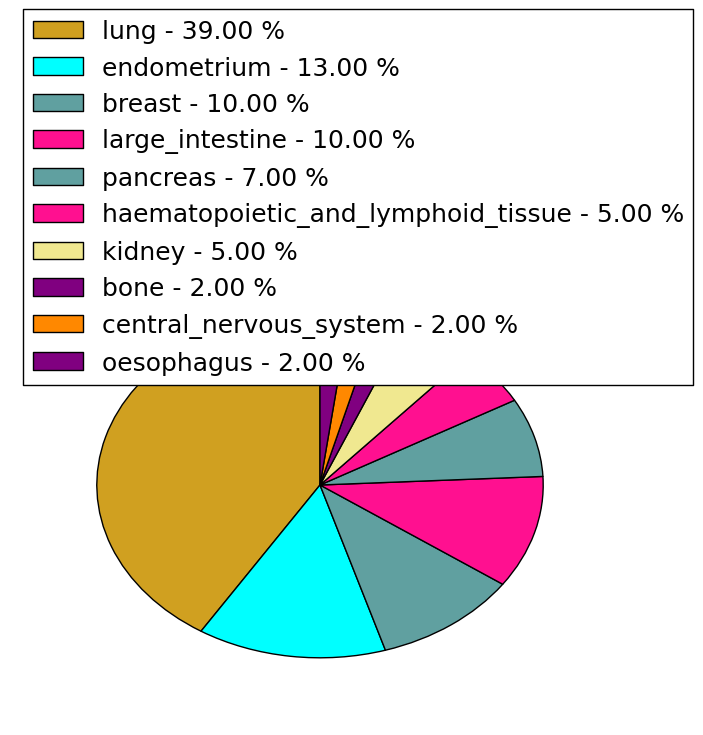
| Point Mutation/ Tissue ID | 1 | 2 | 3 | 4 | 5 | 6 | 7 | 8 | 9 | 10 | 11 | 12 | 13 | 14 | 15 | 16 | 17 | 18 | 19 | 20 |
| # sample | 2 | 1 | 4 | 3 | 2 | 5 | 1 | 16 | 3 | 1 | 10 | 7 | 1 | 7 | ||||||
| # mutation | 2 | 1 | 3 | 3 | 2 | 4 | 1 | 21 | 3 | 1 | 10 | 7 | 1 | 7 | ||||||
| nonsynonymous SNV | 2 | 1 | 3 | 1 | 2 | 2 | 12 | 2 | 10 | 5 | 5 | |||||||||
| synonymous SNV | 2 | 2 | 1 | 9 | 1 | 1 | 2 | 1 | 2 |
| cf) Tissue ID; Tissue type (1; BLCA[Bladder Urothelial Carcinoma], 2; BRCA[Breast invasive carcinoma], 3; CESC[Cervical squamous cell carcinoma and endocervical adenocarcinoma], 4; COAD[Colon adenocarcinoma], 5; GBM[Glioblastoma multiforme], 6; Glioma Low Grade, 7; HNSC[Head and Neck squamous cell carcinoma], 8; KICH[Kidney Chromophobe], 9; KIRC[Kidney renal clear cell carcinoma], 10; KIRP[Kidney renal papillary cell carcinoma], 11; LAML[Acute Myeloid Leukemia], 12; LUAD[Lung adenocarcinoma], 13; LUSC[Lung squamous cell carcinoma], 14; OV[Ovarian serous cystadenocarcinoma ], 15; PAAD[Pancreatic adenocarcinoma], 16; PRAD[Prostate adenocarcinoma], 17; SKCM[Skin Cutaneous Melanoma], 18:STAD[Stomach adenocarcinoma], 19:THCA[Thyroid carcinoma], 20:UCEC[Uterine Corpus Endometrial Carcinoma]) |
| Top |
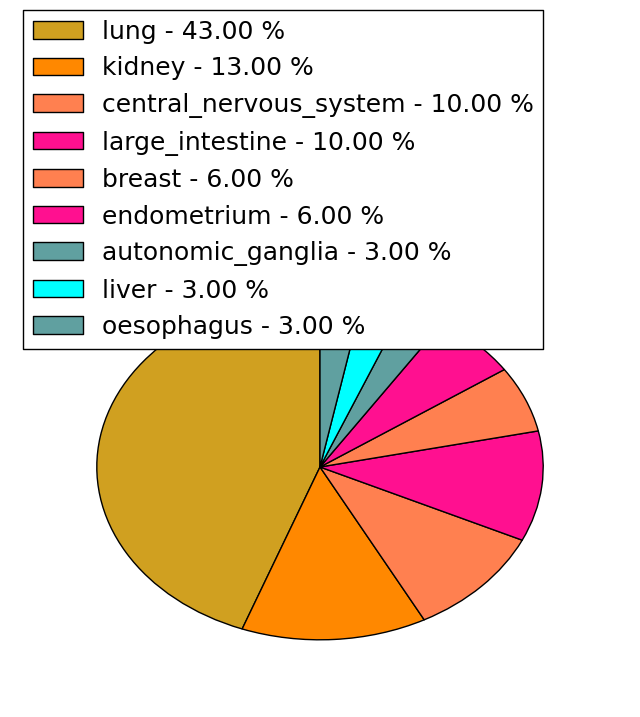
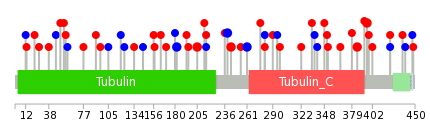
| * We represented just top 10 SNVs. When you move the cursor on each content, you can see more deailed mutation information on the Tooltip. Those are primary_site, primary_histology, mutation(aa), pubmedID. |
| Genomic Position | Mutation(aa) | Unique sampleID count |
| chr2:132237994 | p.T239T | 2 |
| chr2:132237812 | p.R243Q | 2 |
| chr2:132238049 | p.P261P | 2 |
| chr2:132237879 | p.A385V | 2 |
| chr2:132240222 | p.D396N | 2 |
| chr2:132240254 | p.V182V | 2 |
| chr2:132237983 | p.D205N | 2 |
| chr2:132238267 | p.S236P | 1 |
| chr2:132236883 | p.F351Y | 1 |
| chr2:132240260 | p.L119L | 1 |
| * Copy number data were extracted from TCGA using R package TCGA-Assembler. The URLs of all public data files on TCGA DCC data server were gathered on Jan-05-2015. Function ProcessCNAData in TCGA-Assembler package was used to obtain gene-level copy number value which is calculated as the average copy number of the genomic region of a gene. |
 |
| cf) Tissue ID[Tissue type]: BLCA[Bladder Urothelial Carcinoma], BRCA[Breast invasive carcinoma], CESC[Cervical squamous cell carcinoma and endocervical adenocarcinoma], COAD[Colon adenocarcinoma], GBM[Glioblastoma multiforme], Glioma Low Grade, HNSC[Head and Neck squamous cell carcinoma], KICH[Kidney Chromophobe], KIRC[Kidney renal clear cell carcinoma], KIRP[Kidney renal papillary cell carcinoma], LAML[Acute Myeloid Leukemia], LUAD[Lung adenocarcinoma], LUSC[Lung squamous cell carcinoma], OV[Ovarian serous cystadenocarcinoma ], PAAD[Pancreatic adenocarcinoma], PRAD[Prostate adenocarcinoma], SKCM[Skin Cutaneous Melanoma], STAD[Stomach adenocarcinoma], THCA[Thyroid carcinoma], UCEC[Uterine Corpus Endometrial Carcinoma] |
| Top |
| Gene Expression for TUBA3D |
| * CCLE gene expression data were extracted from CCLE_Expression_Entrez_2012-10-18.res: Gene-centric RMA-normalized mRNA expression data. |
 |
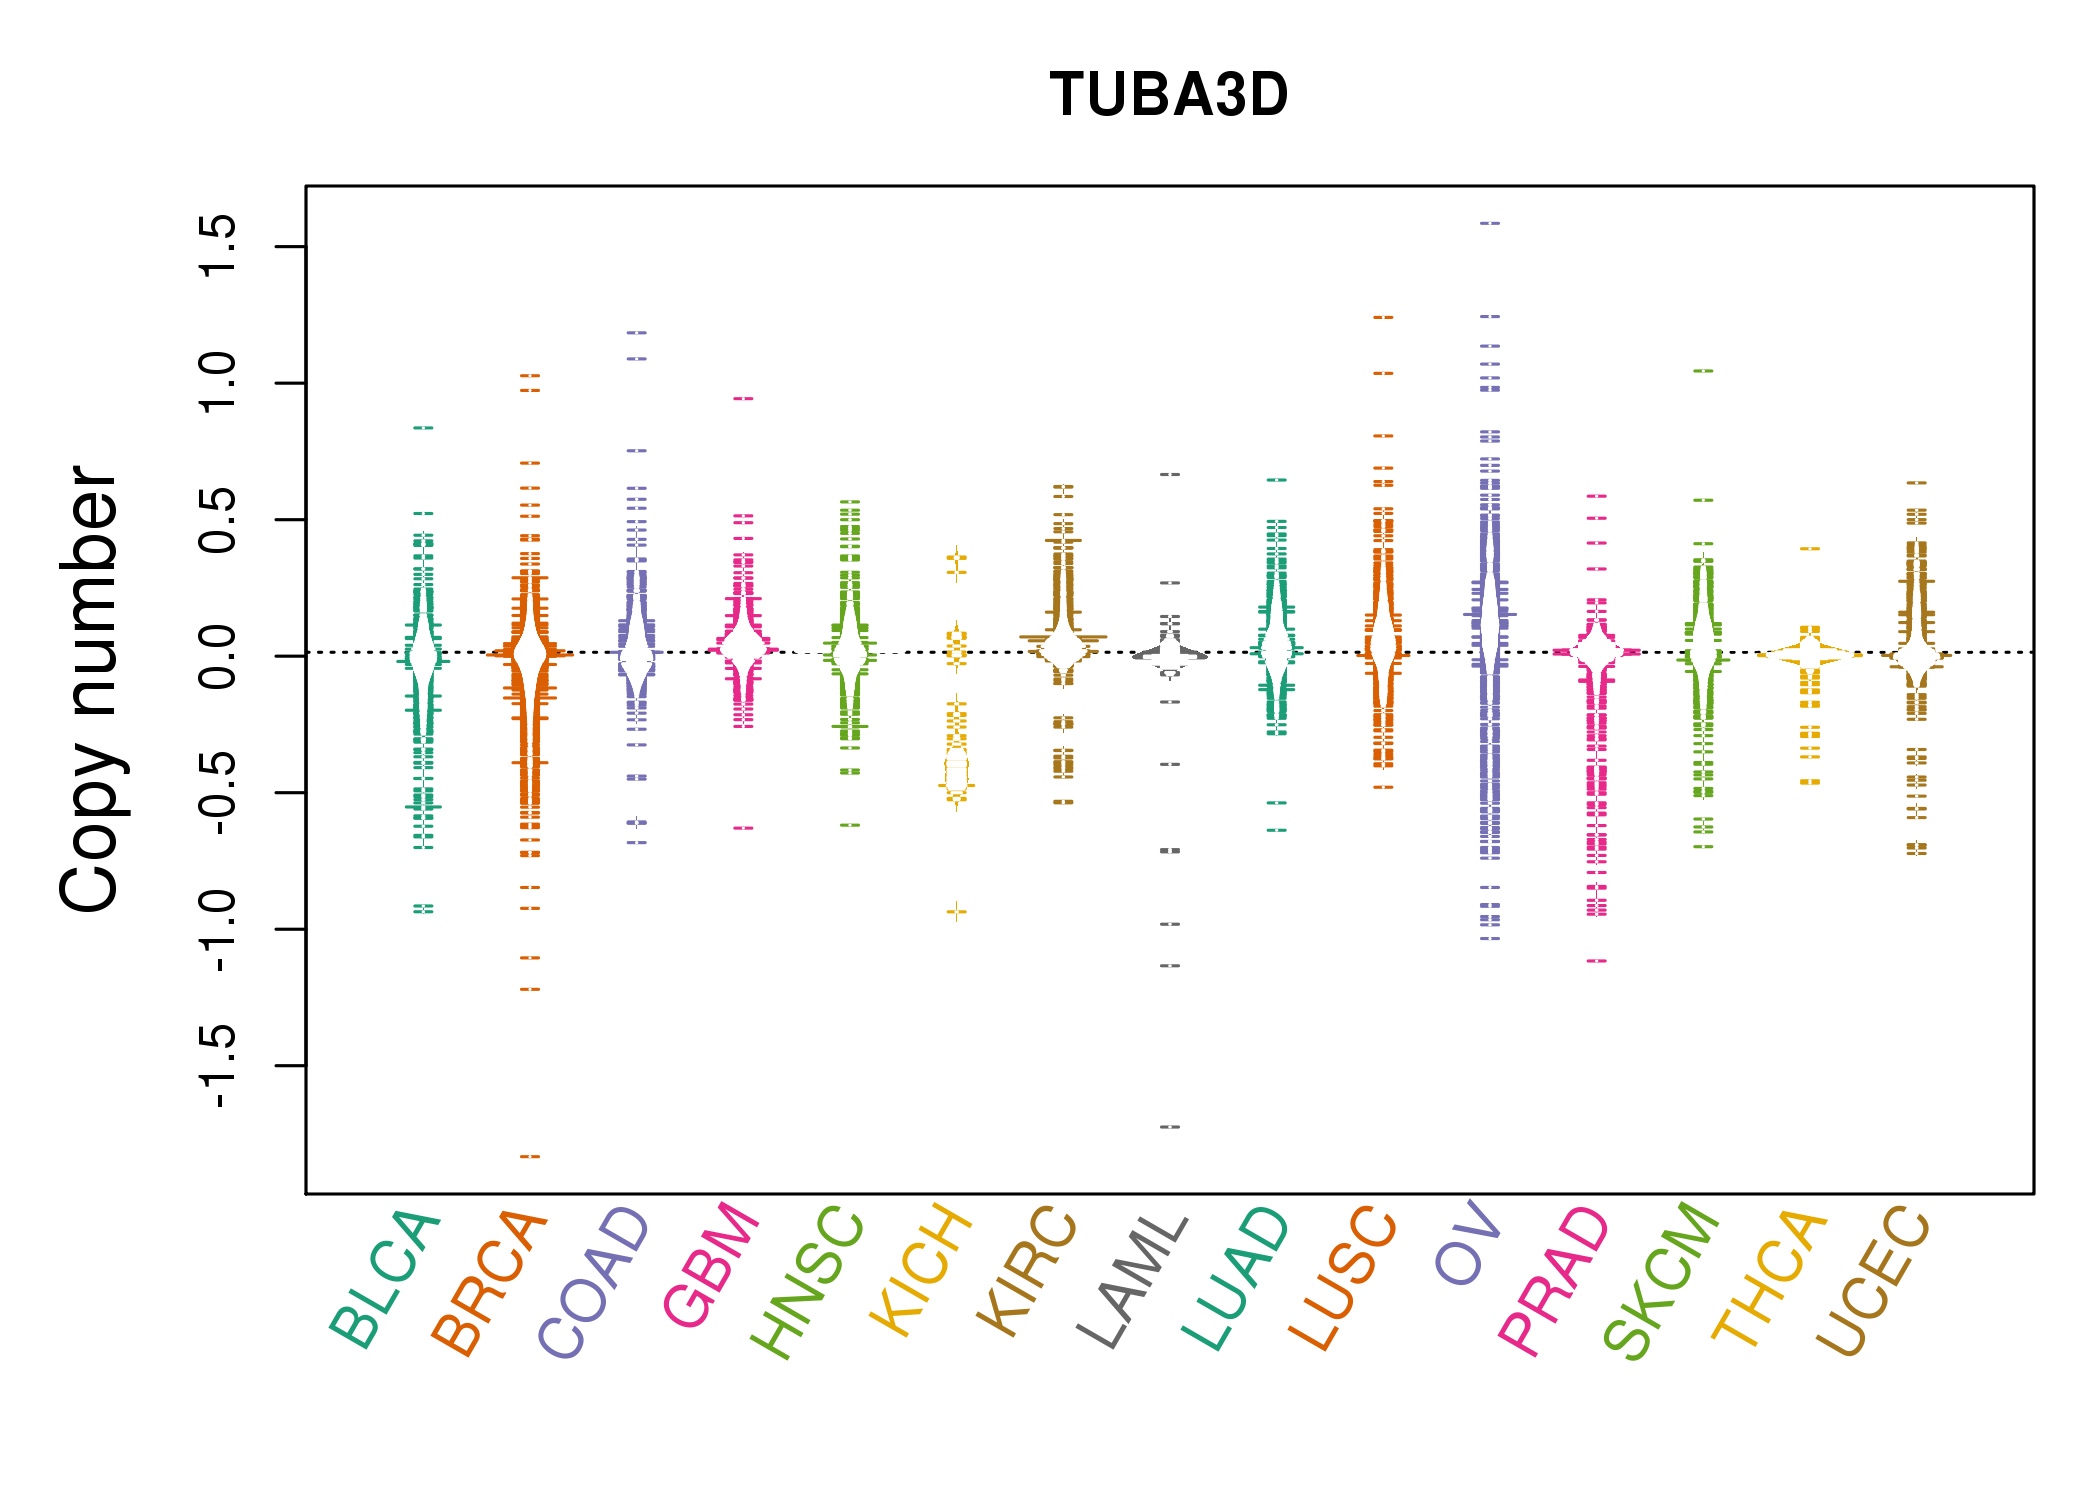
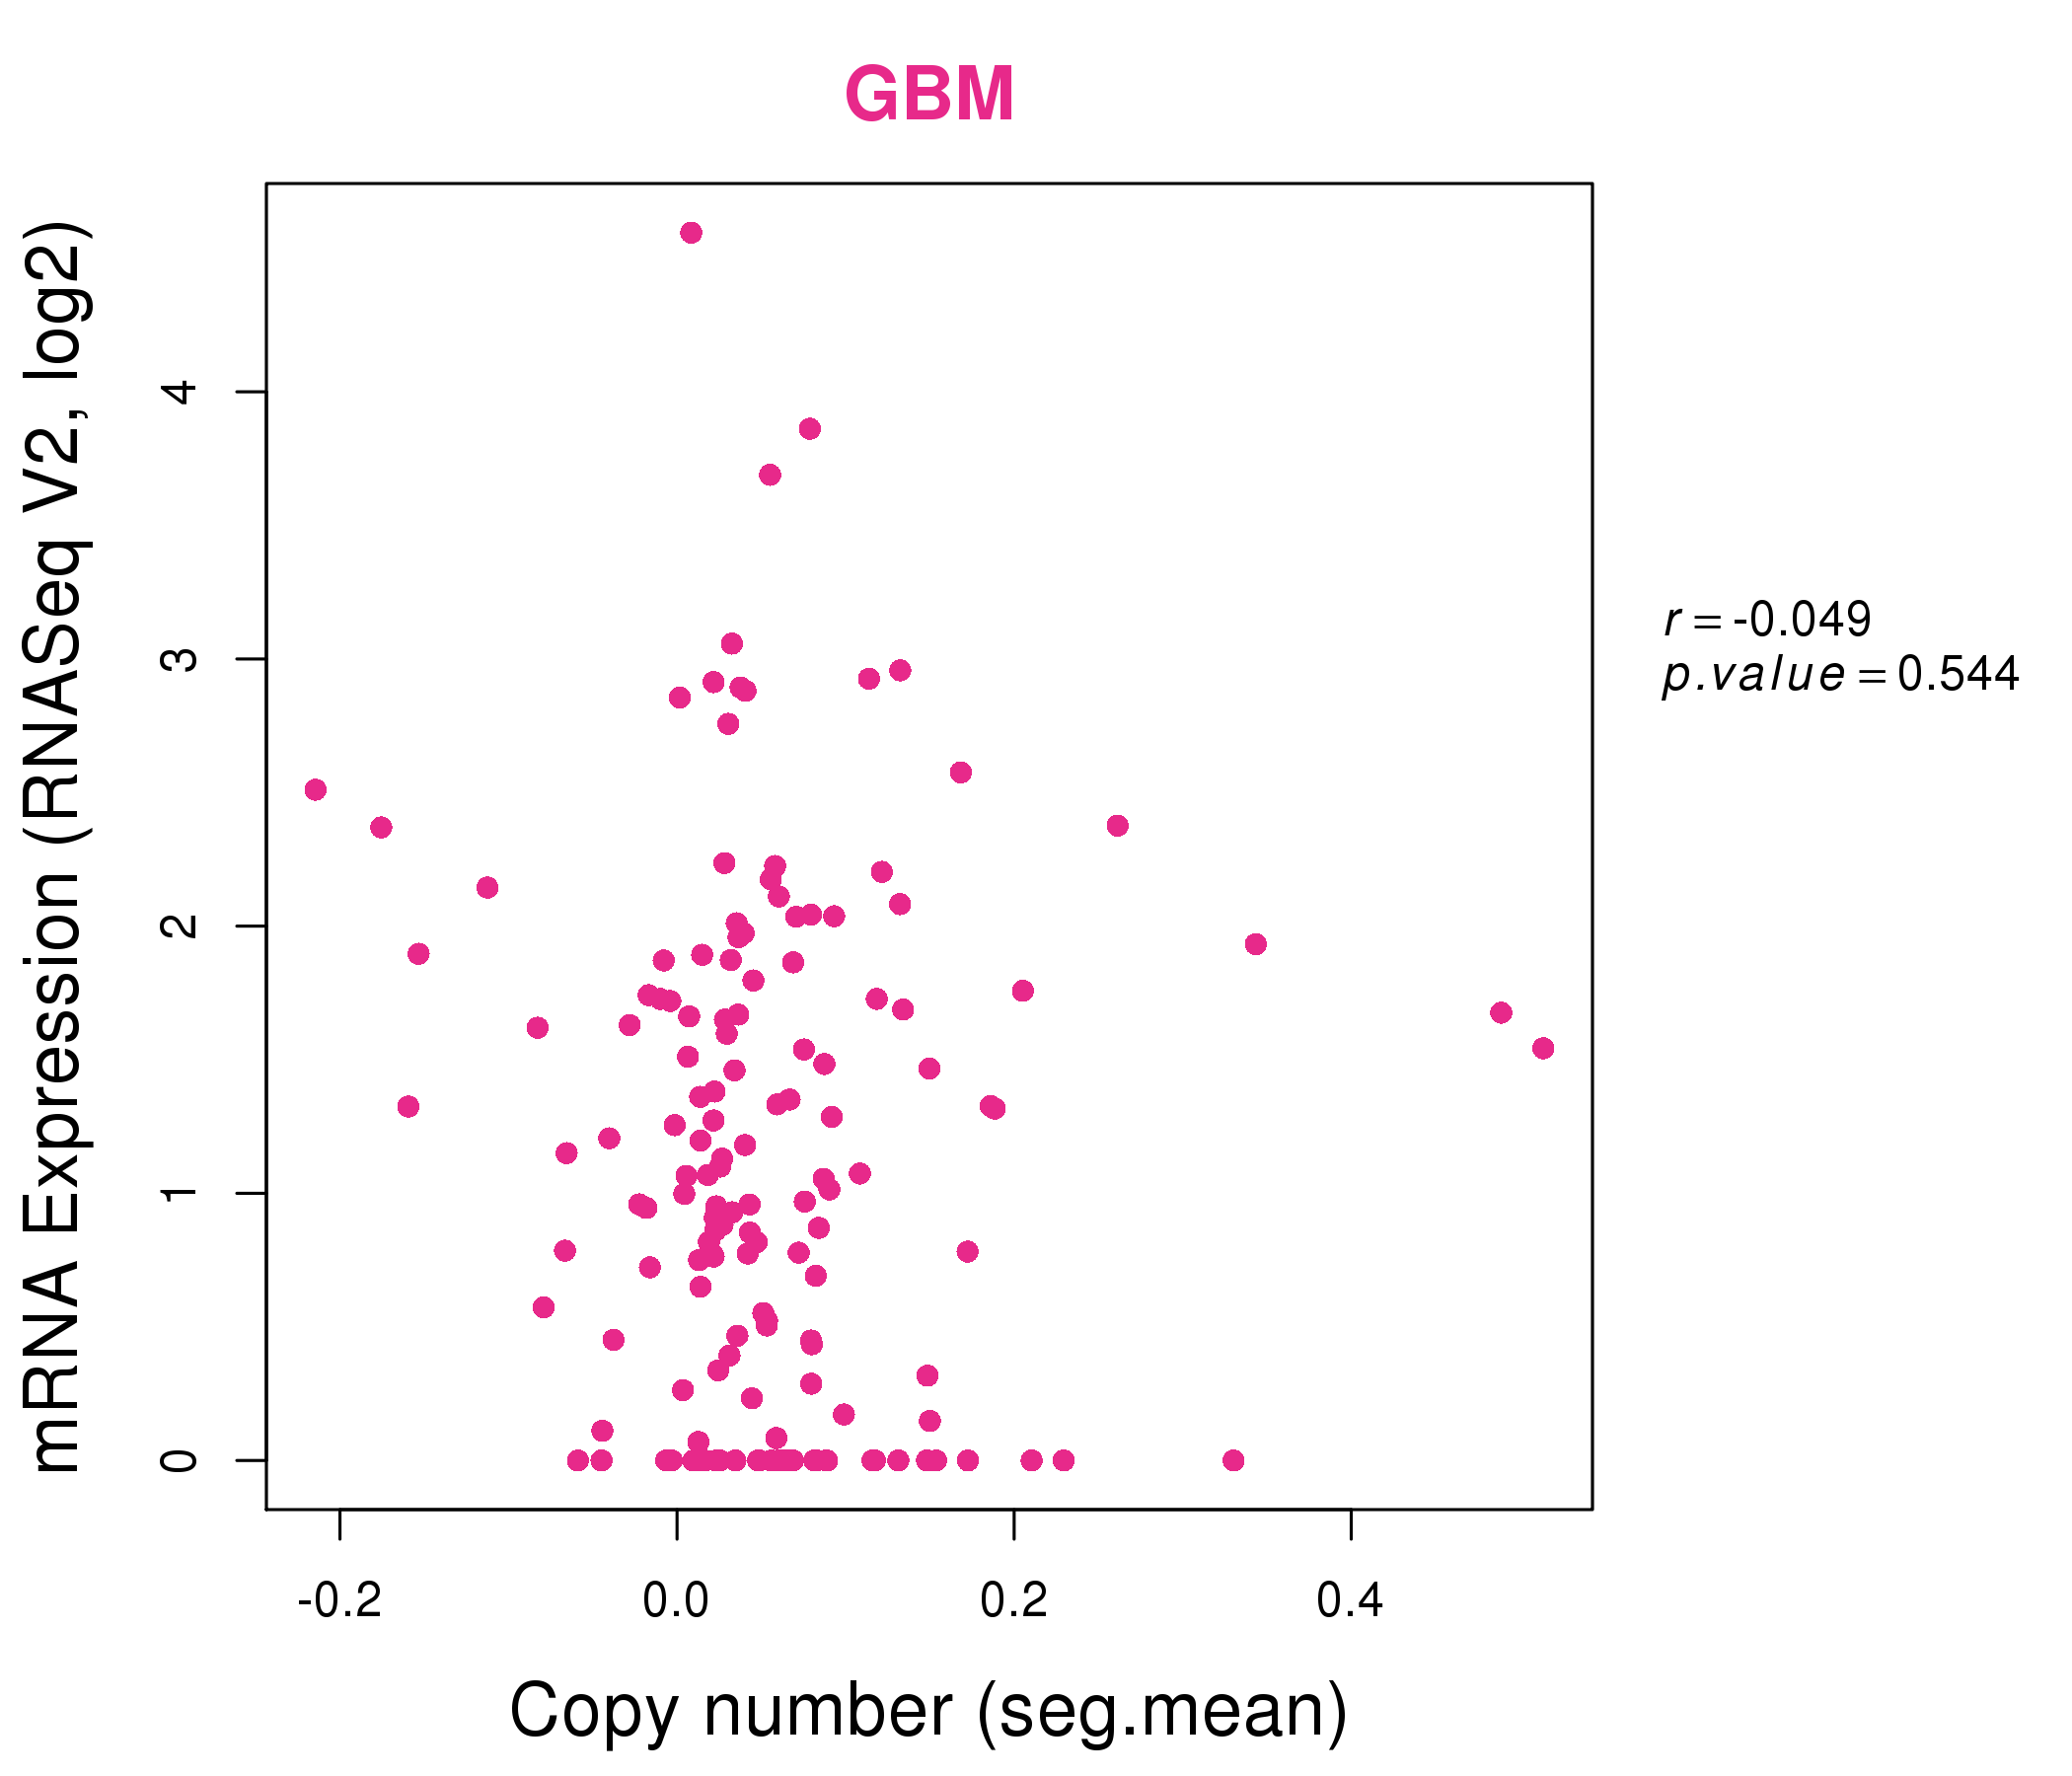
| * Normalized gene expression data of RNASeqV2 was extracted from TCGA using R package TCGA-Assembler. The URLs of all public data files on TCGA DCC data server were gathered at Jan-05-2015. Only eight cancer types have enough normal control samples for differential expression analysis. (t test, adjusted p<0.05 (using Benjamini-Hochberg FDR)) |
 |
| Top |
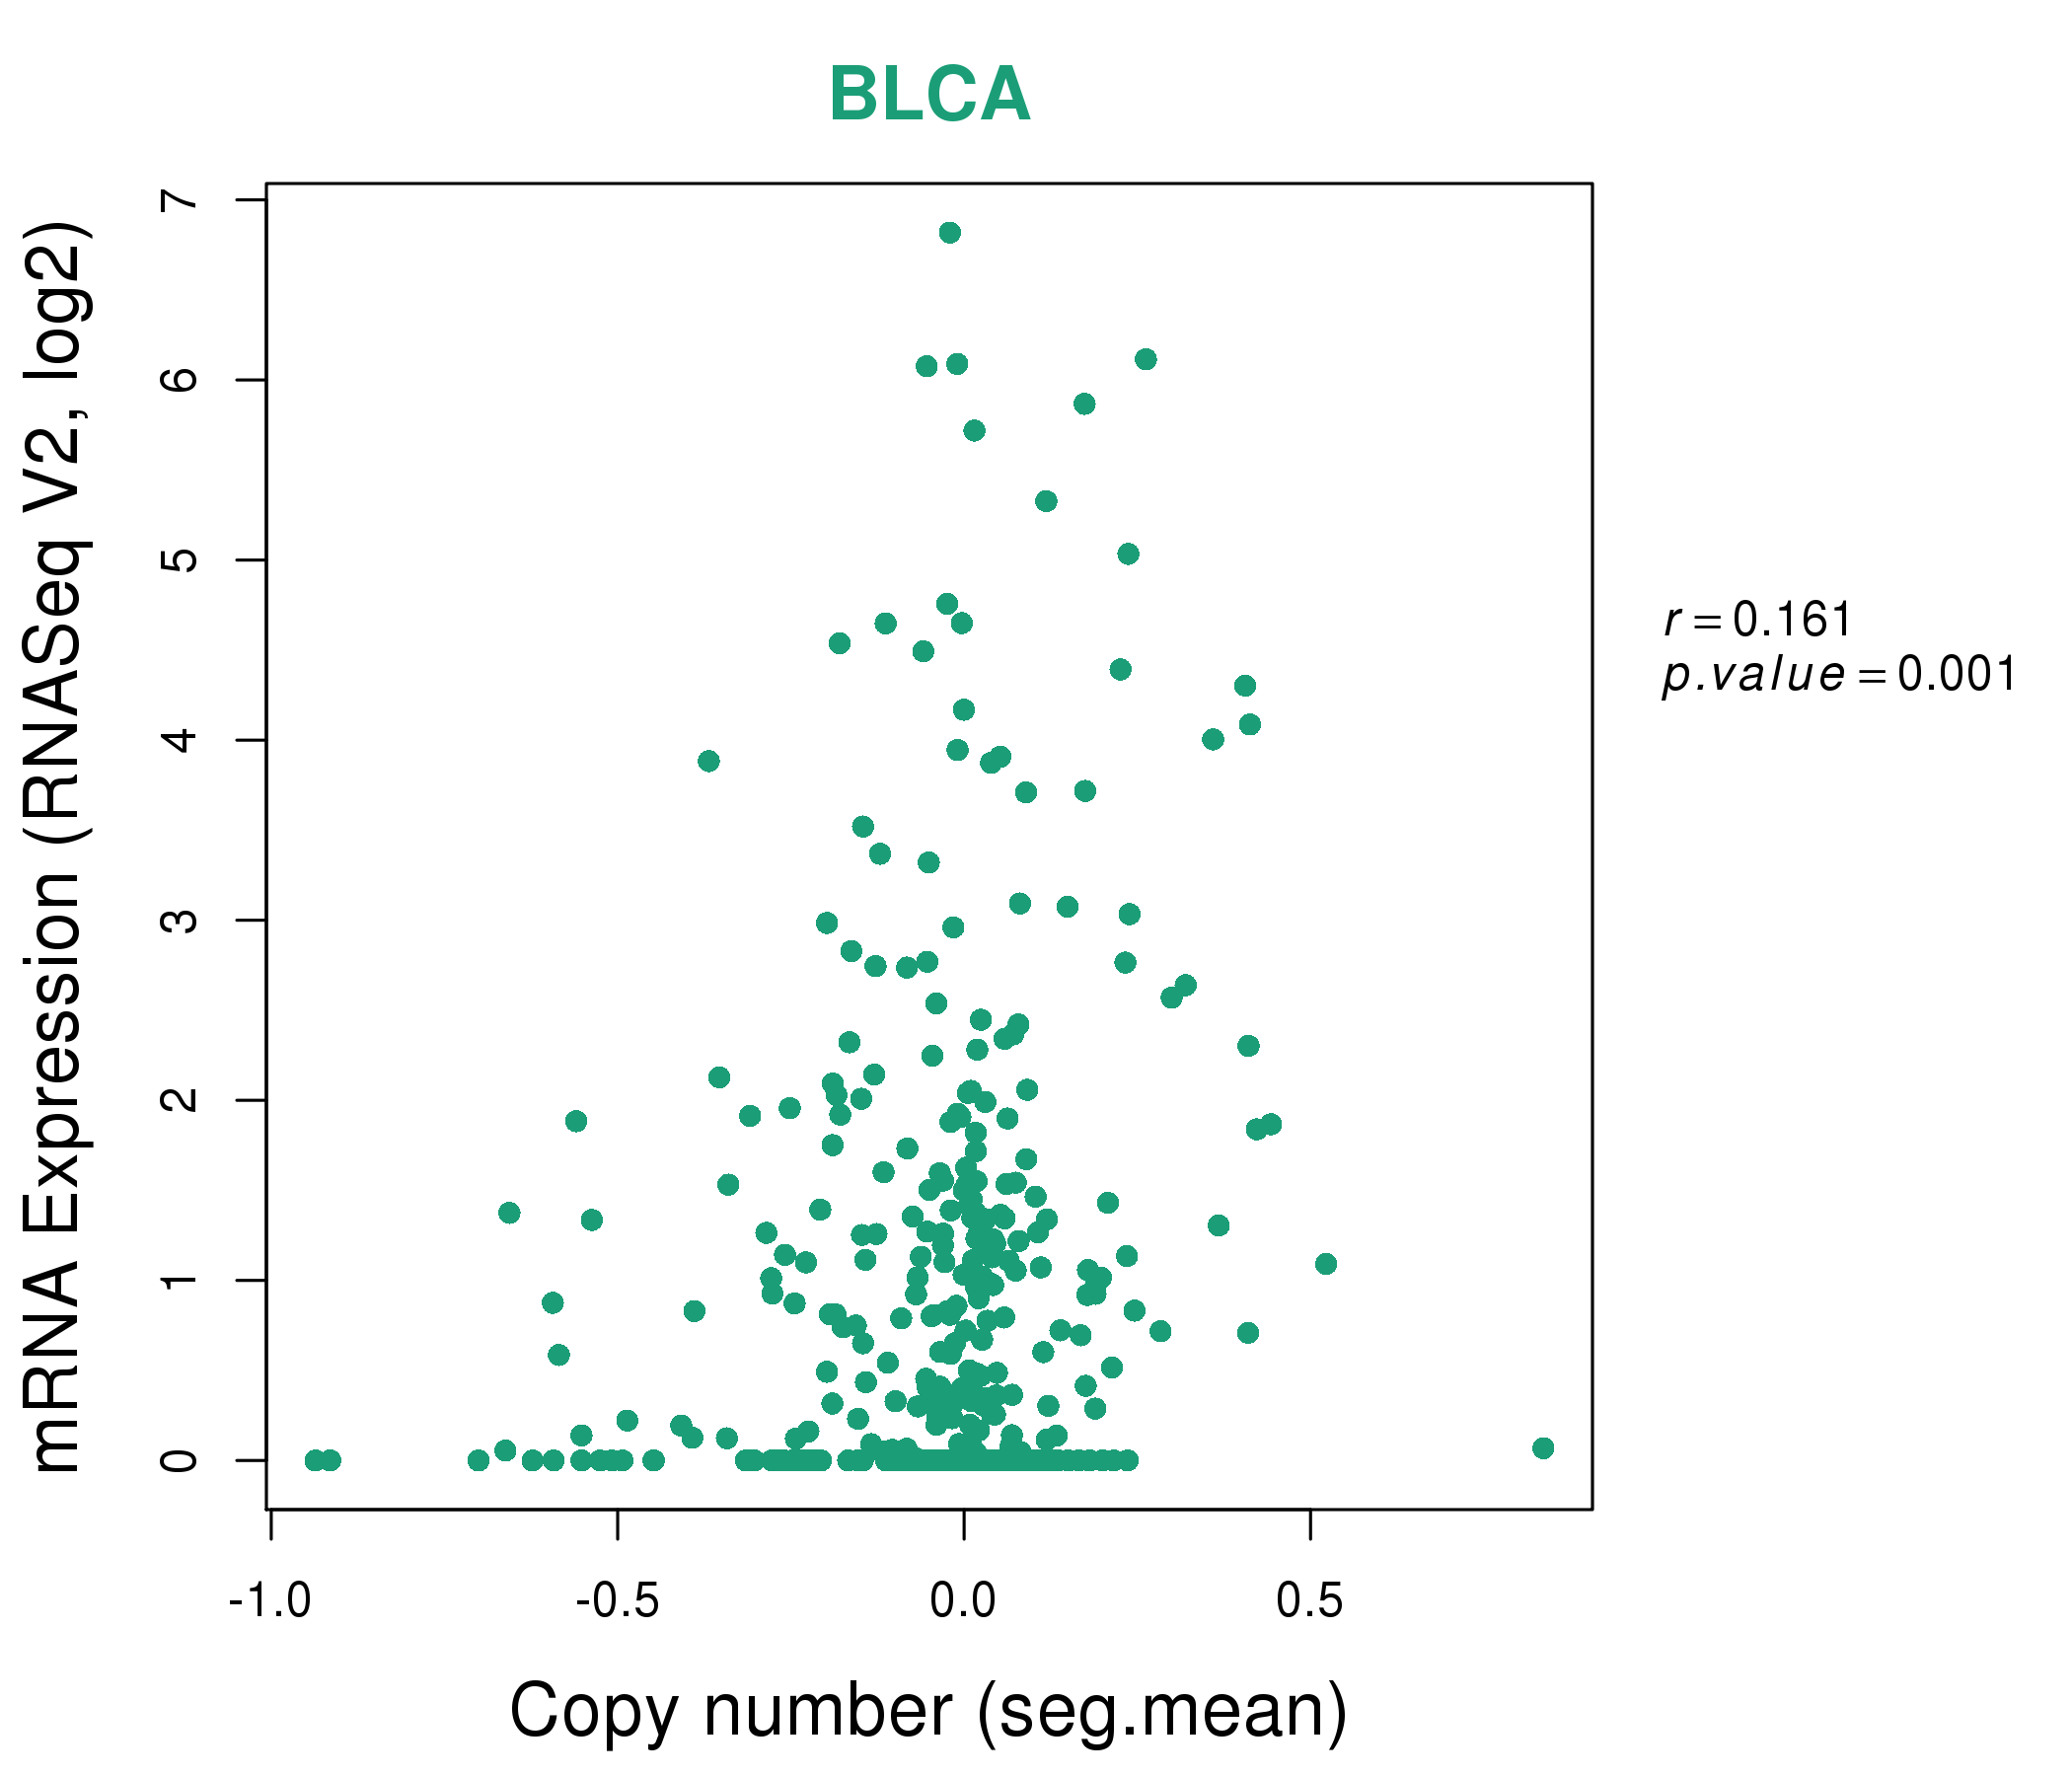
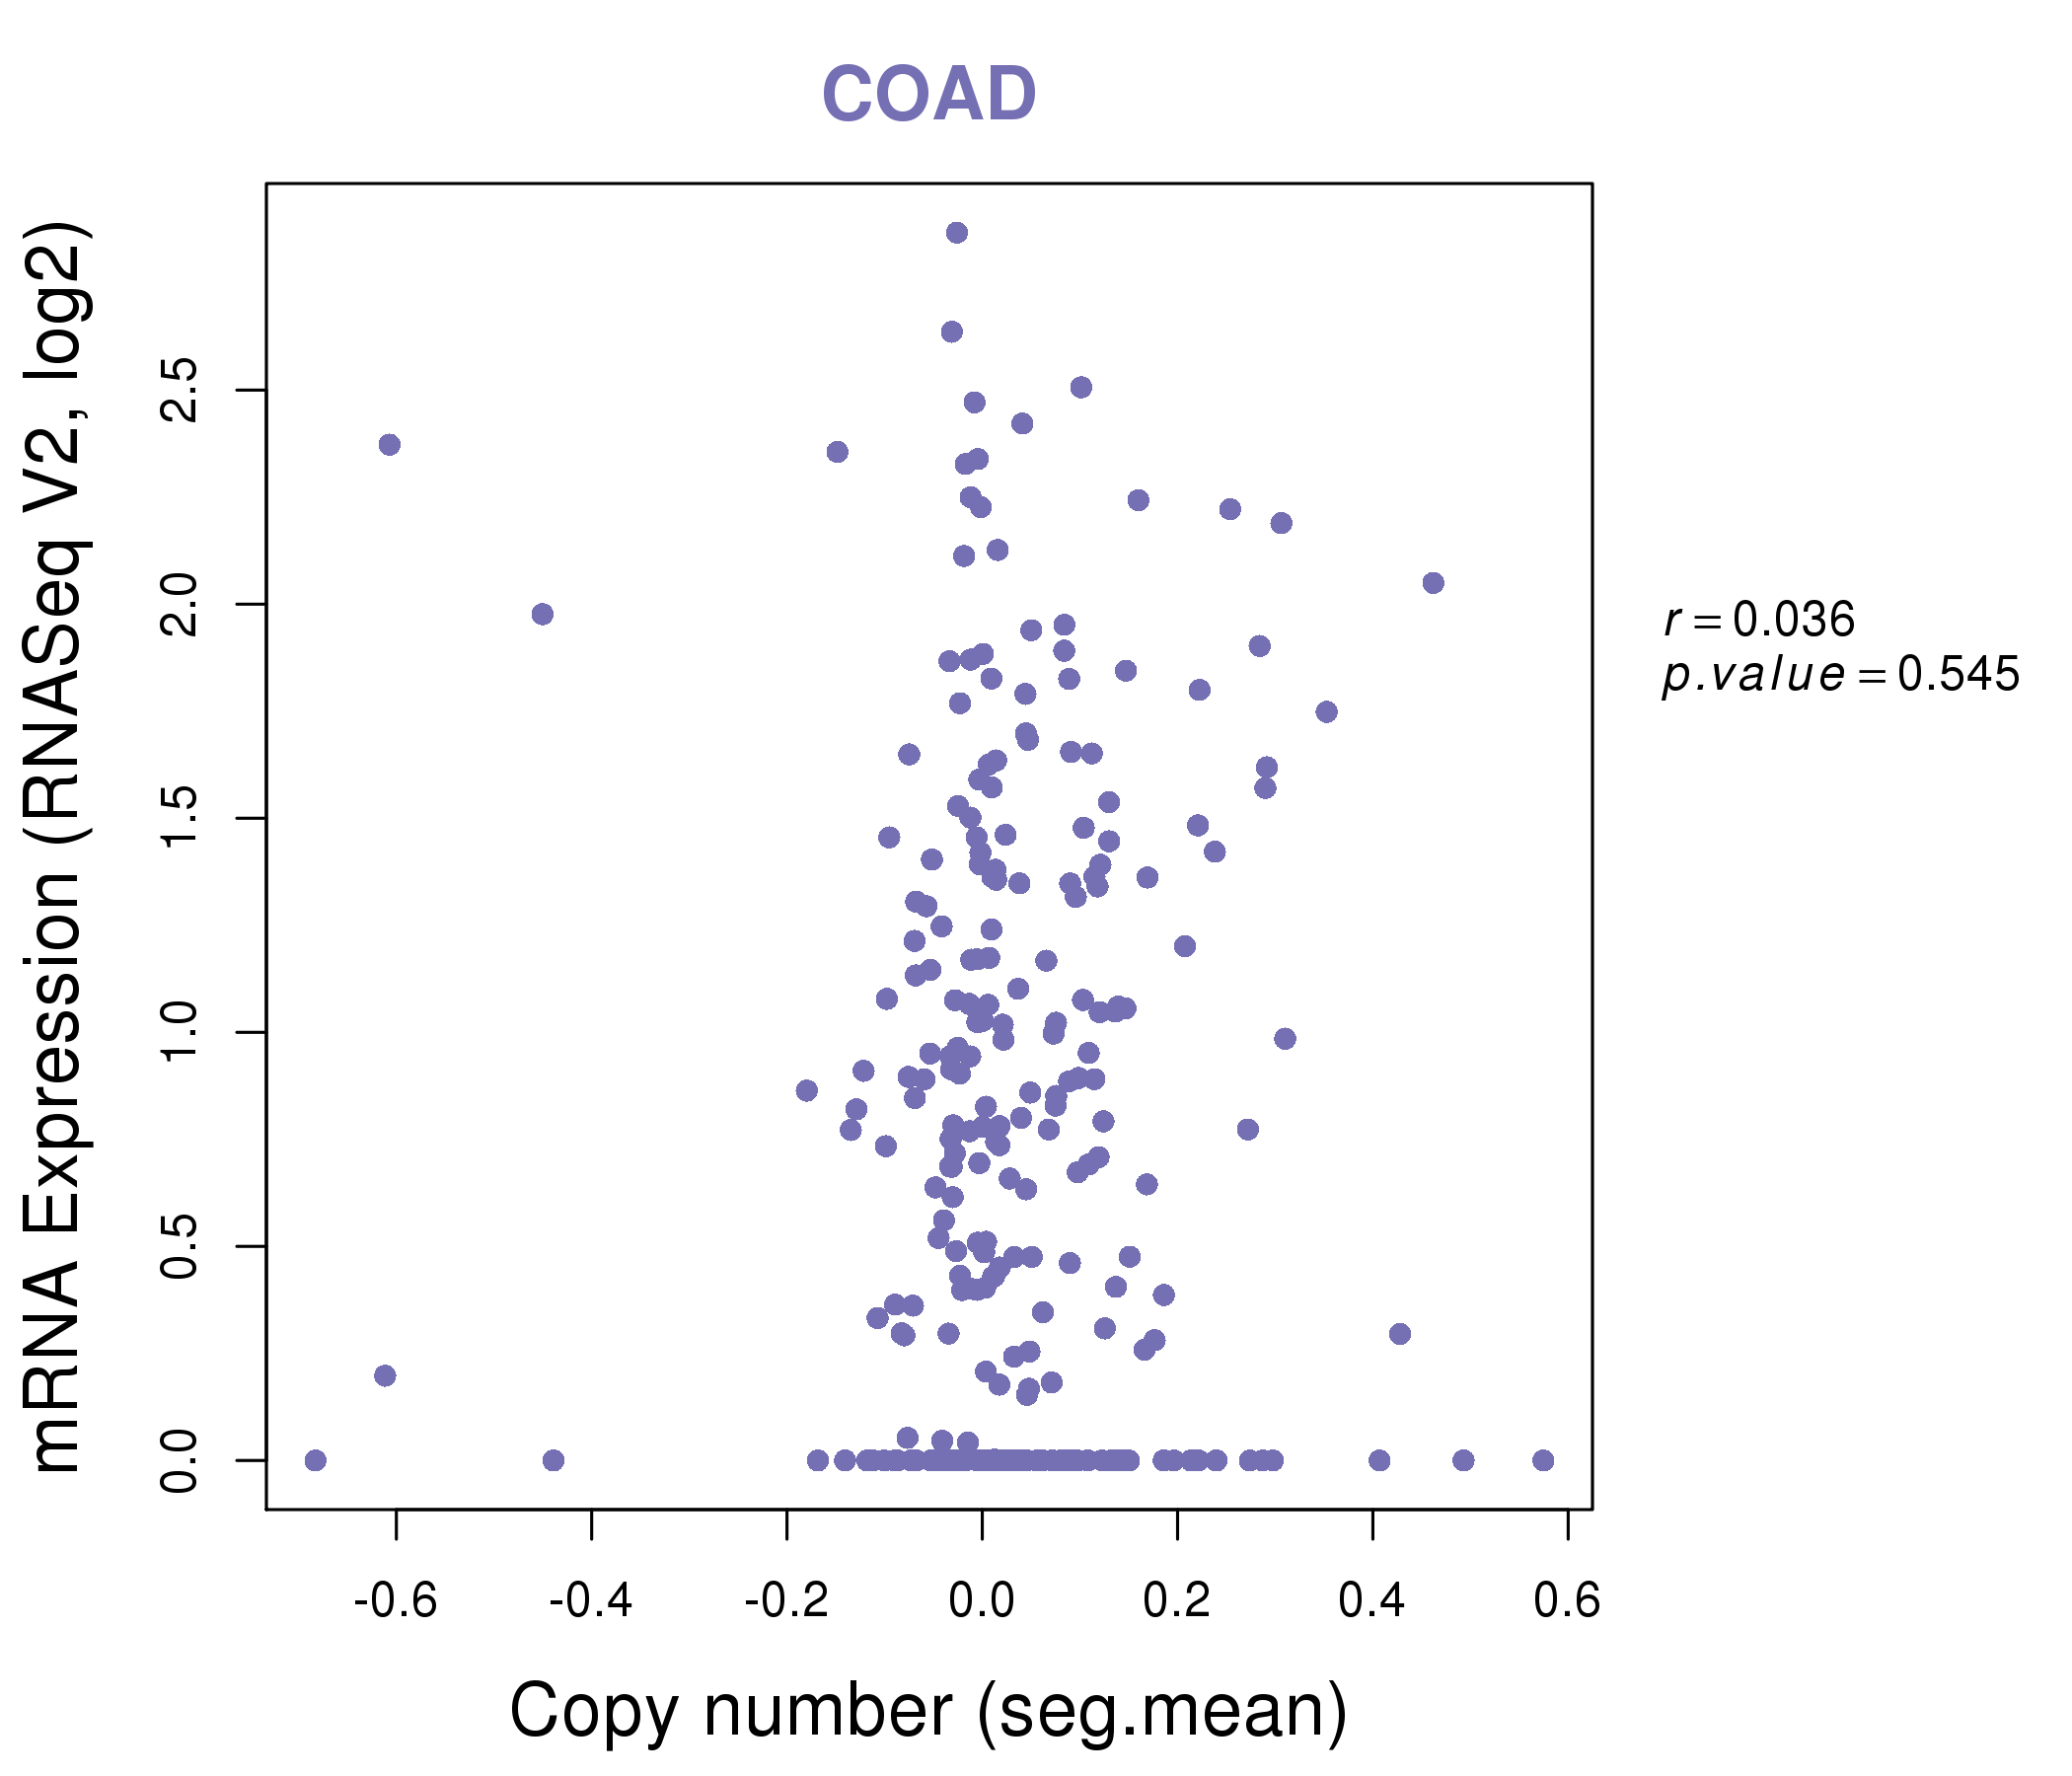
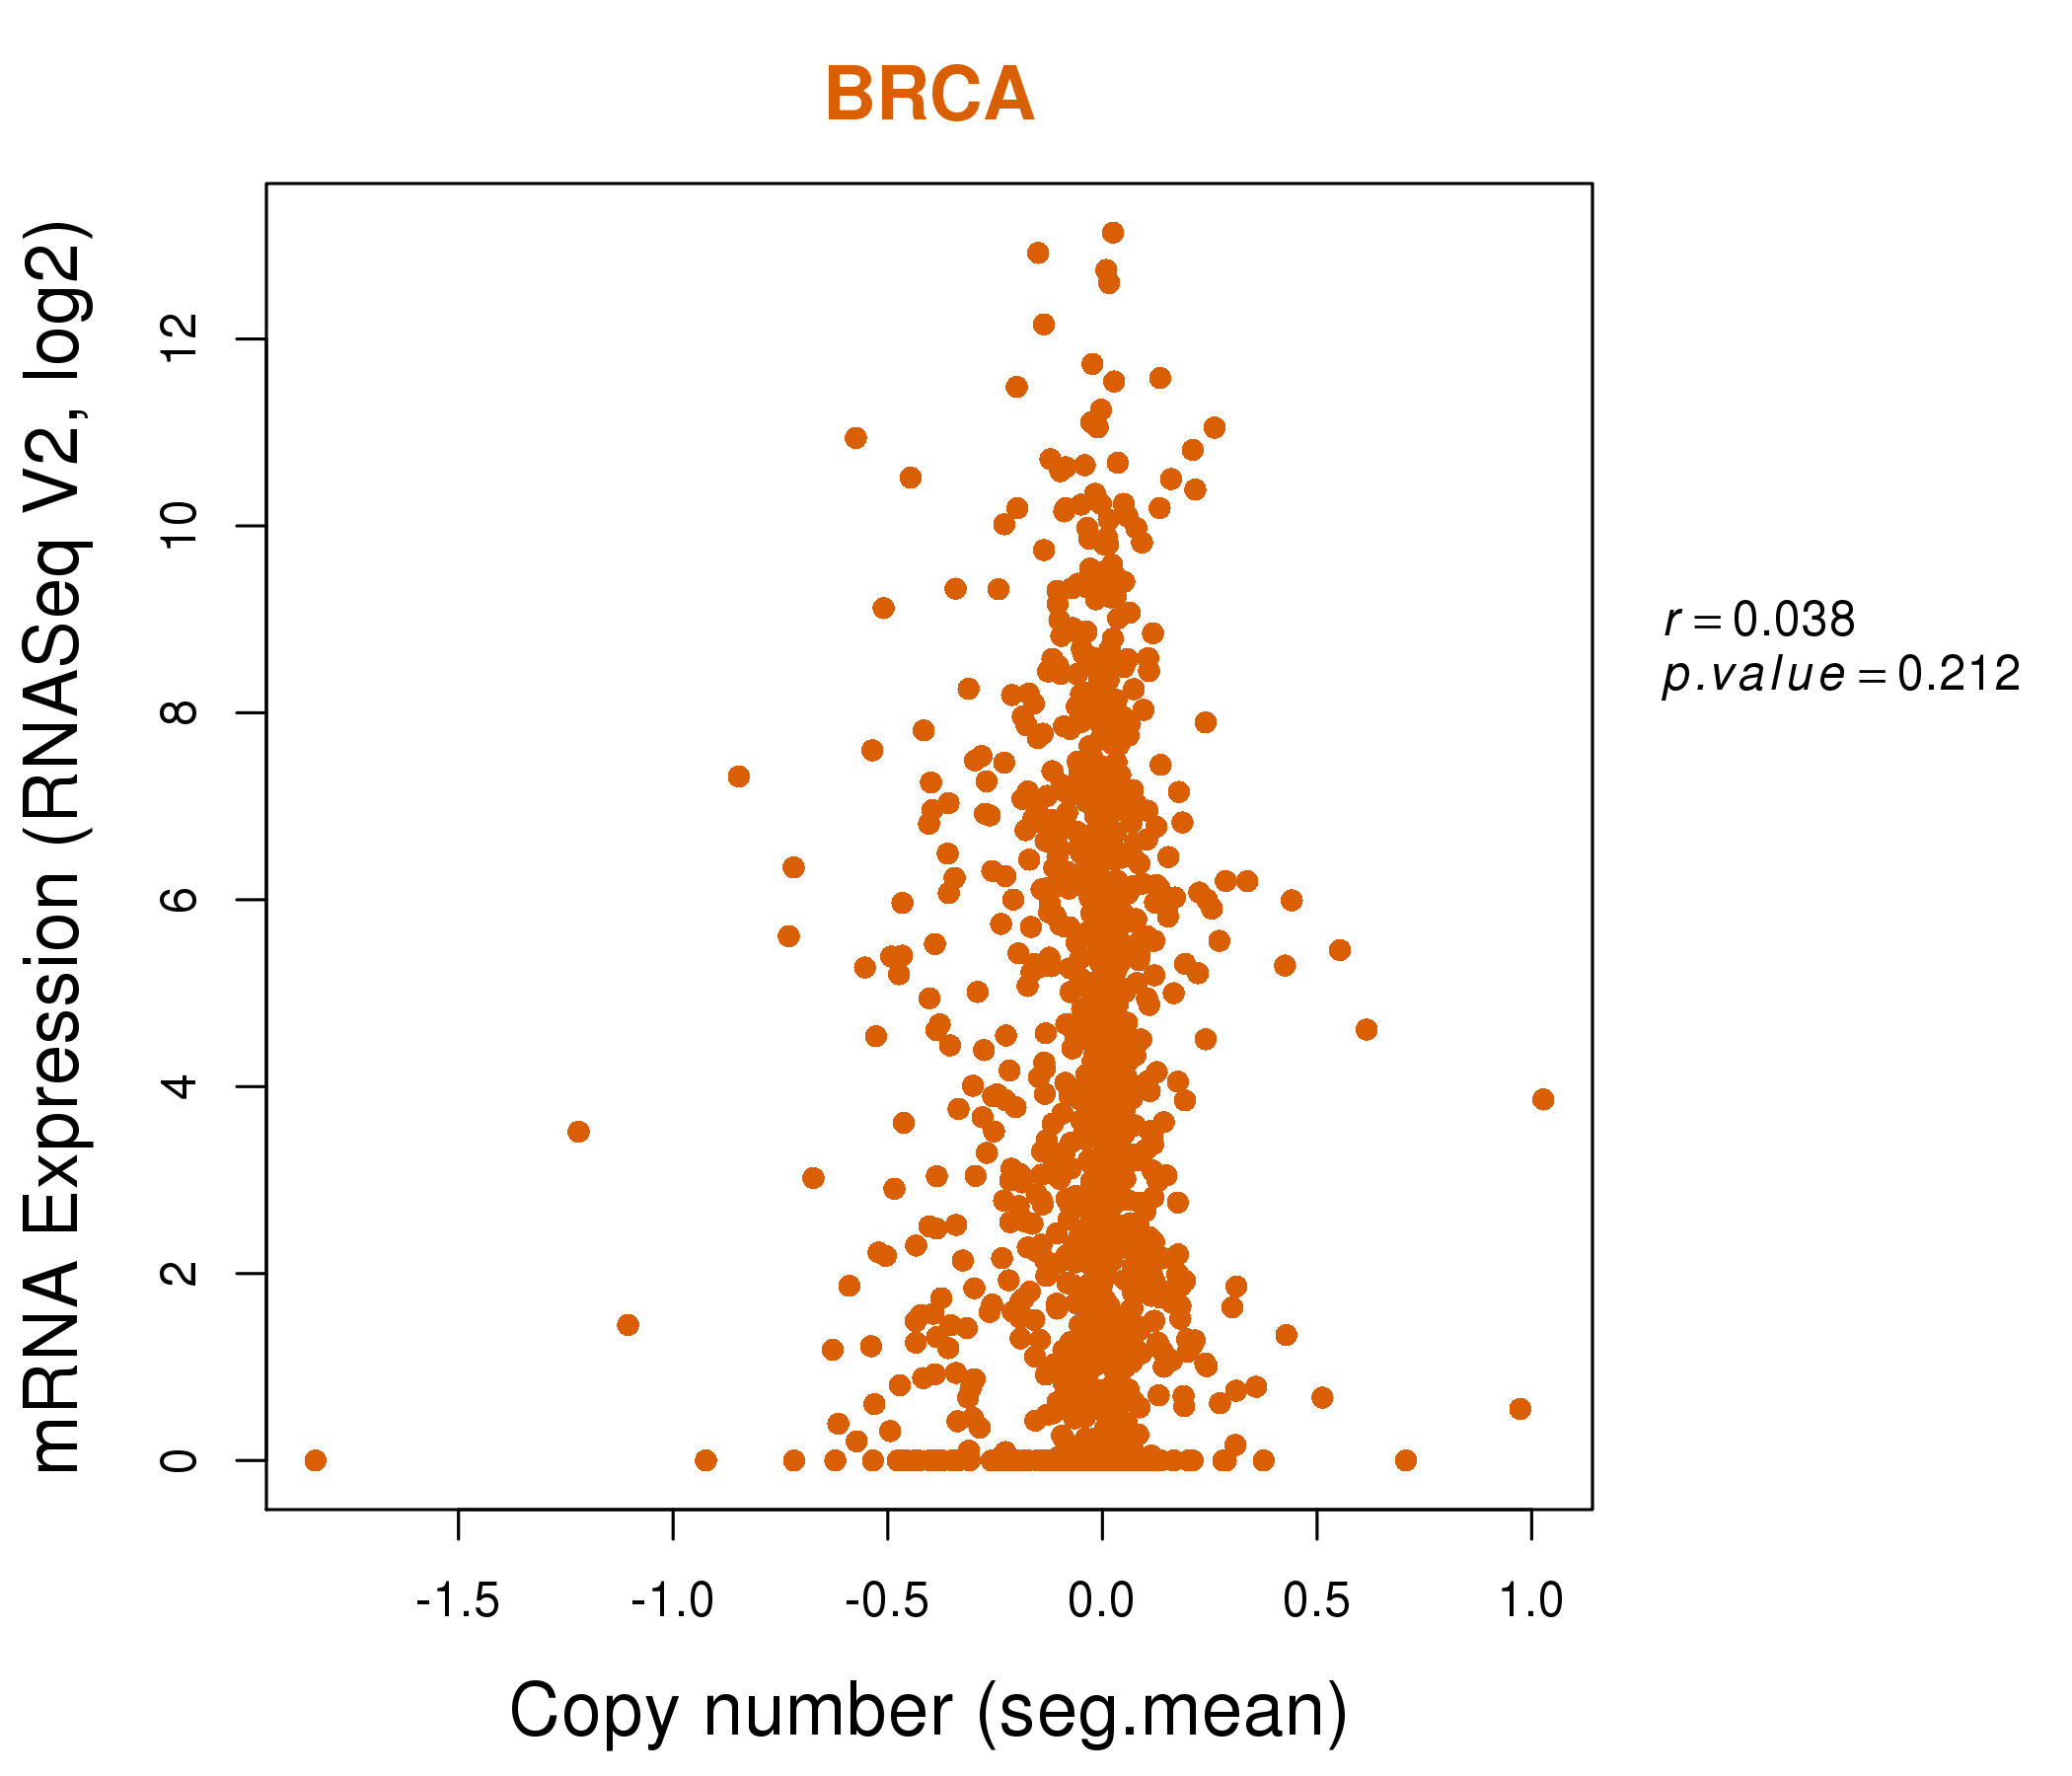
| * This plots show the correlation between CNV and gene expression. |
: Open all plots for all cancer types
 |
|
 |
|
| Top |
| Gene-Gene Network Information |
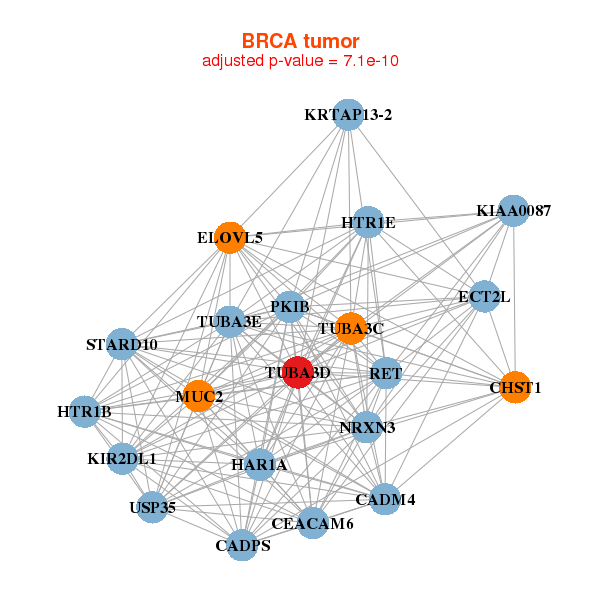
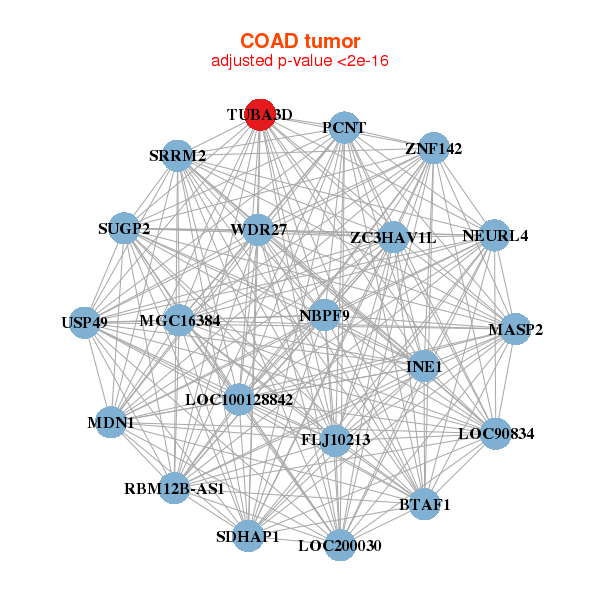
| * Co-Expression network figures were drawn using R package igraph. Only the top 20 genes with the highest correlations were shown. Red circle: input gene, orange circle: cell metabolism gene, sky circle: other gene |
: Open all plots for all cancer types
 |
|
| CADM4,CADPS,CEACAM6,CHST1,ECT2L,ELOVL5,HAR1A, HTR1B,HTR1E,KIAA0087,KIR2DL1,KRTAP13-2,MUC2,NRXN3, PKIB,RET,STARD10,TUBA3C,TUBA3D,TUBA3E,USP35 | ACER1,B4GALNT2,CFHR2,CFHR5,GDF9,GSTM2P1,HES3, HIST1H4G,ISX,LOC360030,LYZL2,MARCH10,MMP26,NOTO, OR5AN1,OR7D4,SNAP91,SORD,TUBA3C,TUBA3D,TUBA3E |
 |
|
| BTAF1,RBM12B-AS1,FLJ10213,INE1,LOC100128842,LOC200030,LOC90834, MASP2,MDN1,MGC16384,NBPF9,NEURL4,PCNT,SDHAP1, SUGP2,SRRM2,TUBA3D,USP49,WDR27,ZC3HAV1L,ZNF142 | ADAD2,ADAT2,C11orf42,CCDC14,CEP152,DISC2,HMGXB3, KIAA0907,LOC100133331,LOC202181,LRP5L,MMS19,PPARGC1B,RHOV, RPAP1,TARBP1,TPP2,TUBA3D,CFAP44,WHSC1,ZFP62 |
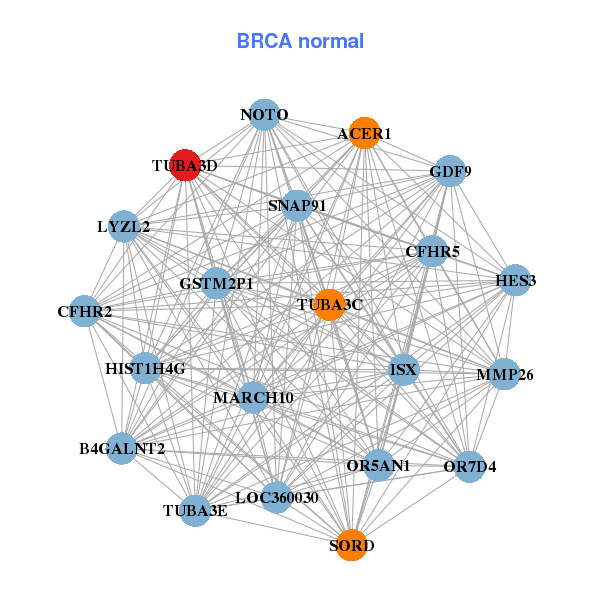

| * Co-Expression network figures were drawn using R package igraph. Only the top 20 genes with the highest correlations were shown. Red circle: input gene, orange circle: cell metabolism gene, sky circle: other gene |
: Open all plots for all cancer types
| Top |
: Open all interacting genes' information including KEGG pathway for all interacting genes from DAVID
| Top |
| Pharmacological Information for TUBA3D |
| There's no related Drug. |
| Top |
| Cross referenced IDs for TUBA3D |
| * We obtained these cross-references from Uniprot database. It covers 150 different DBs, 18 categories. http://www.uniprot.org/help/cross_references_section |
: Open all cross reference information
|
Copyright © 2016-Present - The Univsersity of Texas Health Science Center at Houston @ |