|
||||||||||||||||||||||||||||||||||||||||||||||||||||||||||||||||||||||||||||||||||||||||||||||||||||||||||||||||||||||||||||||||||||||||||||||||||||||||||||||||||||||||||||||||||||||||||||||||||||||||||||||||||||||||||||||||||||||||||||||||||||||||||||||||||||||||||||||||||||||||||||||||||||||||||||||||||||||||||
| |
| Phenotypic Information (metabolism pathway, cancer, disease, phenome) |
| |
| |
| Gene-Gene Network Information: Co-Expression Network, Interacting Genes & KEGG |
| |
|


| Gene Summary for WBSCR22 |
| Basic gene info. | Gene symbol | WBSCR22 |
| Gene name | Williams Beuren syndrome chromosome region 22 | |
| Synonyms | HASJ4442|HUSSY-3|MERM1|PP3381|WBMT | |
| Cytomap | UCSC genome browser: 7q11.23 | |
| Genomic location | chr7 :73097897-73112551 | |
| Type of gene | protein-coding | |
| RefGenes | NM_001202560.2, NM_017528.4,NR_037776.2,NR_045512.1, | |
| Ensembl id | ENSG00000262030 | |
| Description | Williams-Beuren candidate region putative methyltransferaseWilliams-Beuren syndrome chromosomal region 22 proteinbud site selection protein 23 homologmetastasis-related methyltransferase 1probable 18S rRNA (guanine-N(7))-methyltransferaseribosome bio | |
| Modification date | 20141207 | |
| dbXrefs | MIM : 615733 | |
| HGNC : HGNC | ||
| Ensembl : ENSG00000071462 | ||
| HPRD : 15659 | ||
| Vega : OTTHUMG00000023306 | ||
| Protein | UniProt: go to UniProt's Cross Reference DB Table | |
| Expression | CleanEX: HS_WBSCR22 | |
| BioGPS: 114049 | ||
| Gene Expression Atlas: ENSG00000262030 | ||
| The Human Protein Atlas: ENSG00000262030 | ||
| Pathway | NCI Pathway Interaction Database: WBSCR22 | |
| KEGG: WBSCR22 | ||
| REACTOME: WBSCR22 | ||
| ConsensusPathDB | ||
| Pathway Commons: WBSCR22 | ||
| Metabolism | MetaCyc: WBSCR22 | |
| HUMANCyc: WBSCR22 | ||
| Regulation | Ensembl's Regulation: ENSG00000262030 | |
| miRBase: chr7 :73,097,897-73,112,551 | ||
| TargetScan: NM_001202560 | ||
| cisRED: ENSG00000262030 | ||
| Context | iHOP: WBSCR22 | |
| cancer metabolism search in PubMed: WBSCR22 | ||
| UCL Cancer Institute: WBSCR22 | ||
| Assigned class in ccmGDB | C | |
| Top |
| Phenotypic Information for WBSCR22(metabolism pathway, cancer, disease, phenome) |
| Cancer | CGAP: WBSCR22 |
| Familial Cancer Database: WBSCR22 | |
| * This gene is included in those cancer gene databases. |
|
|
|
|
|
| . | ||||||||||||||||||||||||||||||||||||||||||||||||||||||||||||||||||||||||||||||||||||||||||||||||||||||||||||||||||||||||||||||||||||||||||||||||||||||||||||||||||||||||||||||||||||||||||||||||||||||||||||||||||||||||||||||||||||||||||||||||||||||||||||||||||||||||||||||||||||||||||||||||||||||||||||||||||||
Oncogene 1 | Significant driver gene in | |||||||||||||||||||||||||||||||||||||||||||||||||||||||||||||||||||||||||||||||||||||||||||||||||||||||||||||||||||||||||||||||||||||||||||||||||||||||||||||||||||||||||||||||||||||||||||||||||||||||||||||||||||||||||||||||||||||||||||||||||||||||||||||||||||||||||||||||||||||||||||||||||||||||||||||||||||||||||
| cf) number; DB name 1 Oncogene; http://nar.oxfordjournals.org/content/35/suppl_1/D721.long, 2 Tumor Suppressor gene; https://bioinfo.uth.edu/TSGene/, 3 Cancer Gene Census; http://www.nature.com/nrc/journal/v4/n3/abs/nrc1299.html, 4 CancerGenes; http://nar.oxfordjournals.org/content/35/suppl_1/D721.long, 5 Network of Cancer Gene; http://ncg.kcl.ac.uk/index.php, 1Therapeutic Vulnerabilities in Cancer; http://cbio.mskcc.org/cancergenomics/statius/ |
| KEGG_HISTIDINE_METABOLISM KEGG_TYROSINE_METABOLISM KEGG_SELENOAMINO_ACID_METABOLISM | |
| Mutations for WBSCR22 |
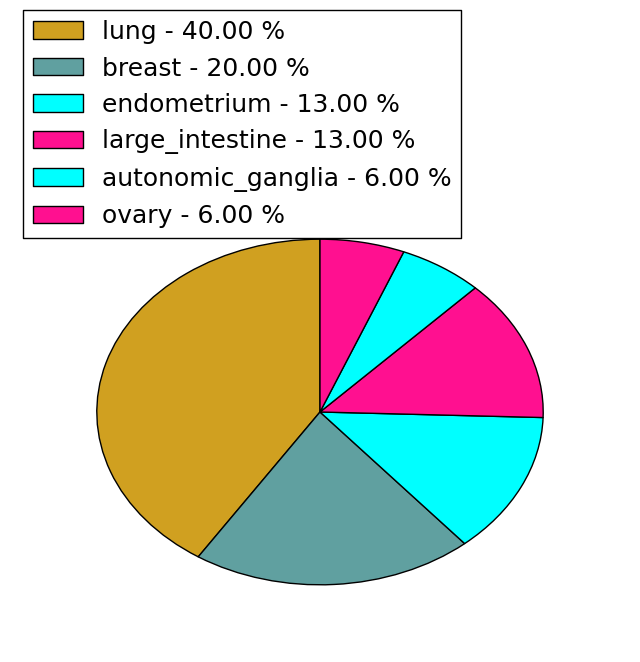
| * Under tables are showing count per each tissue to give us broad intuition about tissue specific mutation patterns.You can go to the detailed page for each mutation database's web site. |
| There's no structural variation information in COSMIC data for this gene. |
| * From mRNA Sanger sequences, Chitars2.0 arranged chimeric transcripts. This table shows WBSCR22 related fusion information. |
| ID | Head Gene | Tail Gene | Accession | Gene_a | qStart_a | qEnd_a | Chromosome_a | tStart_a | tEnd_a | Gene_a | qStart_a | qEnd_a | Chromosome_a | tStart_a | tEnd_a |
| AF251054 | NDRG3 | 2 | 2427 | 20 | 35280670 | 35374481 | WBSCR22 | 2422 | 2588 | 7 | 73112373 | 73112538 | |
| CK299603 | ZYX | 18 | 302 | 7 | 143087917 | 143088201 | WBSCR22 | 299 | 594 | 7 | 73097958 | 73101361 | |
| BQ188404 | WBSCR22 | 1 | 295 | 7 | 73097959 | 73101361 | ZYX | 292 | 579 | 7 | 143087917 | 143088204 | |
| BF312340 | SDF4 | 13 | 269 | 1 | 1164156 | 1167358 | WBSCR22 | 270 | 726 | 7 | 73097940 | 73101425 | |
| T11661 | PBX1 | 1 | 53 | 1 | 164725093 | 164725145 | WBSCR22 | 53 | 172 | 7 | 73107704 | 73108355 | |
| AW068214 | WBSCR22 | 8 | 77 | 7 | 73112252 | 73112321 | WBSCR22 | 76 | 129 | 7 | 73112232 | 73112285 | |
| DA292433 | LINC00461 | 1 | 69 | 5 | 87976718 | 87976786 | WBSCR22 | 66 | 567 | 7 | 73118484 | 73134004 | |
| BQ375803 | CCR6 | 154 | 175 | 6 | 167484011 | 167484032 | WBSCR22 | 158 | 472 | 7 | 73110180 | 73110494 | |
| Top |
| Mutation type/ Tissue ID | brca | cns | cerv | endome | haematopo | kidn | Lintest | liver | lung | ns | ovary | pancre | prost | skin | stoma | thyro | urina | |||
| Total # sample | 1 | |||||||||||||||||||
| GAIN (# sample) | 1 | |||||||||||||||||||
| LOSS (# sample) |
| cf) Tissue ID; Tissue type (1; Breast, 2; Central_nervous_system, 3; Cervix, 4; Endometrium, 5; Haematopoietic_and_lymphoid_tissue, 6; Kidney, 7; Large_intestine, 8; Liver, 9; Lung, 10; NS, 11; Ovary, 12; Pancreas, 13; Prostate, 14; Skin, 15; Stomach, 16; Thyroid, 17; Urinary_tract) |
| Top |
|
 |
| Top |
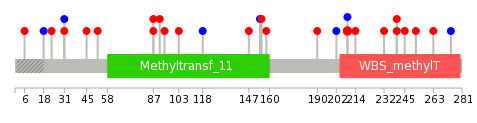
| Stat. for Non-Synonymous SNVs (# total SNVs=15) | (# total SNVs=4) |
 |  |
(# total SNVs=0) | (# total SNVs=0) |
| Top |
| * When you move the cursor on each content, you can see more deailed mutation information on the Tooltip. Those are primary_site,primary_histology,mutation(aa),pubmedID. |
| GRCh37 position | Mutation(aa) | Unique sampleID count |
| chr7:73108004-73108004 | p.? | 2 |
| chr7:73100970-73100970 | p.R31R | 2 |
| chr7:73107983-73107983 | p.S209L | 2 |
| chr7:73108001-73108001 | p.? | 1 |
| chr7:73098102-73098102 | p.Y18Y | 1 |
| chr7:73105283-73105283 | p.K134* | 1 |
| chr7:73108002-73108002 | p.? | 1 |
| chr7:73098116-73098116 | p.A23V | 1 |
| chr7:73105322-73105322 | p.A147S | 1 |
| chr7:73106928-73106928 | p.V154V | 1 |
| Top |
|
 |
| Point Mutation/ Tissue ID | 1 | 2 | 3 | 4 | 5 | 6 | 7 | 8 | 9 | 10 | 11 | 12 | 13 | 14 | 15 | 16 | 17 | 18 | 19 | 20 |
| # sample | 3 | 3 | 3 | 3 | 2 | 1 | 1 | 4 | 4 | |||||||||||
| # mutation | 3 | 3 | 3 | 4 | 2 | 1 | 1 | 4 | 4 | |||||||||||
| nonsynonymous SNV | 3 | 2 | 2 | 2 | 2 | 1 | 4 | 2 | ||||||||||||
| synonymous SNV | 1 | 1 | 2 | 1 | 2 |
| cf) Tissue ID; Tissue type (1; BLCA[Bladder Urothelial Carcinoma], 2; BRCA[Breast invasive carcinoma], 3; CESC[Cervical squamous cell carcinoma and endocervical adenocarcinoma], 4; COAD[Colon adenocarcinoma], 5; GBM[Glioblastoma multiforme], 6; Glioma Low Grade, 7; HNSC[Head and Neck squamous cell carcinoma], 8; KICH[Kidney Chromophobe], 9; KIRC[Kidney renal clear cell carcinoma], 10; KIRP[Kidney renal papillary cell carcinoma], 11; LAML[Acute Myeloid Leukemia], 12; LUAD[Lung adenocarcinoma], 13; LUSC[Lung squamous cell carcinoma], 14; OV[Ovarian serous cystadenocarcinoma ], 15; PAAD[Pancreatic adenocarcinoma], 16; PRAD[Prostate adenocarcinoma], 17; SKCM[Skin Cutaneous Melanoma], 18:STAD[Stomach adenocarcinoma], 19:THCA[Thyroid carcinoma], 20:UCEC[Uterine Corpus Endometrial Carcinoma]) |
| Top |
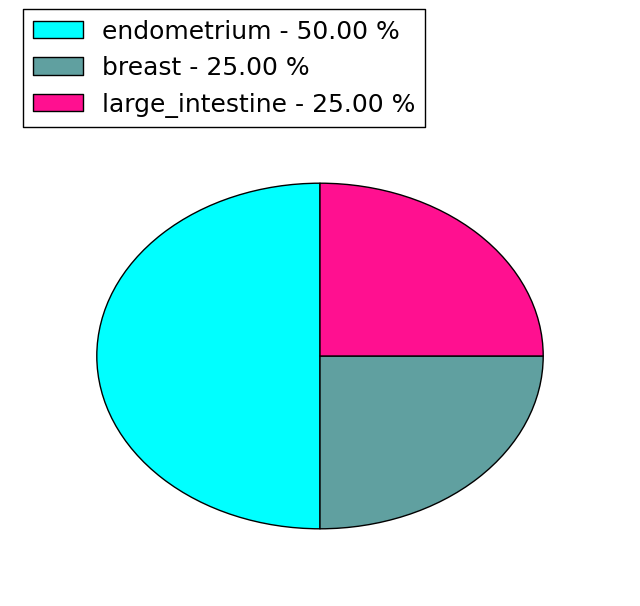
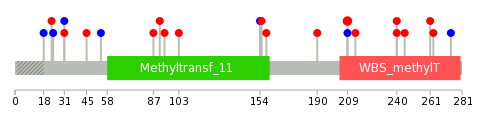
| * We represented just top 10 SNVs. When you move the cursor on each content, you can see more deailed mutation information on the Tooltip. Those are primary_site, primary_histology, mutation(aa), pubmedID. |
| Genomic Position | Mutation(aa) | Unique sampleID count |
| chr7:73100970 | p.R31R,WBSCR22 | 2 |
| chr7:73107983 | p.S209L,WBSCR22 | 2 |
| chr7:73112192 | p.A23V,WBSCR22 | 1 |
| chr7:73098116 | p.S240P,WBSCR22 | 1 |
| chr7:73106939 | p.R24R,WBSCR22 | 1 |
| chr7:73098118 | p.S240L,WBSCR22 | 1 |
| chr7:73107716 | p.V245M,WBSCR22 | 1 |
| chr7:73101013 | p.E45G,WBSCR22 | 1 |
| chr7:73107984 | p.R261H,WBSCR22 | 1 |
| chr7:73101041 | p.P54P,WBSCR22 | 1 |
| * Copy number data were extracted from TCGA using R package TCGA-Assembler. The URLs of all public data files on TCGA DCC data server were gathered on Jan-05-2015. Function ProcessCNAData in TCGA-Assembler package was used to obtain gene-level copy number value which is calculated as the average copy number of the genomic region of a gene. |
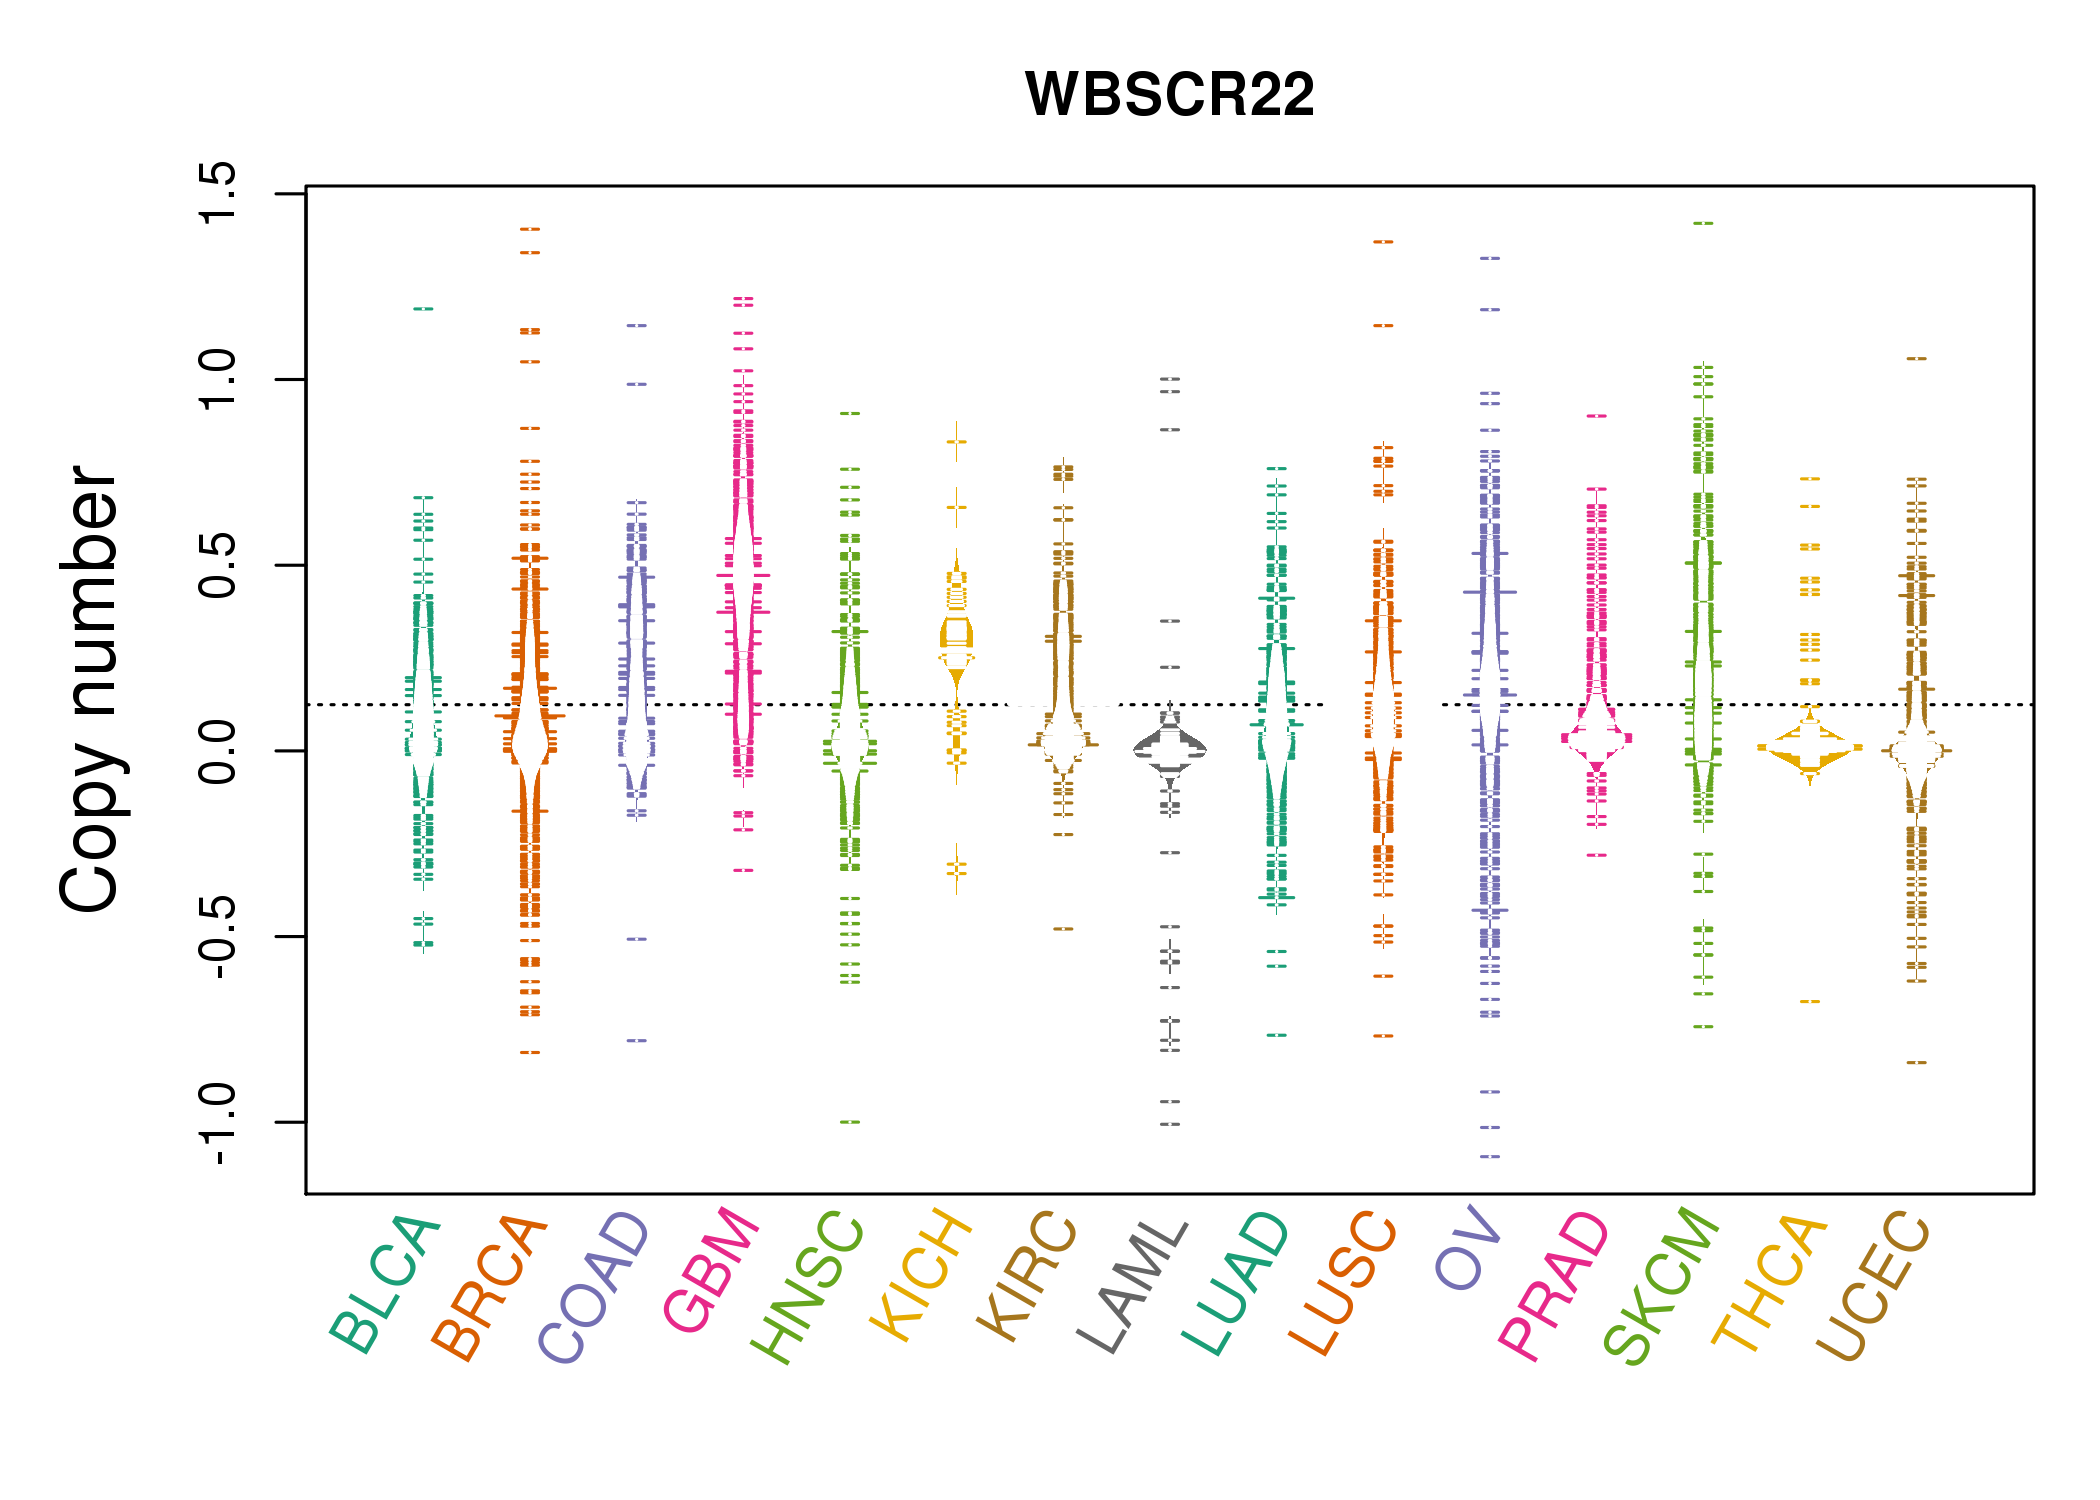 |
| cf) Tissue ID[Tissue type]: BLCA[Bladder Urothelial Carcinoma], BRCA[Breast invasive carcinoma], CESC[Cervical squamous cell carcinoma and endocervical adenocarcinoma], COAD[Colon adenocarcinoma], GBM[Glioblastoma multiforme], Glioma Low Grade, HNSC[Head and Neck squamous cell carcinoma], KICH[Kidney Chromophobe], KIRC[Kidney renal clear cell carcinoma], KIRP[Kidney renal papillary cell carcinoma], LAML[Acute Myeloid Leukemia], LUAD[Lung adenocarcinoma], LUSC[Lung squamous cell carcinoma], OV[Ovarian serous cystadenocarcinoma ], PAAD[Pancreatic adenocarcinoma], PRAD[Prostate adenocarcinoma], SKCM[Skin Cutaneous Melanoma], STAD[Stomach adenocarcinoma], THCA[Thyroid carcinoma], UCEC[Uterine Corpus Endometrial Carcinoma] |
| Top |
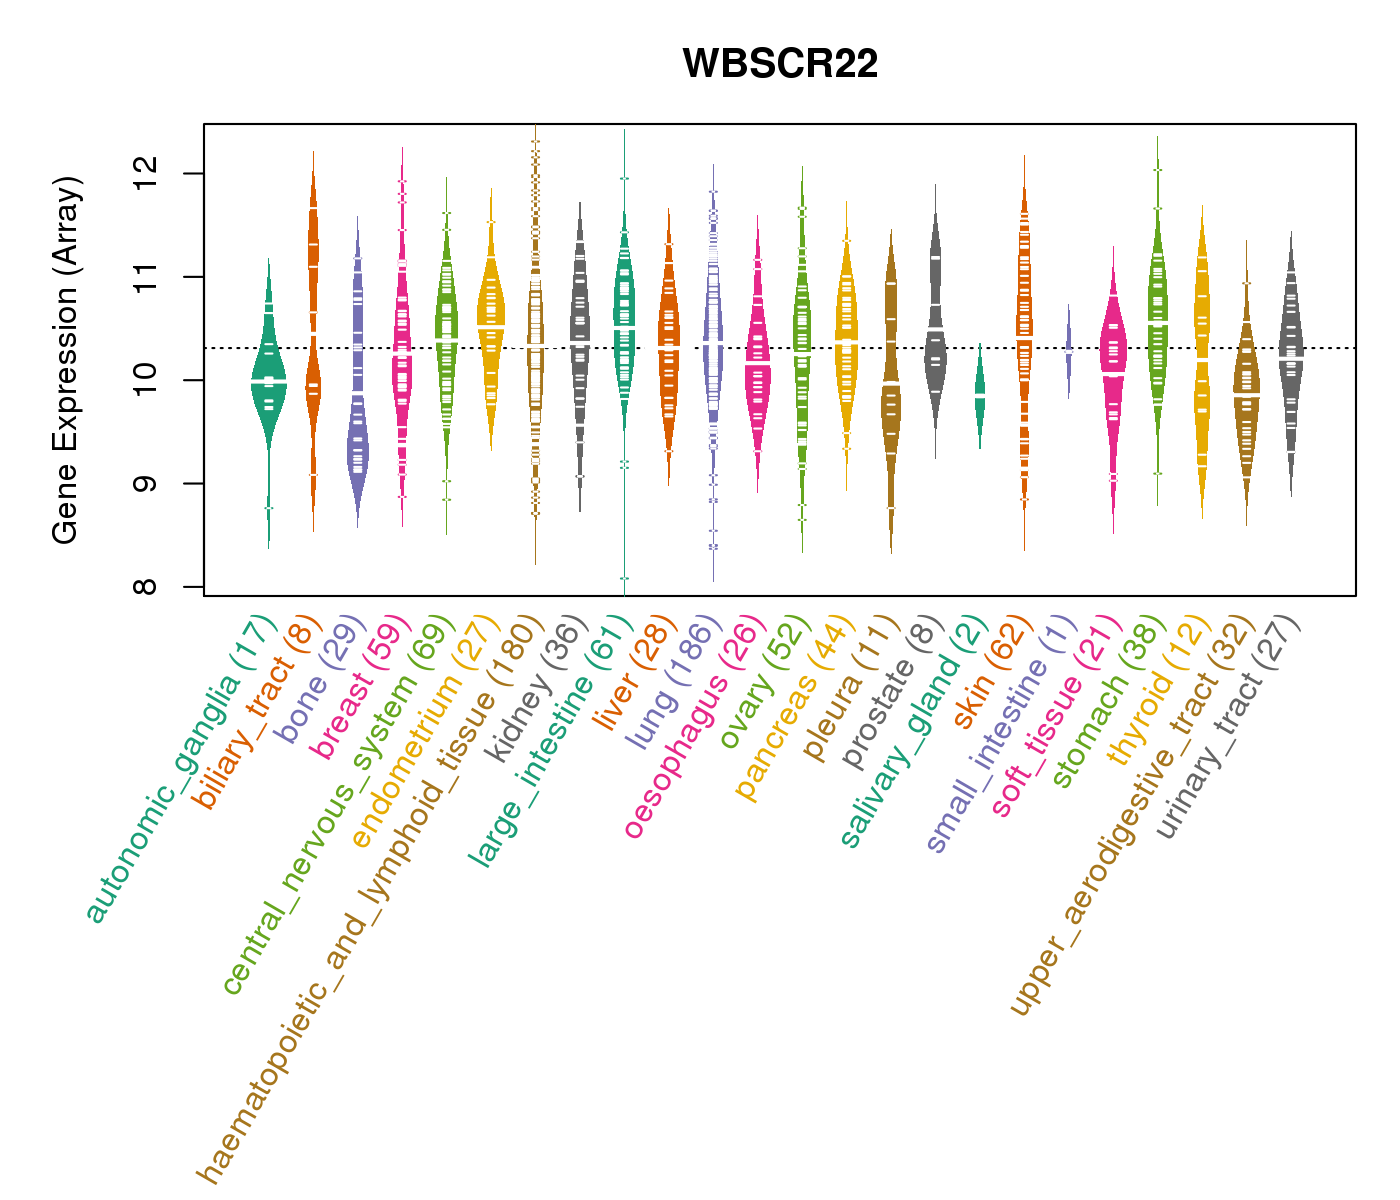
| Gene Expression for WBSCR22 |
| * CCLE gene expression data were extracted from CCLE_Expression_Entrez_2012-10-18.res: Gene-centric RMA-normalized mRNA expression data. |
 |
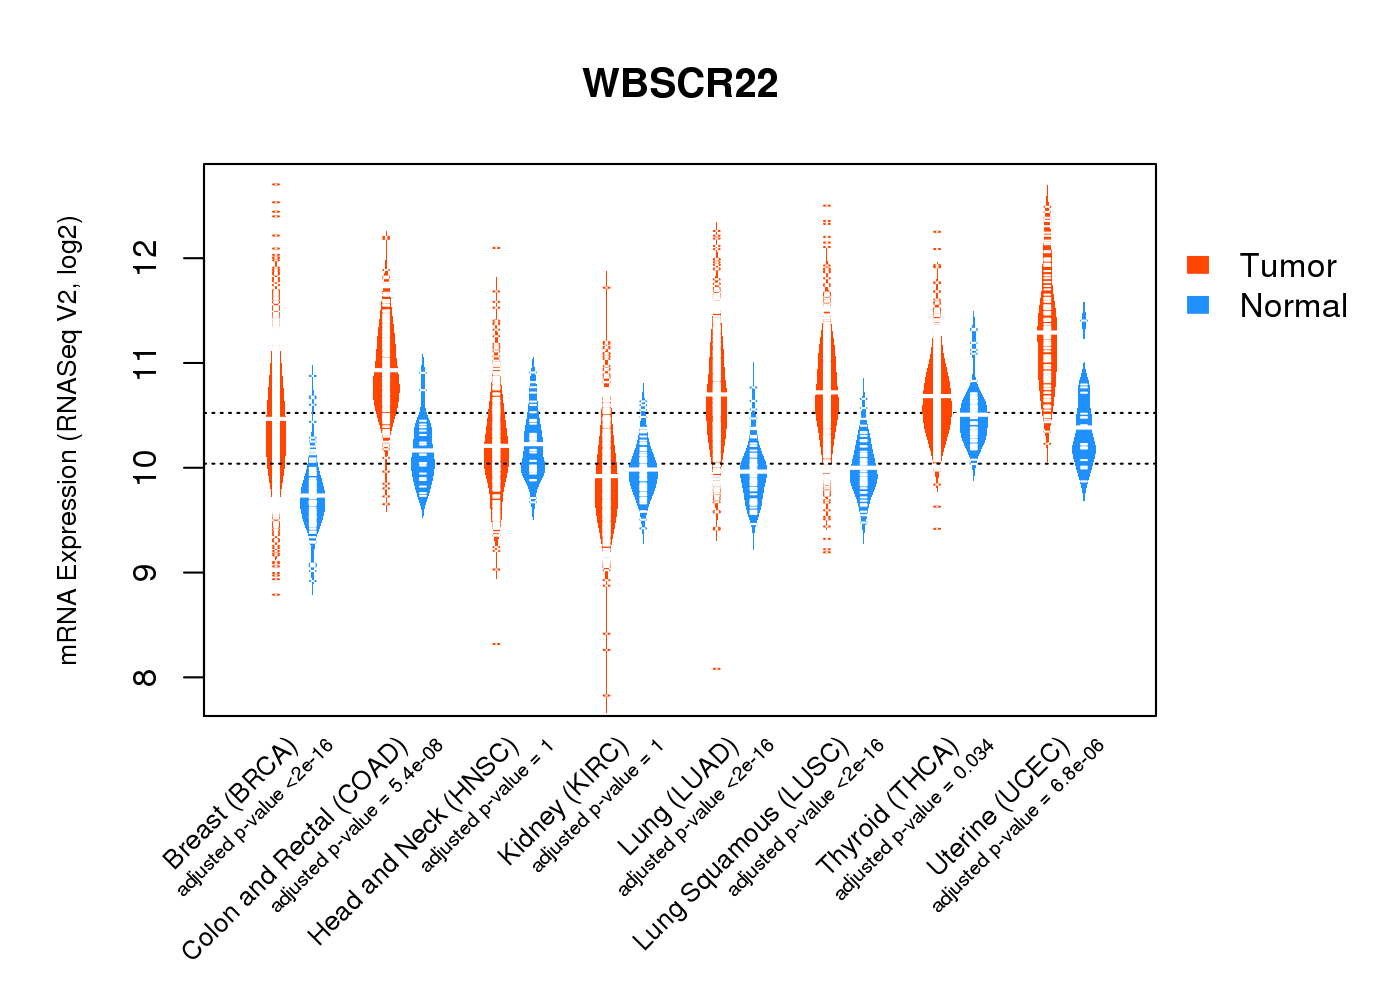
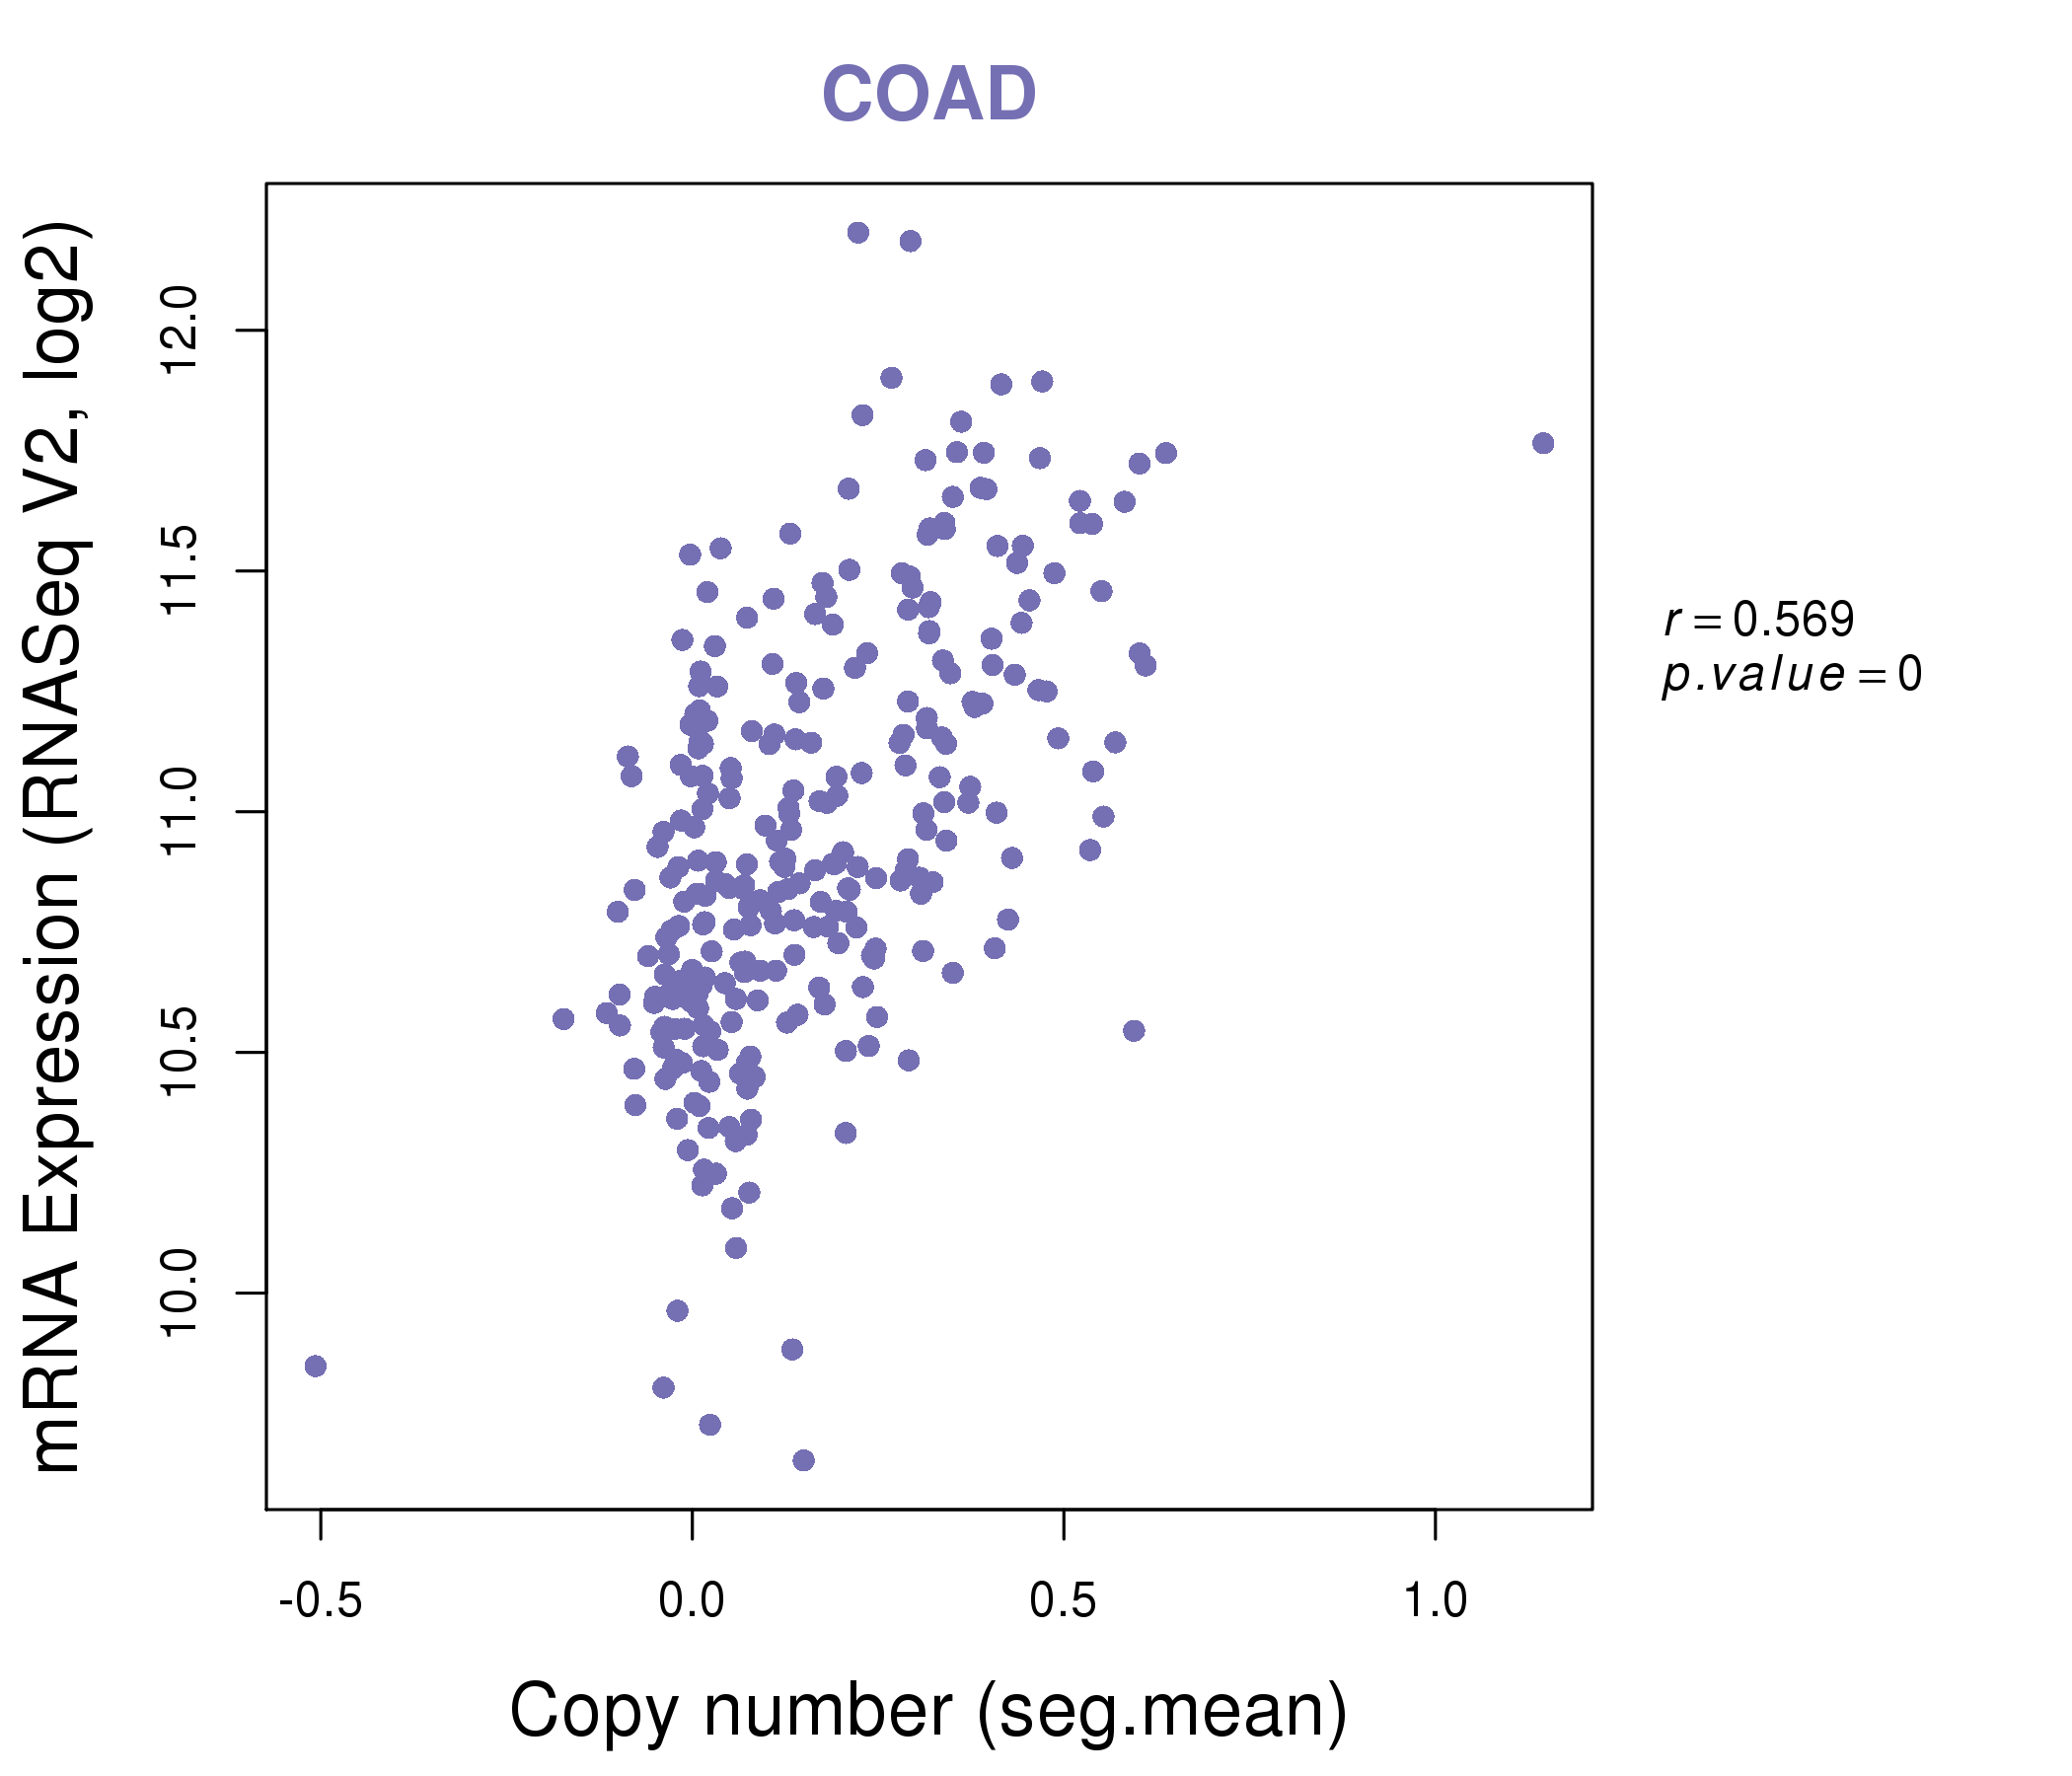
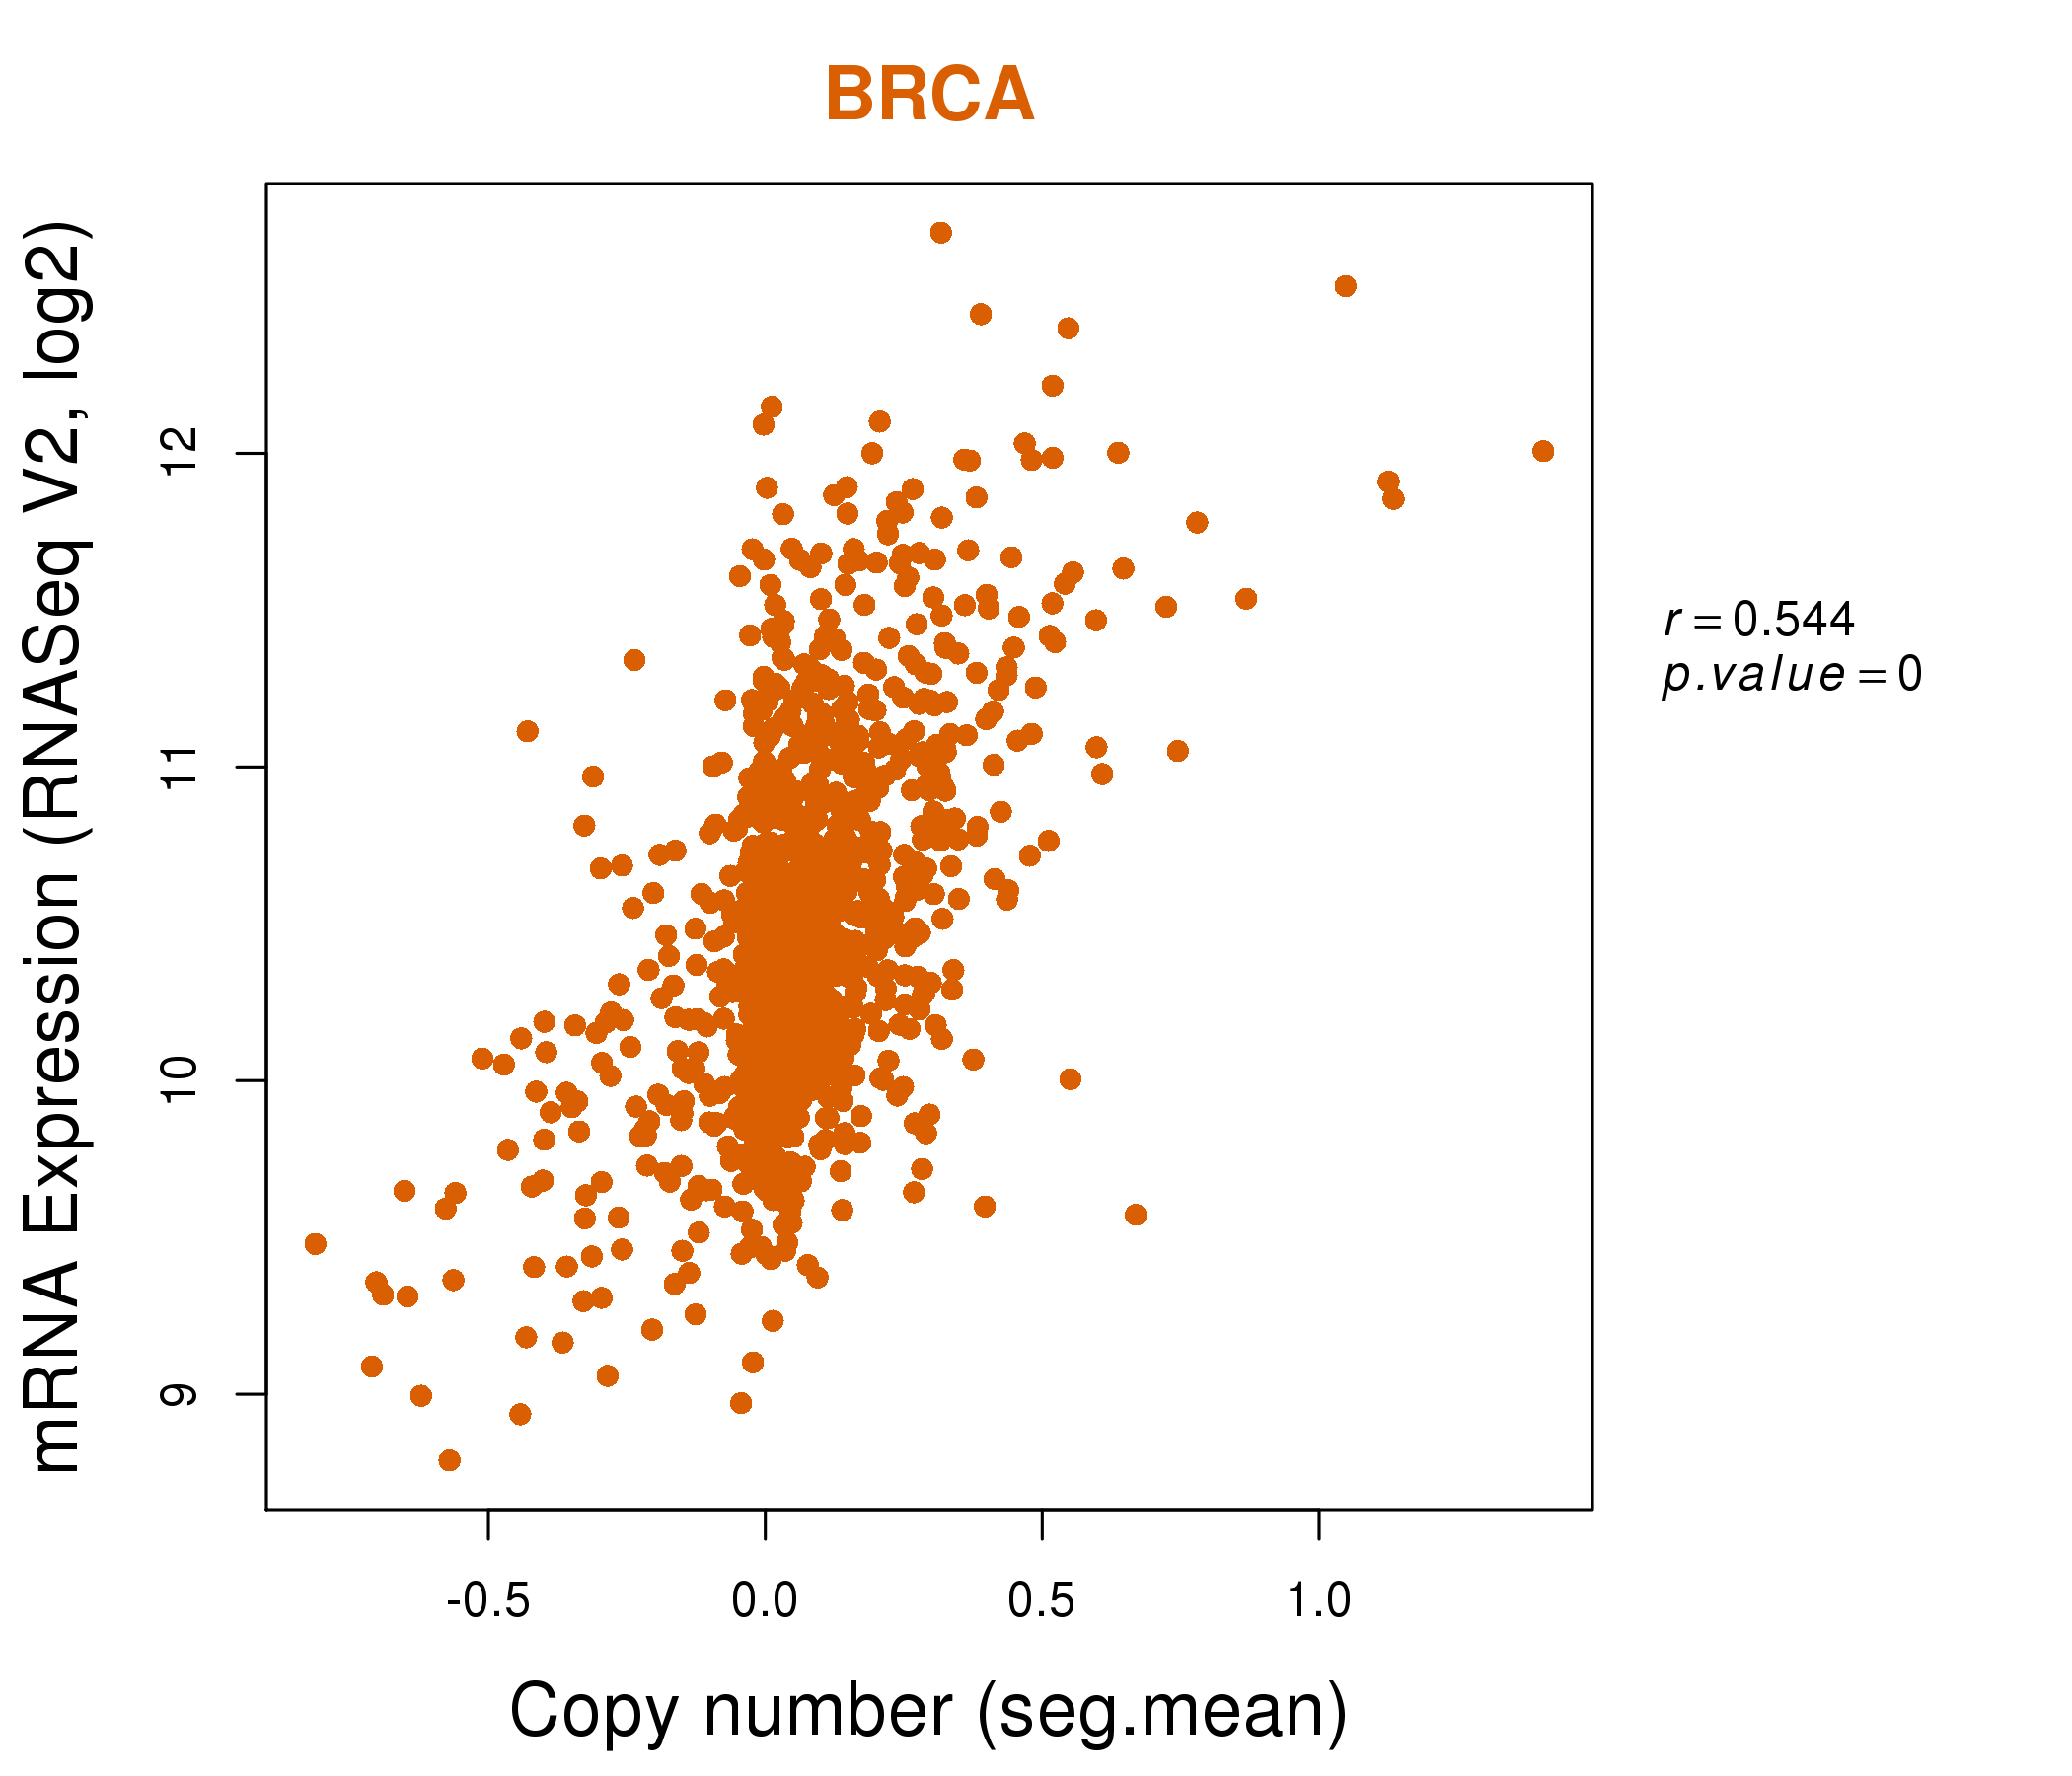
| * Normalized gene expression data of RNASeqV2 was extracted from TCGA using R package TCGA-Assembler. The URLs of all public data files on TCGA DCC data server were gathered at Jan-05-2015. Only eight cancer types have enough normal control samples for differential expression analysis. (t test, adjusted p<0.05 (using Benjamini-Hochberg FDR)) |
 |
| Top |
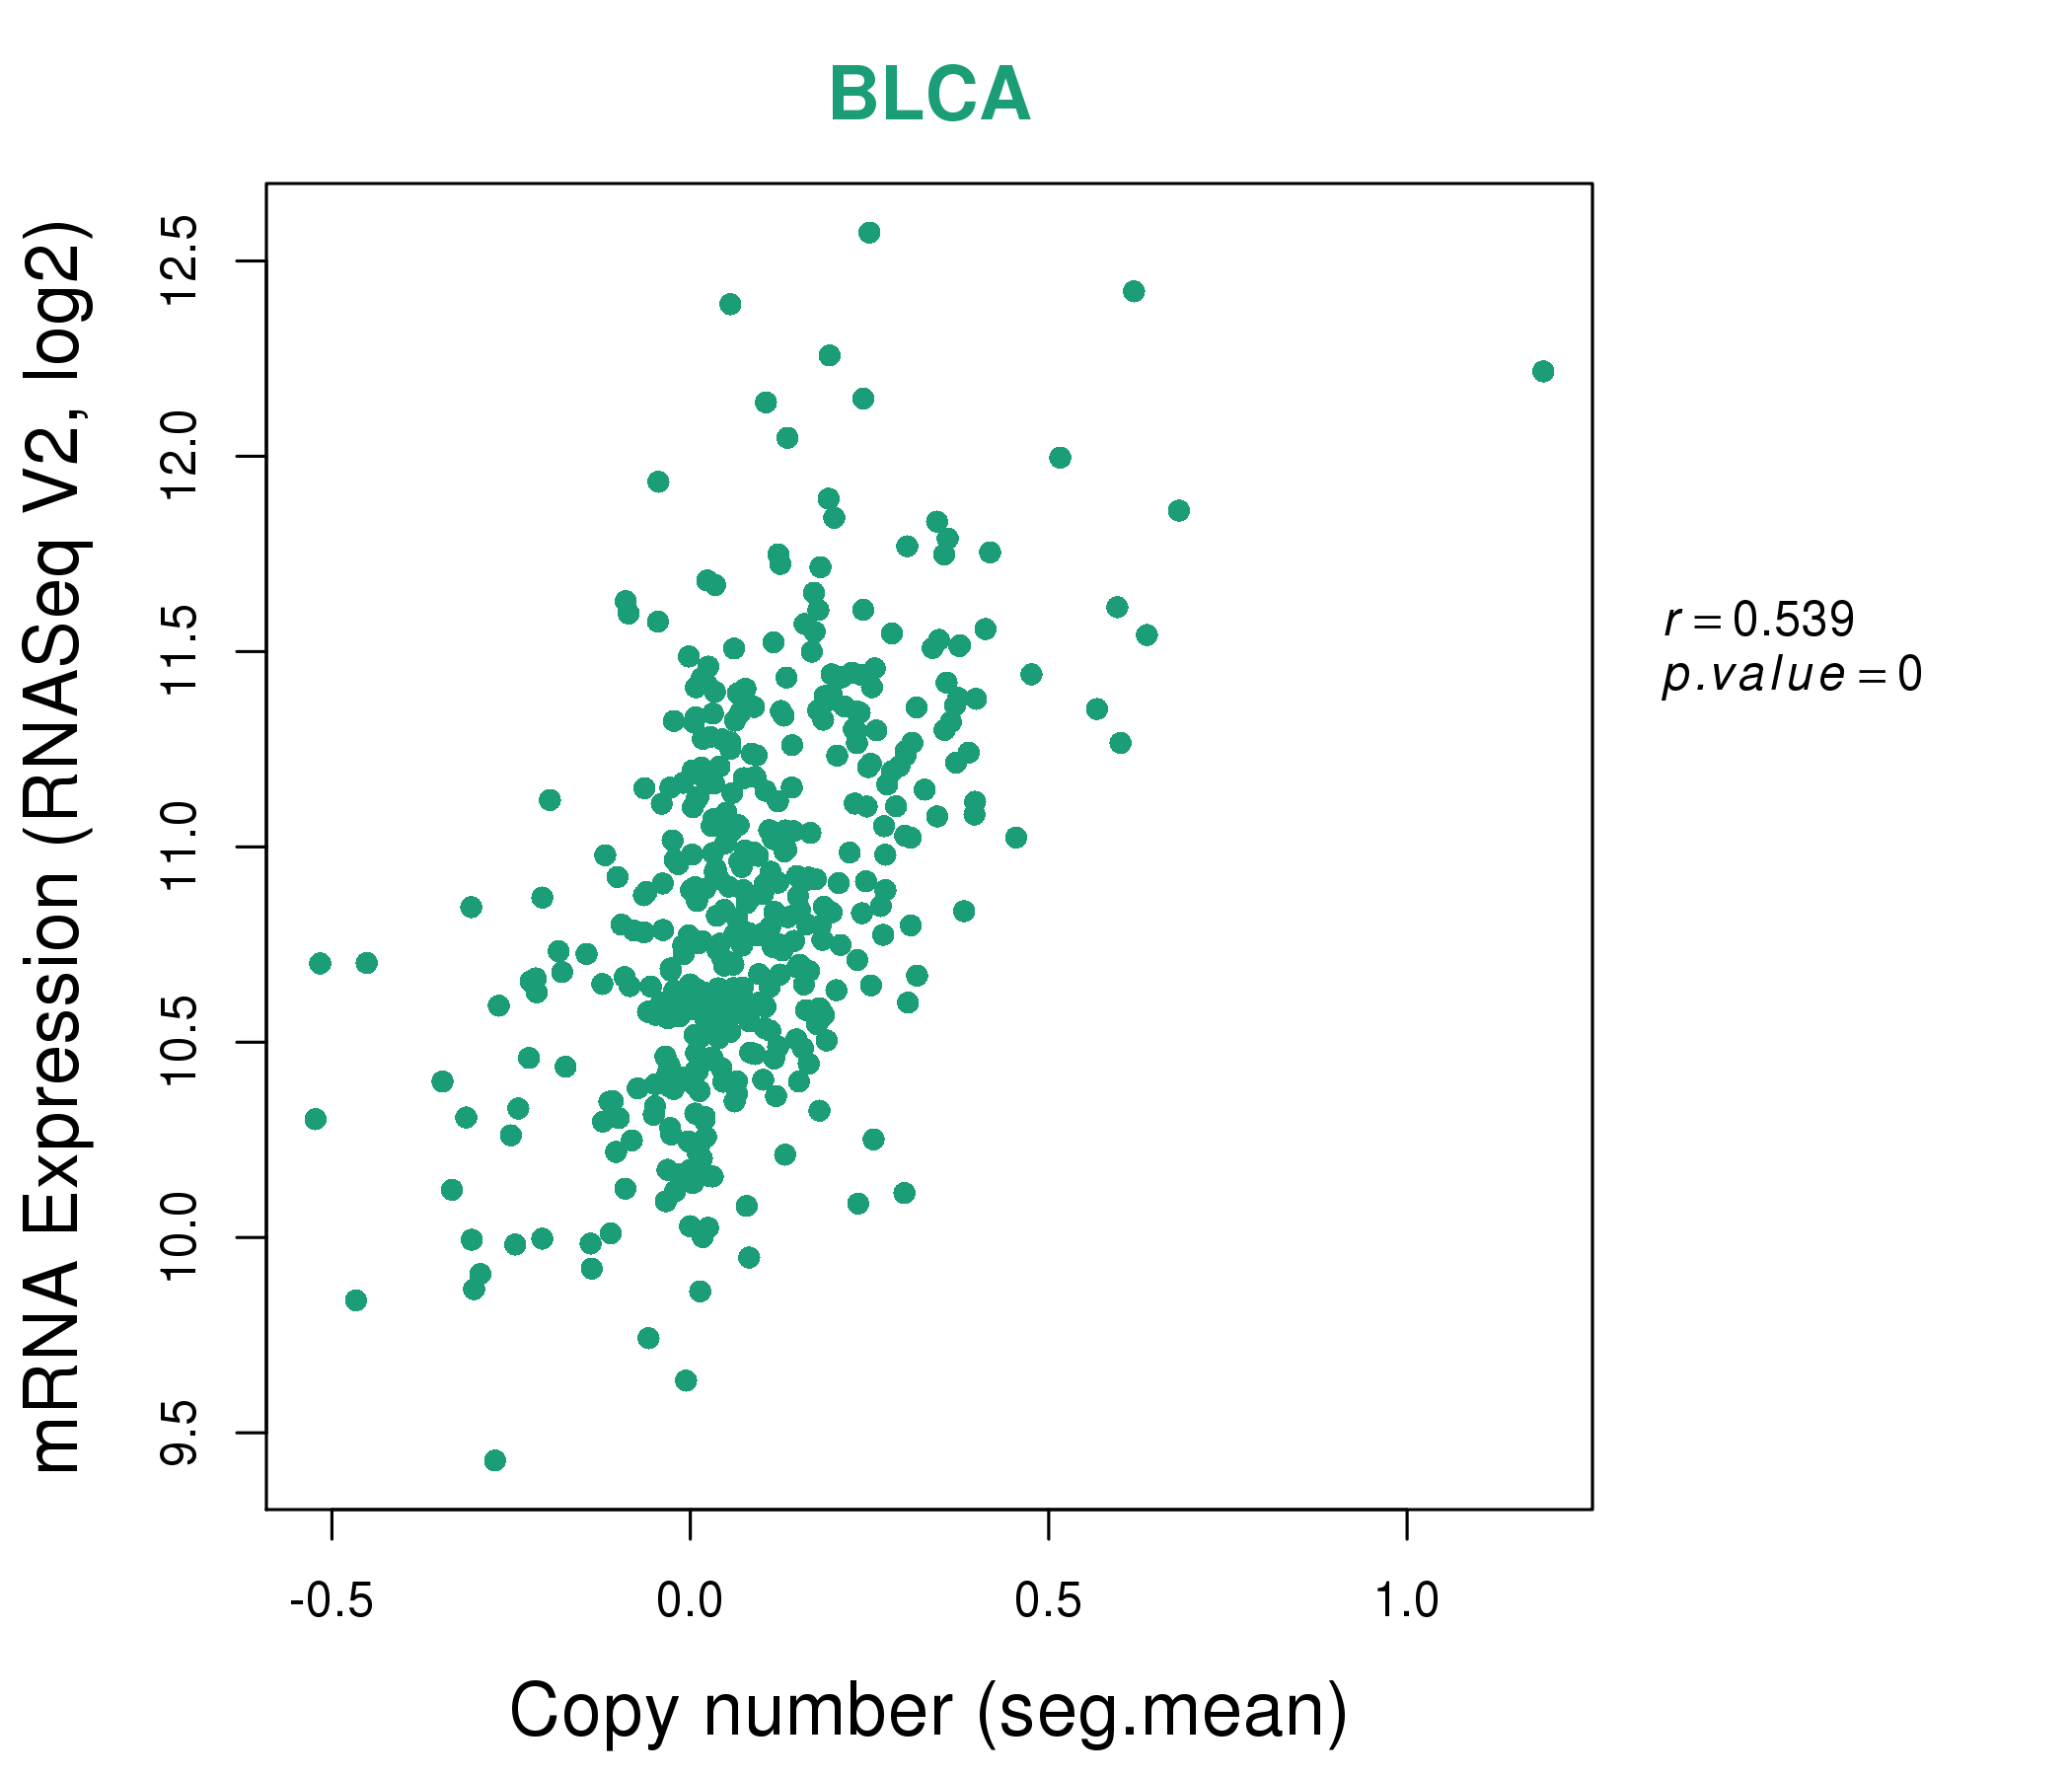
| * This plots show the correlation between CNV and gene expression. |
: Open all plots for all cancer types
 |
|
 |
|

| Top |
| Gene-Gene Network Information |
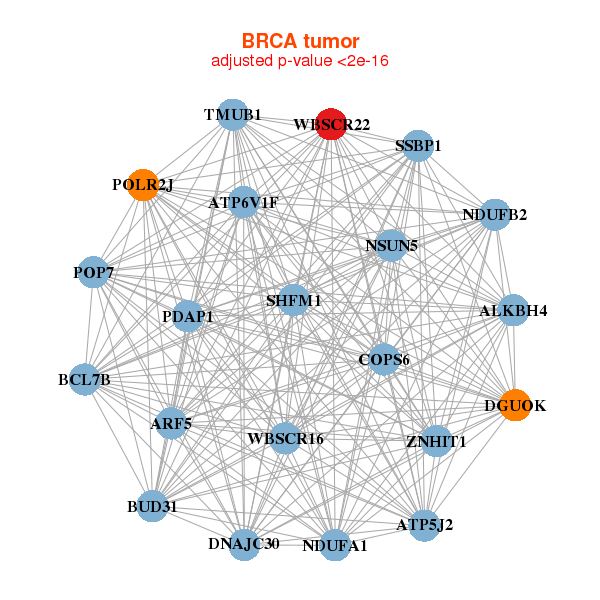
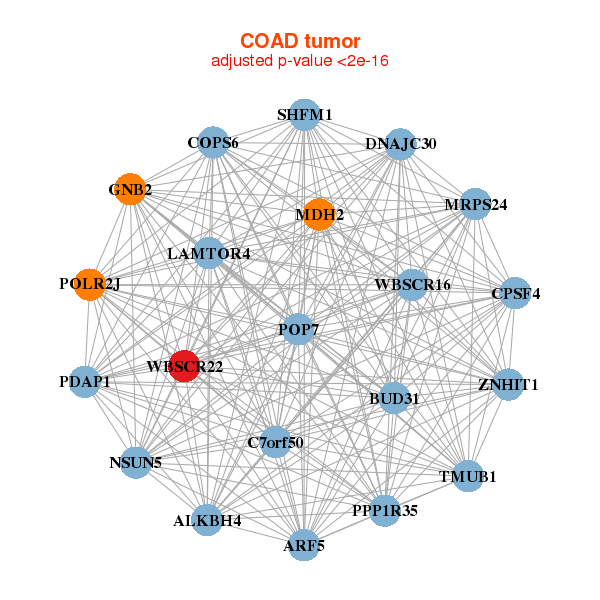
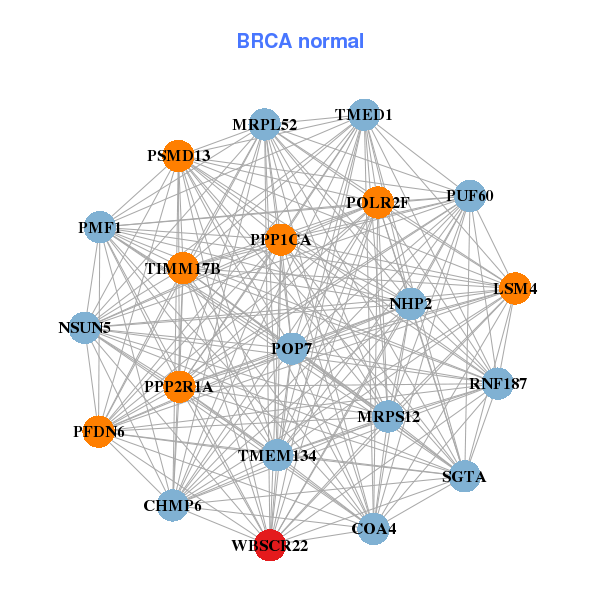
| * Co-Expression network figures were drawn using R package igraph. Only the top 20 genes with the highest correlations were shown. Red circle: input gene, orange circle: cell metabolism gene, sky circle: other gene |
: Open all plots for all cancer types
 |
|
| ALKBH4,ARF5,ATP5J2,ATP6V1F,BCL7B,BUD31,COPS6, DGUOK,DNAJC30,NDUFA1,NDUFB2,NSUN5,PDAP1,POLR2J, POP7,SHFM1,SSBP1,TMUB1,WBSCR16,WBSCR22,ZNHIT1 | COA4,CHMP6,LSM4,MRPL52,MRPS12,NHP2,NSUN5, PFDN6,PMF1,POLR2F,POP7,PPP1CA,PPP2R1A,PSMD13, PUF60,RNF187,SGTA,TIMM17B,TMED1,TMEM134,WBSCR22 |
 |
|
| ALKBH4,ARF5,BUD31,PPP1R35,C7orf50,LAMTOR4,COPS6, CPSF4,DNAJC30,GNB2,MDH2,MRPS24,NSUN5,PDAP1, POLR2J,POP7,SHFM1,TMUB1,WBSCR16,WBSCR22,ZNHIT1 | APTX,BNIP1,BOLA3,HYPK,EBNA1BP2,MRPL3,MRTO4, NHP2,NHP2L1,NME2,NPM3,NR2C2AP,PHB,POLR1C, PRDX4,RAN,SNRPB,SNRPE,TMEM147,TOMM6,WBSCR22 |

| * Co-Expression network figures were drawn using R package igraph. Only the top 20 genes with the highest correlations were shown. Red circle: input gene, orange circle: cell metabolism gene, sky circle: other gene |
: Open all plots for all cancer types
| Top |
: Open all interacting genes' information including KEGG pathway for all interacting genes from DAVID
| Top |
| Pharmacological Information for WBSCR22 |
| There's no related Drug. |
| Top |
| Cross referenced IDs for WBSCR22 |
| * We obtained these cross-references from Uniprot database. It covers 150 different DBs, 18 categories. http://www.uniprot.org/help/cross_references_section |
: Open all cross reference information
|
Copyright © 2016-Present - The Univsersity of Texas Health Science Center at Houston @ |