|
||||||||||||||||||||||||||||||||||||||||||||||||||||||||||||||||||||||||||||||||||||||||||||||||||||||||||||||||||||||||||||||||||||||||||||||||||||||||||||||||||||||||||||||||||||||||||||||||||||||||||||||||||||||||||||||||||||||||||||||||||||||||||||||||||||||||||||||||||||||||||||||||||||||||||||||||||||||||||
| |
| Phenotypic Information (metabolism pathway, cancer, disease, phenome) |
| |
| |
| Gene-Gene Network Information: Co-Expression Network, Interacting Genes & KEGG |
| |
|


| Gene Summary for GALNT13 |
| Basic gene info. | Gene symbol | GALNT13 |
| Gene name | polypeptide N-acetylgalactosaminyltransferase 13 | |
| Synonyms | GalNAc-T13 | |
| Cytomap | UCSC genome browser: 2q24.1 | |
| Genomic location | chr2 :154728425-155310489 | |
| Type of gene | protein-coding | |
| RefGenes | NM_001301627.1, NM_052917.3, | |
| Ensembl id | ENSG00000144278 | |
| Description | GalNAc transferase 13UDP-GalNAc:polypeptide N-acetylgalactosaminyltransferase 13UDP-N-acetyl-alpha-D-galactosamine:polypeptide N-acetylgalactosaminyltransferase 13 (GalNAc-T13)polypeptide GalNAc transferase 13pp-GaNTase 13protein-UDP acetylgalactosam | |
| Modification date | 20141207 | |
| dbXrefs | MIM : 608369 | |
| HGNC : HGNC | ||
| Ensembl : ENSG00000144278 | ||
| HPRD : 16325 | ||
| Vega : OTTHUMG00000131917 | ||
| Protein | UniProt: Q8IUC8 go to UniProt's Cross Reference DB Table | |
| Expression | CleanEX: HS_GALNT13 | |
| BioGPS: 114805 | ||
| Gene Expression Atlas: ENSG00000144278 | ||
| The Human Protein Atlas: ENSG00000144278 | ||
| Pathway | NCI Pathway Interaction Database: GALNT13 | |
| KEGG: GALNT13 | ||
| REACTOME: GALNT13 | ||
| ConsensusPathDB | ||
| Pathway Commons: GALNT13 | ||
| Metabolism | MetaCyc: GALNT13 | |
| HUMANCyc: GALNT13 | ||
| Regulation | Ensembl's Regulation: ENSG00000144278 | |
| miRBase: chr2 :154,728,425-155,310,489 | ||
| TargetScan: NM_001301627 | ||
| cisRED: ENSG00000144278 | ||
| Context | iHOP: GALNT13 | |
| cancer metabolism search in PubMed: GALNT13 | ||
| UCL Cancer Institute: GALNT13 | ||
| Assigned class in ccmGDB | B - This gene belongs to cancer gene. | |
| Top |
| Phenotypic Information for GALNT13(metabolism pathway, cancer, disease, phenome) |
| Cancer | CGAP: GALNT13 |
| Familial Cancer Database: GALNT13 | |
| * This gene is included in those cancer gene databases. |
|
|
|
|
|
| . | ||||||||||||||||||||||||||||||||||||||||||||||||||||||||||||||||||||||||||||||||||||||||||||||||||||||||||||||||||||||||||||||||||||||||||||||||||||||||||||||||||||||||||||||||||||||||||||||||||||||||||||||||||||||||||||||||||||||||||||||||||||||||||||||||||||||||||||||||||||||||||||||||||||||||||||||||||||
Oncogene 1 | Significant driver gene in | |||||||||||||||||||||||||||||||||||||||||||||||||||||||||||||||||||||||||||||||||||||||||||||||||||||||||||||||||||||||||||||||||||||||||||||||||||||||||||||||||||||||||||||||||||||||||||||||||||||||||||||||||||||||||||||||||||||||||||||||||||||||||||||||||||||||||||||||||||||||||||||||||||||||||||||||||||||||||
| cf) number; DB name 1 Oncogene; http://nar.oxfordjournals.org/content/35/suppl_1/D721.long, 2 Tumor Suppressor gene; https://bioinfo.uth.edu/TSGene/, 3 Cancer Gene Census; http://www.nature.com/nrc/journal/v4/n3/abs/nrc1299.html, 4 CancerGenes; http://nar.oxfordjournals.org/content/35/suppl_1/D721.long, 5 Network of Cancer Gene; http://ncg.kcl.ac.uk/index.php, 1Therapeutic Vulnerabilities in Cancer; http://cbio.mskcc.org/cancergenomics/statius/ |
| REACTOME_METABOLISM_OF_PROTEINS | |
| OMIM | 608369; gene. |
| Orphanet | |
| Disease | KEGG Disease: GALNT13 |
| MedGen: GALNT13 (Human Medical Genetics with Condition) | |
| ClinVar: GALNT13 | |
| Phenotype | MGI: GALNT13 (International Mouse Phenotyping Consortium) |
| PhenomicDB: GALNT13 | |
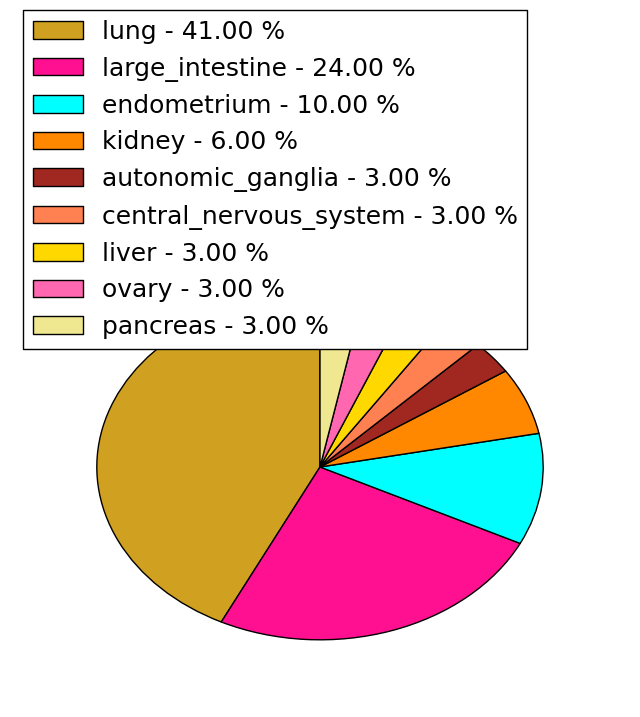
| Mutations for GALNT13 |
| * Under tables are showing count per each tissue to give us broad intuition about tissue specific mutation patterns.You can go to the detailed page for each mutation database's web site. |
| - Statistics for Tissue and Mutation type | Top |
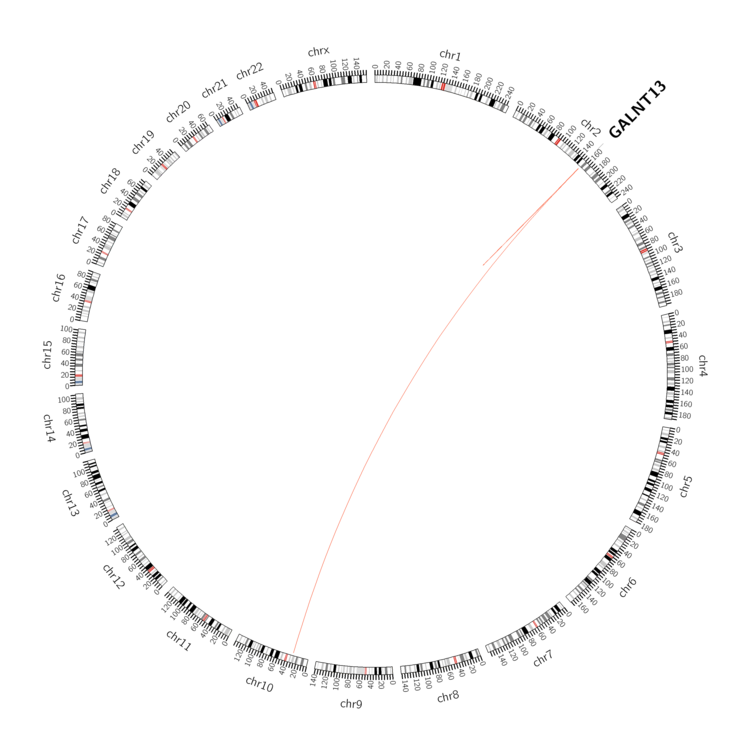 |
| - For Inter-chromosomal Variations |
| * Inter-chromosomal variantions includes 'interchromosomal amplicon to amplicon', 'interchromosomal amplicon to non-amplified dna', 'interchromosomal insertion', 'Interchromosomal unknown type'. |
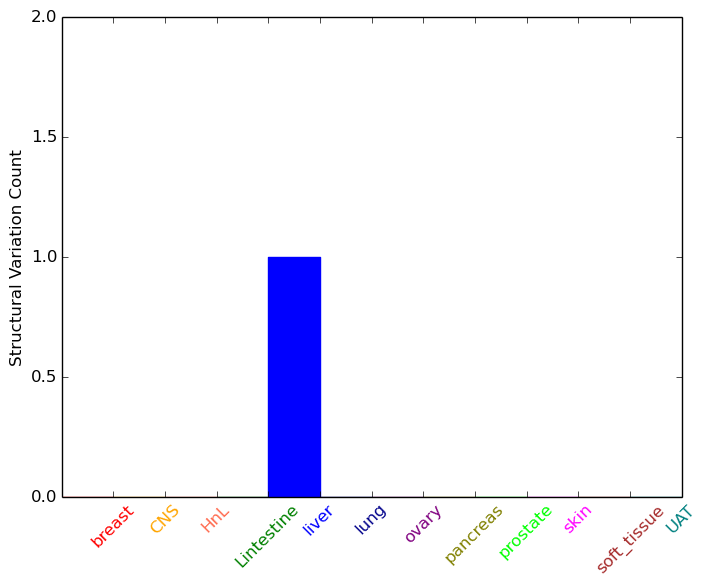 |
| - For Intra-chromosomal Variations |
| * Intra-chromosomal variantions includes 'intrachromosomal amplicon to amplicon', 'intrachromosomal amplicon to non-amplified dna', 'intrachromosomal deletion', 'intrachromosomal fold-back inversion', 'intrachromosomal inversion', 'intrachromosomal tandem duplication', 'Intrachromosomal unknown type', 'intrachromosomal with inverted orientation', 'intrachromosomal with non-inverted orientation'. |
 |
| Sample | Symbol_a | Chr_a | Start_a | End_a | Symbol_b | Chr_b | Start_b | End_b |
| liver | GALNT13 | chr2 | 155281309 | 155281309 | chr10 | 29233283 | 29233283 | |
| ovary | GALNT13 | chr2 | 154792030 | 154792050 | GALNT13 | chr2 | 154795397 | 154795417 |
| ovary | GALNT13 | chr2 | 154897514 | 154897534 | GALNT13 | chr2 | 154929979 | 154929999 |
| ovary | GALNT13 | chr2 | 154898956 | 154898976 | GALNT13 | chr2 | 154899103 | 154899123 |
| ovary | GALNT13 | chr2 | 155060396 | 155060416 | GALNT13 | chr2 | 155225724 | 155225744 |
| ovary | GALNT13 | chr2 | 155069331 | 155069351 | GALNT13 | chr2 | 155069561 | 155069581 |
| ovary | GALNT13 | chr2 | 155154989 | 155155189 | GALNT13 | chr2 | 155155282 | 155155482 |
| ovary | GALNT13 | chr2 | 155155018 | 155155038 | GALNT13 | chr2 | 155155421 | 155155441 |
| ovary | GALNT13 | chr2 | 155199393 | 155199413 | GALNT13 | chr2 | 155201245 | 155201265 |
| ovary | GALNT13 | chr2 | 155203494 | 155203514 | GALNT13 | chr2 | 155200879 | 155200899 |
| ovary | GALNT13 | chr2 | 155280058 | 155280078 | GALNT13 | chr2 | 155282761 | 155282781 |
| pancreas | GALNT13 | chr2 | 155200929 | 155200949 | GALNT13 | chr2 | 155200866 | 155200886 |
| cf) Tissue number; Tissue name (1;Breast, 2;Central_nervous_system, 3;Haematopoietic_and_lymphoid_tissue, 4;Large_intestine, 5;Liver, 6;Lung, 7;Ovary, 8;Pancreas, 9;Prostate, 10;Skin, 11;Soft_tissue, 12;Upper_aerodigestive_tract) |
| * From mRNA Sanger sequences, Chitars2.0 arranged chimeric transcripts. This table shows GALNT13 related fusion information. |
| ID | Head Gene | Tail Gene | Accession | Gene_a | qStart_a | qEnd_a | Chromosome_a | tStart_a | tEnd_a | Gene_a | qStart_a | qEnd_a | Chromosome_a | tStart_a | tEnd_a |
| BM931973 | AKAP9 | 160 | 333 | 7 | 91725929 | 91726102 | GALNT13 | 319 | 338 | 2 | 155004397 | 155004416 | |
| Z97017 | GALNT13 | 1 | 1585 | 2 | 155153258 | 155154839 | USP34 | 1585 | 1748 | 2 | 61479516 | 61479679 | |
| DW462544 | GALNT13 | 17 | 219 | 2 | 155100531 | 155100733 | GALNT13 | 218 | 368 | 2 | 155099822 | 155099972 | |
| BF665493 | PRKCA | 1 | 387 | 17 | 64511411 | 64511798 | GALNT13 | 368 | 394 | 2 | 154989282 | 154989308 | |
| Top |
| Mutation type/ Tissue ID | brca | cns | cerv | endome | haematopo | kidn | Lintest | liver | lung | ns | ovary | pancre | prost | skin | stoma | thyro | urina | |||
| Total # sample | 1 | 2 | 2 | 3 | 5 | 4 | 1 | 1 | 1 | |||||||||||
| GAIN (# sample) | 1 | 2 | 1 | 3 | 1 | 1 | 1 | 1 | ||||||||||||
| LOSS (# sample) | 1 | 5 | 3 |
| cf) Tissue ID; Tissue type (1; Breast, 2; Central_nervous_system, 3; Cervix, 4; Endometrium, 5; Haematopoietic_and_lymphoid_tissue, 6; Kidney, 7; Large_intestine, 8; Liver, 9; Lung, 10; NS, 11; Ovary, 12; Pancreas, 13; Prostate, 14; Skin, 15; Stomach, 16; Thyroid, 17; Urinary_tract) |
| Top |
|
 |
| Top |
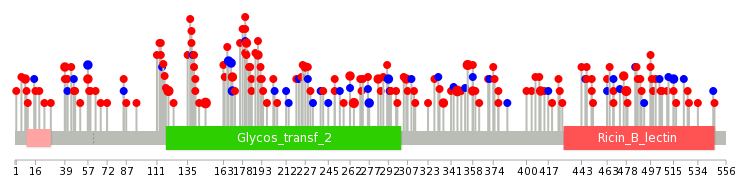
| Stat. for Non-Synonymous SNVs (# total SNVs=147) | (# total SNVs=29) |
 |  |
(# total SNVs=1) | (# total SNVs=0) |
 |
| Top |
| * When you move the cursor on each content, you can see more deailed mutation information on the Tooltip. Those are primary_site,primary_histology,mutation(aa),pubmedID. |
| GRCh37 position | Mutation(aa) | Unique sampleID count |
| chr2:155098678-155098678 | p.E149D | 4 |
| chr2:155157982-155157982 | p.R346W | 4 |
| chr2:155102455-155102455 | p.E273* | 4 |
| chr2:155098590-155098590 | p.V120A | 3 |
| chr2:155295140-155295140 | p.D478N | 3 |
| chr2:155102432-155102432 | p.R265H | 3 |
| chr2:155158006-155158006 | p.P354S | 3 |
| chr2:155158018-155158018 | p.G358C | 2 |
| chr2:155102466-155102466 | p.R276S | 2 |
| chr2:154801034-154801034 | p.K8N | 2 |
| Top |
|
 |
| Point Mutation/ Tissue ID | 1 | 2 | 3 | 4 | 5 | 6 | 7 | 8 | 9 | 10 | 11 | 12 | 13 | 14 | 15 | 16 | 17 | 18 | 19 | 20 |
| # sample | 1 | 2 | 17 | 3 | 5 | 5 | 19 | 15 | 4 | 1 | 28 | 10 | 12 | |||||||
| # mutation | 1 | 2 | 19 | 3 | 6 | 5 | 26 | 15 | 4 | 1 | 32 | 10 | 15 | |||||||
| nonsynonymous SNV | 1 | 2 | 14 | 2 | 5 | 3 | 24 | 12 | 3 | 23 | 7 | 12 | ||||||||
| synonymous SNV | 5 | 1 | 1 | 2 | 2 | 3 | 1 | 1 | 9 | 3 | 3 |
| cf) Tissue ID; Tissue type (1; BLCA[Bladder Urothelial Carcinoma], 2; BRCA[Breast invasive carcinoma], 3; CESC[Cervical squamous cell carcinoma and endocervical adenocarcinoma], 4; COAD[Colon adenocarcinoma], 5; GBM[Glioblastoma multiforme], 6; Glioma Low Grade, 7; HNSC[Head and Neck squamous cell carcinoma], 8; KICH[Kidney Chromophobe], 9; KIRC[Kidney renal clear cell carcinoma], 10; KIRP[Kidney renal papillary cell carcinoma], 11; LAML[Acute Myeloid Leukemia], 12; LUAD[Lung adenocarcinoma], 13; LUSC[Lung squamous cell carcinoma], 14; OV[Ovarian serous cystadenocarcinoma ], 15; PAAD[Pancreatic adenocarcinoma], 16; PRAD[Prostate adenocarcinoma], 17; SKCM[Skin Cutaneous Melanoma], 18:STAD[Stomach adenocarcinoma], 19:THCA[Thyroid carcinoma], 20:UCEC[Uterine Corpus Endometrial Carcinoma]) |
| Top |
| * We represented just top 10 SNVs. When you move the cursor on each content, you can see more deailed mutation information on the Tooltip. Those are primary_site, primary_histology, mutation(aa), pubmedID. |
| Genomic Position | Mutation(aa) | Unique sampleID count |
| chr2:155158006 | p.P354S | 3 |
| chr2:155158018 | p.E167E | 2 |
| chr2:155102432 | p.L487F | 2 |
| chr2:155099233 | p.Y169Y | 2 |
| chr2:155099239 | p.E39G | 2 |
| chr2:154801126 | p.G358C | 2 |
| chr2:155295135 | p.E304D | 2 |
| chr2:155115588 | p.G306E | 2 |
| chr2:155295167 | p.R476Q | 2 |
| chr2:155115593 | p.R265H | 2 |
| * Copy number data were extracted from TCGA using R package TCGA-Assembler. The URLs of all public data files on TCGA DCC data server were gathered on Jan-05-2015. Function ProcessCNAData in TCGA-Assembler package was used to obtain gene-level copy number value which is calculated as the average copy number of the genomic region of a gene. |
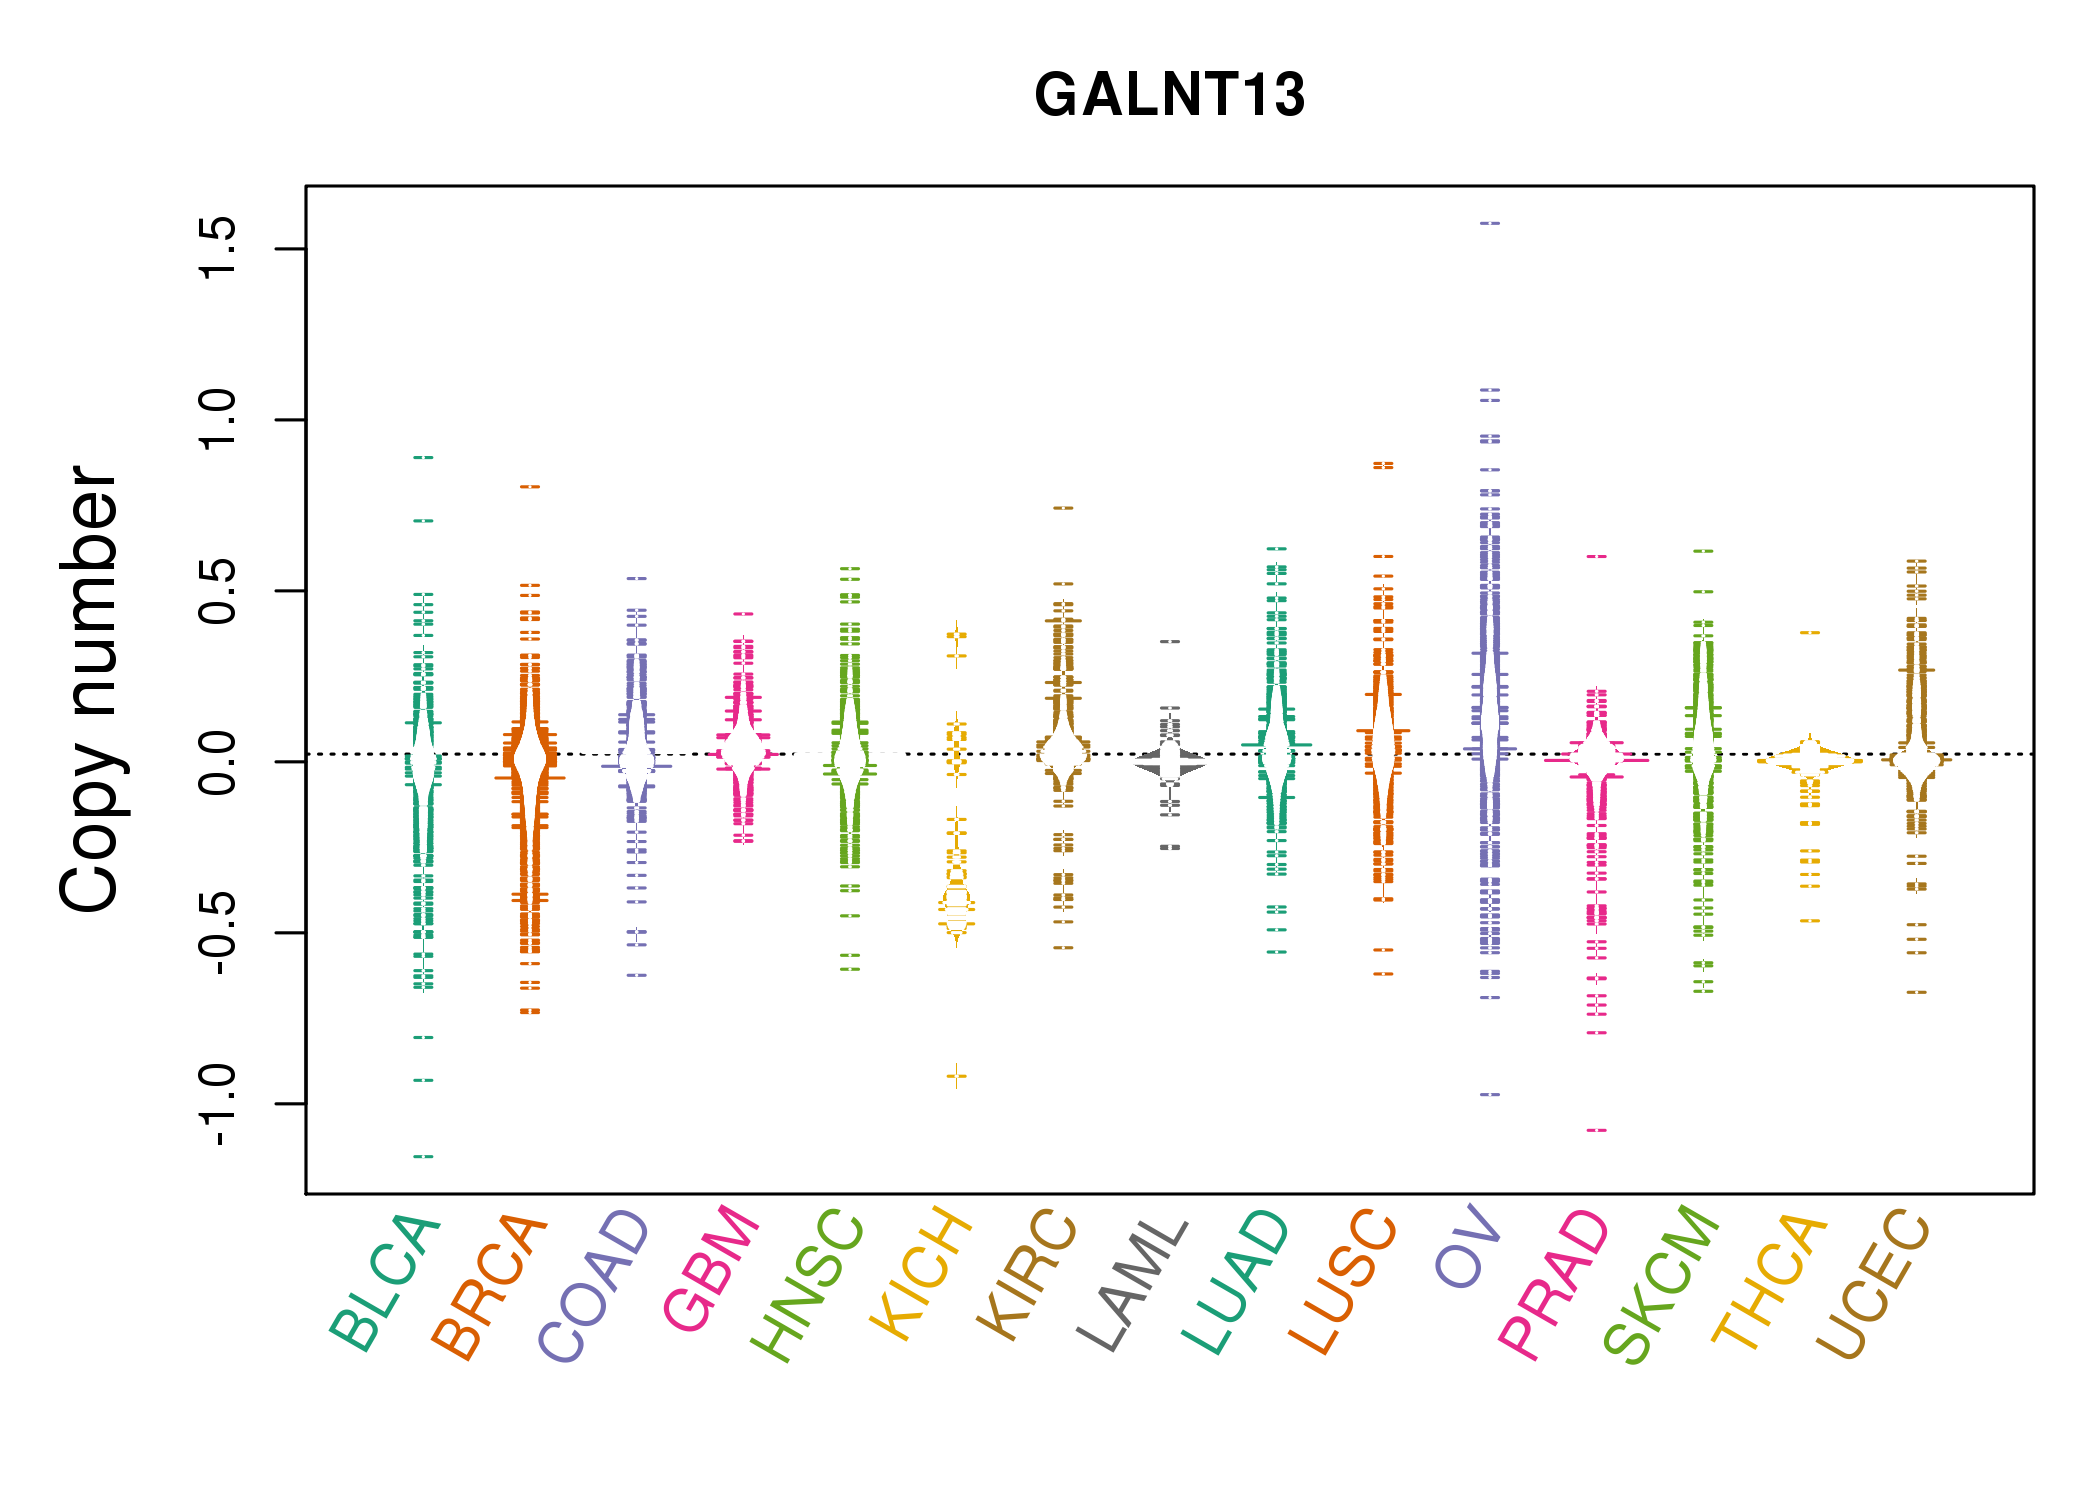 |
| cf) Tissue ID[Tissue type]: BLCA[Bladder Urothelial Carcinoma], BRCA[Breast invasive carcinoma], CESC[Cervical squamous cell carcinoma and endocervical adenocarcinoma], COAD[Colon adenocarcinoma], GBM[Glioblastoma multiforme], Glioma Low Grade, HNSC[Head and Neck squamous cell carcinoma], KICH[Kidney Chromophobe], KIRC[Kidney renal clear cell carcinoma], KIRP[Kidney renal papillary cell carcinoma], LAML[Acute Myeloid Leukemia], LUAD[Lung adenocarcinoma], LUSC[Lung squamous cell carcinoma], OV[Ovarian serous cystadenocarcinoma ], PAAD[Pancreatic adenocarcinoma], PRAD[Prostate adenocarcinoma], SKCM[Skin Cutaneous Melanoma], STAD[Stomach adenocarcinoma], THCA[Thyroid carcinoma], UCEC[Uterine Corpus Endometrial Carcinoma] |
| Top |
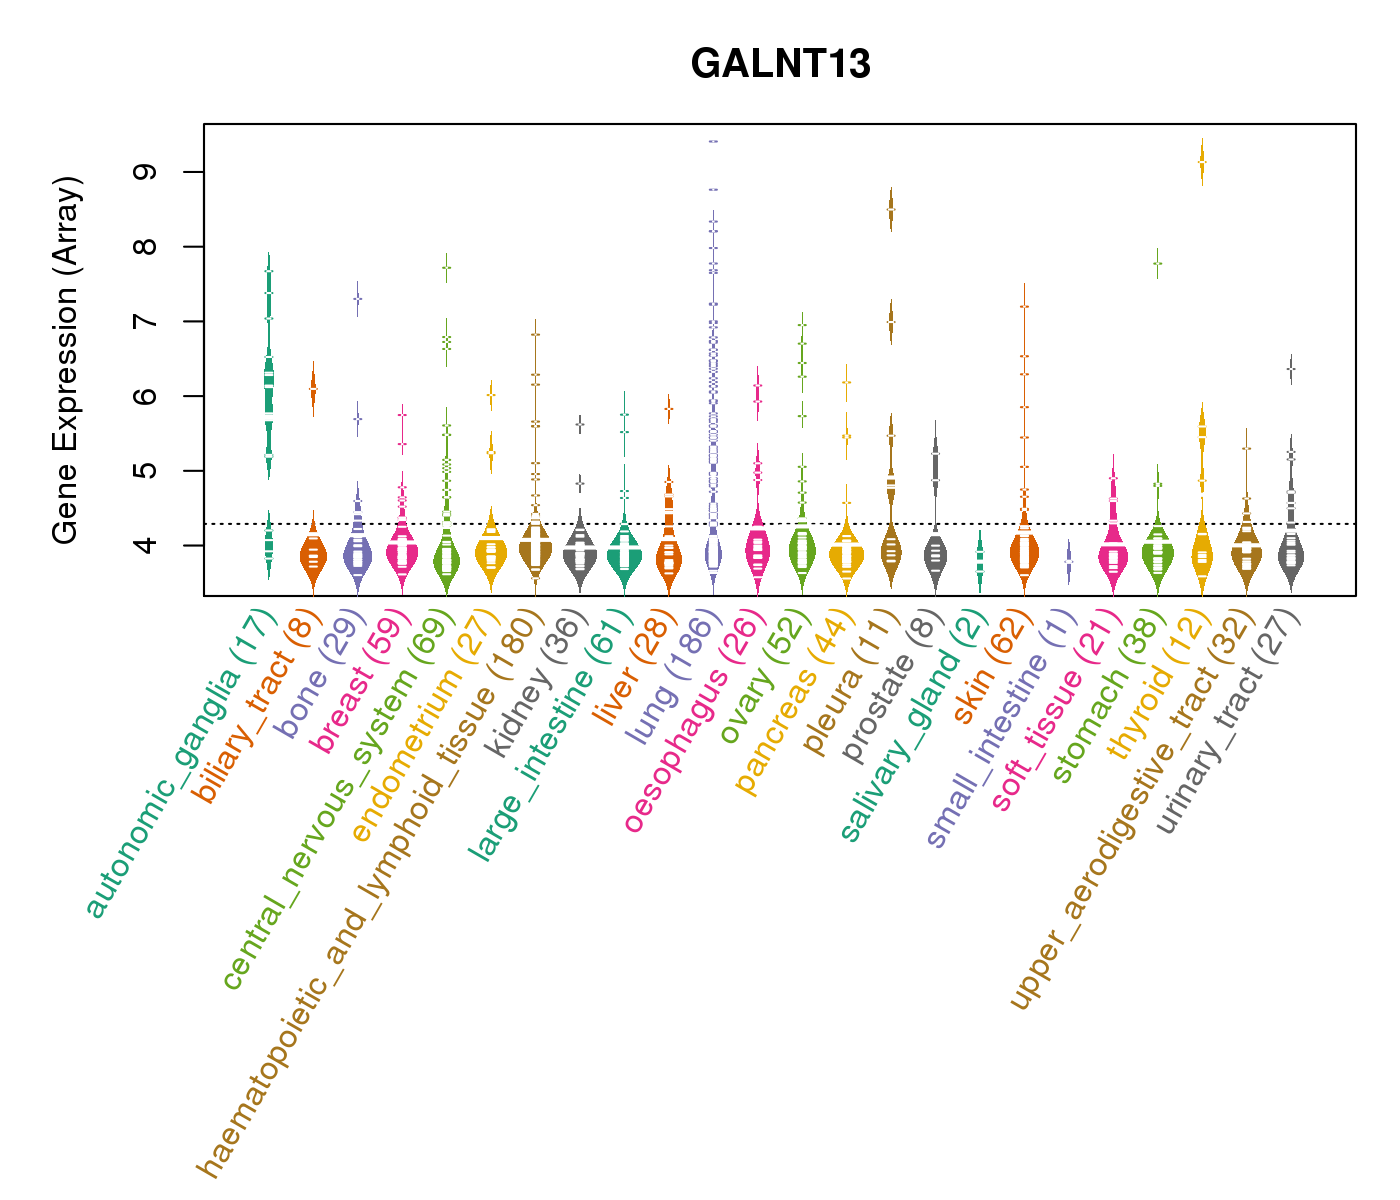
| Gene Expression for GALNT13 |
| * CCLE gene expression data were extracted from CCLE_Expression_Entrez_2012-10-18.res: Gene-centric RMA-normalized mRNA expression data. |
 |
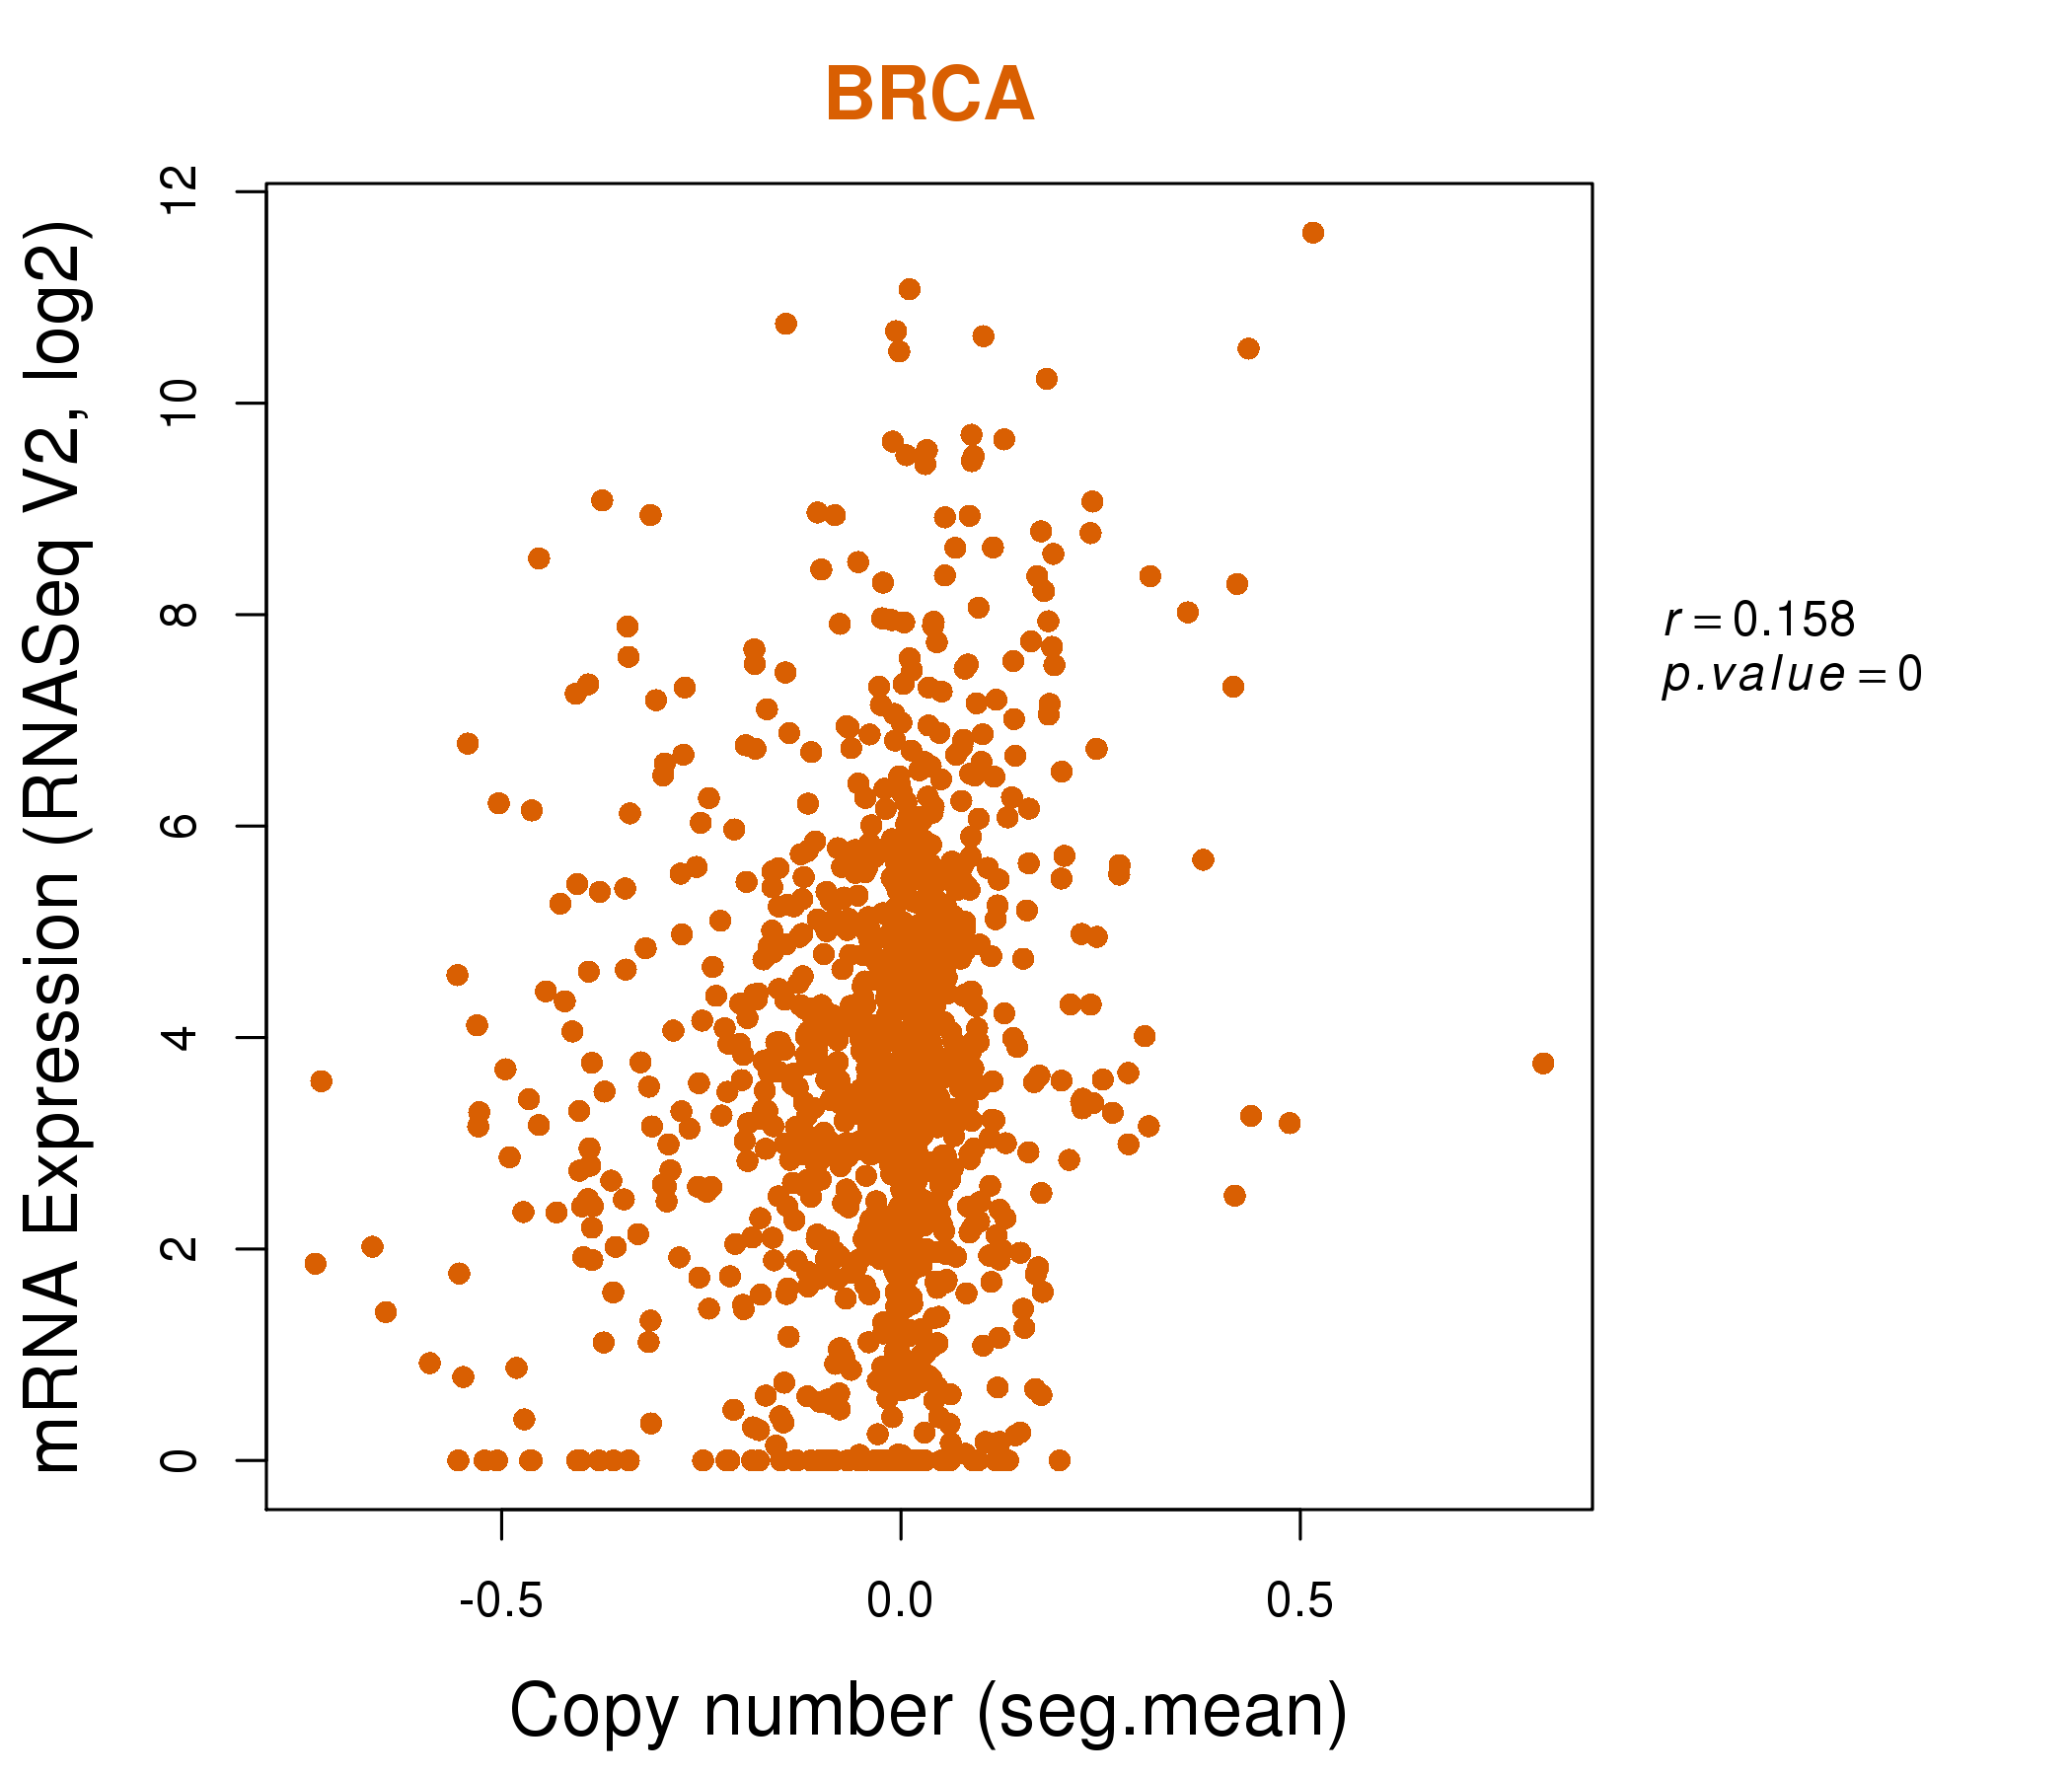
| * Normalized gene expression data of RNASeqV2 was extracted from TCGA using R package TCGA-Assembler. The URLs of all public data files on TCGA DCC data server were gathered at Jan-05-2015. Only eight cancer types have enough normal control samples for differential expression analysis. (t test, adjusted p<0.05 (using Benjamini-Hochberg FDR)) |
 |
| Top |
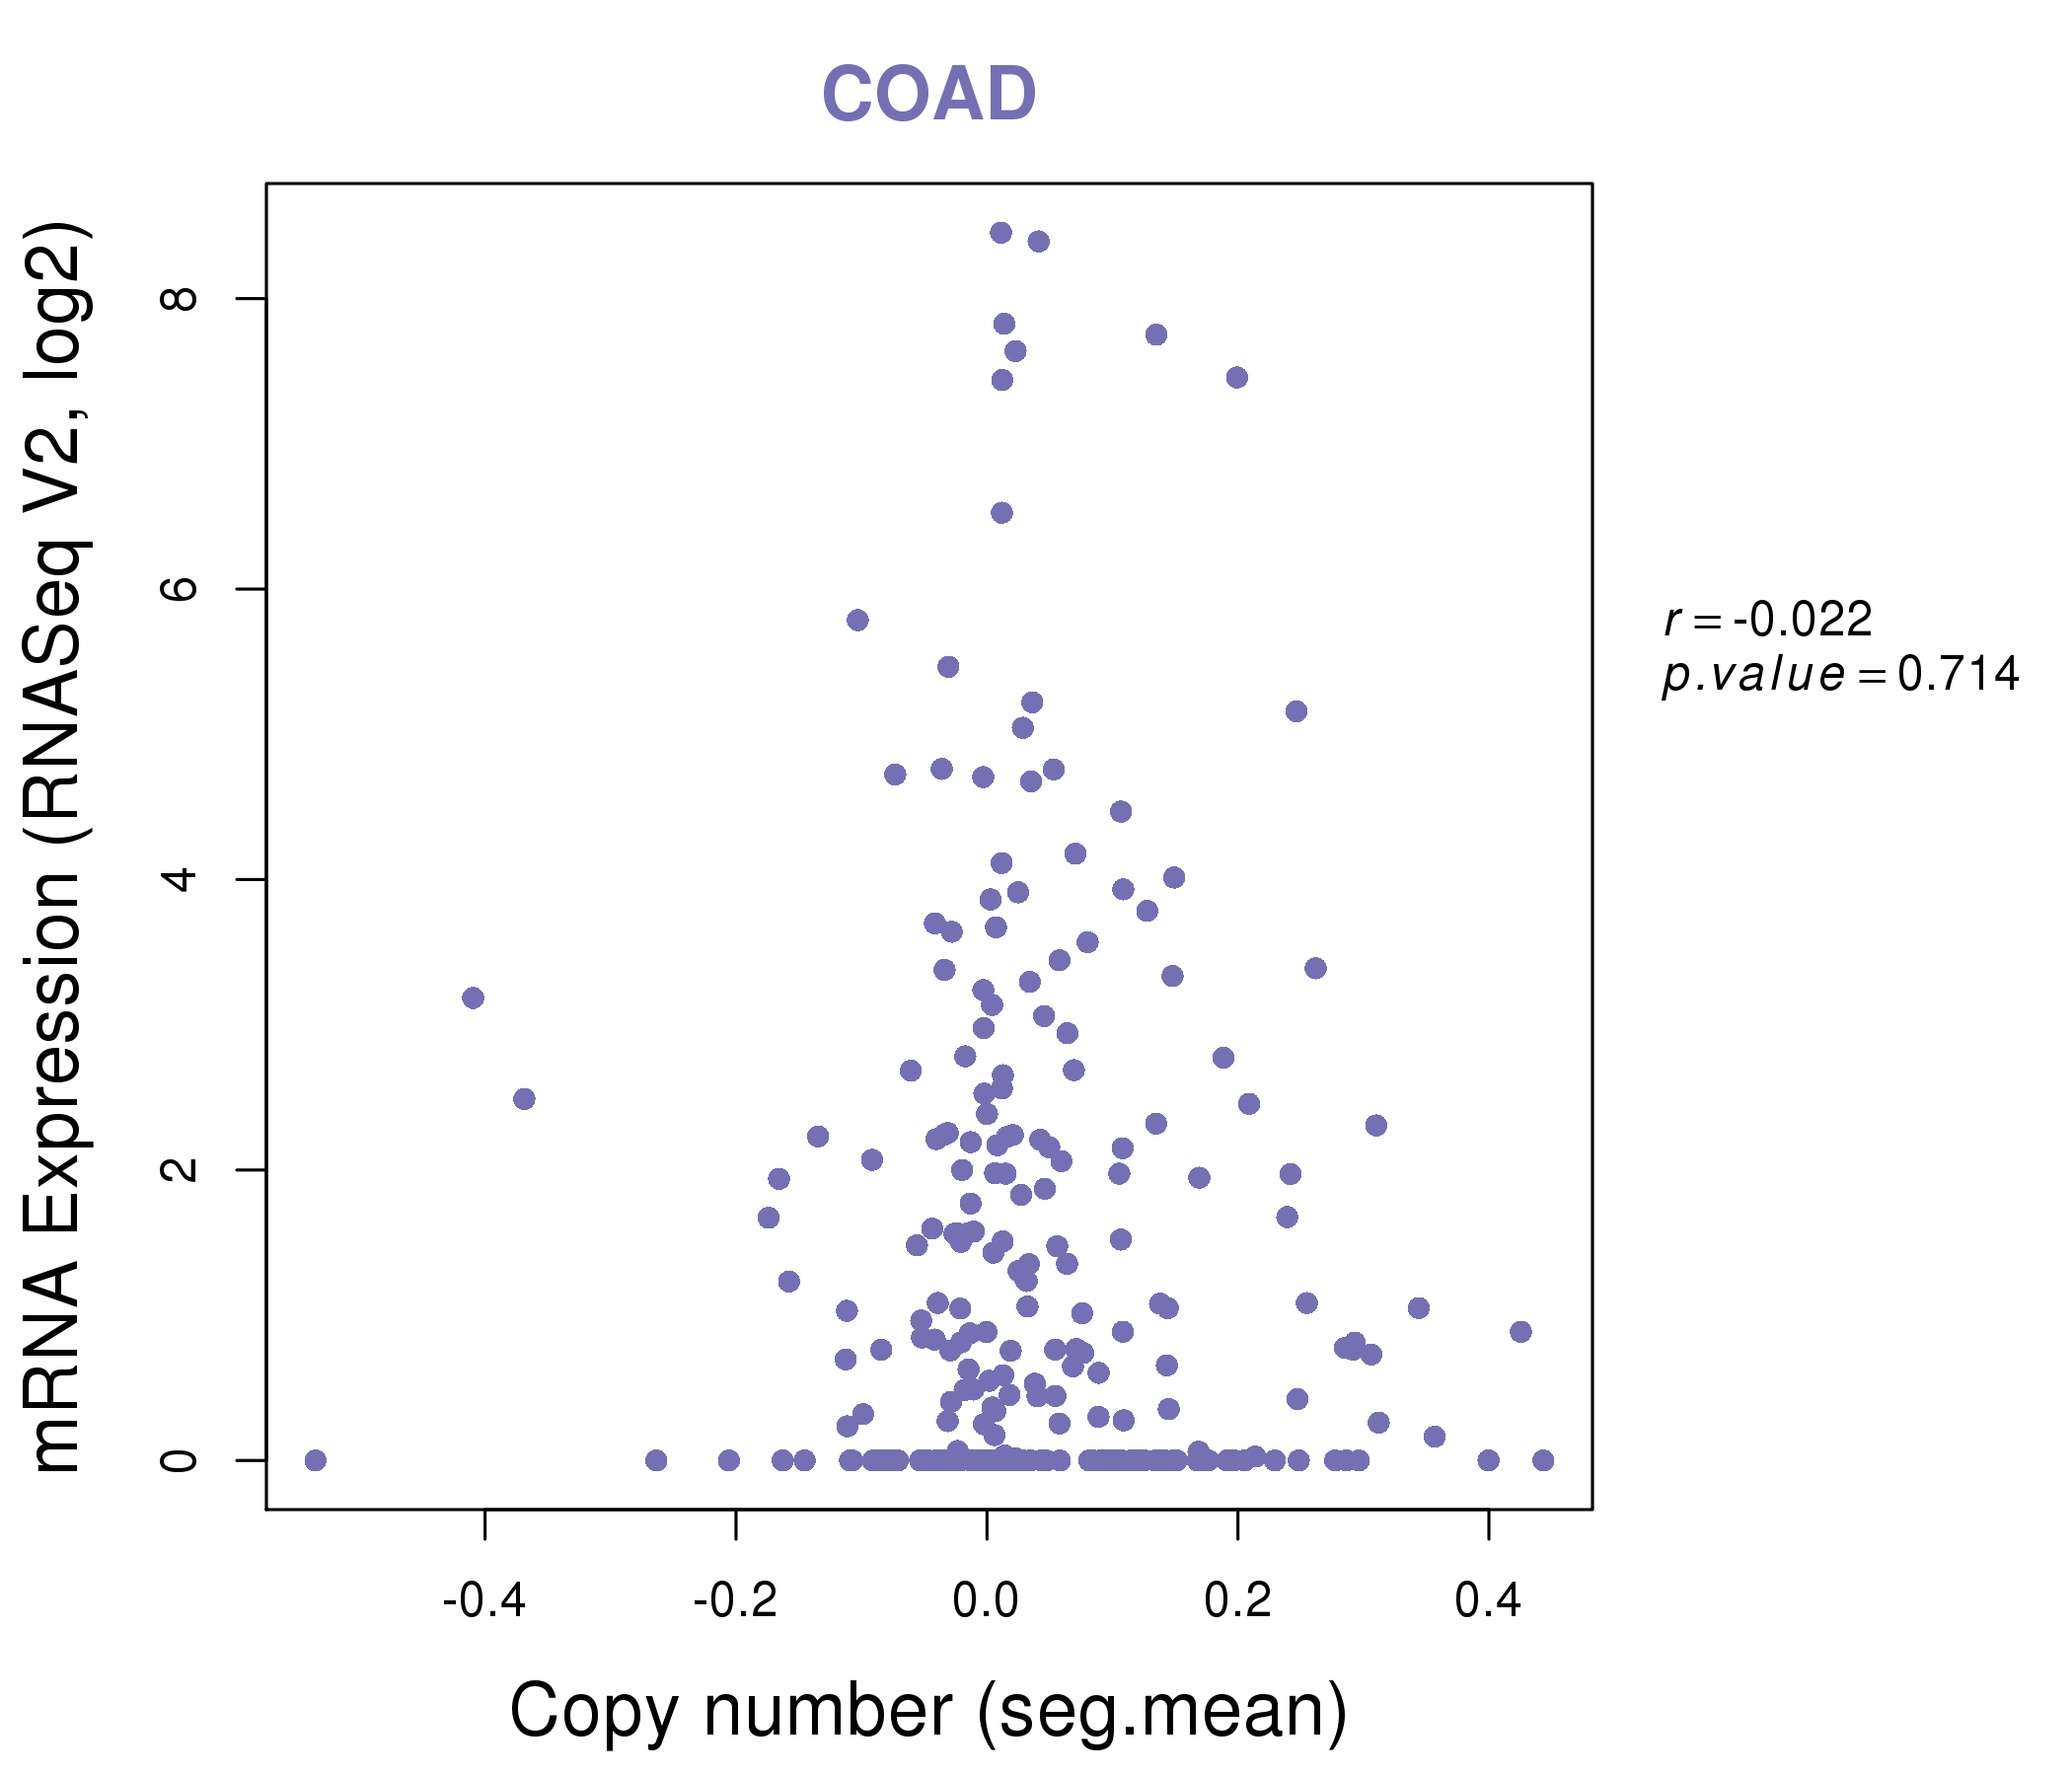
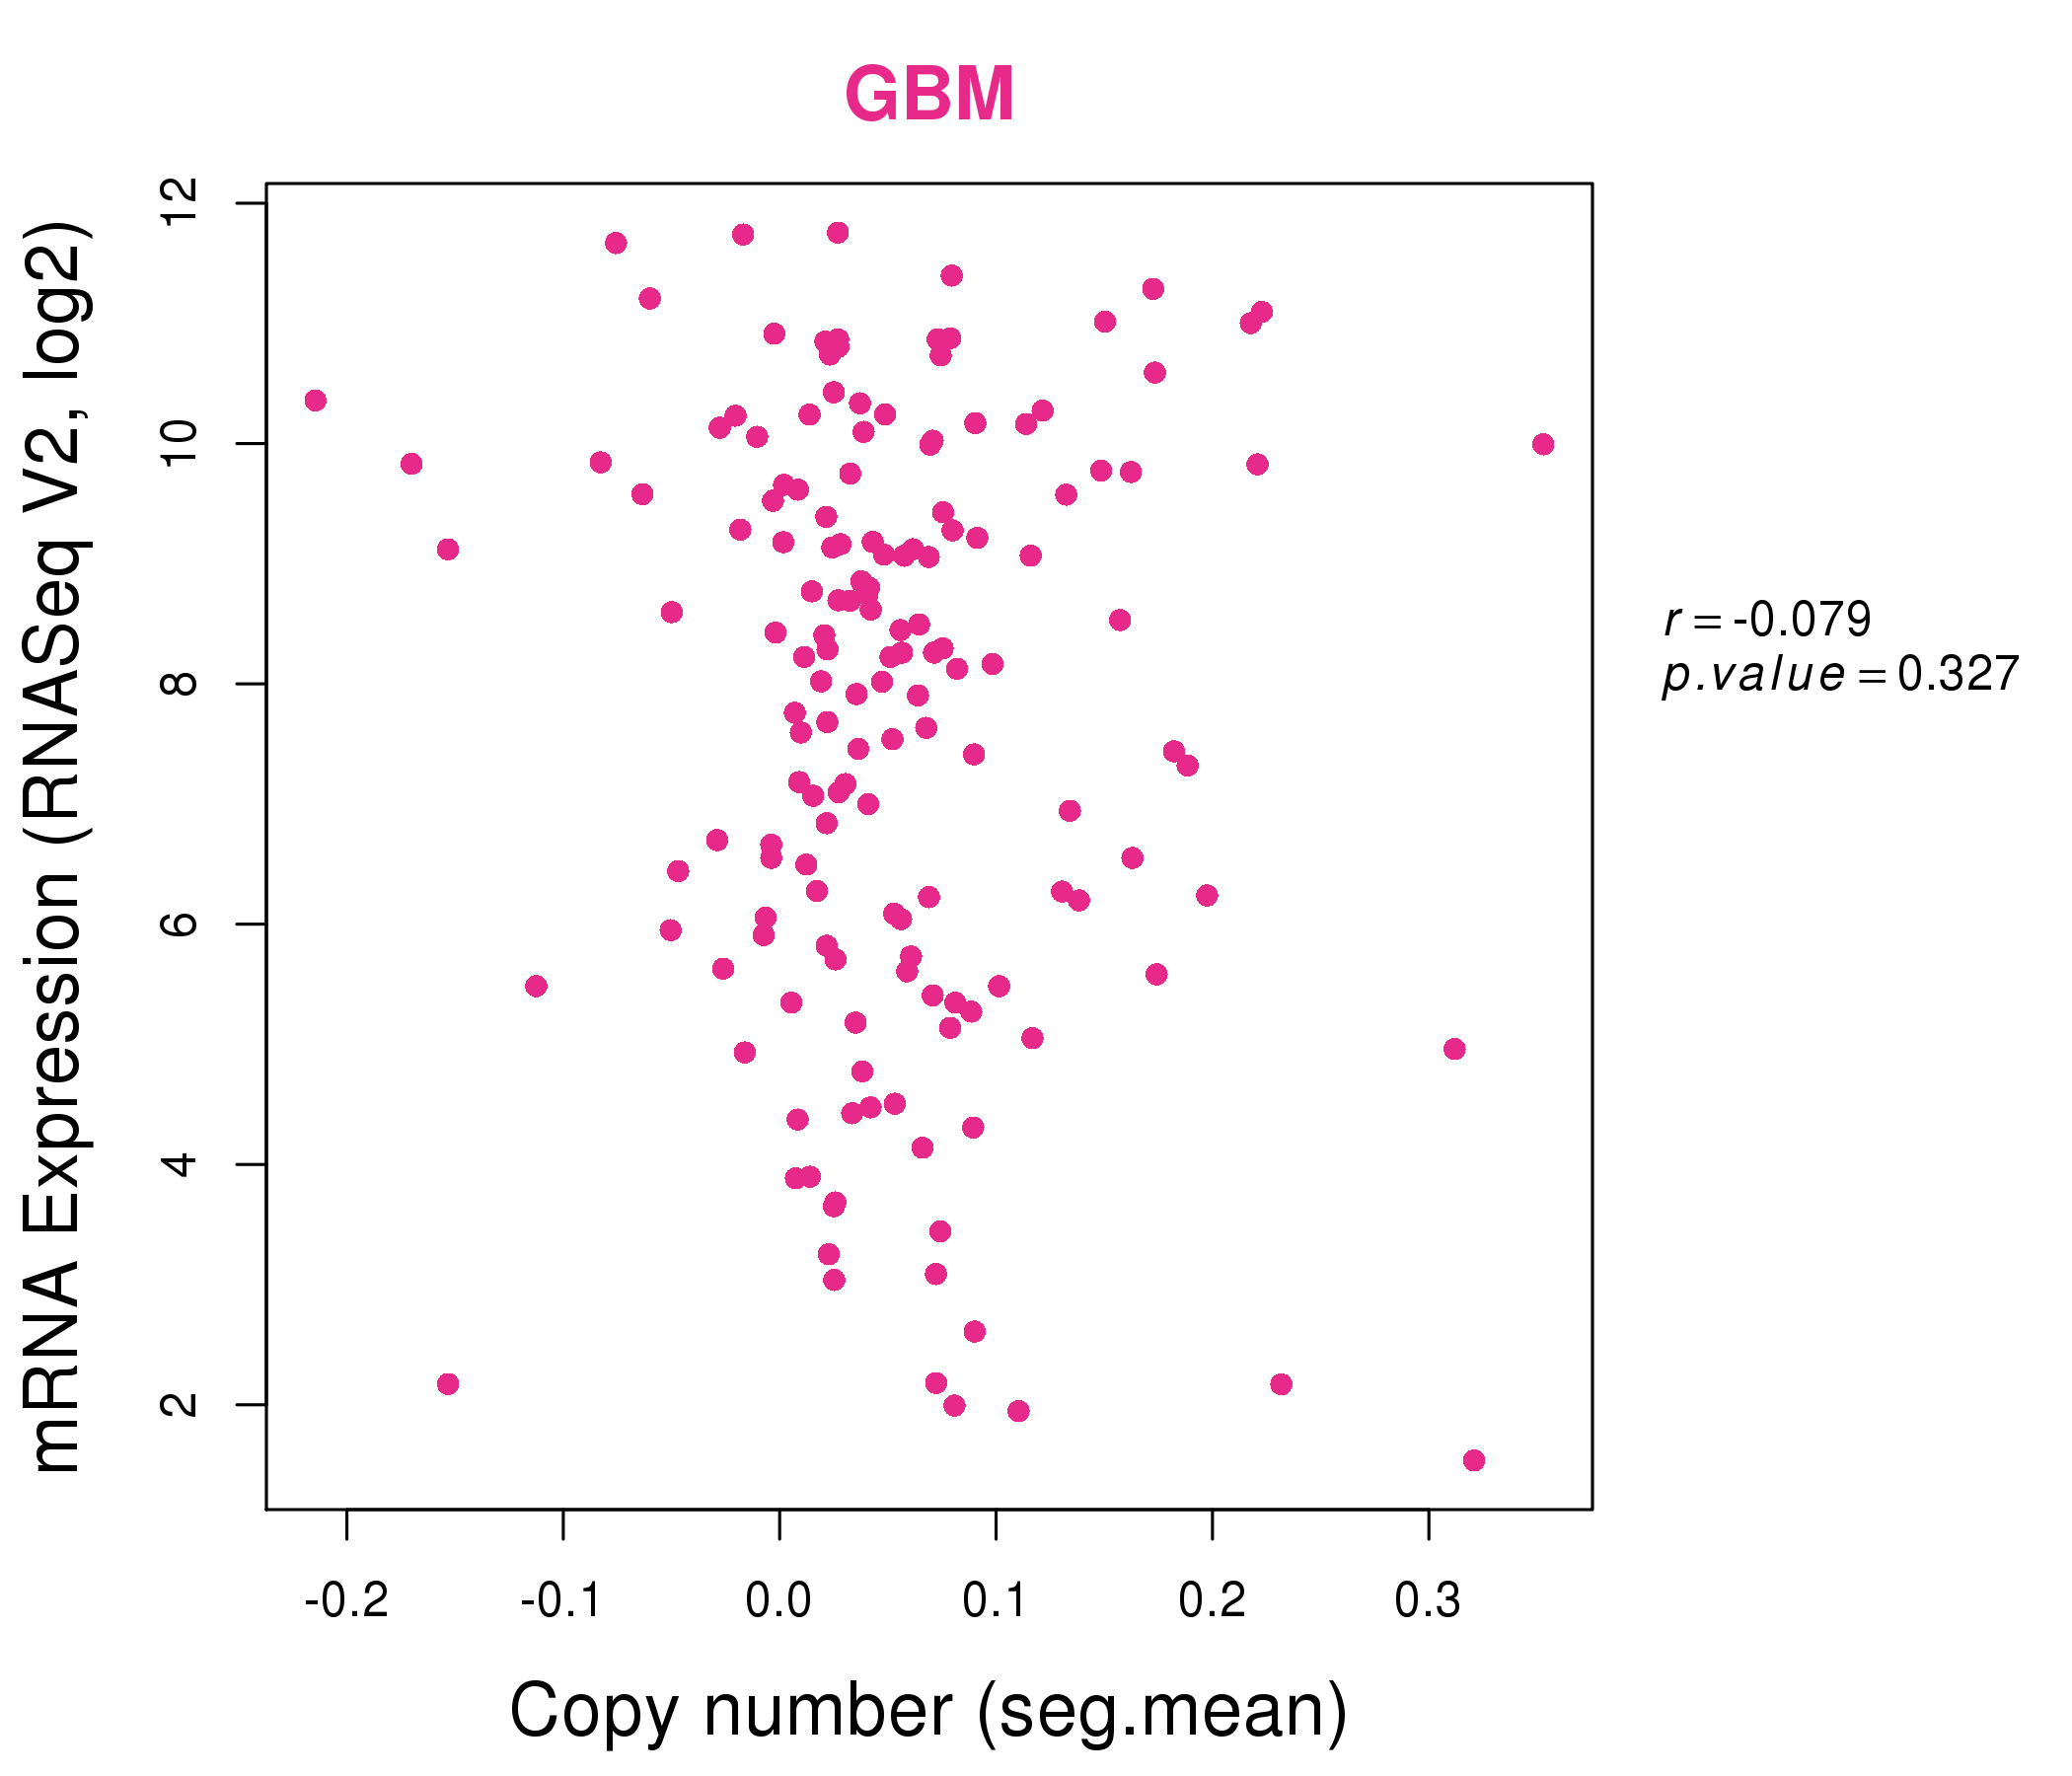
| * This plots show the correlation between CNV and gene expression. |
: Open all plots for all cancer types
 |
|
 |
|
| Top |
| Gene-Gene Network Information |
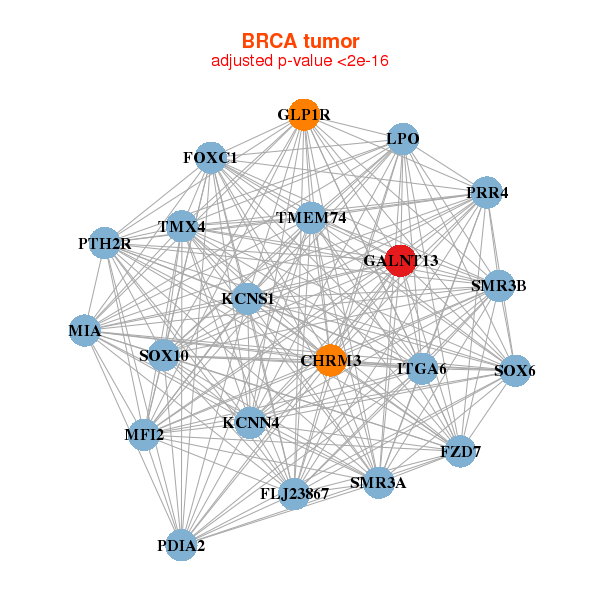
| * Co-Expression network figures were drawn using R package igraph. Only the top 20 genes with the highest correlations were shown. Red circle: input gene, orange circle: cell metabolism gene, sky circle: other gene |
: Open all plots for all cancer types
 |
|
| CHRM3,FLJ23867,FOXC1,FZD7,GALNT13,GLP1R,ITGA6, KCNN4,KCNS1,LPO,MFI2,MIA,PDIA2,PRR4, PTH2R,SMR3A,SMR3B,SOX10,SOX6,TMEM74,TMX4 | AKAP12,CLMP,MTURN,DDHD2,DOCK11,EHBP1,EPB41L2, FAM92A1,GALNT13,GCOM1,GLYAT,ITSN1,MARK1,NMT2, PALM2-AKAP2,PALMD,PCDH9,PYGL,SAR1A,SEPT11,STX7 |
 |
|
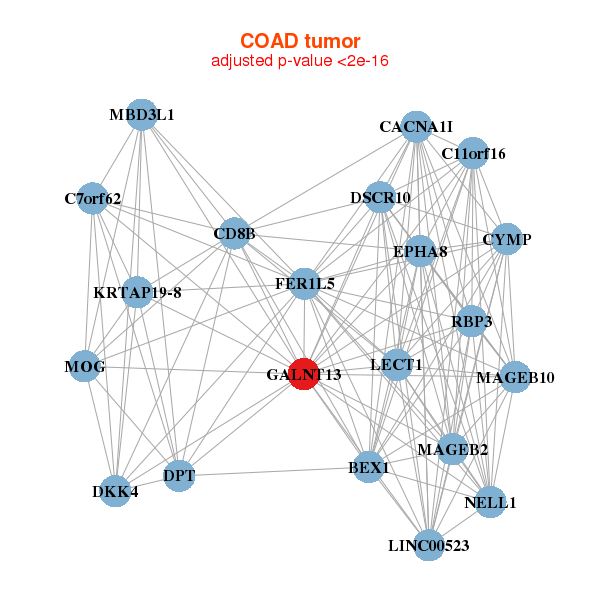
| BEX1,C11orf16,LINC00523,CACNA1I,CD8B,CYMP,DKK4, DPT,DSCR10,EPHA8,FER1L5,GALNT13,KRTAP19-8,LECT1, MAGEB10,MAGEB2,MBD3L1,C7orf62,MOG,NELL1,RBP3 | ANO3,ATCAY,ATP2B2,DIRAS2,ECM2,FGF14,FZD7, GALNT13,GARNL3,GRIA2,HMP19,HS6ST3,NAPB,NDRG4, PHOX2B,PPP2R2C,PRIMA1,SYT1,SYT5,SYT9,TPPP3 |


| * Co-Expression network figures were drawn using R package igraph. Only the top 20 genes with the highest correlations were shown. Red circle: input gene, orange circle: cell metabolism gene, sky circle: other gene |
: Open all plots for all cancer types
| Top |
: Open all interacting genes' information including KEGG pathway for all interacting genes from DAVID
| Top |
| Pharmacological Information for GALNT13 |
| There's no related Drug. |
| Top |
| Cross referenced IDs for GALNT13 |
| * We obtained these cross-references from Uniprot database. It covers 150 different DBs, 18 categories. http://www.uniprot.org/help/cross_references_section |
: Open all cross reference information
|
Copyright © 2016-Present - The Univsersity of Texas Health Science Center at Houston @ |