|
|||||||||||||||||||||||||||||||||||||||||||||||||||||||||||||||||||||||||||||||||||||||||||||||||||||||||||||||||||||||||||||||||||||||||||||||||||||||||||||||||||||||||||||||||||||||||||||||||||||||||||||||||||||||||||||||||||||||||||||||||||||||||||||||||||||||||||||||||||||||||||||||||||||||||||||||||||||||||||||||||||||||||||||||||||||||||||||||||||||
| |
| Phenotypic Information (metabolism pathway, cancer, disease, phenome) |
| |
| |
| Gene-Gene Network Information: Co-Expression Network, Interacting Genes & KEGG |
| |
|


| Gene Summary for ADCY9 |
| Top |
| Phenotypic Information for ADCY9(metabolism pathway, cancer, disease, phenome) |
| Cancer | CGAP: ADCY9 |
| Familial Cancer Database: ADCY9 | |
| * This gene is included in those cancer gene databases. |
|
|
|
|
|
| . | |||||||||||||||||||||||||||||||||||||||||||||||||||||||||||||||||||||||||||||||||||||||||||||||||||||||||||||||||||||||||||||||||||||||||||||||||||||||||||||||||||||||||||||||||||||||||||||||||||||||||||||||||||||||||||||||||||||||||||||||||||||||||||||||||||||||||||||||||||||||||||||||||||||||||||||||||||||||||||||||||||||||||||||||||||||||||||||||
Oncogene 1 | Significant driver gene in | ||||||||||||||||||||||||||||||||||||||||||||||||||||||||||||||||||||||||||||||||||||||||||||||||||||||||||||||||||||||||||||||||||||||||||||||||||||||||||||||||||||||||||||||||||||||||||||||||||||||||||||||||||||||||||||||||||||||||||||||||||||||||||||||||||||||||||||||||||||||||||||||||||||||||||||||||||||||||||||||||||||||||||||||||||||||||||||||||||||
| cf) number; DB name 1 Oncogene; http://nar.oxfordjournals.org/content/35/suppl_1/D721.long, 2 Tumor Suppressor gene; https://bioinfo.uth.edu/TSGene/, 3 Cancer Gene Census; http://www.nature.com/nrc/journal/v4/n3/abs/nrc1299.html, 4 CancerGenes; http://nar.oxfordjournals.org/content/35/suppl_1/D721.long, 5 Network of Cancer Gene; http://ncg.kcl.ac.uk/index.php, 1Therapeutic Vulnerabilities in Cancer; http://cbio.mskcc.org/cancergenomics/statius/ |
| KEGG_PURINE_METABOLISM REACTOME_INTEGRATION_OF_ENERGY_METABOLISM | |
| OMIM | 603302; gene. 603302; gene. |
| Orphanet | |
| Disease | KEGG Disease: ADCY9 |
| MedGen: ADCY9 (Human Medical Genetics with Condition) | |
| ClinVar: ADCY9 | |
| Phenotype | MGI: ADCY9 (International Mouse Phenotyping Consortium) |
| PhenomicDB: ADCY9 | |
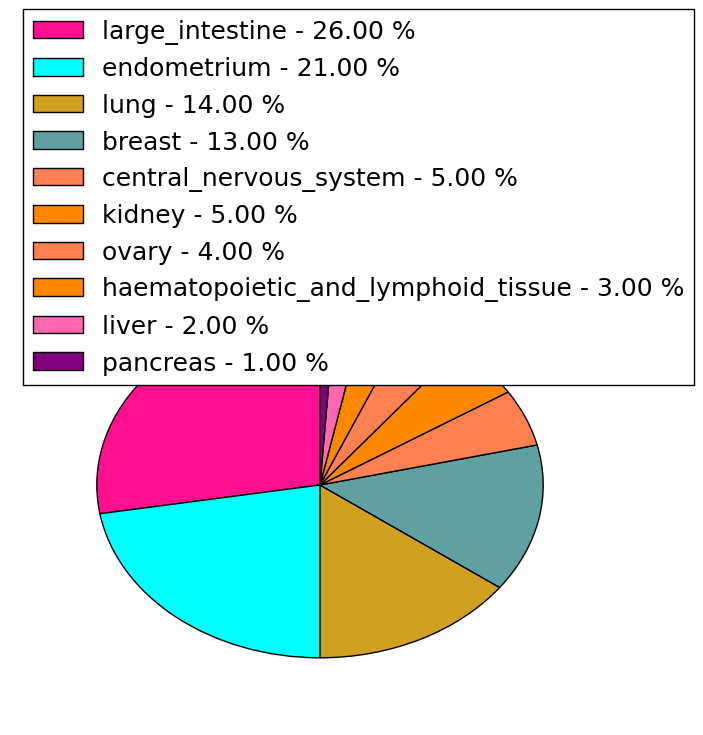
| Mutations for ADCY9 |
| * Under tables are showing count per each tissue to give us broad intuition about tissue specific mutation patterns.You can go to the detailed page for each mutation database's web site. |
| - Statistics for Tissue and Mutation type | Top |
 |
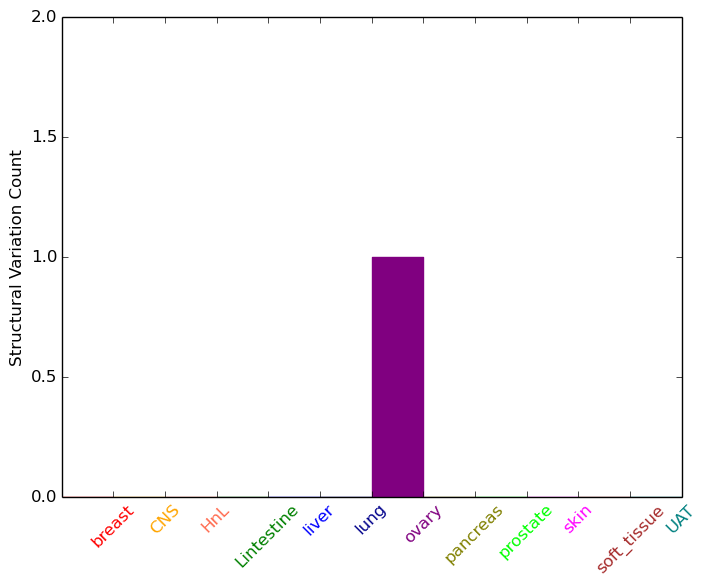
| - For Inter-chromosomal Variations |
| * Inter-chromosomal variantions includes 'interchromosomal amplicon to amplicon', 'interchromosomal amplicon to non-amplified dna', 'interchromosomal insertion', 'Interchromosomal unknown type'. |
 |
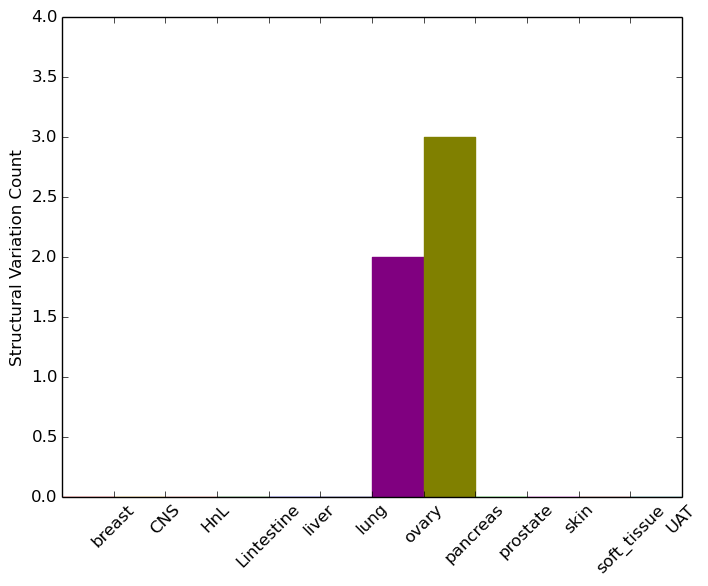
| - For Intra-chromosomal Variations |
| * Intra-chromosomal variantions includes 'intrachromosomal amplicon to amplicon', 'intrachromosomal amplicon to non-amplified dna', 'intrachromosomal deletion', 'intrachromosomal fold-back inversion', 'intrachromosomal inversion', 'intrachromosomal tandem duplication', 'Intrachromosomal unknown type', 'intrachromosomal with inverted orientation', 'intrachromosomal with non-inverted orientation'. |
 |
| Sample | Symbol_a | Chr_a | Start_a | End_a | Symbol_b | Chr_b | Start_b | End_b |
| ovary | ADCY9 | chr16 | 4082502 | 4082522 | ADCY9 | chr16 | 4098016 | 4098036 |
| ovary | ADCY9 | chr16 | 4114926 | 4114946 | ADCY9 | chr16 | 4117140 | 4117160 |
| pancreas | ADCY9 | chr16 | 4144271 | 4144291 | chr16 | 4166921 | 4166941 | |
| pancreas | ADCY9 | chr16 | 4157492 | 4157512 | ADCY9 | chr16 | 4102076 | 4102096 |
| cf) Tissue number; Tissue name (1;Breast, 2;Central_nervous_system, 3;Haematopoietic_and_lymphoid_tissue, 4;Large_intestine, 5;Liver, 6;Lung, 7;Ovary, 8;Pancreas, 9;Prostate, 10;Skin, 11;Soft_tissue, 12;Upper_aerodigestive_tract) |
| * From mRNA Sanger sequences, Chitars2.0 arranged chimeric transcripts. This table shows ADCY9 related fusion information. |
| ID | Head Gene | Tail Gene | Accession | Gene_a | qStart_a | qEnd_a | Chromosome_a | tStart_a | tEnd_a | Gene_a | qStart_a | qEnd_a | Chromosome_a | tStart_a | tEnd_a |
| BF871520 | ADCY9 | 1 | 68 | 16 | 4099044 | 4099111 | BGN | 59 | 160 | X | 152774633 | 152774735 | |
| BF854283 | ADCY9 | 9 | 173 | 16 | 4159374 | 4159539 | CTDSPL | 171 | 455 | 3 | 38025332 | 38025616 | |
| Top |
| Mutation type/ Tissue ID | brca | cns | cerv | endome | haematopo | kidn | Lintest | liver | lung | ns | ovary | pancre | prost | skin | stoma | thyro | urina | |||
| Total # sample | 4 | 5 | 1 | |||||||||||||||||
| GAIN (# sample) | 3 | 1 | ||||||||||||||||||
| LOSS (# sample) | 1 | 5 |
| cf) Tissue ID; Tissue type (1; Breast, 2; Central_nervous_system, 3; Cervix, 4; Endometrium, 5; Haematopoietic_and_lymphoid_tissue, 6; Kidney, 7; Large_intestine, 8; Liver, 9; Lung, 10; NS, 11; Ovary, 12; Pancreas, 13; Prostate, 14; Skin, 15; Stomach, 16; Thyroid, 17; Urinary_tract) |
| Top |
|
 |
| Top |
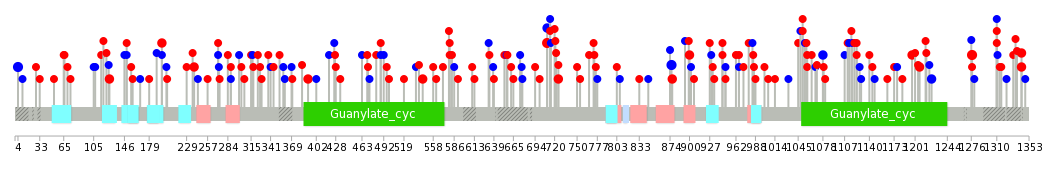
| Stat. for Non-Synonymous SNVs (# total SNVs=119) | (# total SNVs=50) |
 |  |
(# total SNVs=1) | (# total SNVs=1) |
 |  |
| Top |
| * When you move the cursor on each content, you can see more deailed mutation information on the Tooltip. Those are primary_site,primary_histology,mutation(aa),pubmedID. |
| GRCh37 position | Mutation(aa) | Unique sampleID count |
| chr16:4042225-4042225 | p.S710L | 3 |
| chr16:4016009-4016009 | p.E1277K | 3 |
| chr16:4165432-4165432 | p.P4P | 3 |
| chr16:4029168-4029168 | p.P876P | 3 |
| chr16:4165068-4165068 | p.A126T | 2 |
| chr16:4015810-4015810 | p.E1343G | 2 |
| chr16:4016604-4016604 | p.G1078G | 2 |
| chr16:4042224-4042224 | p.S710S | 2 |
| chr16:4016249-4016249 | p.M1197V | 2 |
| chr16:4015811-4015811 | p.E1343K | 2 |
| Top |
|
 |
| Point Mutation/ Tissue ID | 1 | 2 | 3 | 4 | 5 | 6 | 7 | 8 | 9 | 10 | 11 | 12 | 13 | 14 | 15 | 16 | 17 | 18 | 19 | 20 |
| # sample | 3 | 9 | 3 | 25 | 5 | 4 | 1 | 3 | 2 | 9 | 3 | 9 | 1 | 2 | 15 | 16 | 3 | 16 | ||
| # mutation | 3 | 9 | 3 | 23 | 5 | 5 | 1 | 4 | 2 | 9 | 3 | 9 | 1 | 2 | 16 | 19 | 3 | 28 | ||
| nonsynonymous SNV | 3 | 8 | 2 | 15 | 4 | 4 | 3 | 1 | 6 | 3 | 5 | 1 | 9 | 8 | 3 | 22 | ||||
| synonymous SNV | 1 | 1 | 8 | 1 | 1 | 1 | 1 | 1 | 3 | 4 | 1 | 1 | 7 | 11 | 6 |
| cf) Tissue ID; Tissue type (1; BLCA[Bladder Urothelial Carcinoma], 2; BRCA[Breast invasive carcinoma], 3; CESC[Cervical squamous cell carcinoma and endocervical adenocarcinoma], 4; COAD[Colon adenocarcinoma], 5; GBM[Glioblastoma multiforme], 6; Glioma Low Grade, 7; HNSC[Head and Neck squamous cell carcinoma], 8; KICH[Kidney Chromophobe], 9; KIRC[Kidney renal clear cell carcinoma], 10; KIRP[Kidney renal papillary cell carcinoma], 11; LAML[Acute Myeloid Leukemia], 12; LUAD[Lung adenocarcinoma], 13; LUSC[Lung squamous cell carcinoma], 14; OV[Ovarian serous cystadenocarcinoma ], 15; PAAD[Pancreatic adenocarcinoma], 16; PRAD[Prostate adenocarcinoma], 17; SKCM[Skin Cutaneous Melanoma], 18:STAD[Stomach adenocarcinoma], 19:THCA[Thyroid carcinoma], 20:UCEC[Uterine Corpus Endometrial Carcinoma]) |
| Top |
| * We represented just top 10 SNVs. When you move the cursor on each content, you can see more deailed mutation information on the Tooltip. Those are primary_site, primary_histology, mutation(aa), pubmedID. |
| Genomic Position | Mutation(aa) | Unique sampleID count |
| chr16:4029168 | p.P876P | 4 |
| chr16:4163814 | p.E544K | 3 |
| chr16:4042225 | p.S710L | 3 |
| chr16:4016169 | p.A126T | 2 |
| chr16:4042224 | p.E391K | 2 |
| chr16:4043500 | p.F1223F | 2 |
| chr16:4015908 | p.S632S | 2 |
| chr16:4027524 | p.A929A | 2 |
| chr16:4016249 | p.M1197V | 2 |
| chr16:4165068 | p.S710S | 2 |
| * Copy number data were extracted from TCGA using R package TCGA-Assembler. The URLs of all public data files on TCGA DCC data server were gathered on Jan-05-2015. Function ProcessCNAData in TCGA-Assembler package was used to obtain gene-level copy number value which is calculated as the average copy number of the genomic region of a gene. |
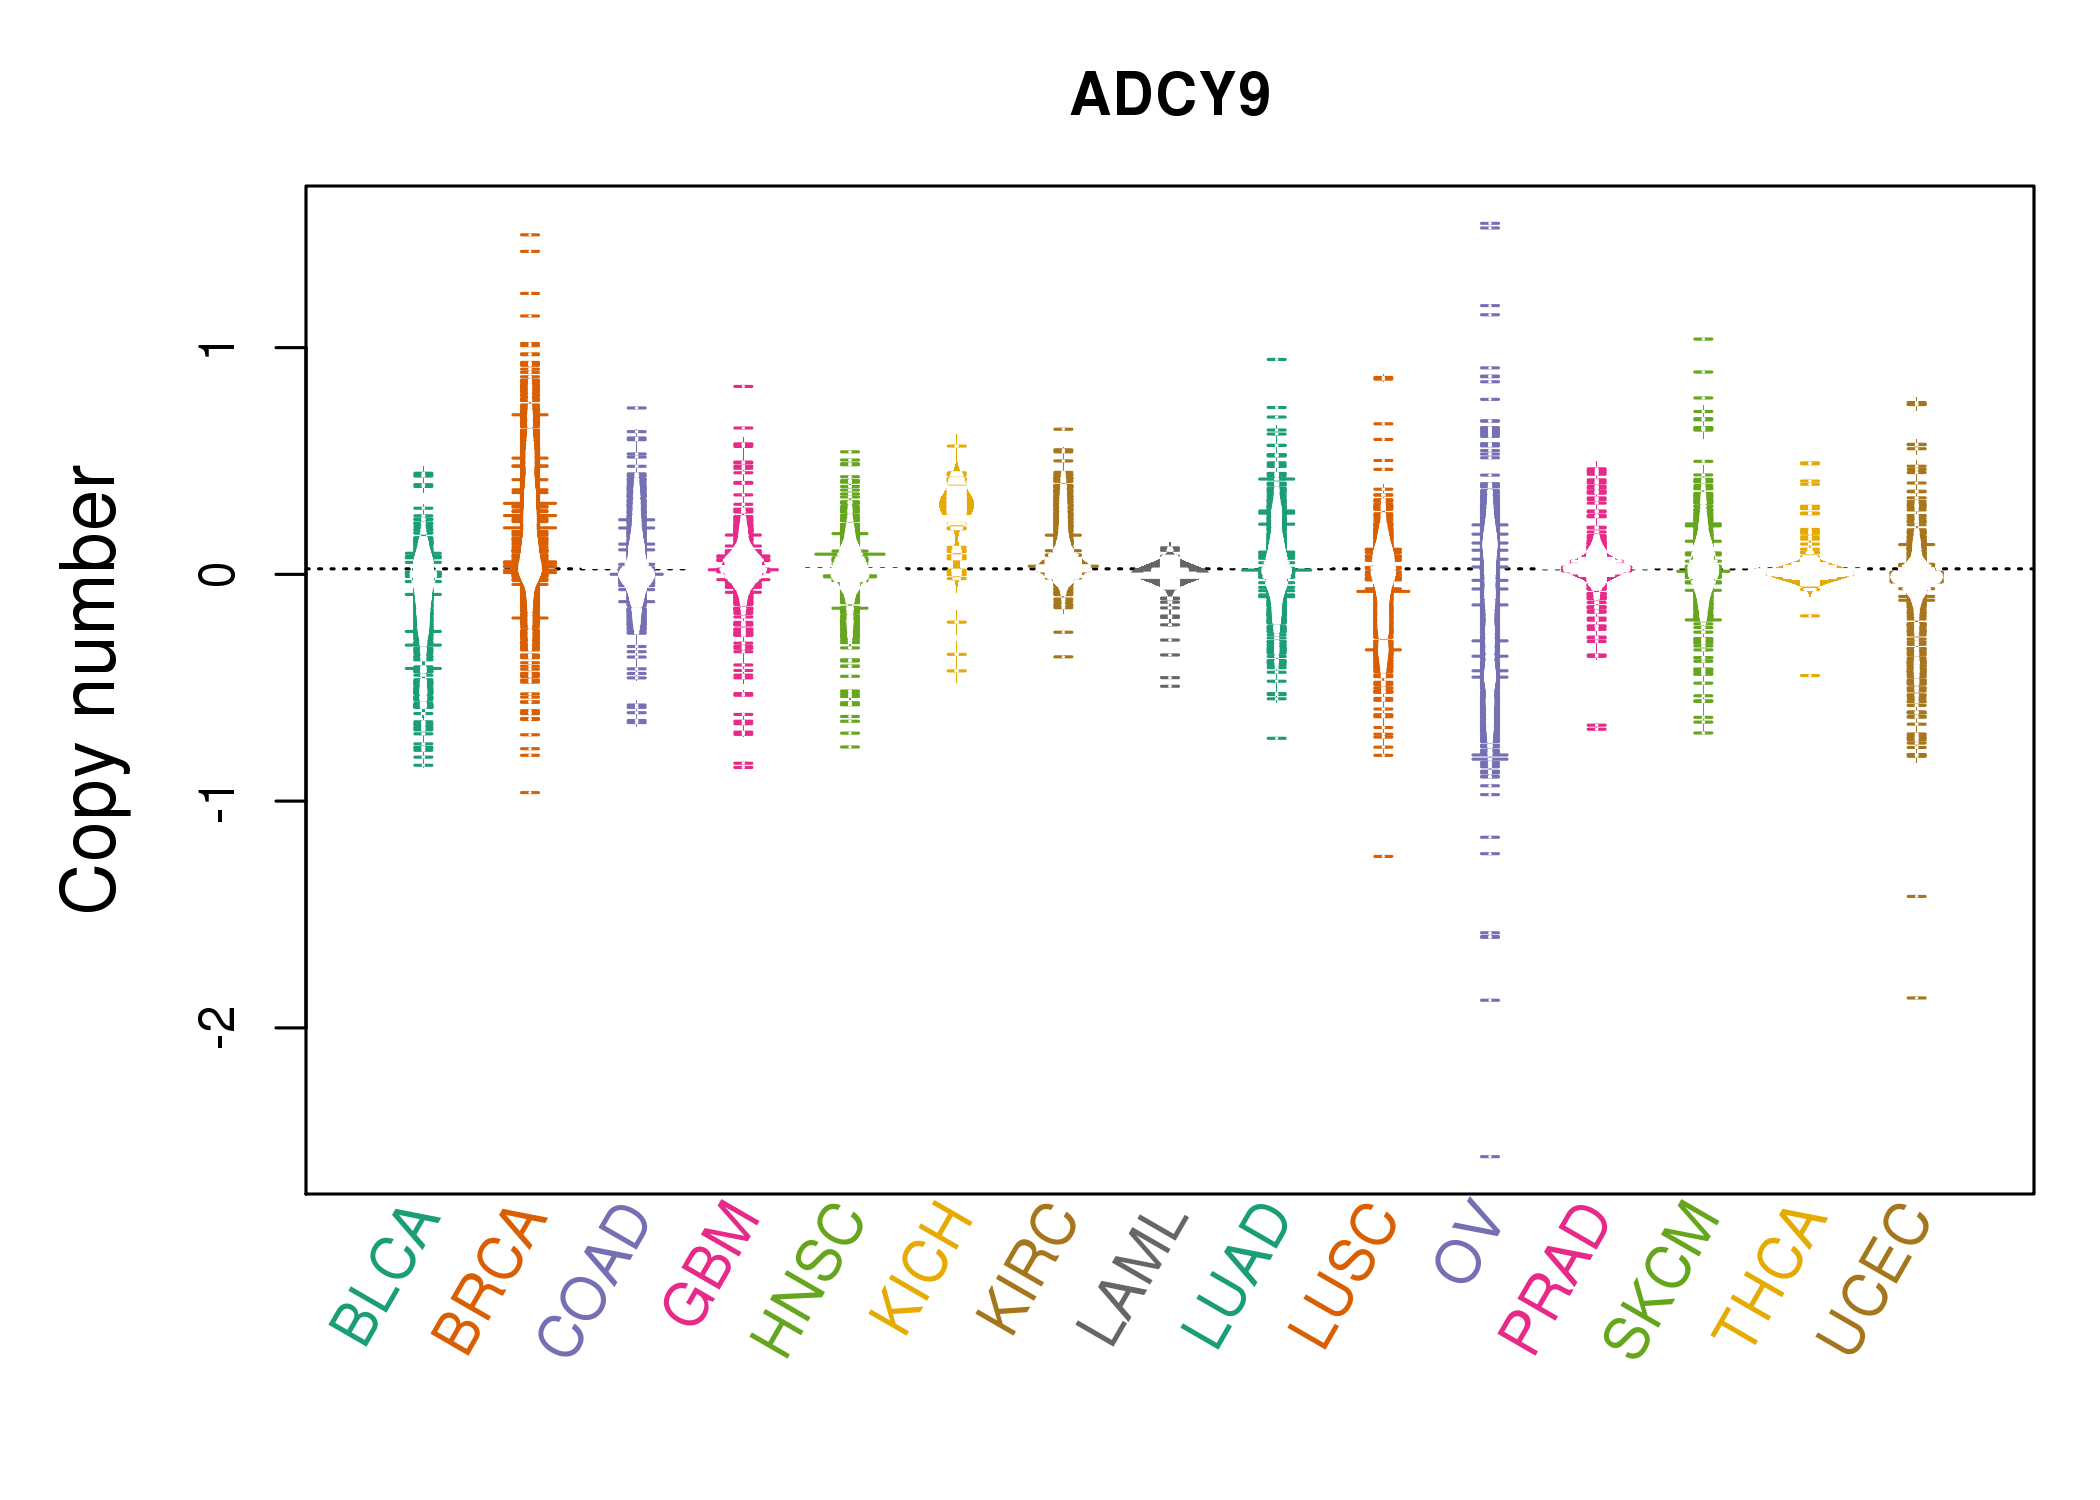 |
| cf) Tissue ID[Tissue type]: BLCA[Bladder Urothelial Carcinoma], BRCA[Breast invasive carcinoma], CESC[Cervical squamous cell carcinoma and endocervical adenocarcinoma], COAD[Colon adenocarcinoma], GBM[Glioblastoma multiforme], Glioma Low Grade, HNSC[Head and Neck squamous cell carcinoma], KICH[Kidney Chromophobe], KIRC[Kidney renal clear cell carcinoma], KIRP[Kidney renal papillary cell carcinoma], LAML[Acute Myeloid Leukemia], LUAD[Lung adenocarcinoma], LUSC[Lung squamous cell carcinoma], OV[Ovarian serous cystadenocarcinoma ], PAAD[Pancreatic adenocarcinoma], PRAD[Prostate adenocarcinoma], SKCM[Skin Cutaneous Melanoma], STAD[Stomach adenocarcinoma], THCA[Thyroid carcinoma], UCEC[Uterine Corpus Endometrial Carcinoma] |
| Top |
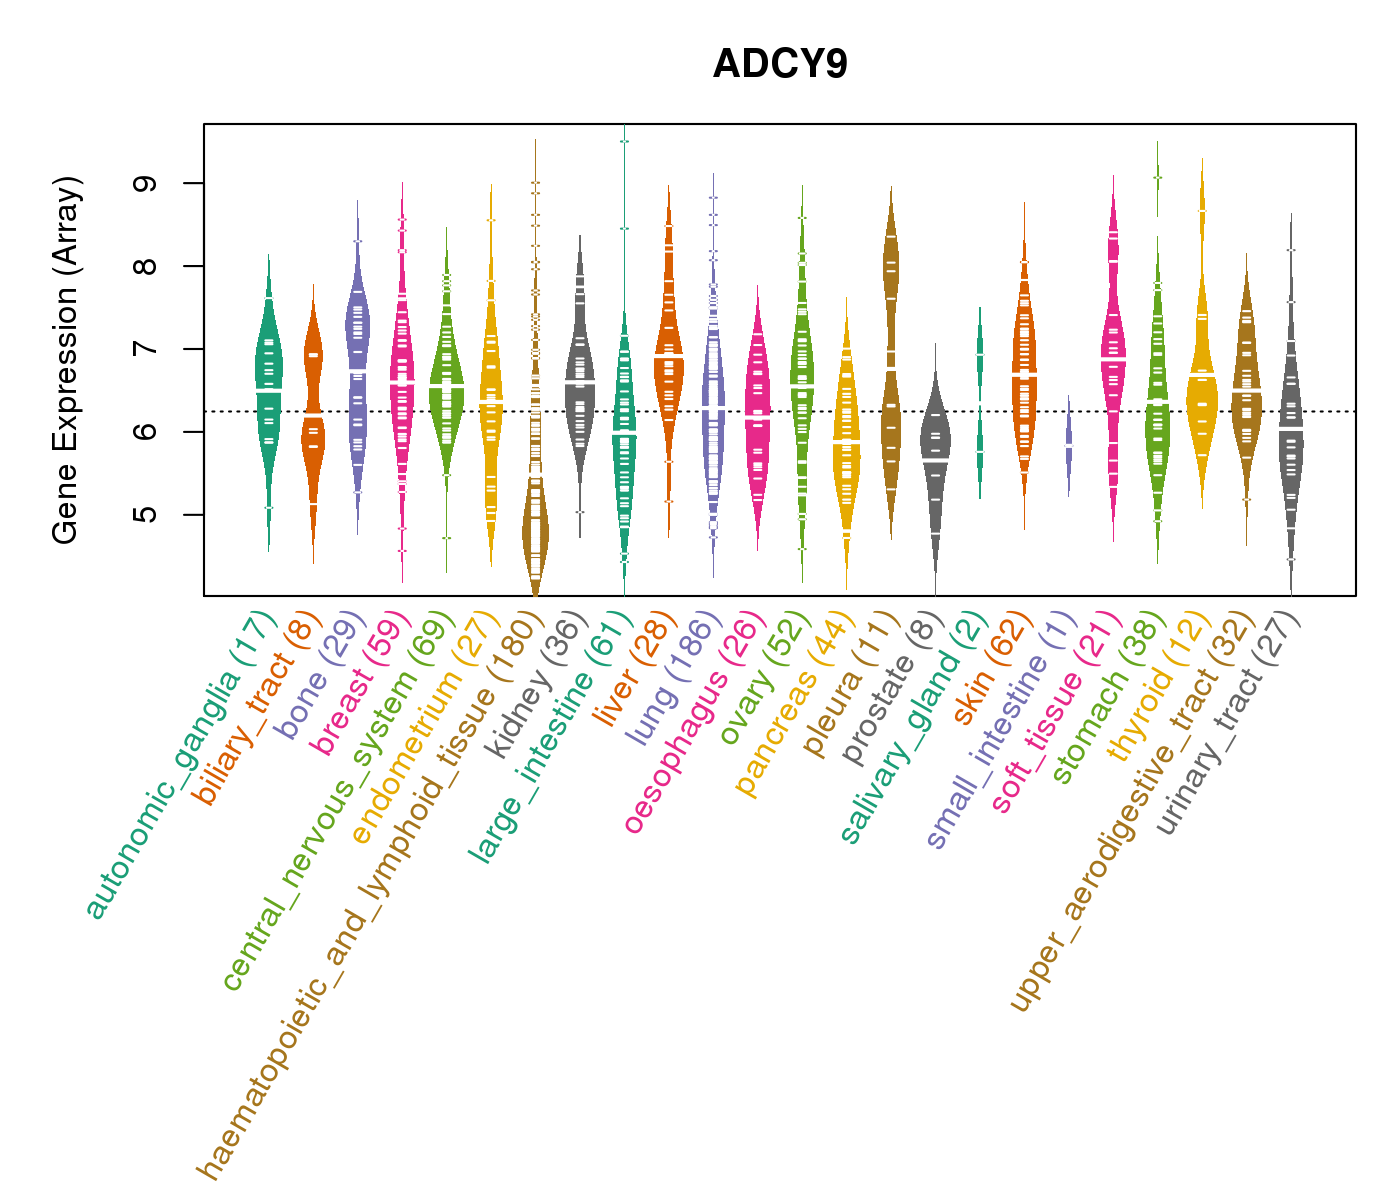
| Gene Expression for ADCY9 |
| * CCLE gene expression data were extracted from CCLE_Expression_Entrez_2012-10-18.res: Gene-centric RMA-normalized mRNA expression data. |
 |
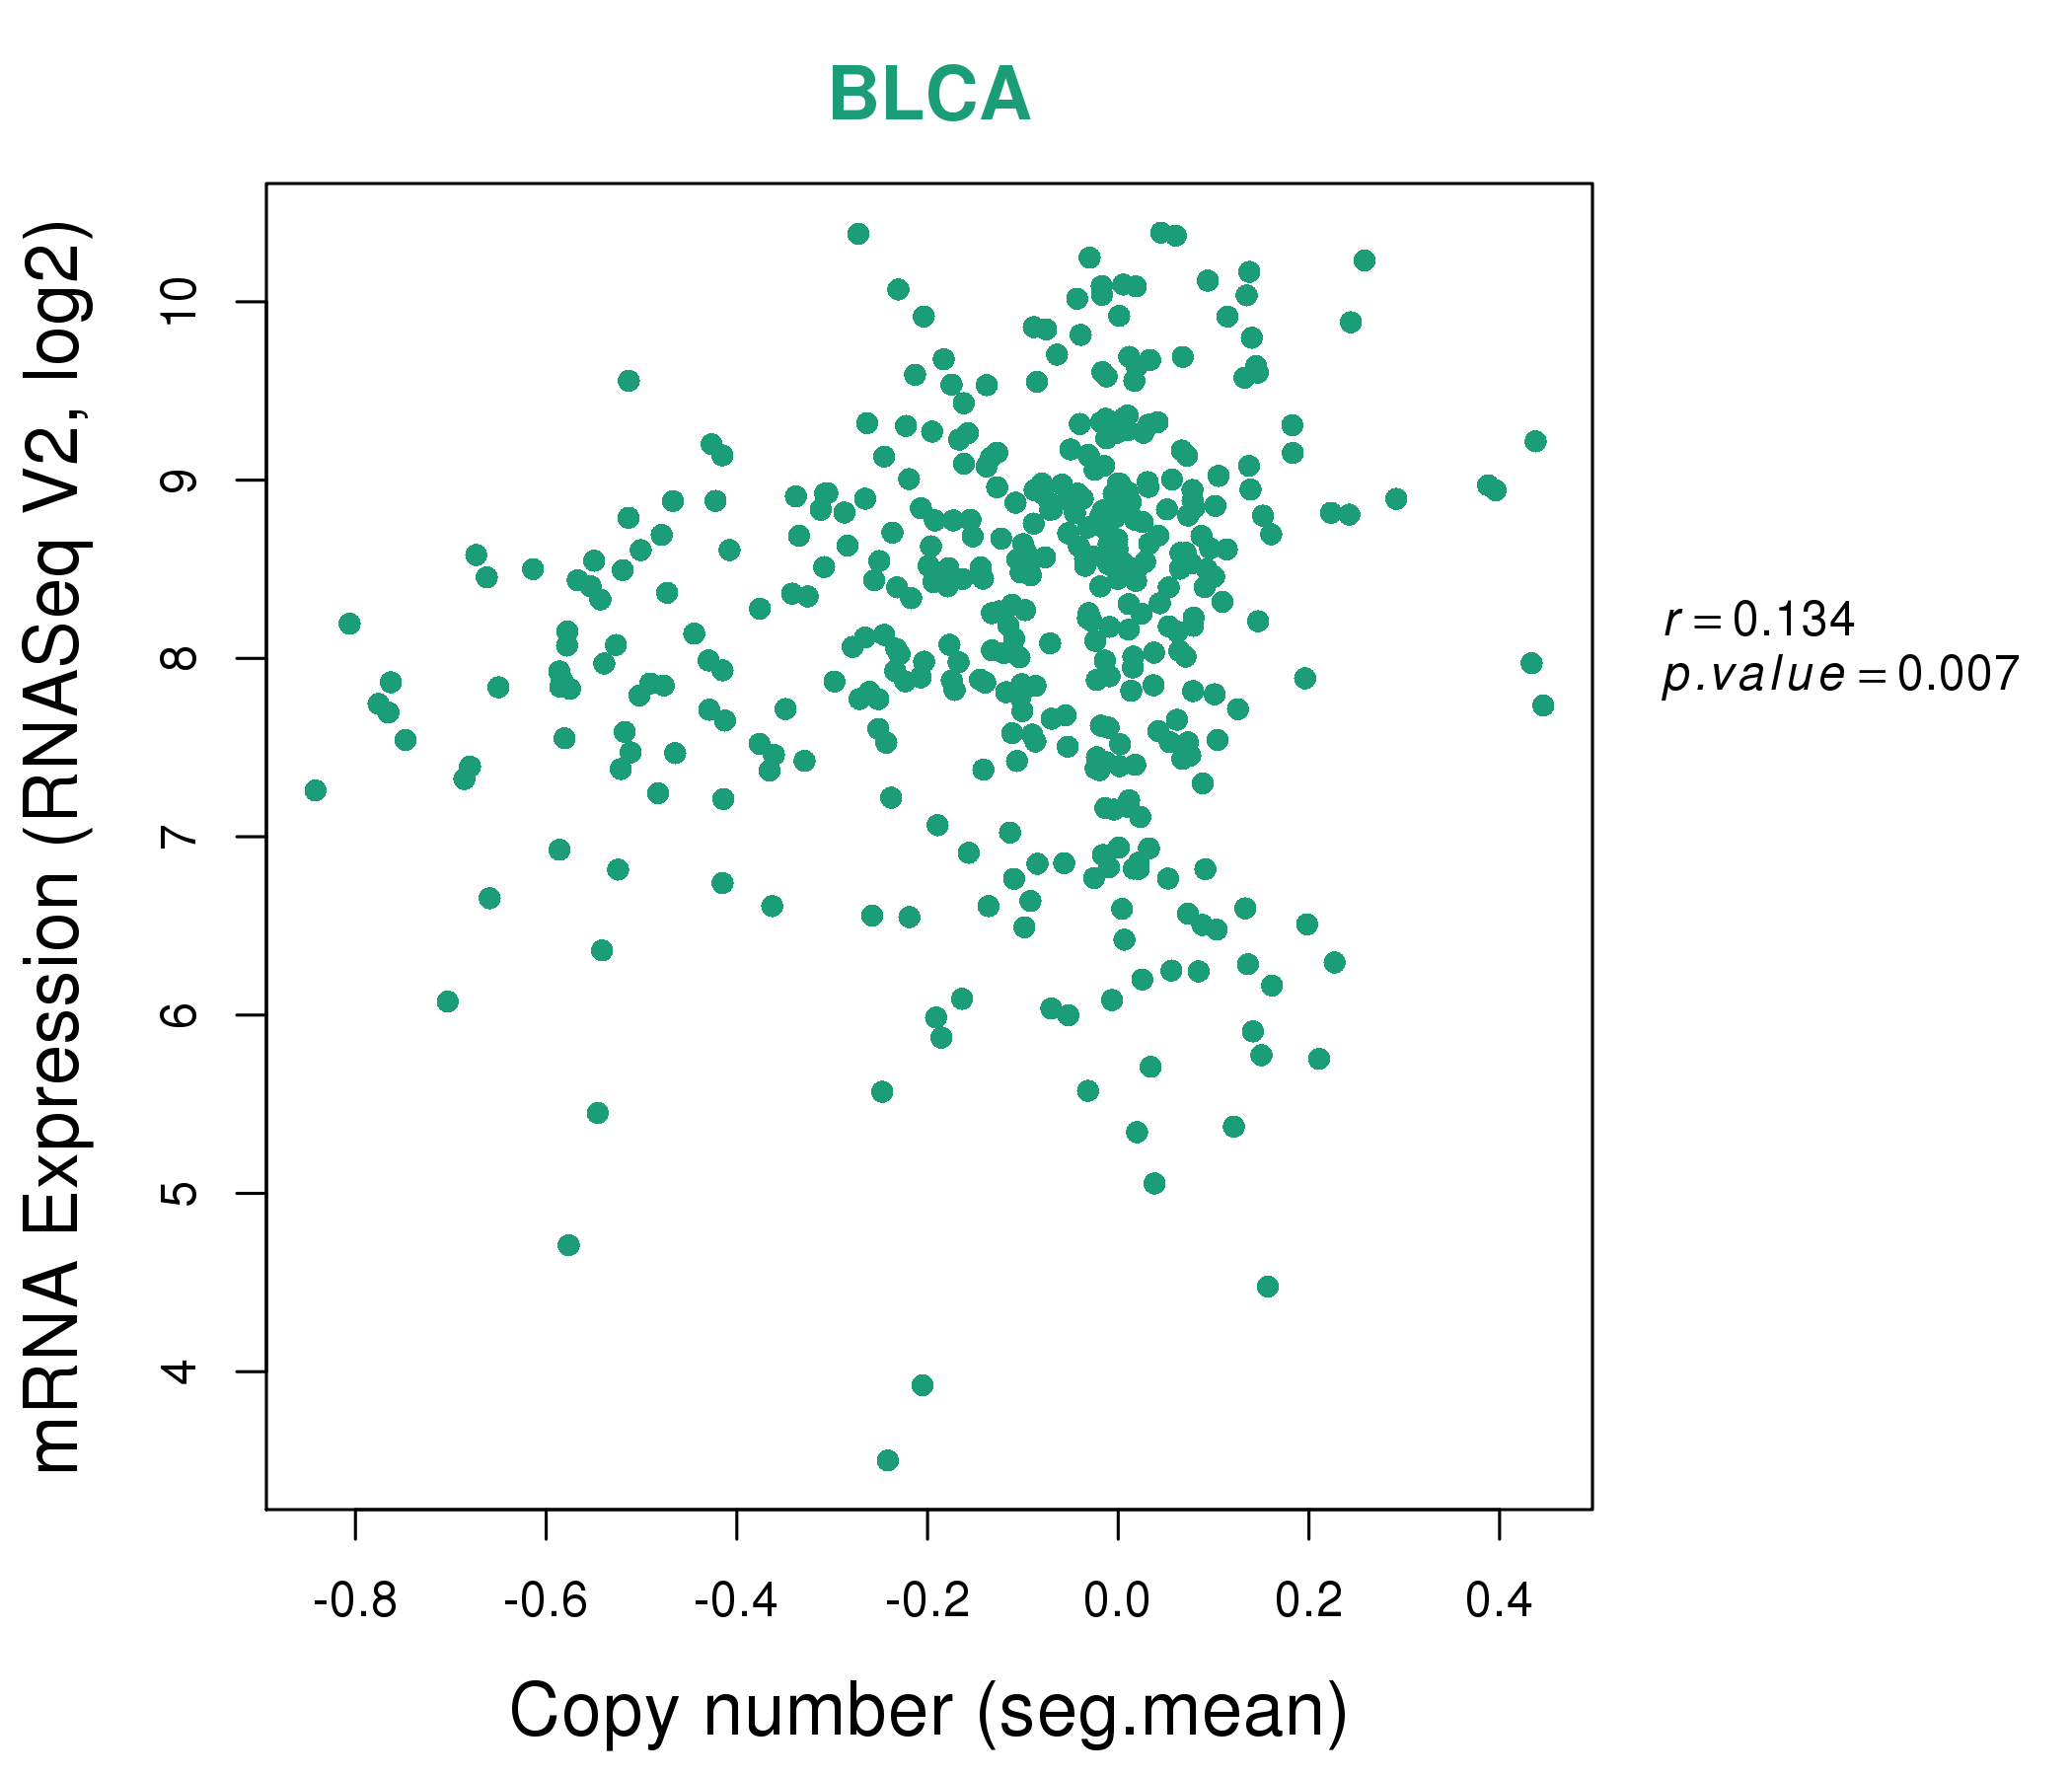
| * Normalized gene expression data of RNASeqV2 was extracted from TCGA using R package TCGA-Assembler. The URLs of all public data files on TCGA DCC data server were gathered at Jan-05-2015. Only eight cancer types have enough normal control samples for differential expression analysis. (t test, adjusted p<0.05 (using Benjamini-Hochberg FDR)) |
 |
| Top |
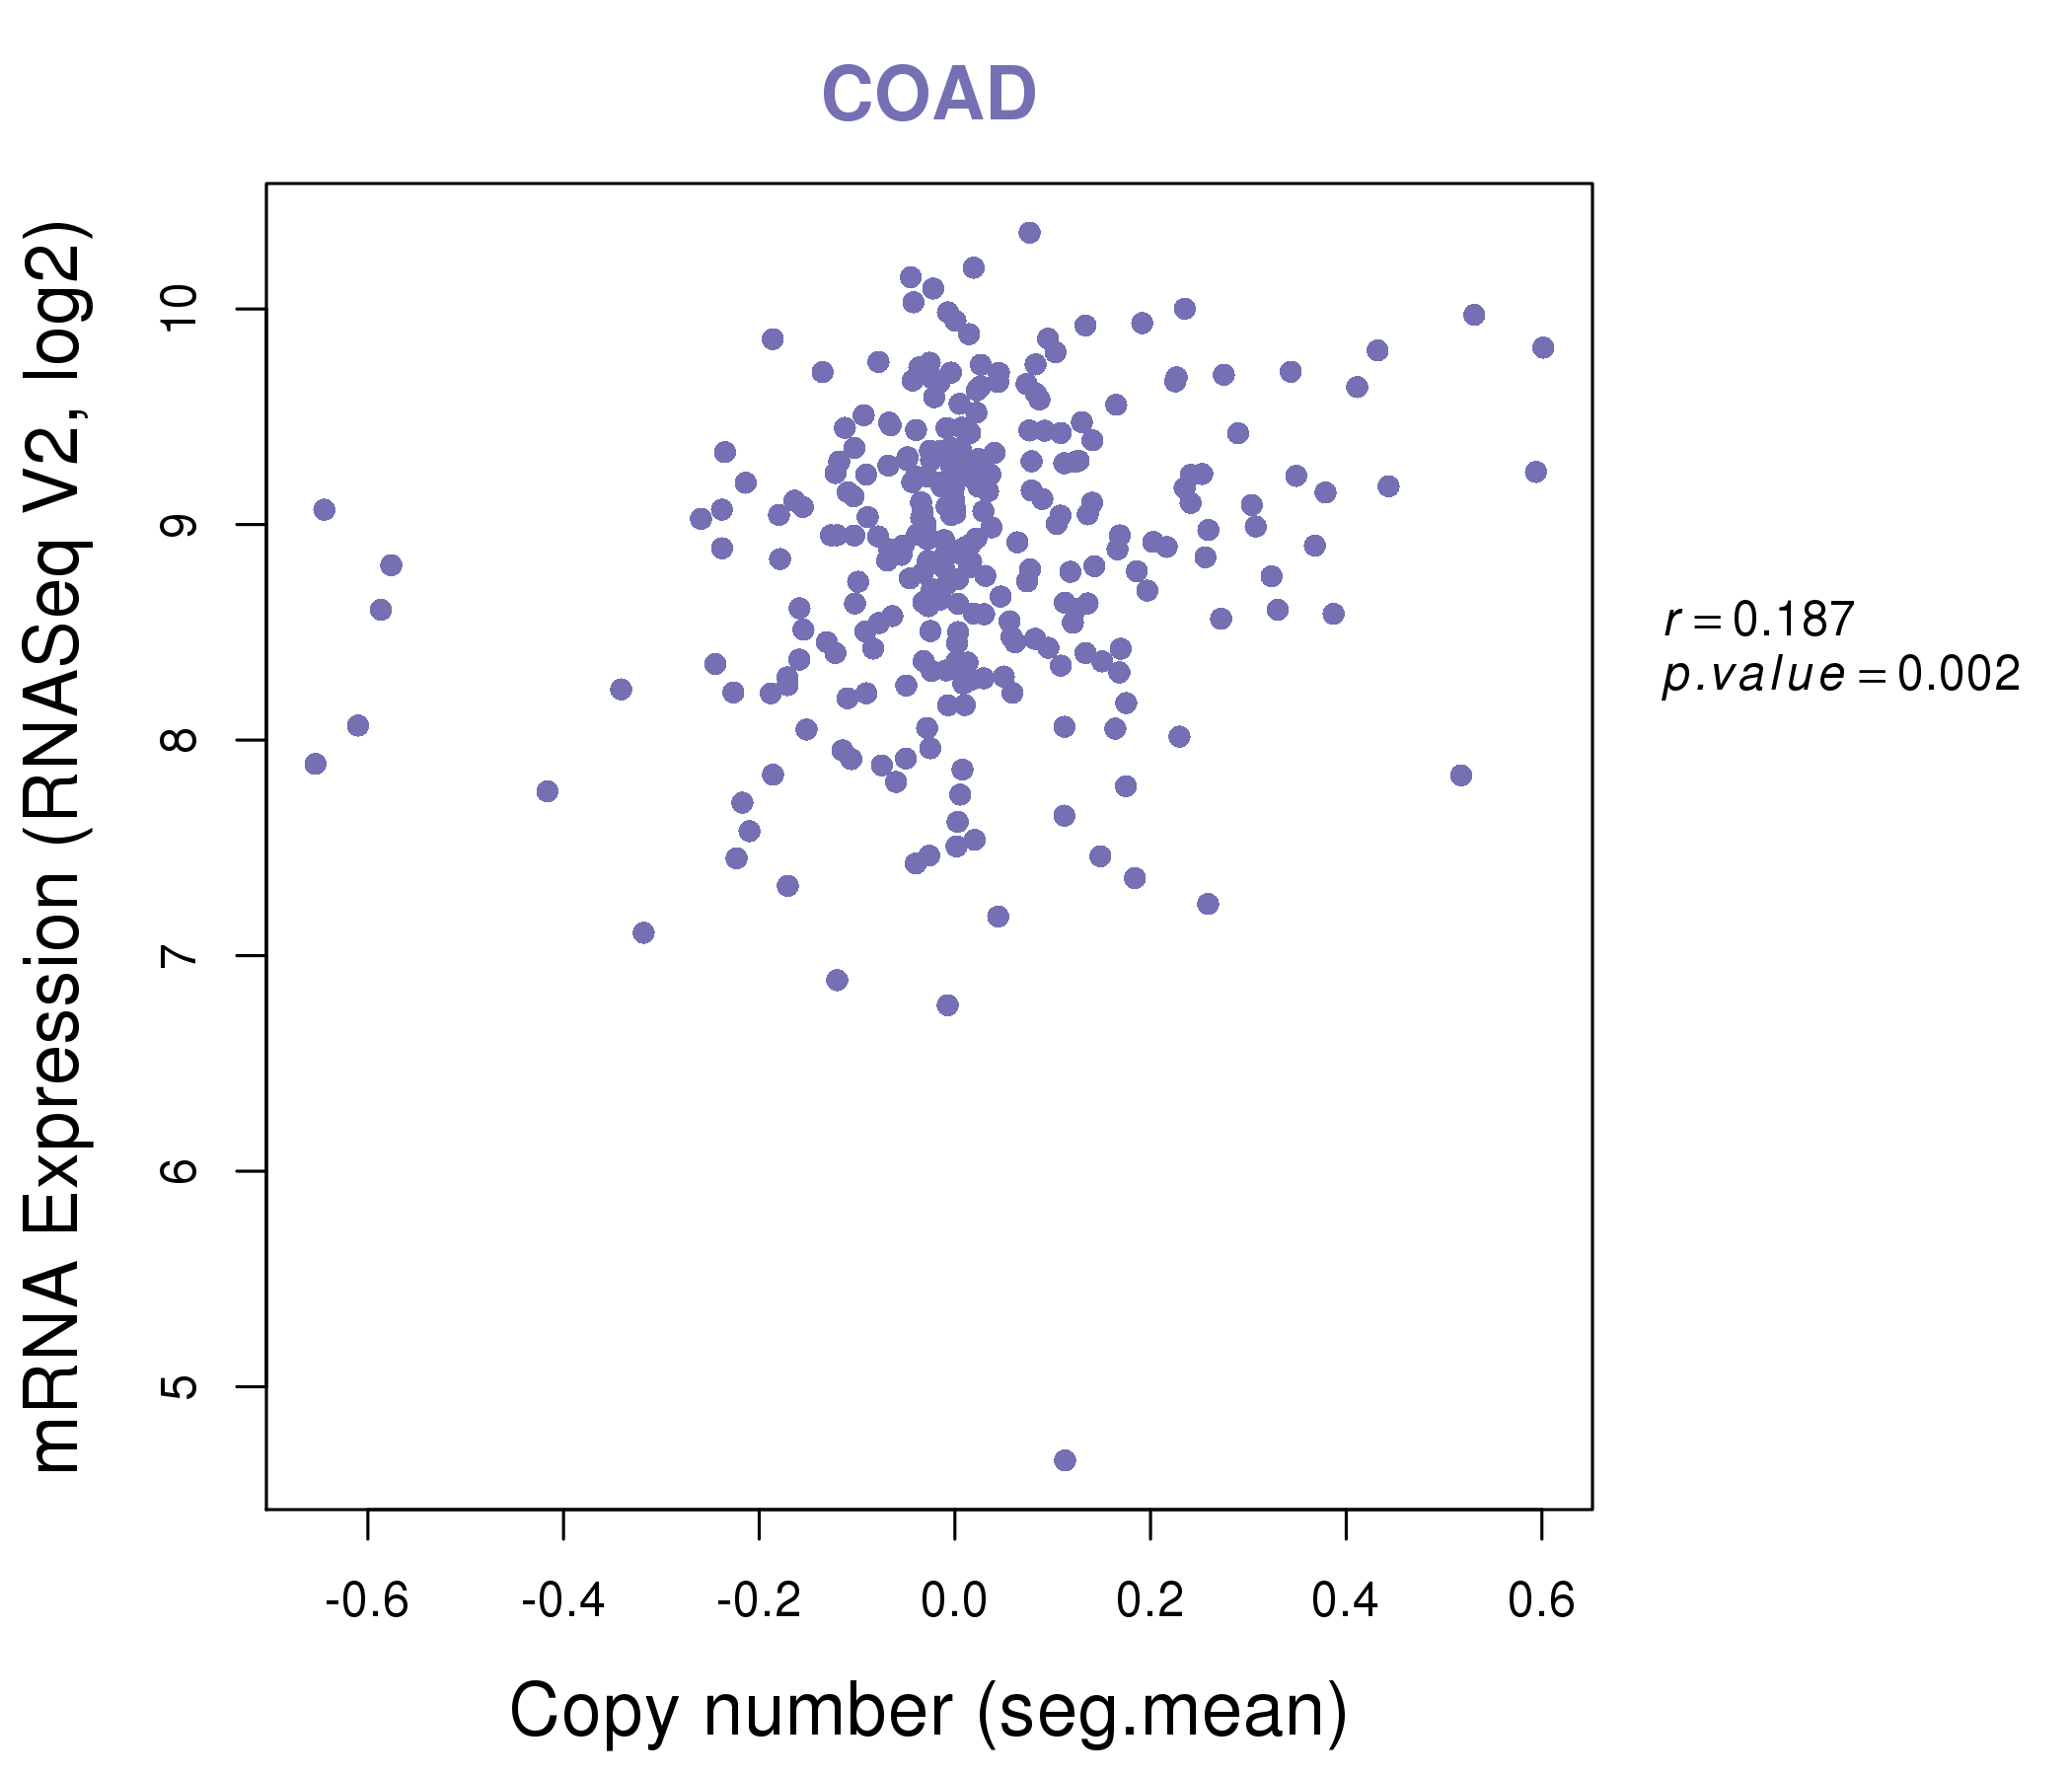
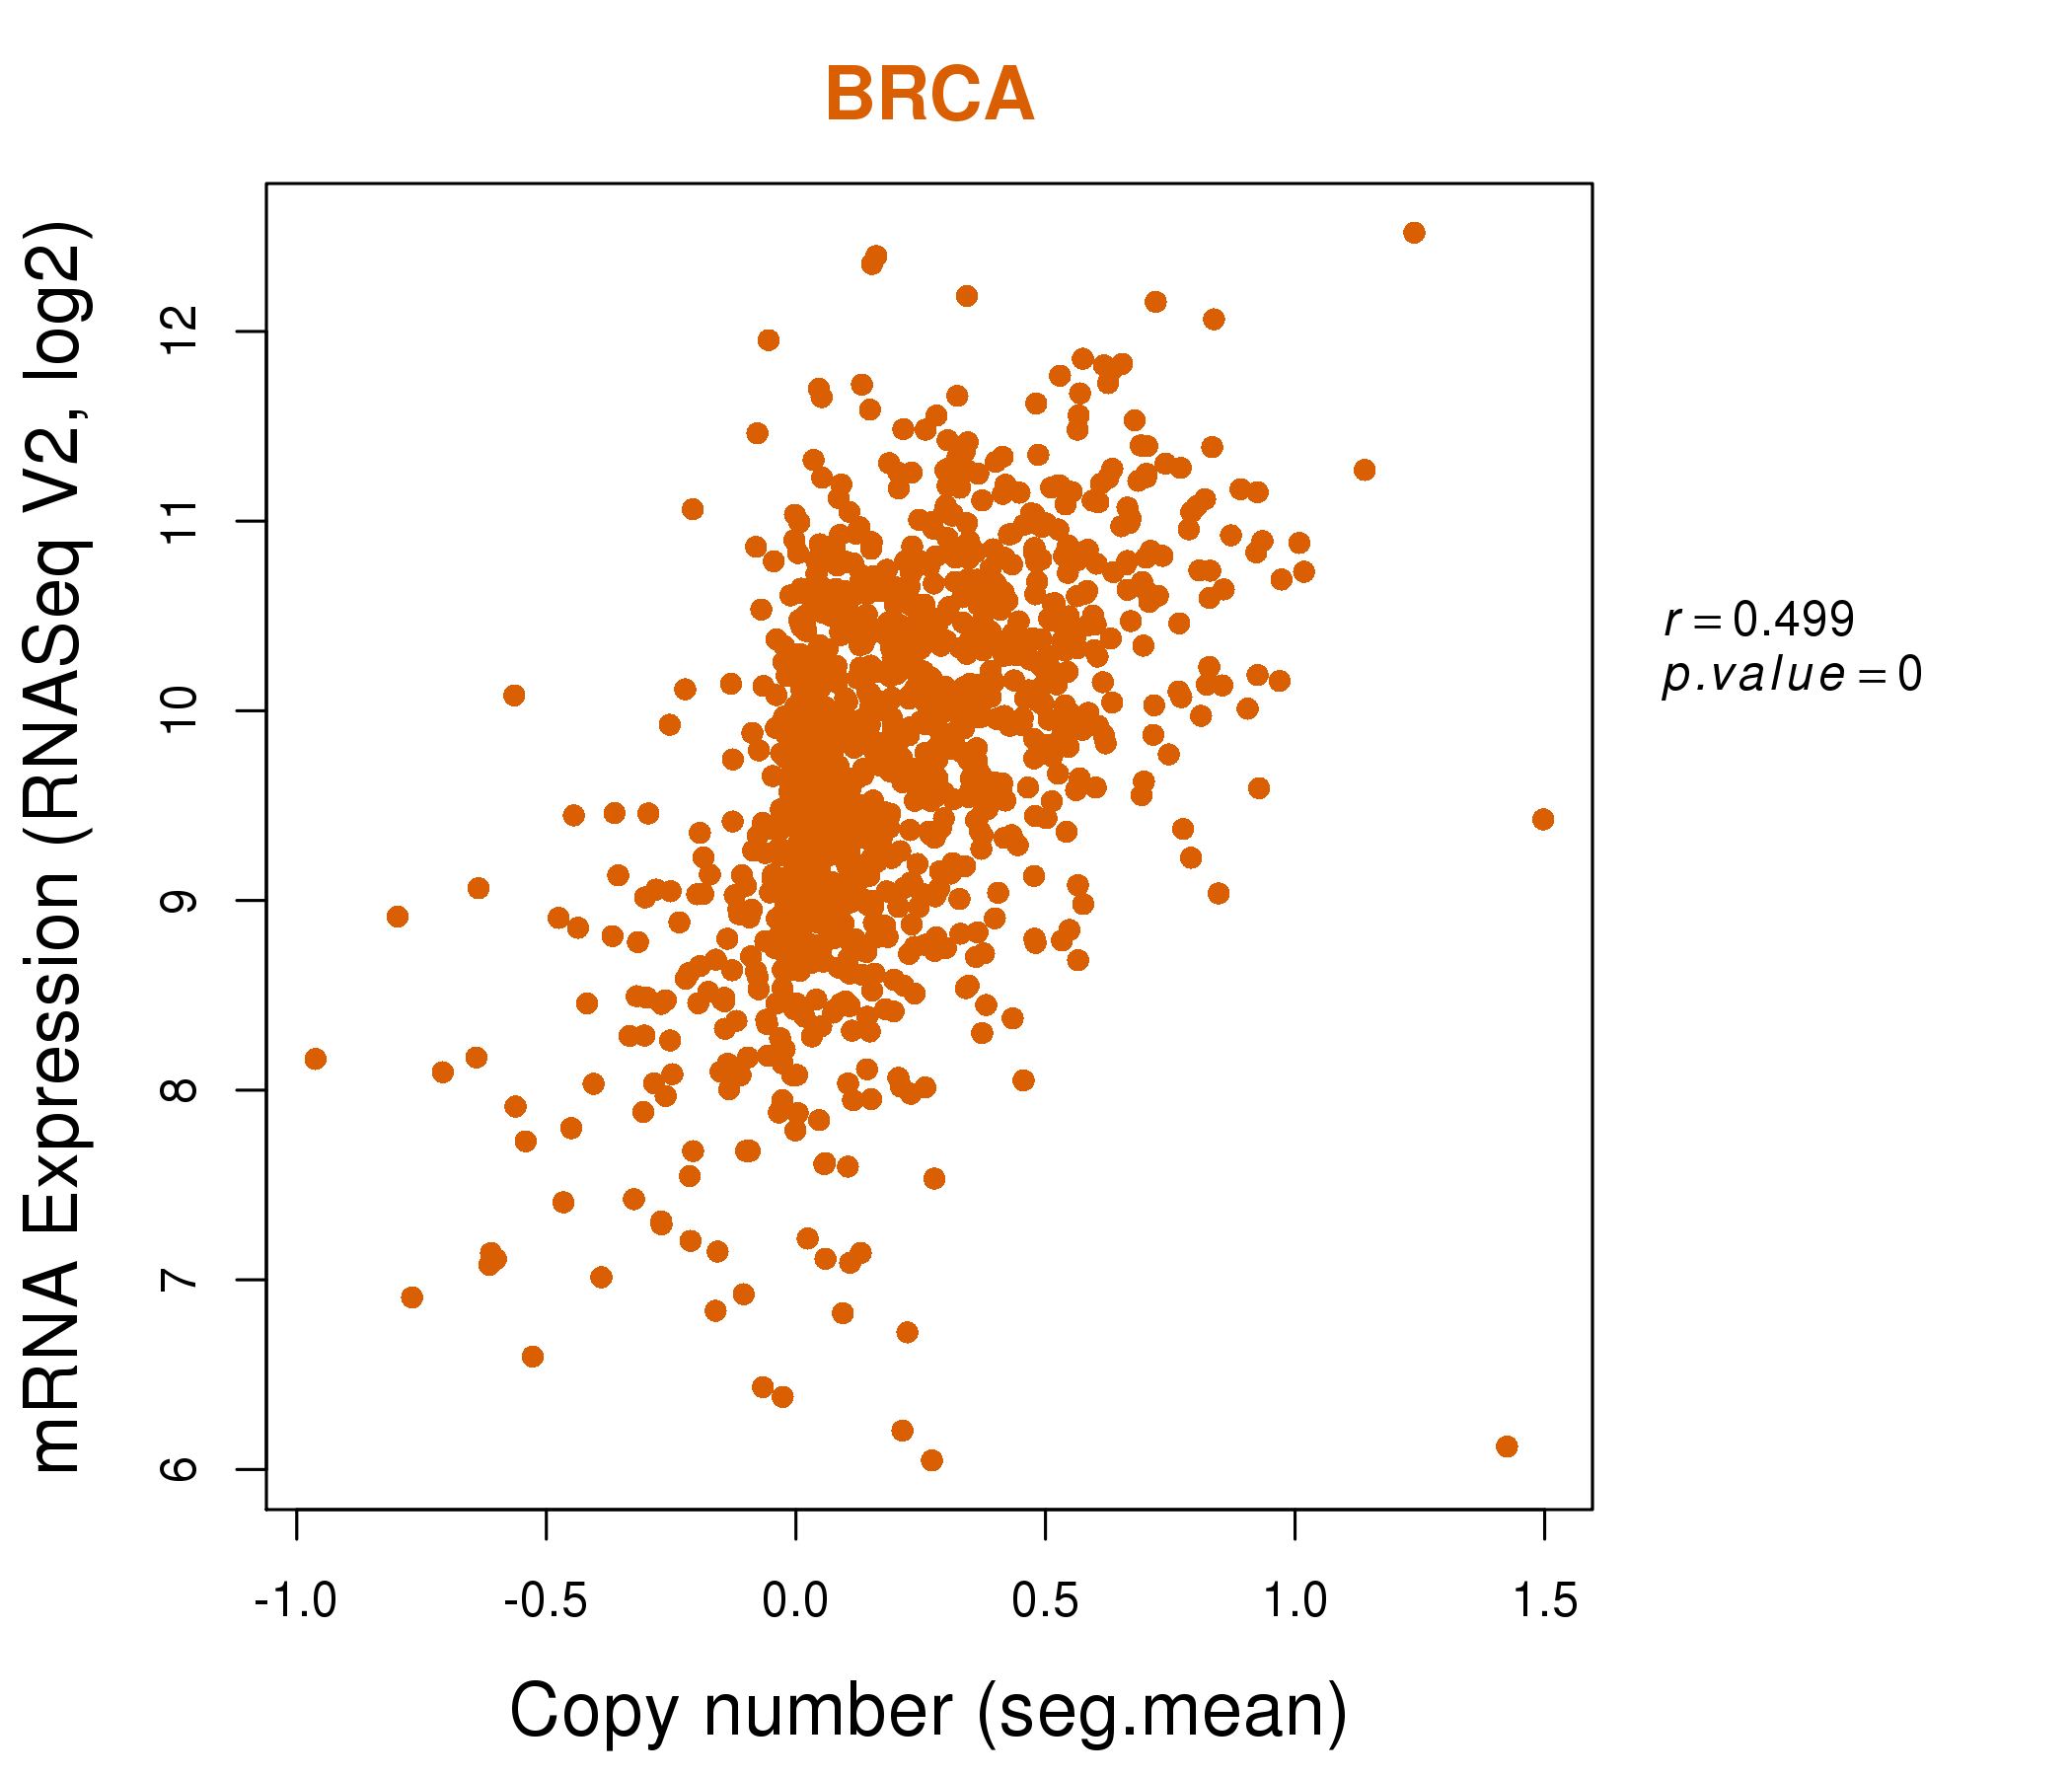
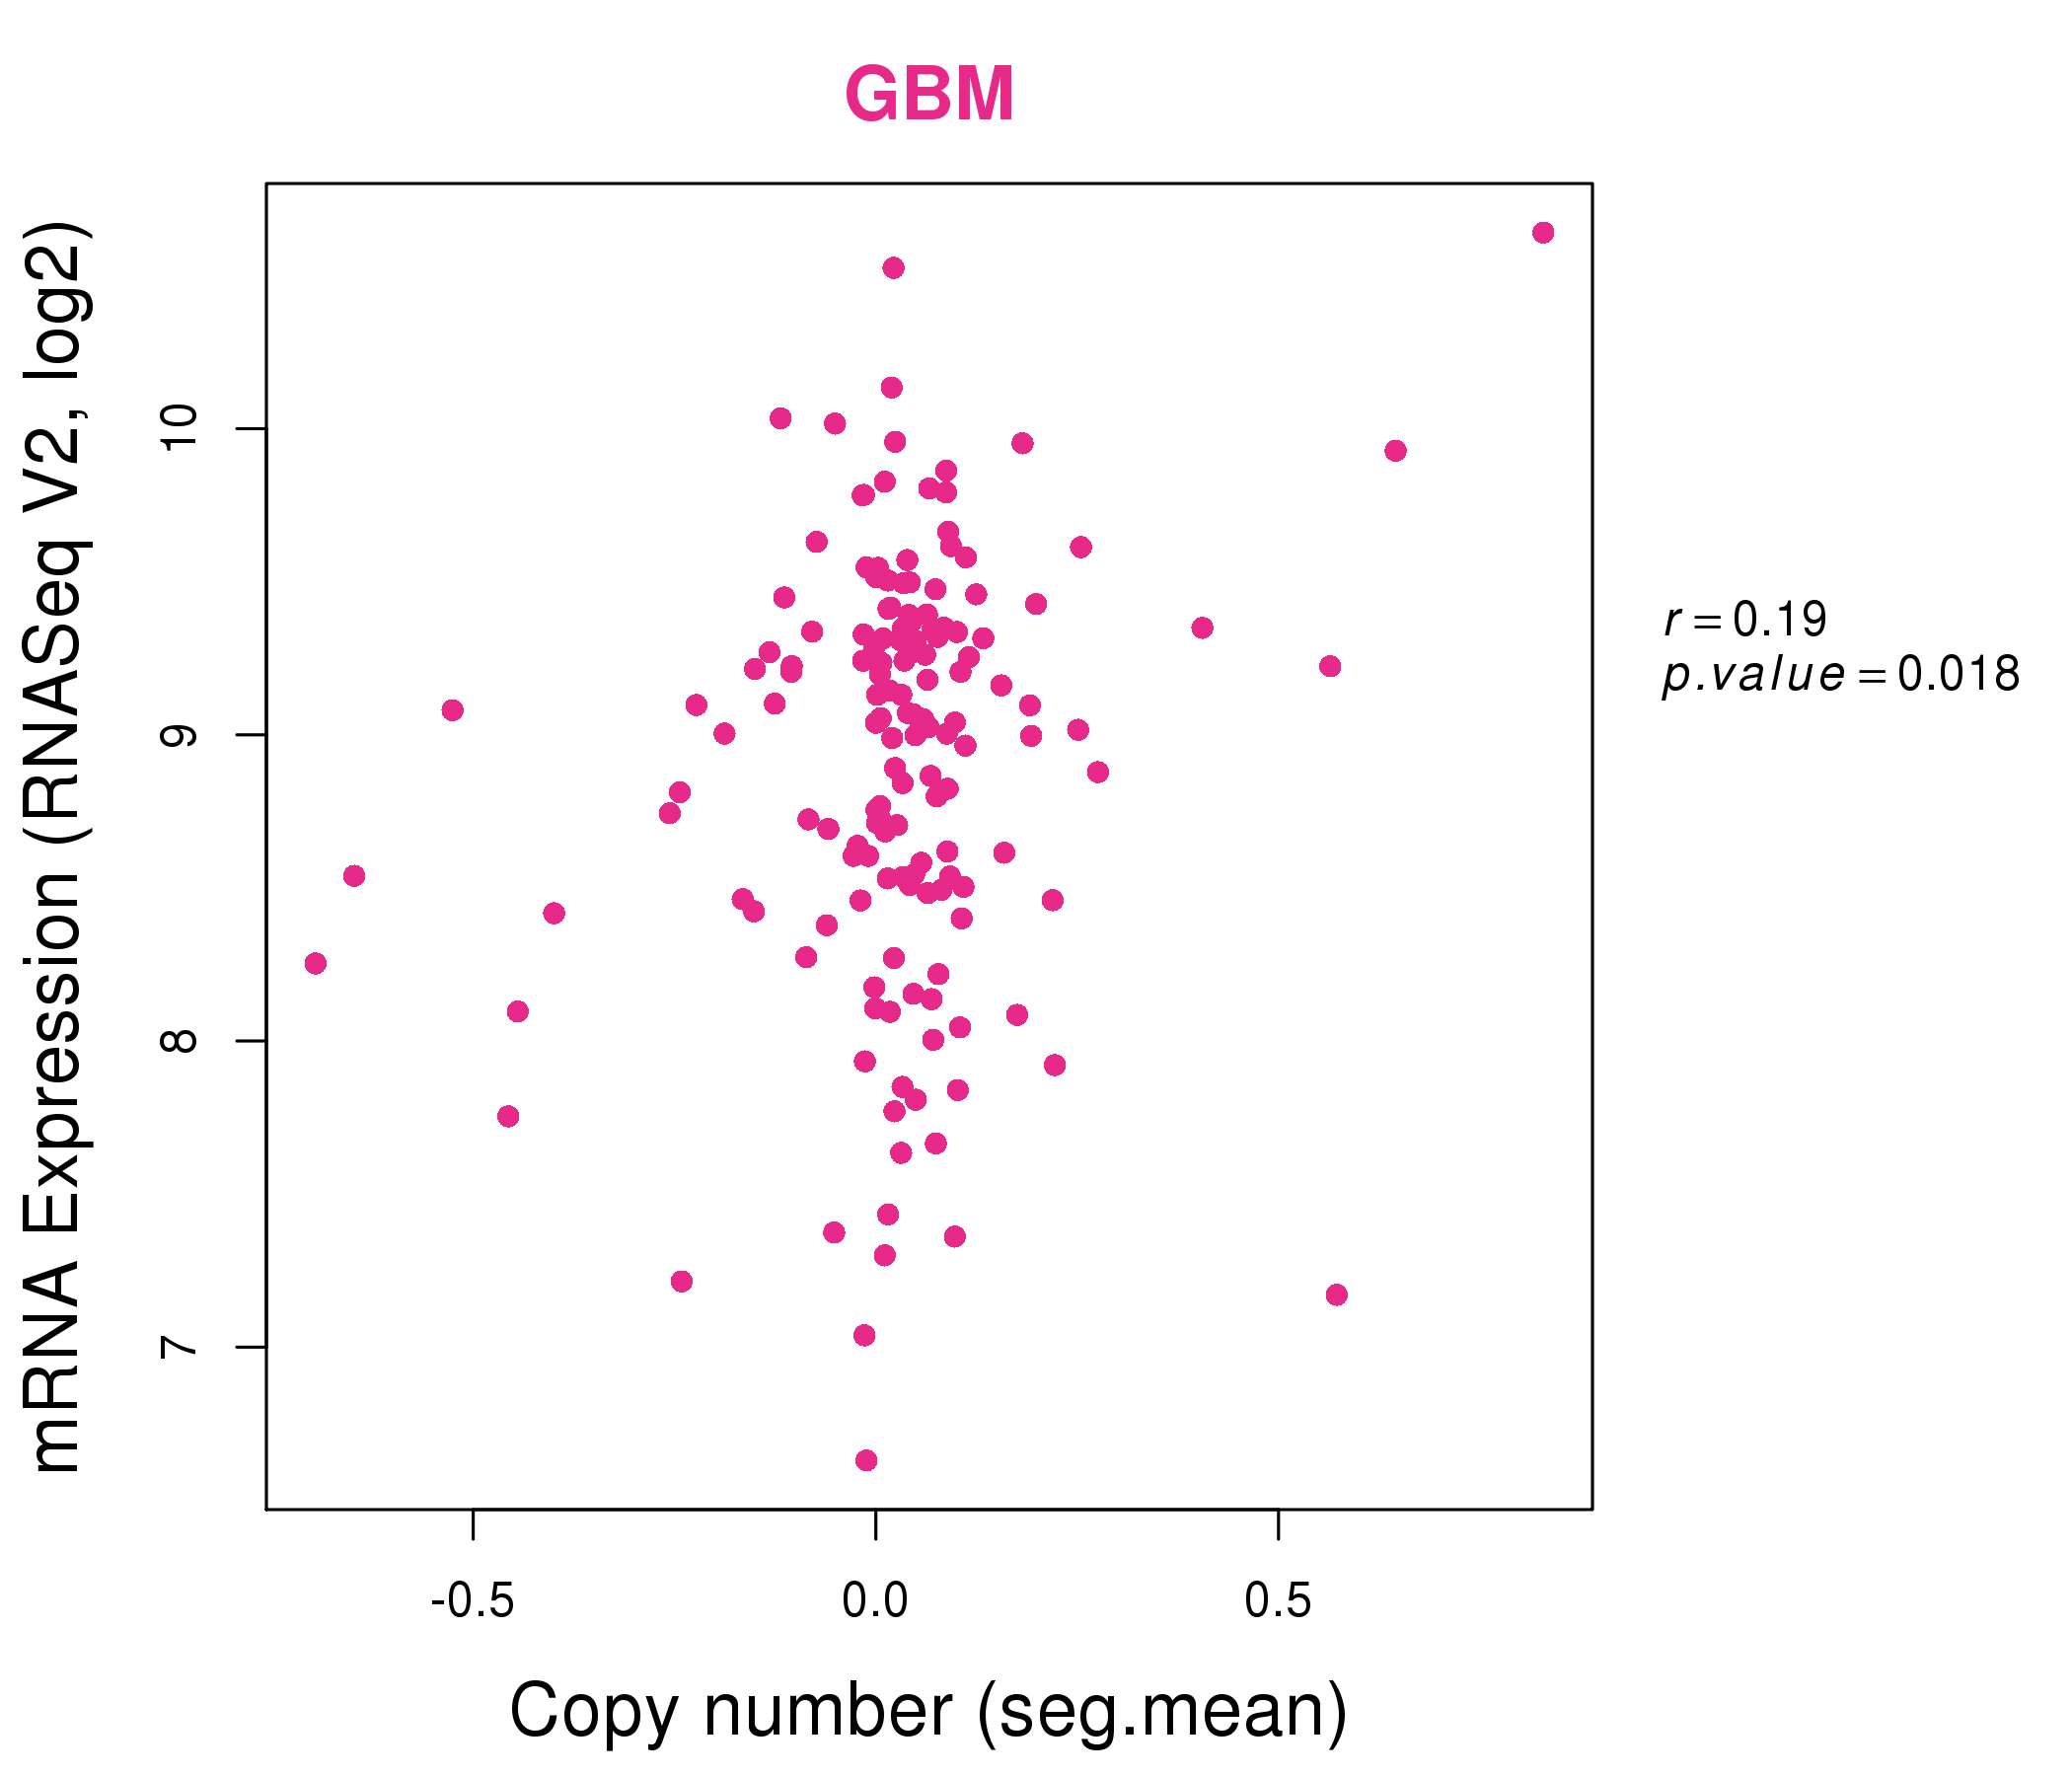
| * This plots show the correlation between CNV and gene expression. |
: Open all plots for all cancer types
 |
|
 |
|
| Top |
| Gene-Gene Network Information |
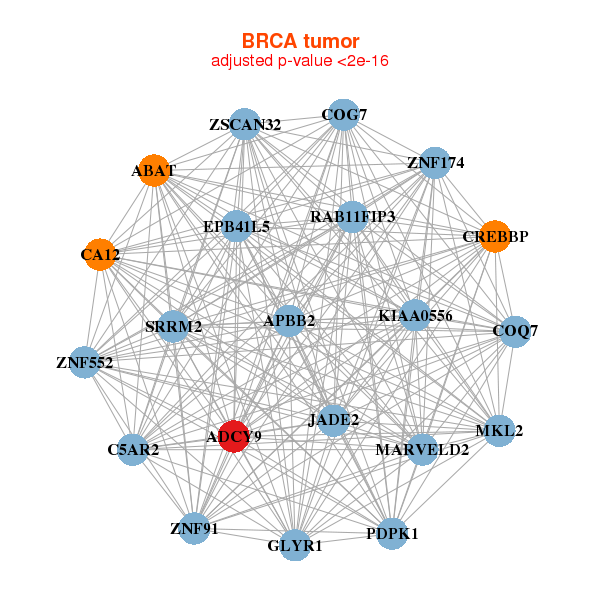
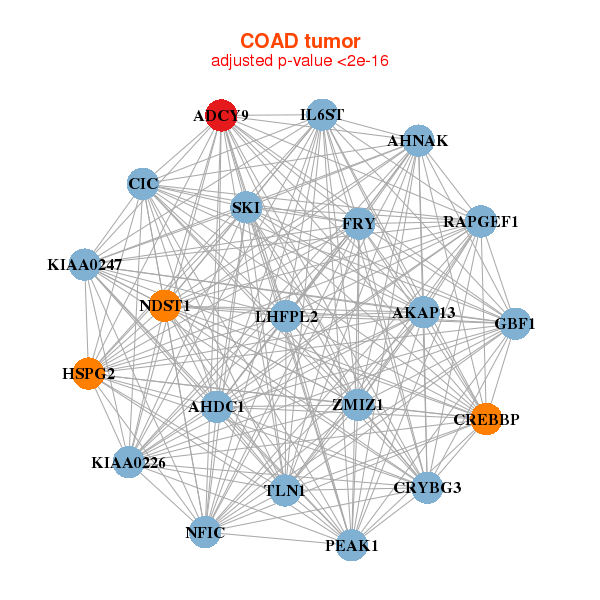
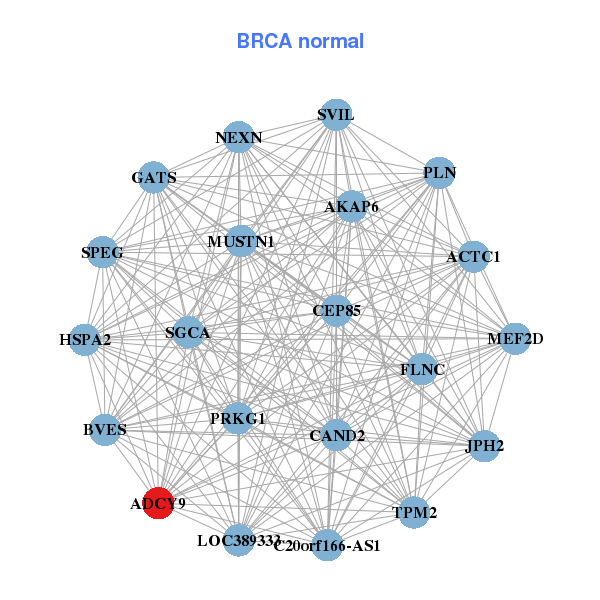
| * Co-Expression network figures were drawn using R package igraph. Only the top 20 genes with the highest correlations were shown. Red circle: input gene, orange circle: cell metabolism gene, sky circle: other gene |
: Open all plots for all cancer types
 |
| ||||
| ABAT,ADCY9,APBB2,CA12,COG7,COQ7,CREBBP, EPB41L5,GLYR1,C5AR2,KIAA0556,MARVELD2,MKL2,PDPK1, JADE2,RAB11FIP3,SRRM2,ZNF174,ZSCAN32,ZNF552,ZNF91 | ACTC1,ADCY9,AKAP6,BVES,C20orf166-AS1,CAND2,CEP85, FLNC,GATS,HSPA2,JPH2,LOC389333,MEF2D,MUSTN1, NEXN,PLN,PRKG1,SGCA,SPEG,SVIL,TPM2 | ||||
 |
| ||||
| ADCY9,AHDC1,AHNAK,AKAP13,CIC,CREBBP,CRYBG3, FRY,GBF1,HSPG2,IL6ST,KIAA0226,KIAA0247,LHFPL2, NDST1,NFIC,RAPGEF1,PEAK1,SKI,TLN1,ZMIZ1 | ADCY9,AGPAT3,ARHGEF11,ATG9A,ATP6V0A1,BAG6,CDC42BPB, DENND1A,AGO1,FAT1,ARHGAP35,LAMP1,LRP5,NFE2L1, OGDH,RNF123,SEMA6A,SORT1,TGOLN2,TRAK1,UBR4 |

| * Co-Expression network figures were drawn using R package igraph. Only the top 20 genes with the highest correlations were shown. Red circle: input gene, orange circle: cell metabolism gene, sky circle: other gene |
: Open all plots for all cancer types
| Top |
: Open all interacting genes' information including KEGG pathway for all interacting genes from DAVID
| Top |
| Pharmacological Information for ADCY9 |
| DB Category | DB Name | DB's ID and Url link |
| Chemistry | ChEMBL | CHEMBL2097167; -. |
| Chemistry | ChEMBL | CHEMBL2097167; -. |
| Organism-specific databases | PharmGKB | PA30; -. |
| Organism-specific databases | PharmGKB | PA30; -. |
| Organism-specific databases | CTD | 115; -. |
| Organism-specific databases | CTD | 115; -. |
| * Gene Centered Interaction Network. |
 |
| * Drug Centered Interaction Network. |
| DrugBank ID | Target Name | Drug Groups | Generic Name | Drug Centered Network | Drug Structure |
| DB01064 | adenylate cyclase 9 | approved | Isoproterenol | 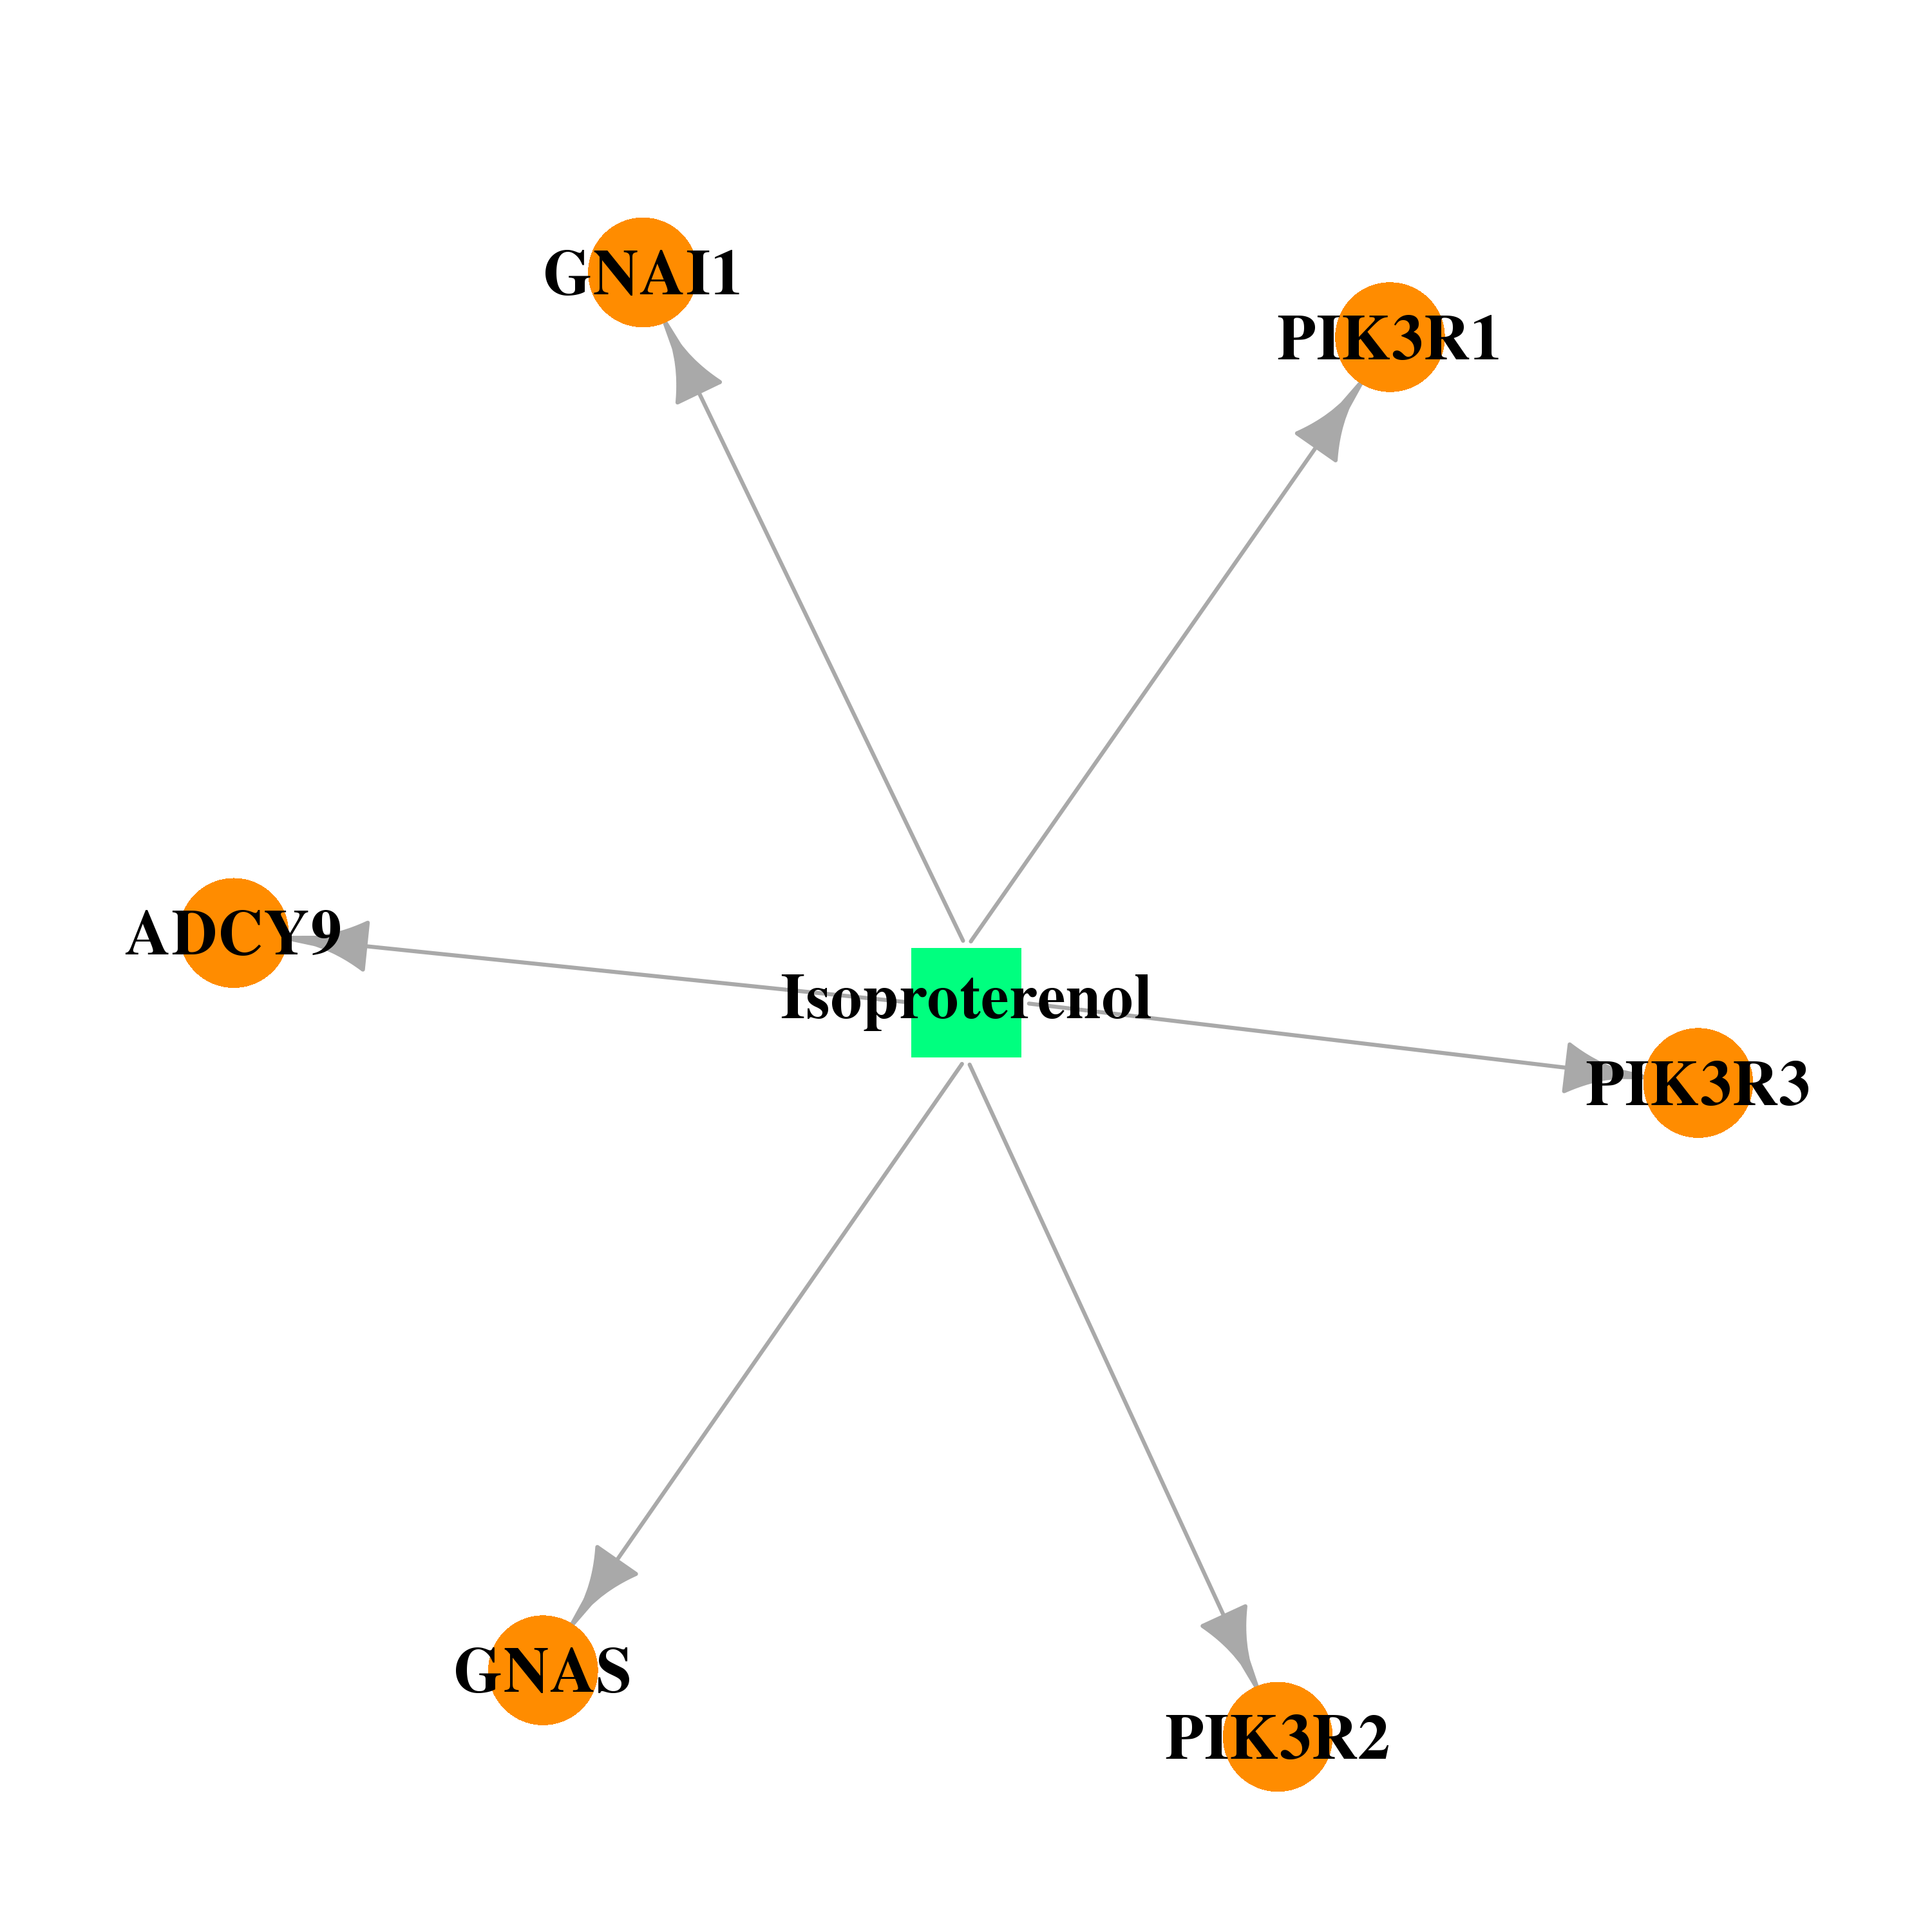 |  |
| DB00938 | adenylate cyclase 9 | approved | Salmeterol | 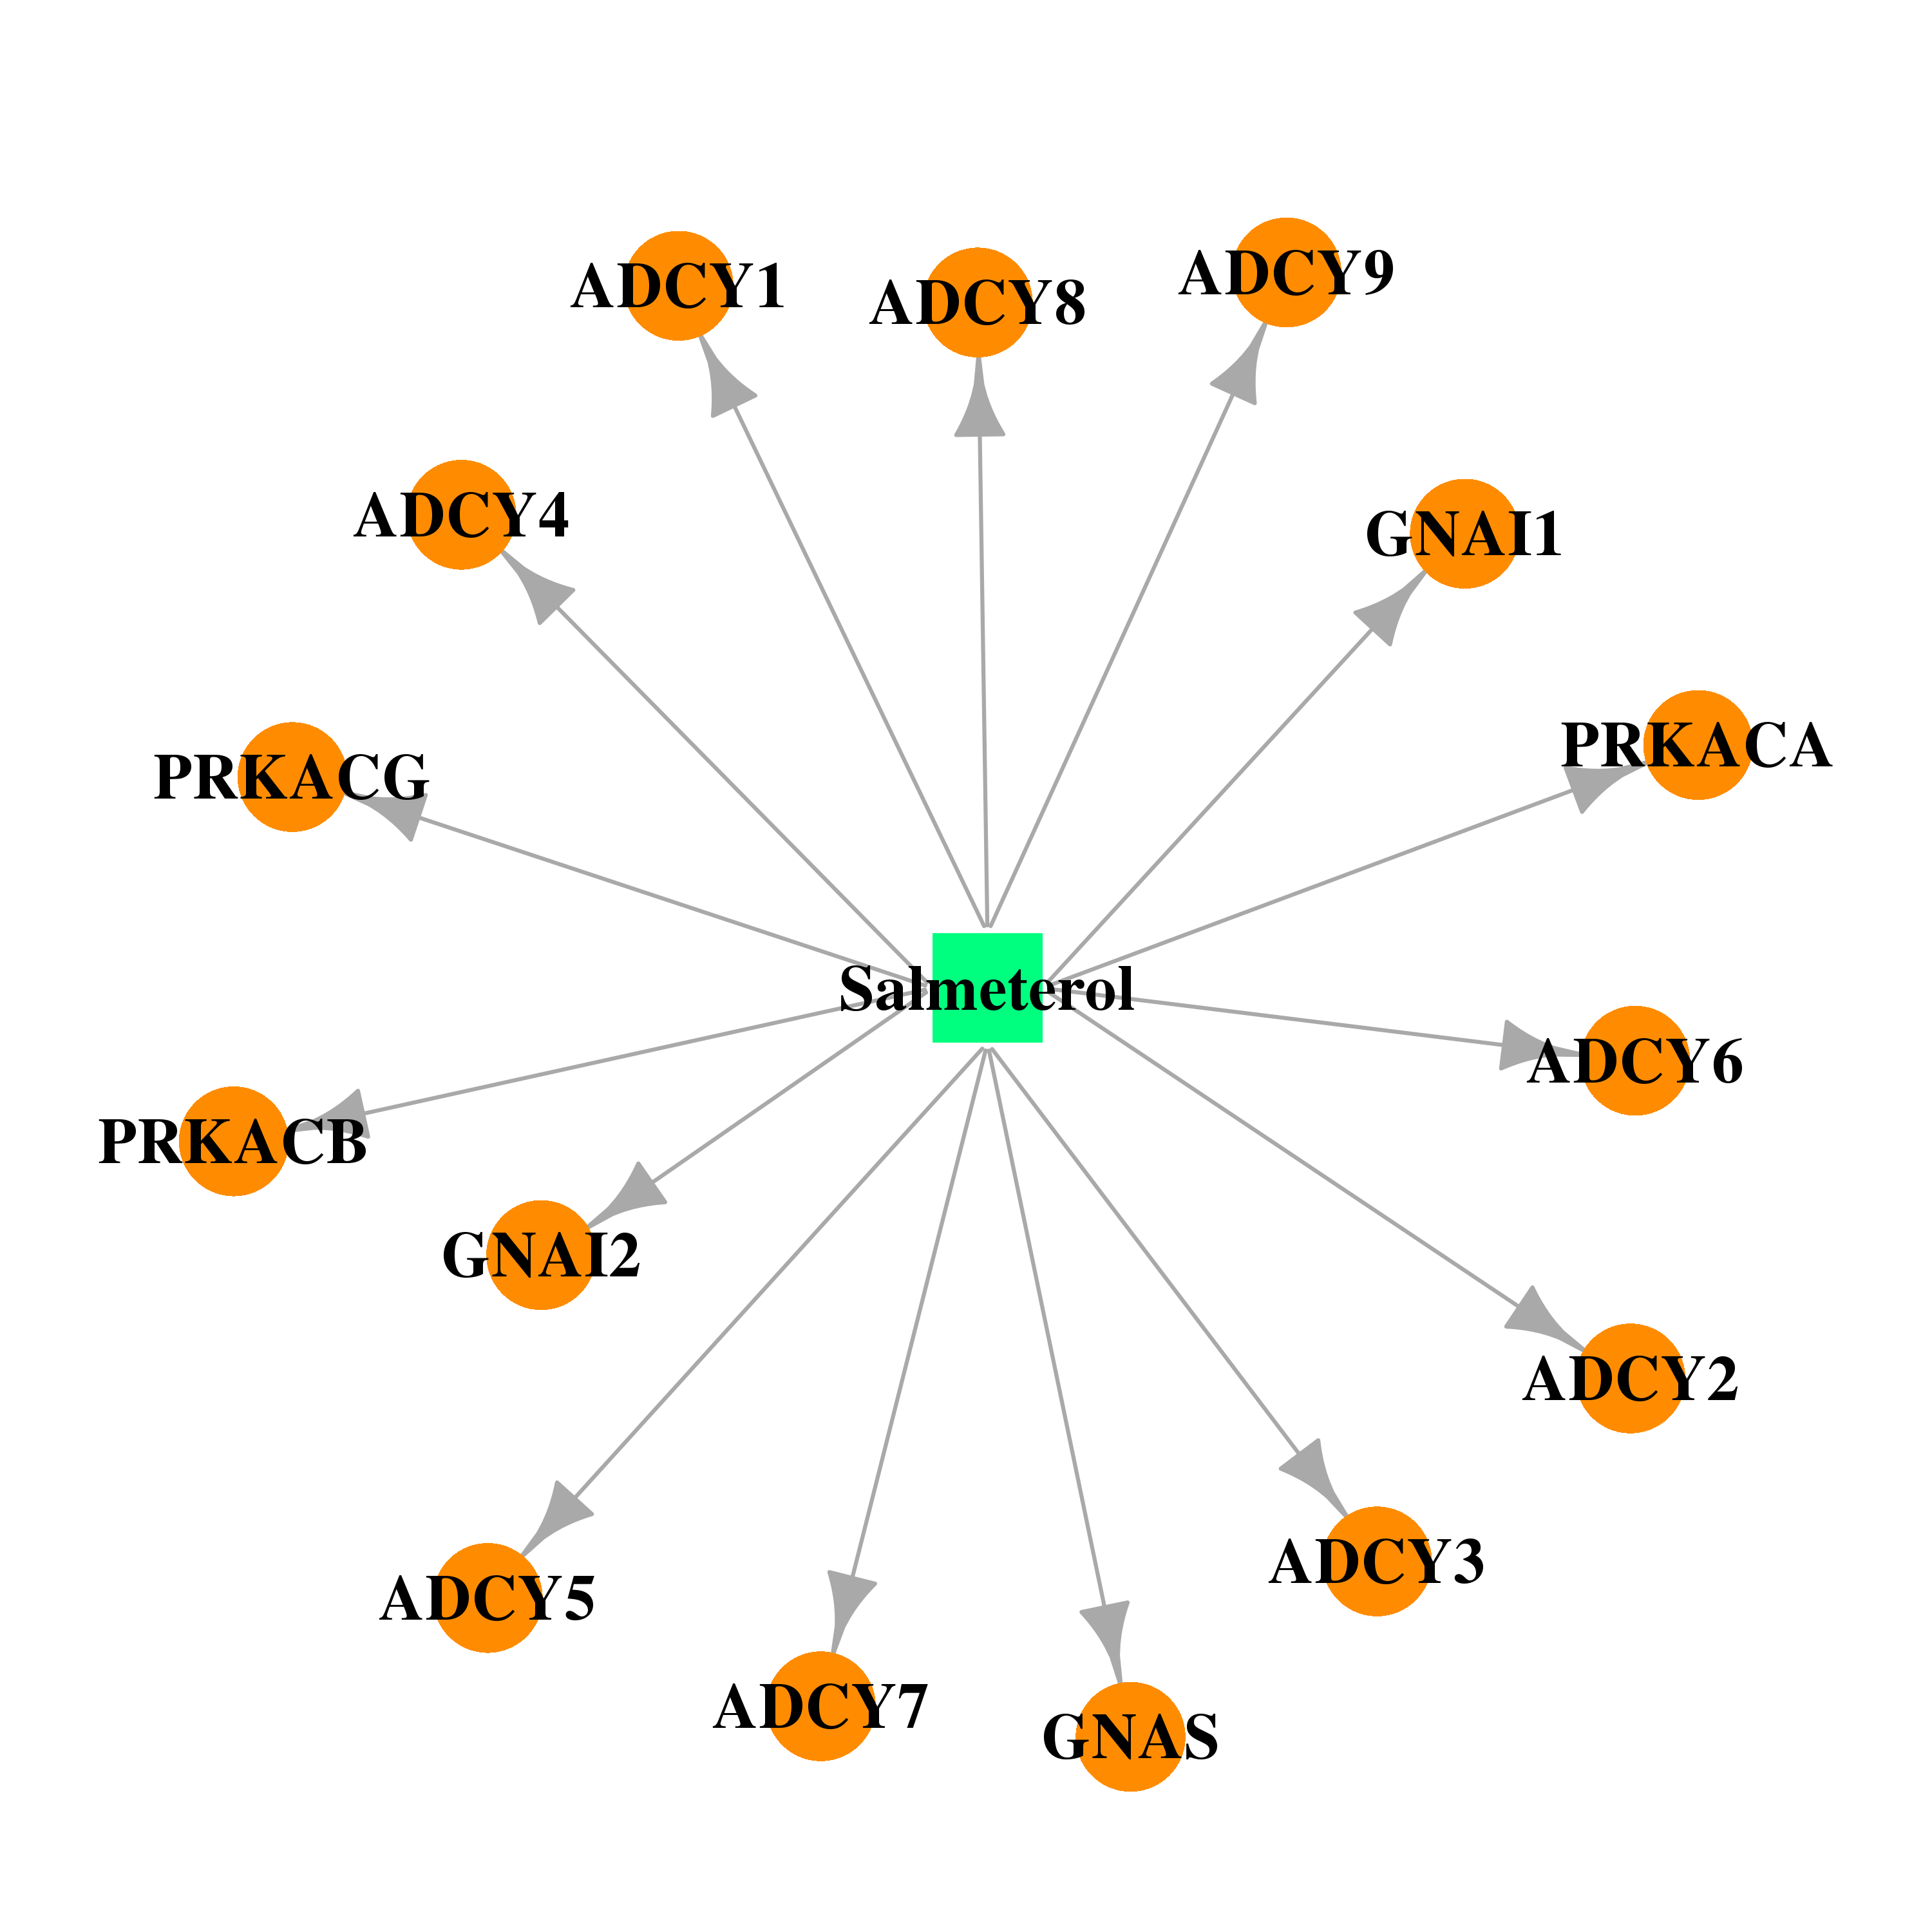 |  |
| Top |
| Cross referenced IDs for ADCY9 |
| * We obtained these cross-references from Uniprot database. It covers 150 different DBs, 18 categories. http://www.uniprot.org/help/cross_references_section |
: Open all cross reference information
|
Copyright © 2016-Present - The Univsersity of Texas Health Science Center at Houston @ |