|
||||||||||||||||||||
| |
| Phenotypic Information (metabolism pathway, cancer, disease, phenome) |
| |
| |
| Gene-Gene Network Information: Co-Expression Network, Interacting Genes & KEGG |
| |
|


| Gene Summary for CKB |
| Basic gene info. | Gene symbol | CKB |
| Gene name | creatine kinase, brain | |
| Synonyms | B-CK|BCK|CKBB|HEL-211|HEL-S-29 | |
| Cytomap | UCSC genome browser: 14q32 | |
| Genomic location | chr14 :103985994-103989196 | |
| Type of gene | protein-coding | |
| RefGenes | NM_001823.4, | |
| Ensembl id | ENSG00000166165 | |
| Description | creatine kinase B chaincreatine kinase B-typecreatine kinase-Bepididymis luminal protein 211epididymis secretory protein Li 29 | |
| Modification date | 20141222 | |
| dbXrefs | MIM : 123280 | |
| HGNC : HGNC | ||
| Ensembl : ENSG00000166165 | ||
| HPRD : 00423 | ||
| Vega : OTTHUMG00000171786 | ||
| Protein | UniProt: go to UniProt's Cross Reference DB Table | |
| Expression | CleanEX: HS_CKB | |
| BioGPS: 1152 | ||
| Gene Expression Atlas: ENSG00000166165 | ||
| The Human Protein Atlas: ENSG00000166165 | ||
| Pathway | NCI Pathway Interaction Database: CKB | |
| KEGG: CKB | ||
| REACTOME: CKB | ||
| ConsensusPathDB | ||
| Pathway Commons: CKB | ||
| Metabolism | MetaCyc: CKB | |
| HUMANCyc: CKB | ||
| Regulation | Ensembl's Regulation: ENSG00000166165 | |
| miRBase: chr14 :103,985,994-103,989,196 | ||
| TargetScan: NM_001823 | ||
| cisRED: ENSG00000166165 | ||
| Context | iHOP: CKB | |
| cancer metabolism search in PubMed: CKB | ||
| UCL Cancer Institute: CKB | ||
| Assigned class in ccmGDB | C | |
| Top |
| Phenotypic Information for CKB(metabolism pathway, cancer, disease, phenome) |
| Cancer | CGAP: CKB |
| Familial Cancer Database: CKB | |
| * This gene is included in those cancer gene databases. |
|
|
|
|
|
|
| ||||||||||||||
Oncogene 1 | Significant driver gene in | |||||||||||||||||||
| cf) number; DB name 1 Oncogene; http://nar.oxfordjournals.org/content/35/suppl_1/D721.long, 2 Tumor Suppressor gene; https://bioinfo.uth.edu/TSGene/, 3 Cancer Gene Census; http://www.nature.com/nrc/journal/v4/n3/abs/nrc1299.html, 4 CancerGenes; http://nar.oxfordjournals.org/content/35/suppl_1/D721.long, 5 Network of Cancer Gene; http://ncg.kcl.ac.uk/index.php, 1Therapeutic Vulnerabilities in Cancer; http://cbio.mskcc.org/cancergenomics/statius/ |
| KEGG_ARGININE_AND_PROLINE_METABOLISM REACTOME_METABOLISM_OF_AMINO_ACIDS_AND_DERIVATIVES | |
| OMIM | |
| Orphanet | |
| Disease | KEGG Disease: CKB |
| MedGen: CKB (Human Medical Genetics with Condition) | |
| ClinVar: CKB | |
| Phenotype | MGI: CKB (International Mouse Phenotyping Consortium) |
| PhenomicDB: CKB | |
| Mutations for CKB |
| * Under tables are showing count per each tissue to give us broad intuition about tissue specific mutation patterns.You can go to the detailed page for each mutation database's web site. |
| There's no structural variation information in COSMIC data for this gene. |
| * From mRNA Sanger sequences, Chitars2.0 arranged chimeric transcripts. This table shows CKB related fusion information. |
| ID | Head Gene | Tail Gene | Accession | Gene_a | qStart_a | qEnd_a | Chromosome_a | tStart_a | tEnd_a | Gene_a | qStart_a | qEnd_a | Chromosome_a | tStart_a | tEnd_a |
| EC545946 | STT3A | 1 | 66 | 11 | 125488308 | 125488374 | CKB | 59 | 103 | 14 | 103986331 | 103986376 | |
| BQ320356 | CKB | 16 | 112 | 14 | 103986637 | 103986893 | CKB | 109 | 221 | 14 | 103986507 | 103986619 | |
| AW176753 | PSAP | 47 | 85 | 10 | 73577047 | 73577085 | CKB | 85 | 175 | 14 | 103986228 | 103986318 | |
| BQ320618 | CKB | 29 | 114 | 14 | 103986637 | 103986879 | CKB | 111 | 223 | 14 | 103986507 | 103986619 | |
| CX164716 | B4GALT5 | 1 | 177 | 20 | 48250835 | 48251011 | CKB | 178 | 574 | 14 | 103987747 | 103988721 | |
| BQ057560 | SORBS2 | 1 | 77 | 4 | 186510307 | 186510383 | CKB | 76 | 532 | 14 | 103988193 | 103988844 | |
| AW847911 | CKB | 1 | 109 | 14 | 103988372 | 103988480 | LSM14B | 97 | 451 | 20 | 60701377 | 60704959 | |
| BP218932 | CKB | 2 | 331 | 14 | 103986496 | 103987652 | CKB | 331 | 407 | 14 | 103987662 | 103987738 | |
| BE928567 | FNBP1 | 12 | 152 | 9 | 132797434 | 132797574 | CKB | 147 | 294 | 14 | 103988695 | 103988842 | |
| AI203968 | CKB | 135 | 283 | 14 | 103988182 | 103988402 | CKB | 280 | 526 | 14 | 103988465 | 103988834 | |
| AI184838 | PCNP | 1 | 102 | 3 | 101295064 | 101295384 | CKB | 99 | 547 | 14 | 103987665 | 103988699 | |
| BM690229 | CKB | 9 | 72 | 14 | 103986201 | 103986264 | CKB | 61 | 521 | 14 | 103986820 | 103988405 | |
| BQ060799 | SORBS2 | 1 | 77 | 4 | 186510307 | 186510383 | CKB | 76 | 881 | 14 | 103986806 | 103988844 | |
| Top |
| There's no copy number variation information in COSMIC data for this gene. |
| Top |
|
 |
| Top |
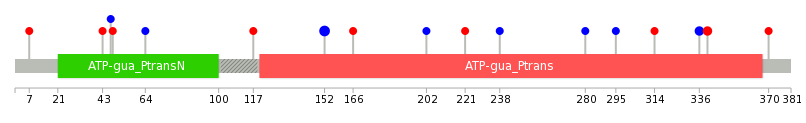
| Stat. for Non-Synonymous SNVs (# total SNVs=7) | (# total SNVs=8) |
 |  |
(# total SNVs=0) | (# total SNVs=0) |
| Top |
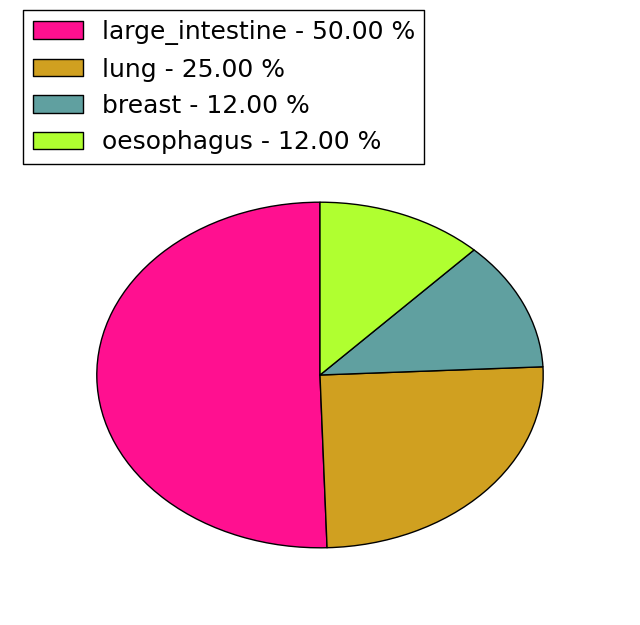
| * When you move the cursor on each content, you can see more deailed mutation information on the Tooltip. Those are primary_site,primary_histology,mutation(aa),pubmedID. |
| GRCh37 position | Mutation(aa) | Unique sampleID count |
| chr14:103988180-103988180 | p.R152R | 4 |
| chr14:103986328-103986328 | p.D340A | 2 |
| chr14:103986339-103986339 | p.V336V | 2 |
| chr14:103986586-103986586 | p.I280I | 1 |
| chr14:103988703-103988703 | p.R43H | 1 |
| chr14:103986650-103986650 | p.? | 1 |
| chr14:103988811-103988811 | p.H7P | 1 |
| chr14:103986869-103986869 | p.I238I | 1 |
| chr14:103986922-103986922 | p.D221Y | 1 |
| chr14:103987647-103987647 | p.L202L | 1 |
| Top |
|
 |
| Point Mutation/ Tissue ID | 1 | 2 | 3 | 4 | 5 | 6 | 7 | 8 | 9 | 10 | 11 | 12 | 13 | 14 | 15 | 16 | 17 | 18 | 19 | 20 |
| # sample | 2 | 2 | 1 | 3 | 2 | 1 | 2 | |||||||||||||
| # mutation | 2 | 2 | 1 | 3 | 2 | 1 | 2 | |||||||||||||
| nonsynonymous SNV | 1 | 1 | 1 | 3 | 1 | 2 | ||||||||||||||
| synonymous SNV | 1 | 1 | 2 |
| cf) Tissue ID; Tissue type (1; BLCA[Bladder Urothelial Carcinoma], 2; BRCA[Breast invasive carcinoma], 3; CESC[Cervical squamous cell carcinoma and endocervical adenocarcinoma], 4; COAD[Colon adenocarcinoma], 5; GBM[Glioblastoma multiforme], 6; Glioma Low Grade, 7; HNSC[Head and Neck squamous cell carcinoma], 8; KICH[Kidney Chromophobe], 9; KIRC[Kidney renal clear cell carcinoma], 10; KIRP[Kidney renal papillary cell carcinoma], 11; LAML[Acute Myeloid Leukemia], 12; LUAD[Lung adenocarcinoma], 13; LUSC[Lung squamous cell carcinoma], 14; OV[Ovarian serous cystadenocarcinoma ], 15; PAAD[Pancreatic adenocarcinoma], 16; PRAD[Prostate adenocarcinoma], 17; SKCM[Skin Cutaneous Melanoma], 18:STAD[Stomach adenocarcinoma], 19:THCA[Thyroid carcinoma], 20:UCEC[Uterine Corpus Endometrial Carcinoma]) |
| Top |
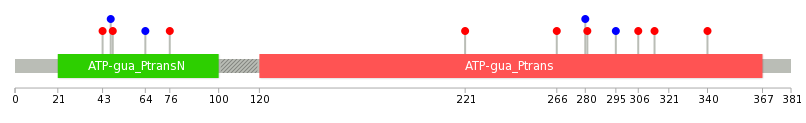
| * We represented just top 10 SNVs. When you move the cursor on each content, you can see more deailed mutation information on the Tooltip. Those are primary_site, primary_histology, mutation(aa), pubmedID. |
| Genomic Position | Mutation(aa) | Unique sampleID count |
| chr14:103986586 | p.S266F | 1 |
| chr14:103986629 | p.D221Y | 1 |
| chr14:103986922 | p.A76V | 1 |
| chr14:103988481 | p.P64P | 1 |
| chr14:103988639 | p.P48R | 1 |
| chr14:103988688 | p.T47T | 1 |
| chr14:103986328 | p.R43L | 1 |
| chr14:103988690 | p.D340A | 1 |
| chr14:103986486 | p.R314W | 1 |
| chr14:103988703 | p.E306K | 1 |
| * Copy number data were extracted from TCGA using R package TCGA-Assembler. The URLs of all public data files on TCGA DCC data server were gathered on Jan-05-2015. Function ProcessCNAData in TCGA-Assembler package was used to obtain gene-level copy number value which is calculated as the average copy number of the genomic region of a gene. |
 |
| cf) Tissue ID[Tissue type]: BLCA[Bladder Urothelial Carcinoma], BRCA[Breast invasive carcinoma], CESC[Cervical squamous cell carcinoma and endocervical adenocarcinoma], COAD[Colon adenocarcinoma], GBM[Glioblastoma multiforme], Glioma Low Grade, HNSC[Head and Neck squamous cell carcinoma], KICH[Kidney Chromophobe], KIRC[Kidney renal clear cell carcinoma], KIRP[Kidney renal papillary cell carcinoma], LAML[Acute Myeloid Leukemia], LUAD[Lung adenocarcinoma], LUSC[Lung squamous cell carcinoma], OV[Ovarian serous cystadenocarcinoma ], PAAD[Pancreatic adenocarcinoma], PRAD[Prostate adenocarcinoma], SKCM[Skin Cutaneous Melanoma], STAD[Stomach adenocarcinoma], THCA[Thyroid carcinoma], UCEC[Uterine Corpus Endometrial Carcinoma] |
| Top |
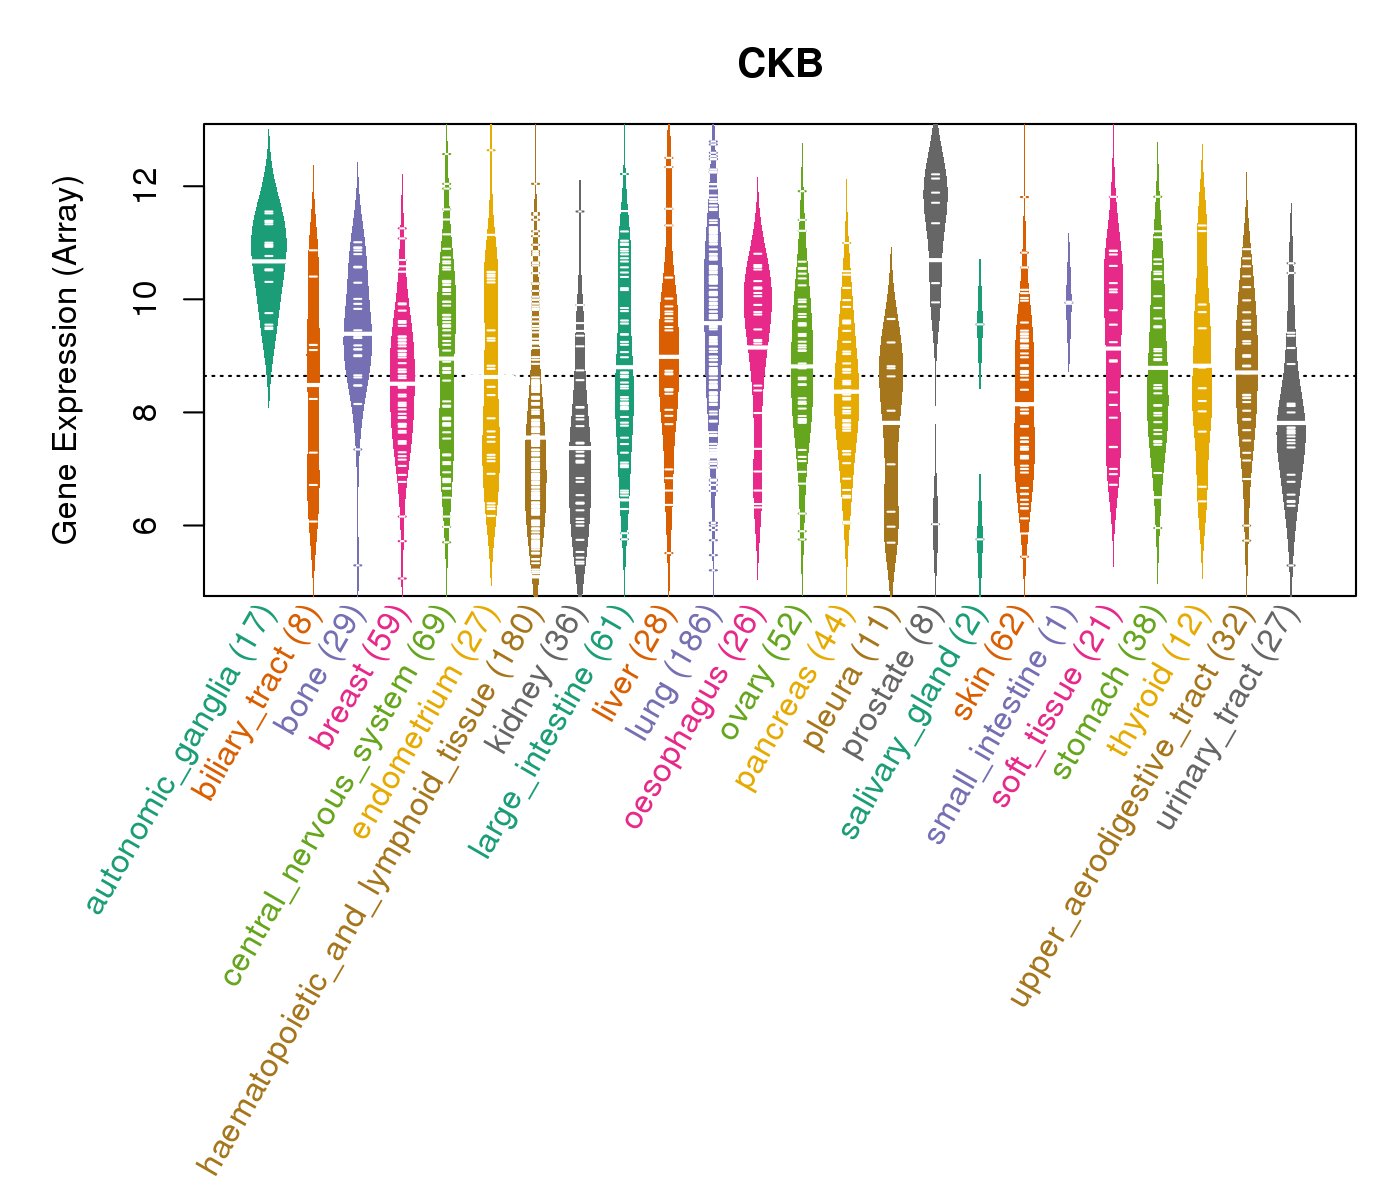
| Gene Expression for CKB |
| * CCLE gene expression data were extracted from CCLE_Expression_Entrez_2012-10-18.res: Gene-centric RMA-normalized mRNA expression data. |
 |
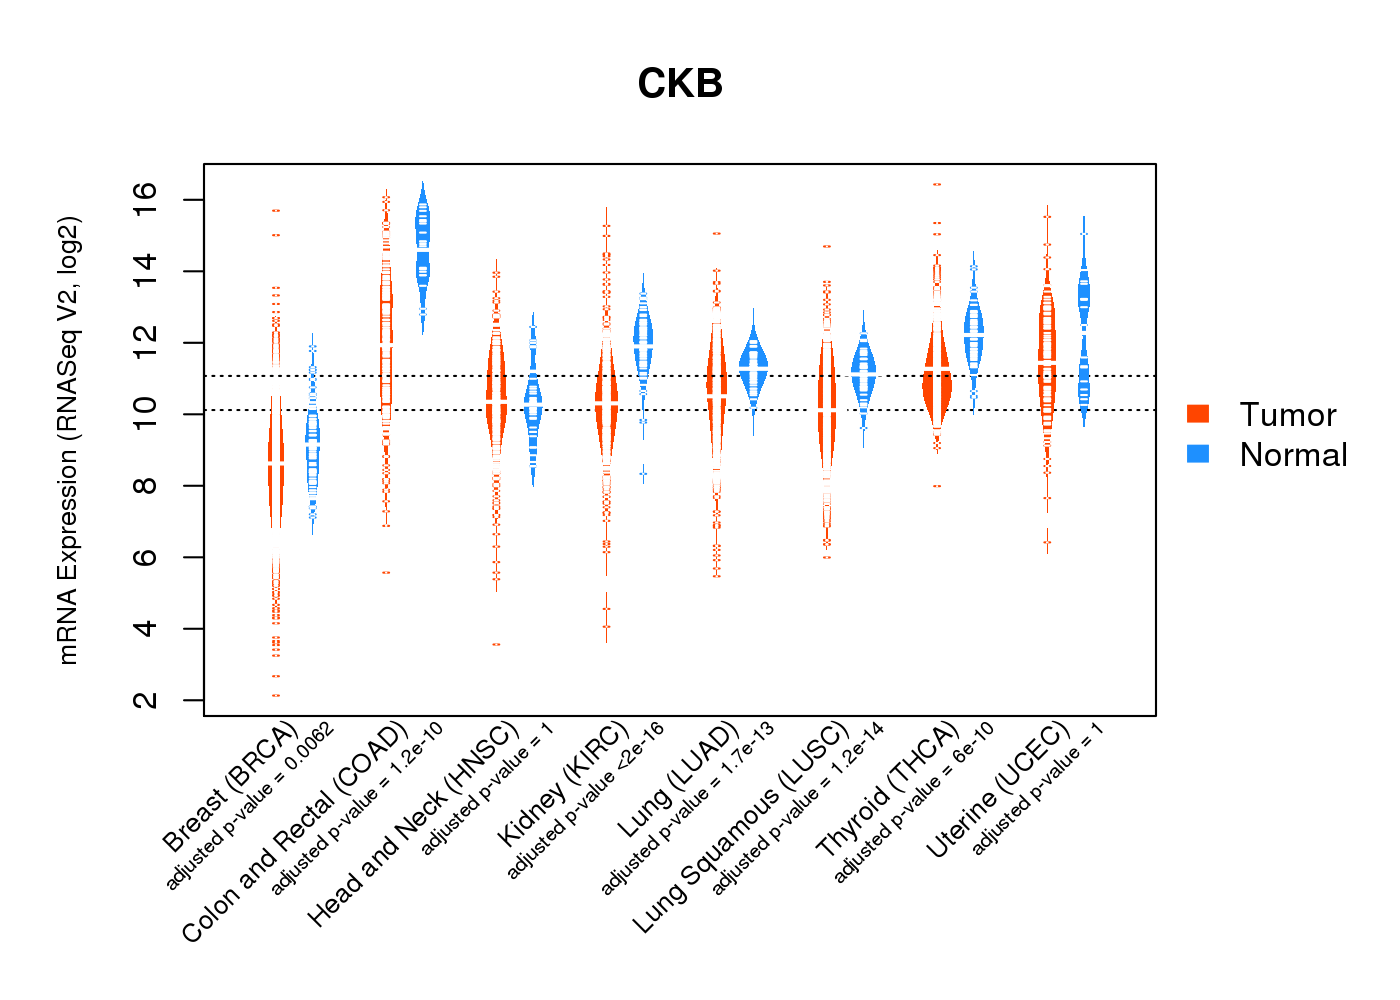
| * Normalized gene expression data of RNASeqV2 was extracted from TCGA using R package TCGA-Assembler. The URLs of all public data files on TCGA DCC data server were gathered at Jan-05-2015. Only eight cancer types have enough normal control samples for differential expression analysis. (t test, adjusted p<0.05 (using Benjamini-Hochberg FDR)) |
 |
| Top |
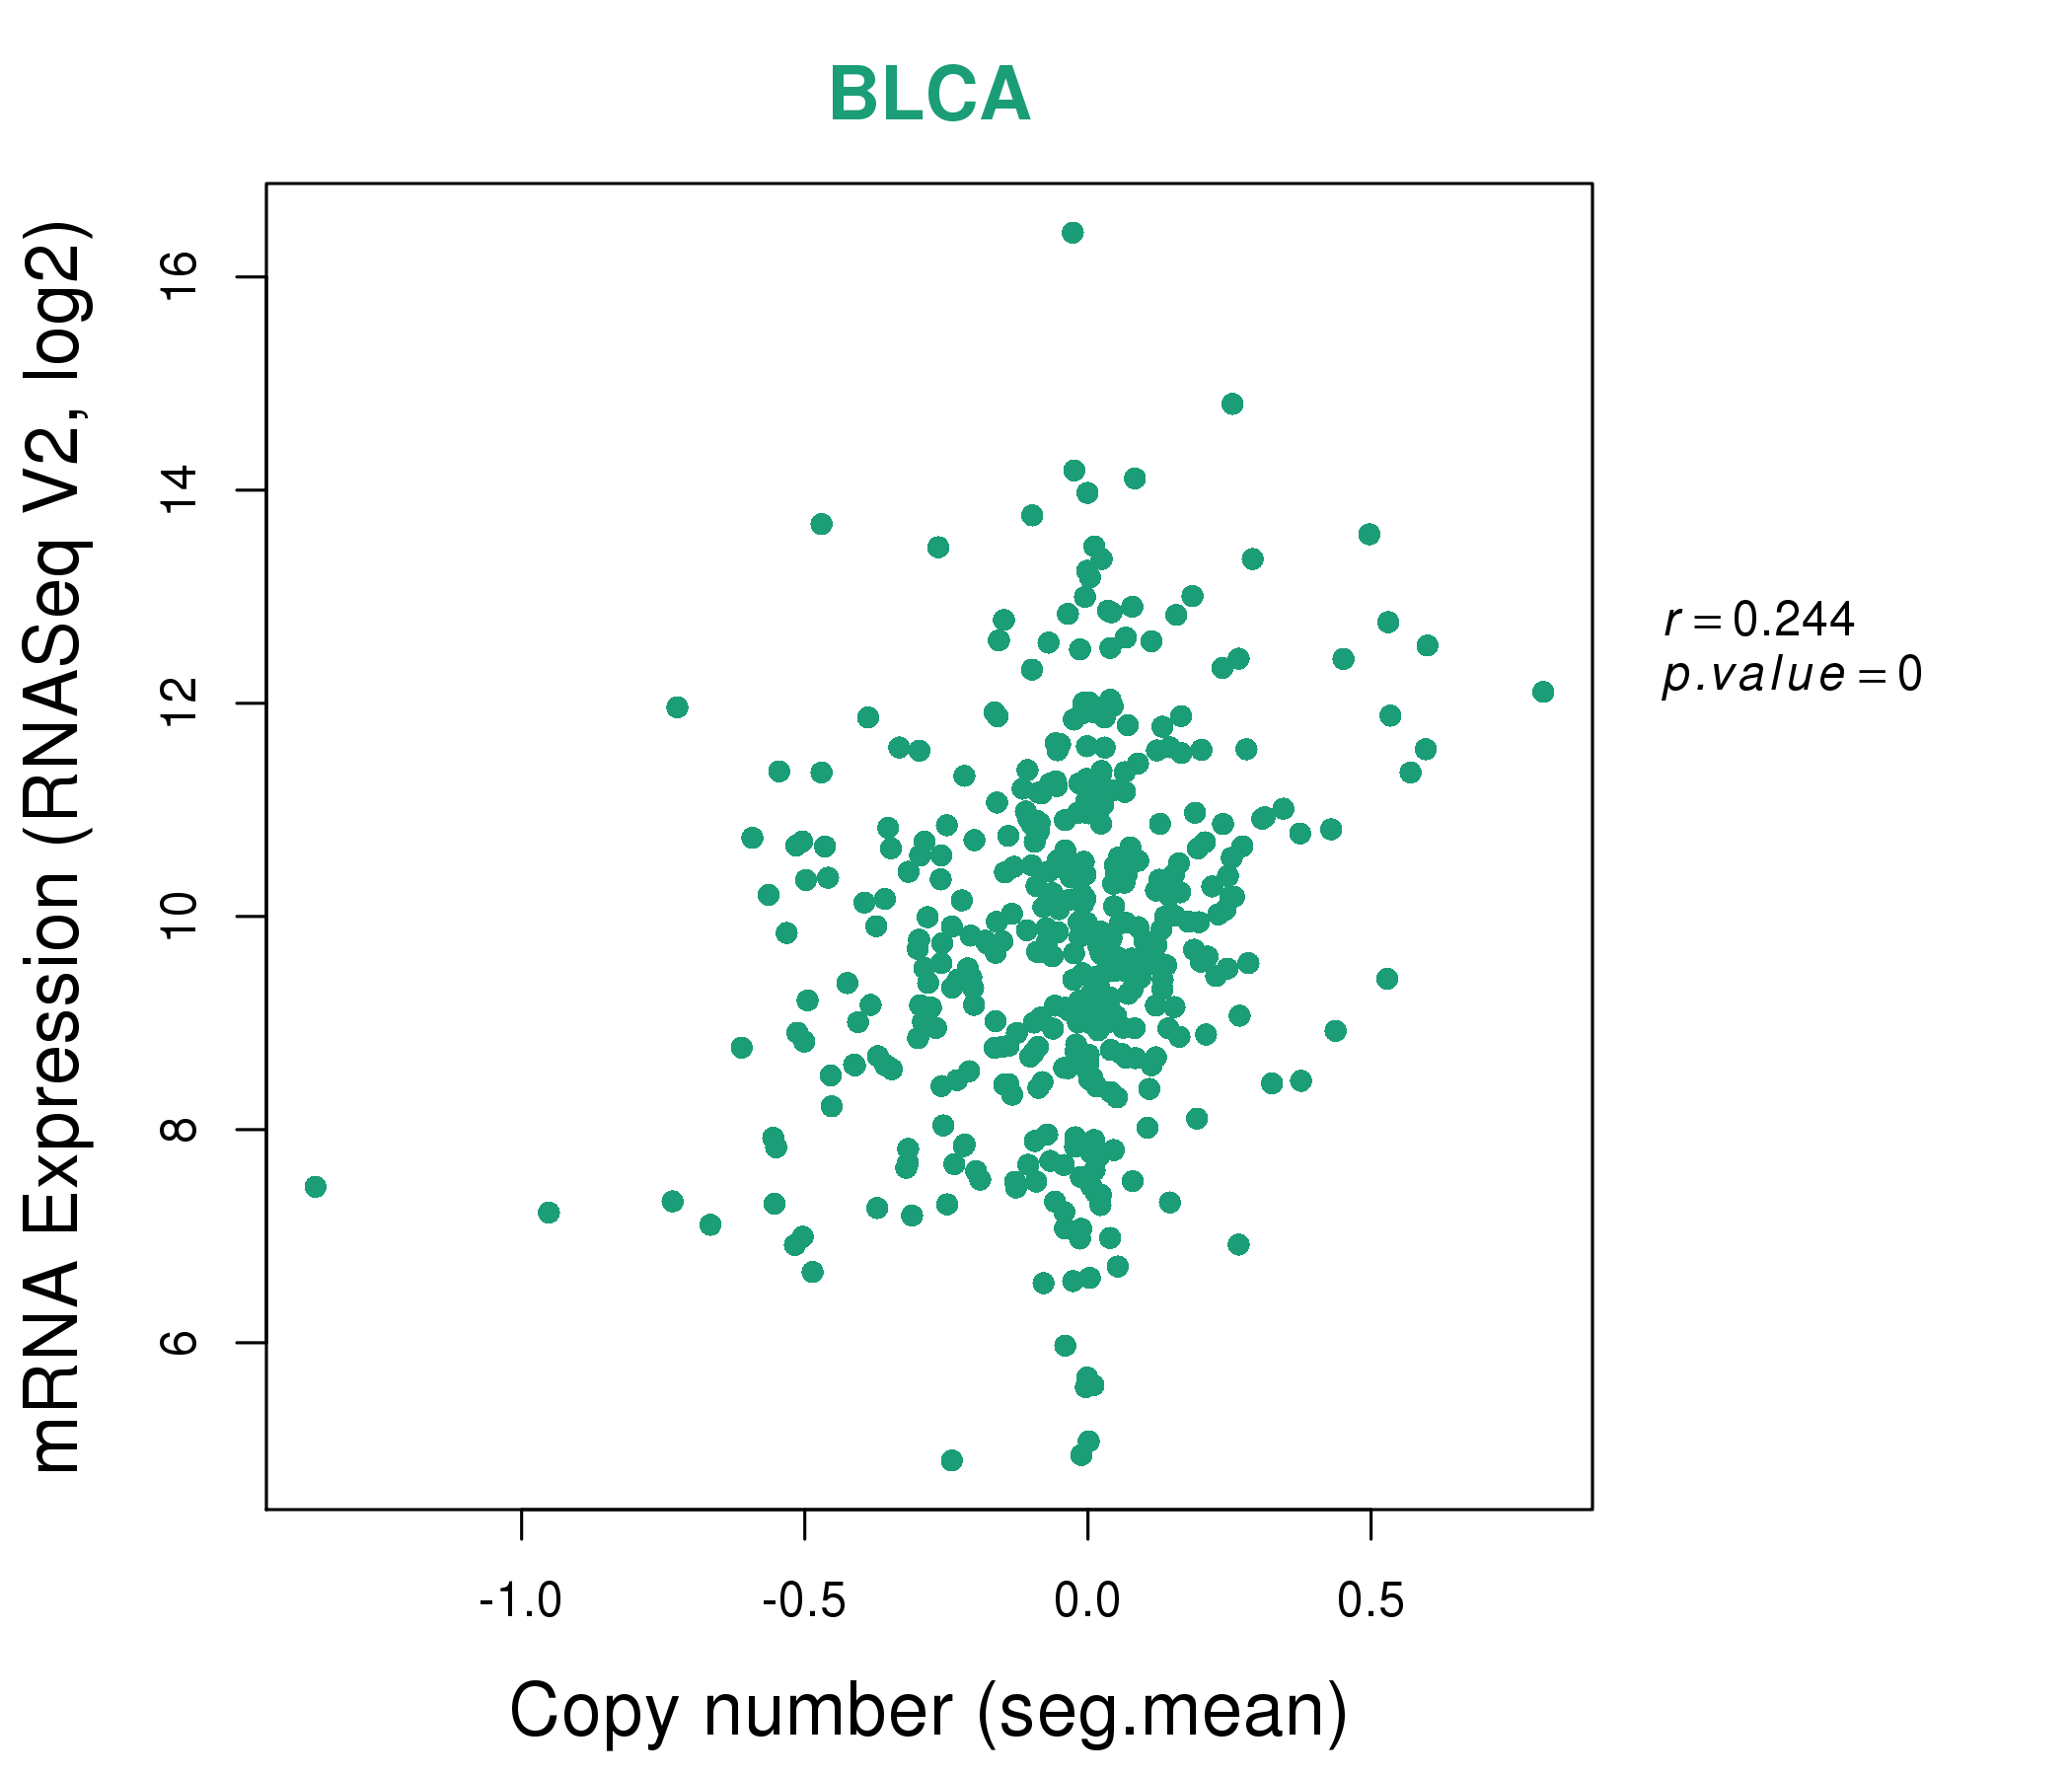
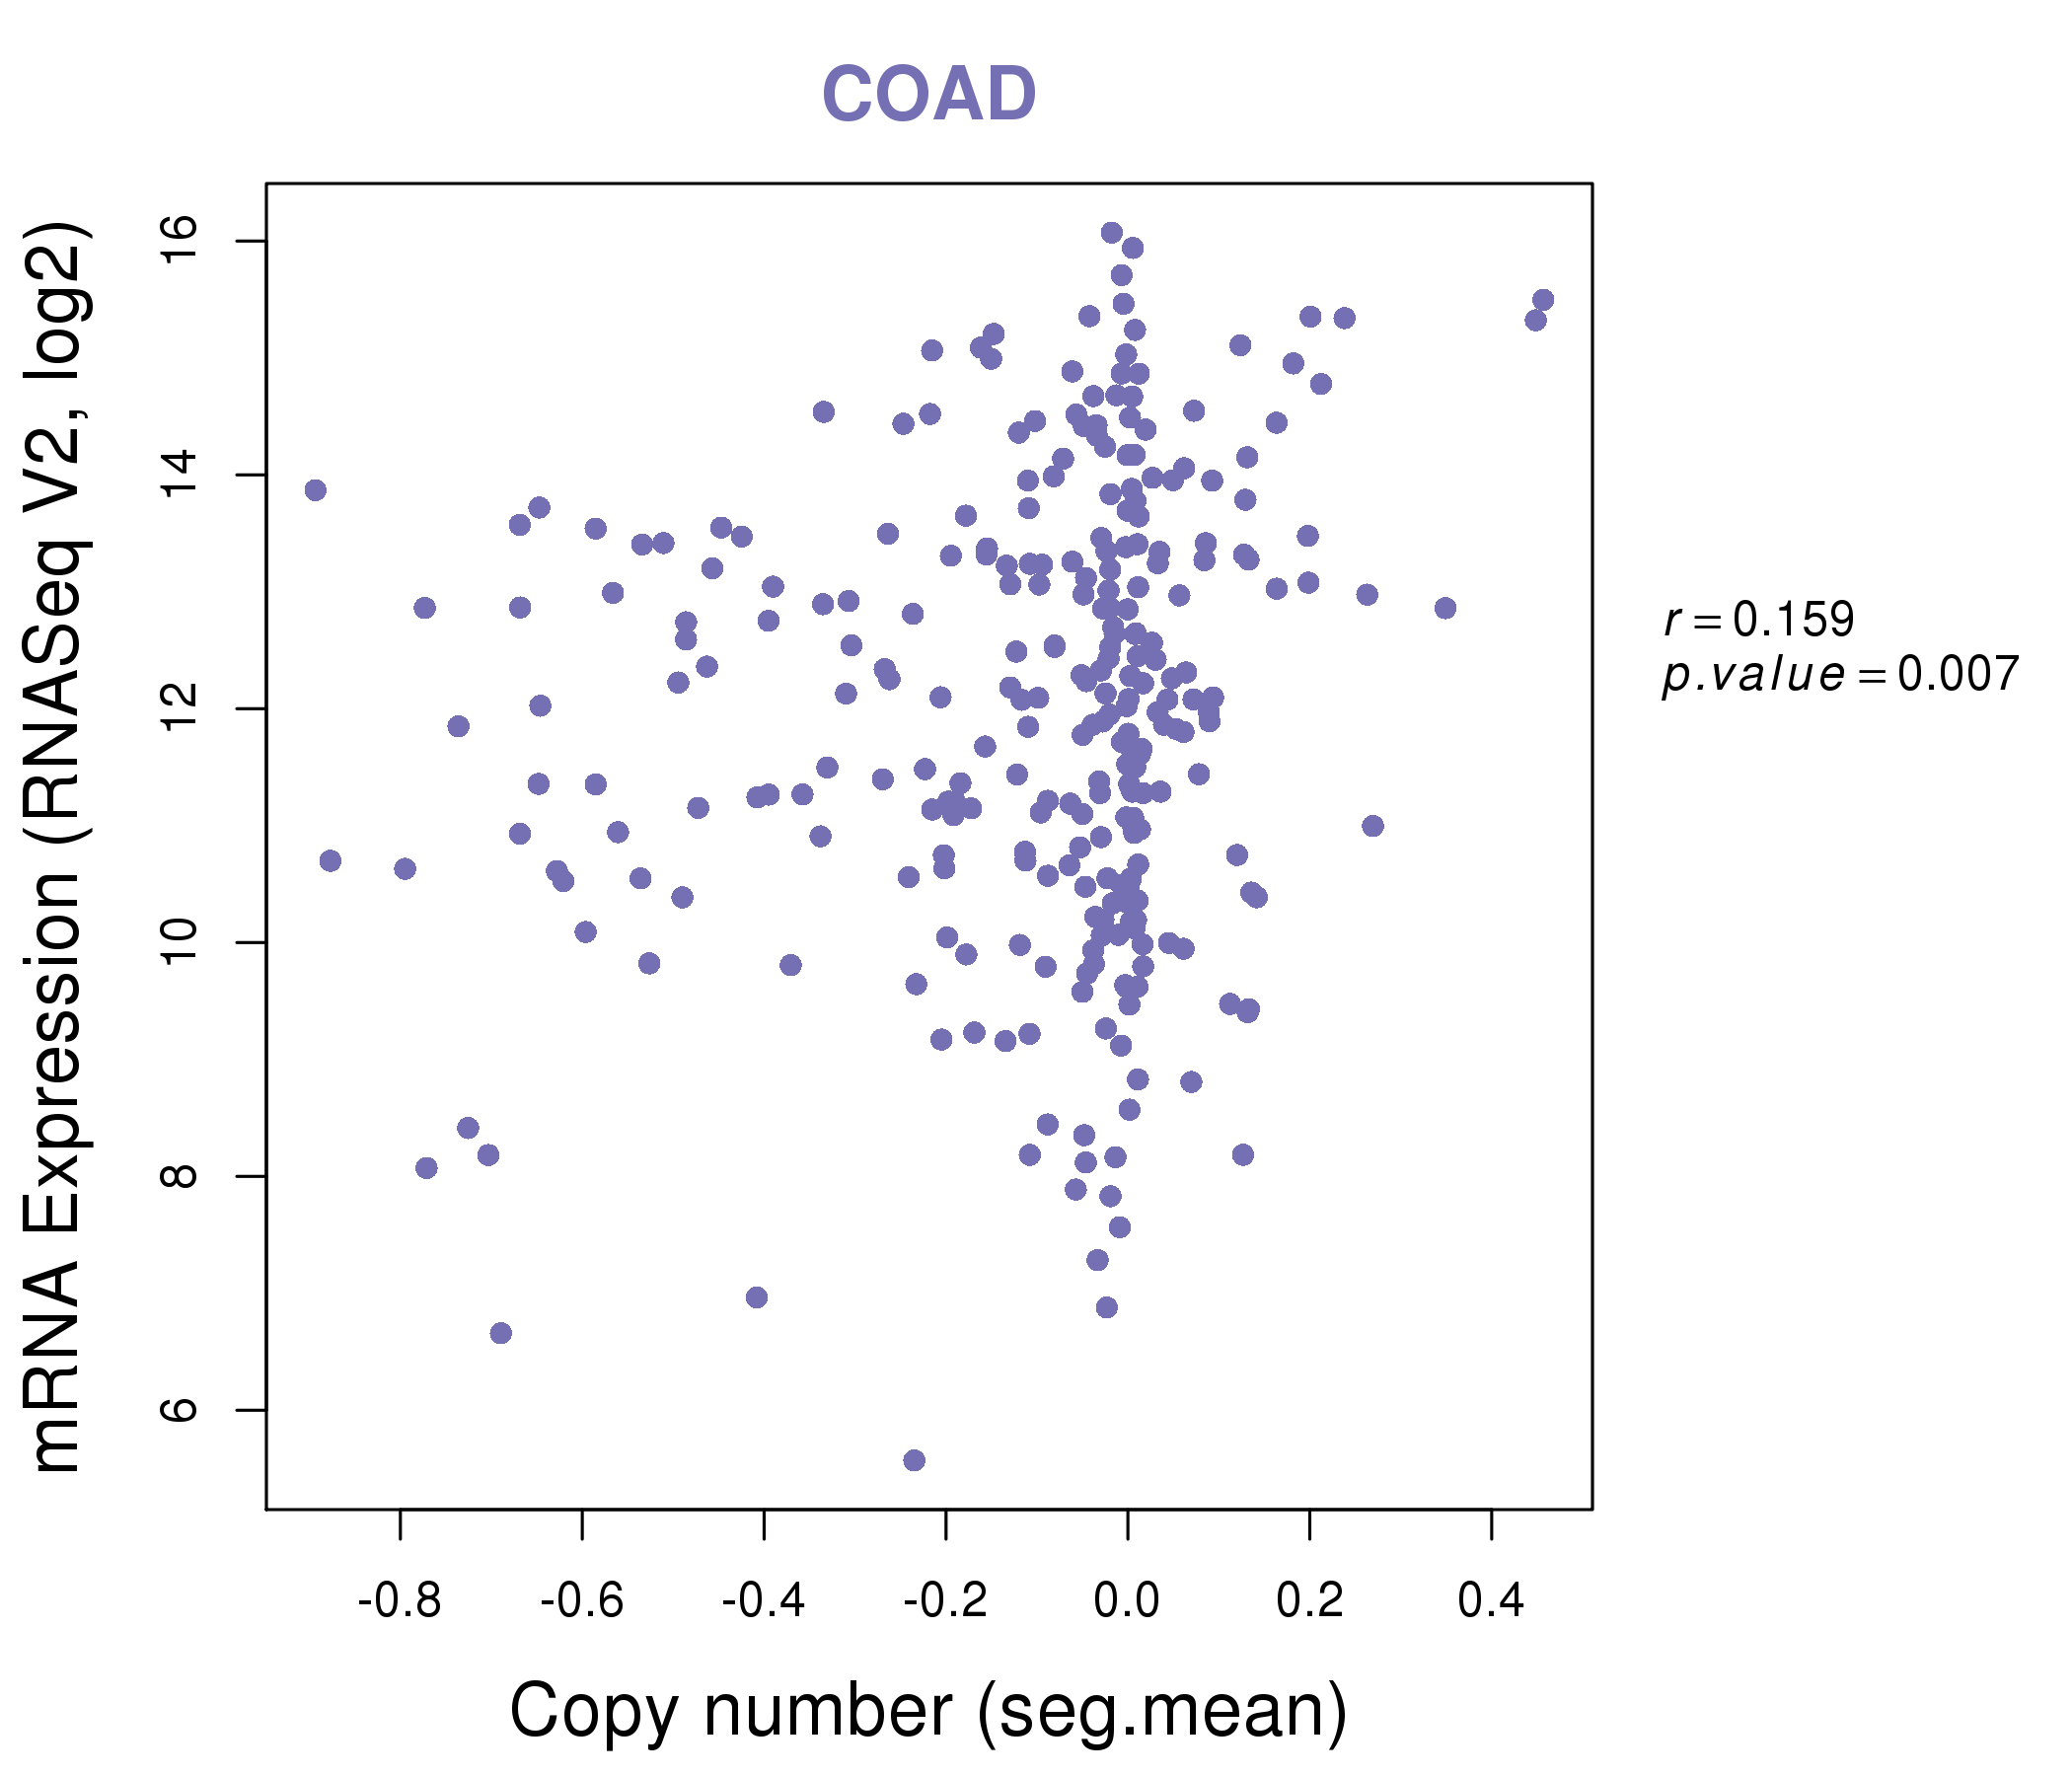
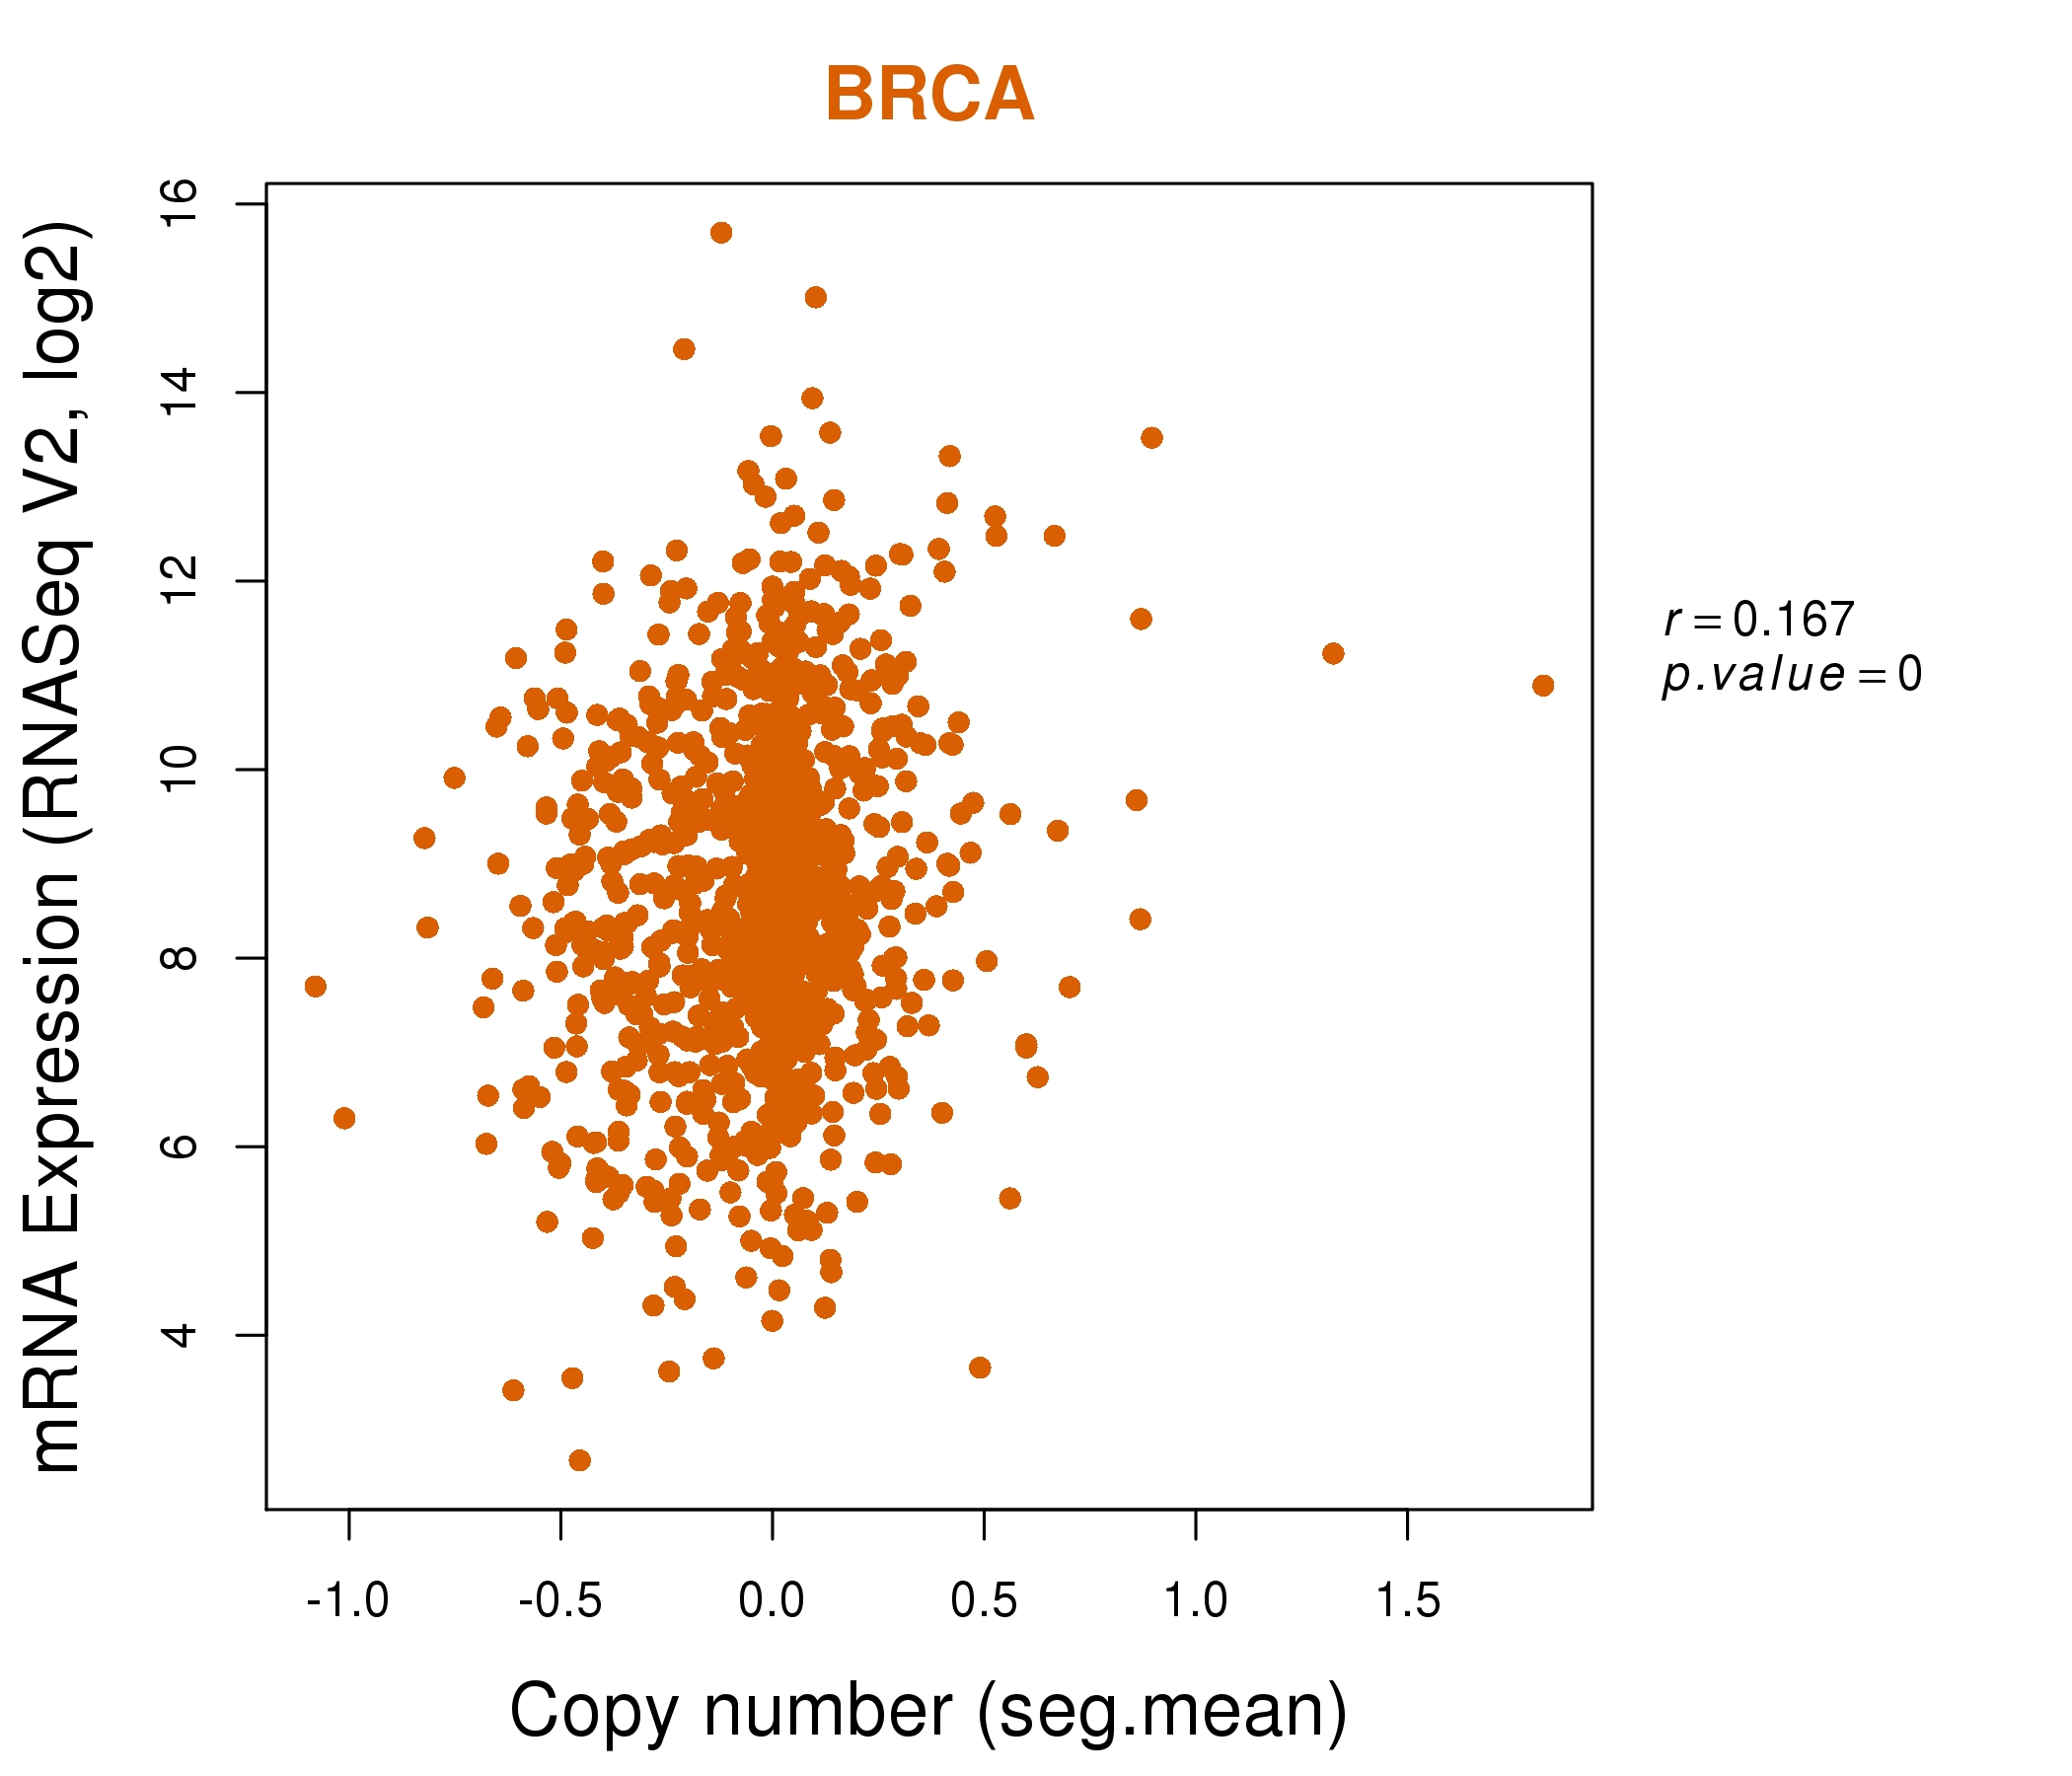
| * This plots show the correlation between CNV and gene expression. |
: Open all plots for all cancer types
 |
|
 |
|

| Top |
| Gene-Gene Network Information |
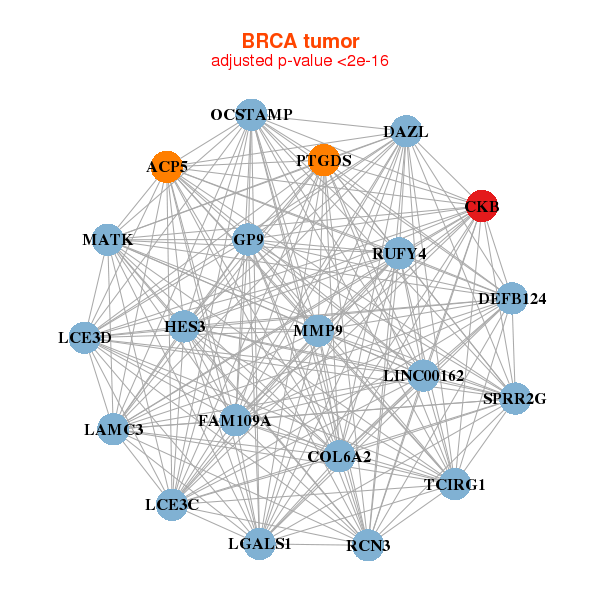
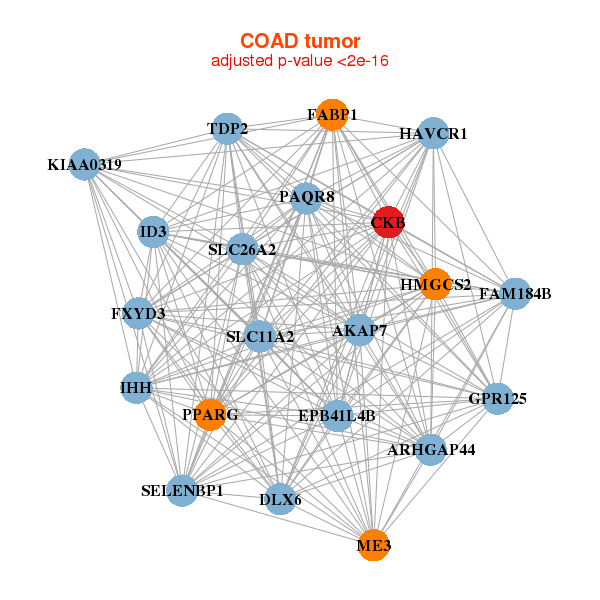
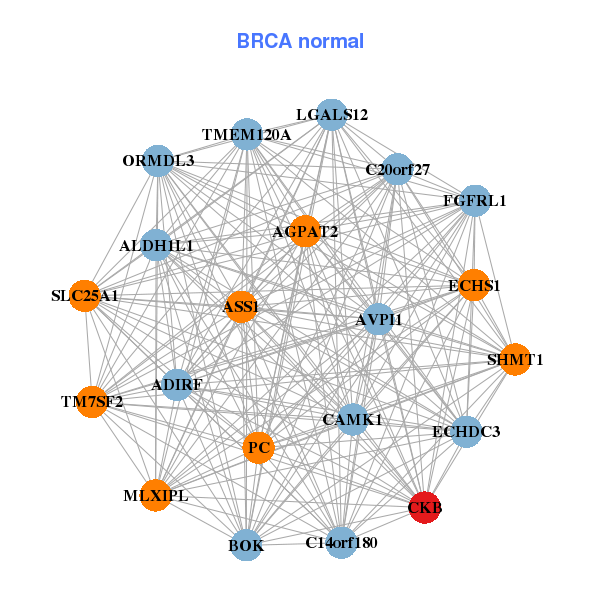
| * Co-Expression network figures were drawn using R package igraph. Only the top 20 genes with the highest correlations were shown. Red circle: input gene, orange circle: cell metabolism gene, sky circle: other gene |
: Open all plots for all cancer types
 |
| ||||
| ACP5,OCSTAMP,CKB,COL6A2,DAZL,DEFB124,FAM109A, GP9,HES3,LAMC3,LCE3C,LCE3D,LGALS1,MATK, MMP9,LINC00162,PTGDS,RCN3,RUFY4,SPRR2G,TCIRG1 | AGPAT2,ALDH1L1,ASS1,AVPI1,BOK,ADIRF,C14orf180, C20orf27,CAMK1,CKB,ECHDC3,ECHS1,FGFRL1,LGALS12, MLXIPL,ORMDL3,PC,SHMT1,SLC25A1,TM7SF2,TMEM120A | ||||
 |
| ||||
| AKAP7,CKB,DLX6,EPB41L4B,FABP1,FAM184B,FXYD3, GPR125,HAVCR1,HMGCS2,ID3,IHH,KIAA0319,ME3, PAQR8,PPARG,ARHGAP44,SELENBP1,SLC11A2,SLC26A2,TDP2 | CKB,FXYD3,GALNT12,ILDR1,CCDC183,LSR,MAGIX, MMP28,NHEJ1,OAF,PIGZ,PRDX6,RAB40B,RHBDL2, RIMKLA,SLC26A6,SNX15,TMEM72,TSEN34,ZBTB22,ZBTB42 |
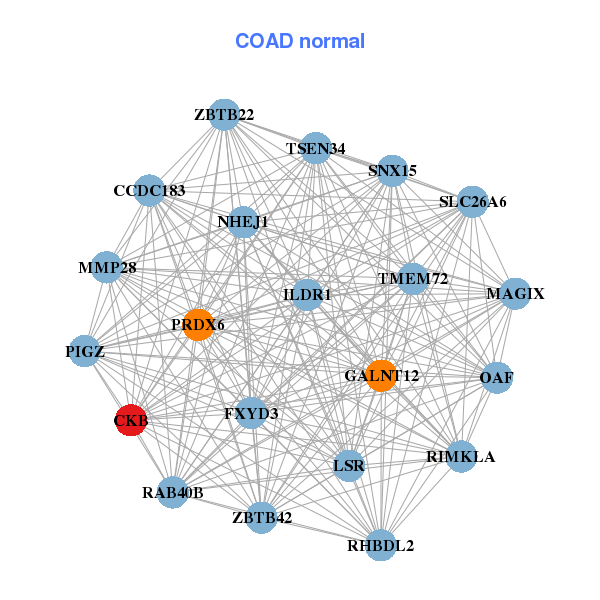
| * Co-Expression network figures were drawn using R package igraph. Only the top 20 genes with the highest correlations were shown. Red circle: input gene, orange circle: cell metabolism gene, sky circle: other gene |
: Open all plots for all cancer types
| Top |
: Open all interacting genes' information including KEGG pathway for all interacting genes from DAVID
| Top |
| Pharmacological Information for CKB |
| DB Category | DB Name | DB's ID and Url link |
| * Gene Centered Interaction Network. |
 |
| * Drug Centered Interaction Network. |
| DrugBank ID | Target Name | Drug Groups | Generic Name | Drug Centered Network | Drug Structure |
| DB00148 | creatine kinase, brain | approved; nutraceutical | Creatine | 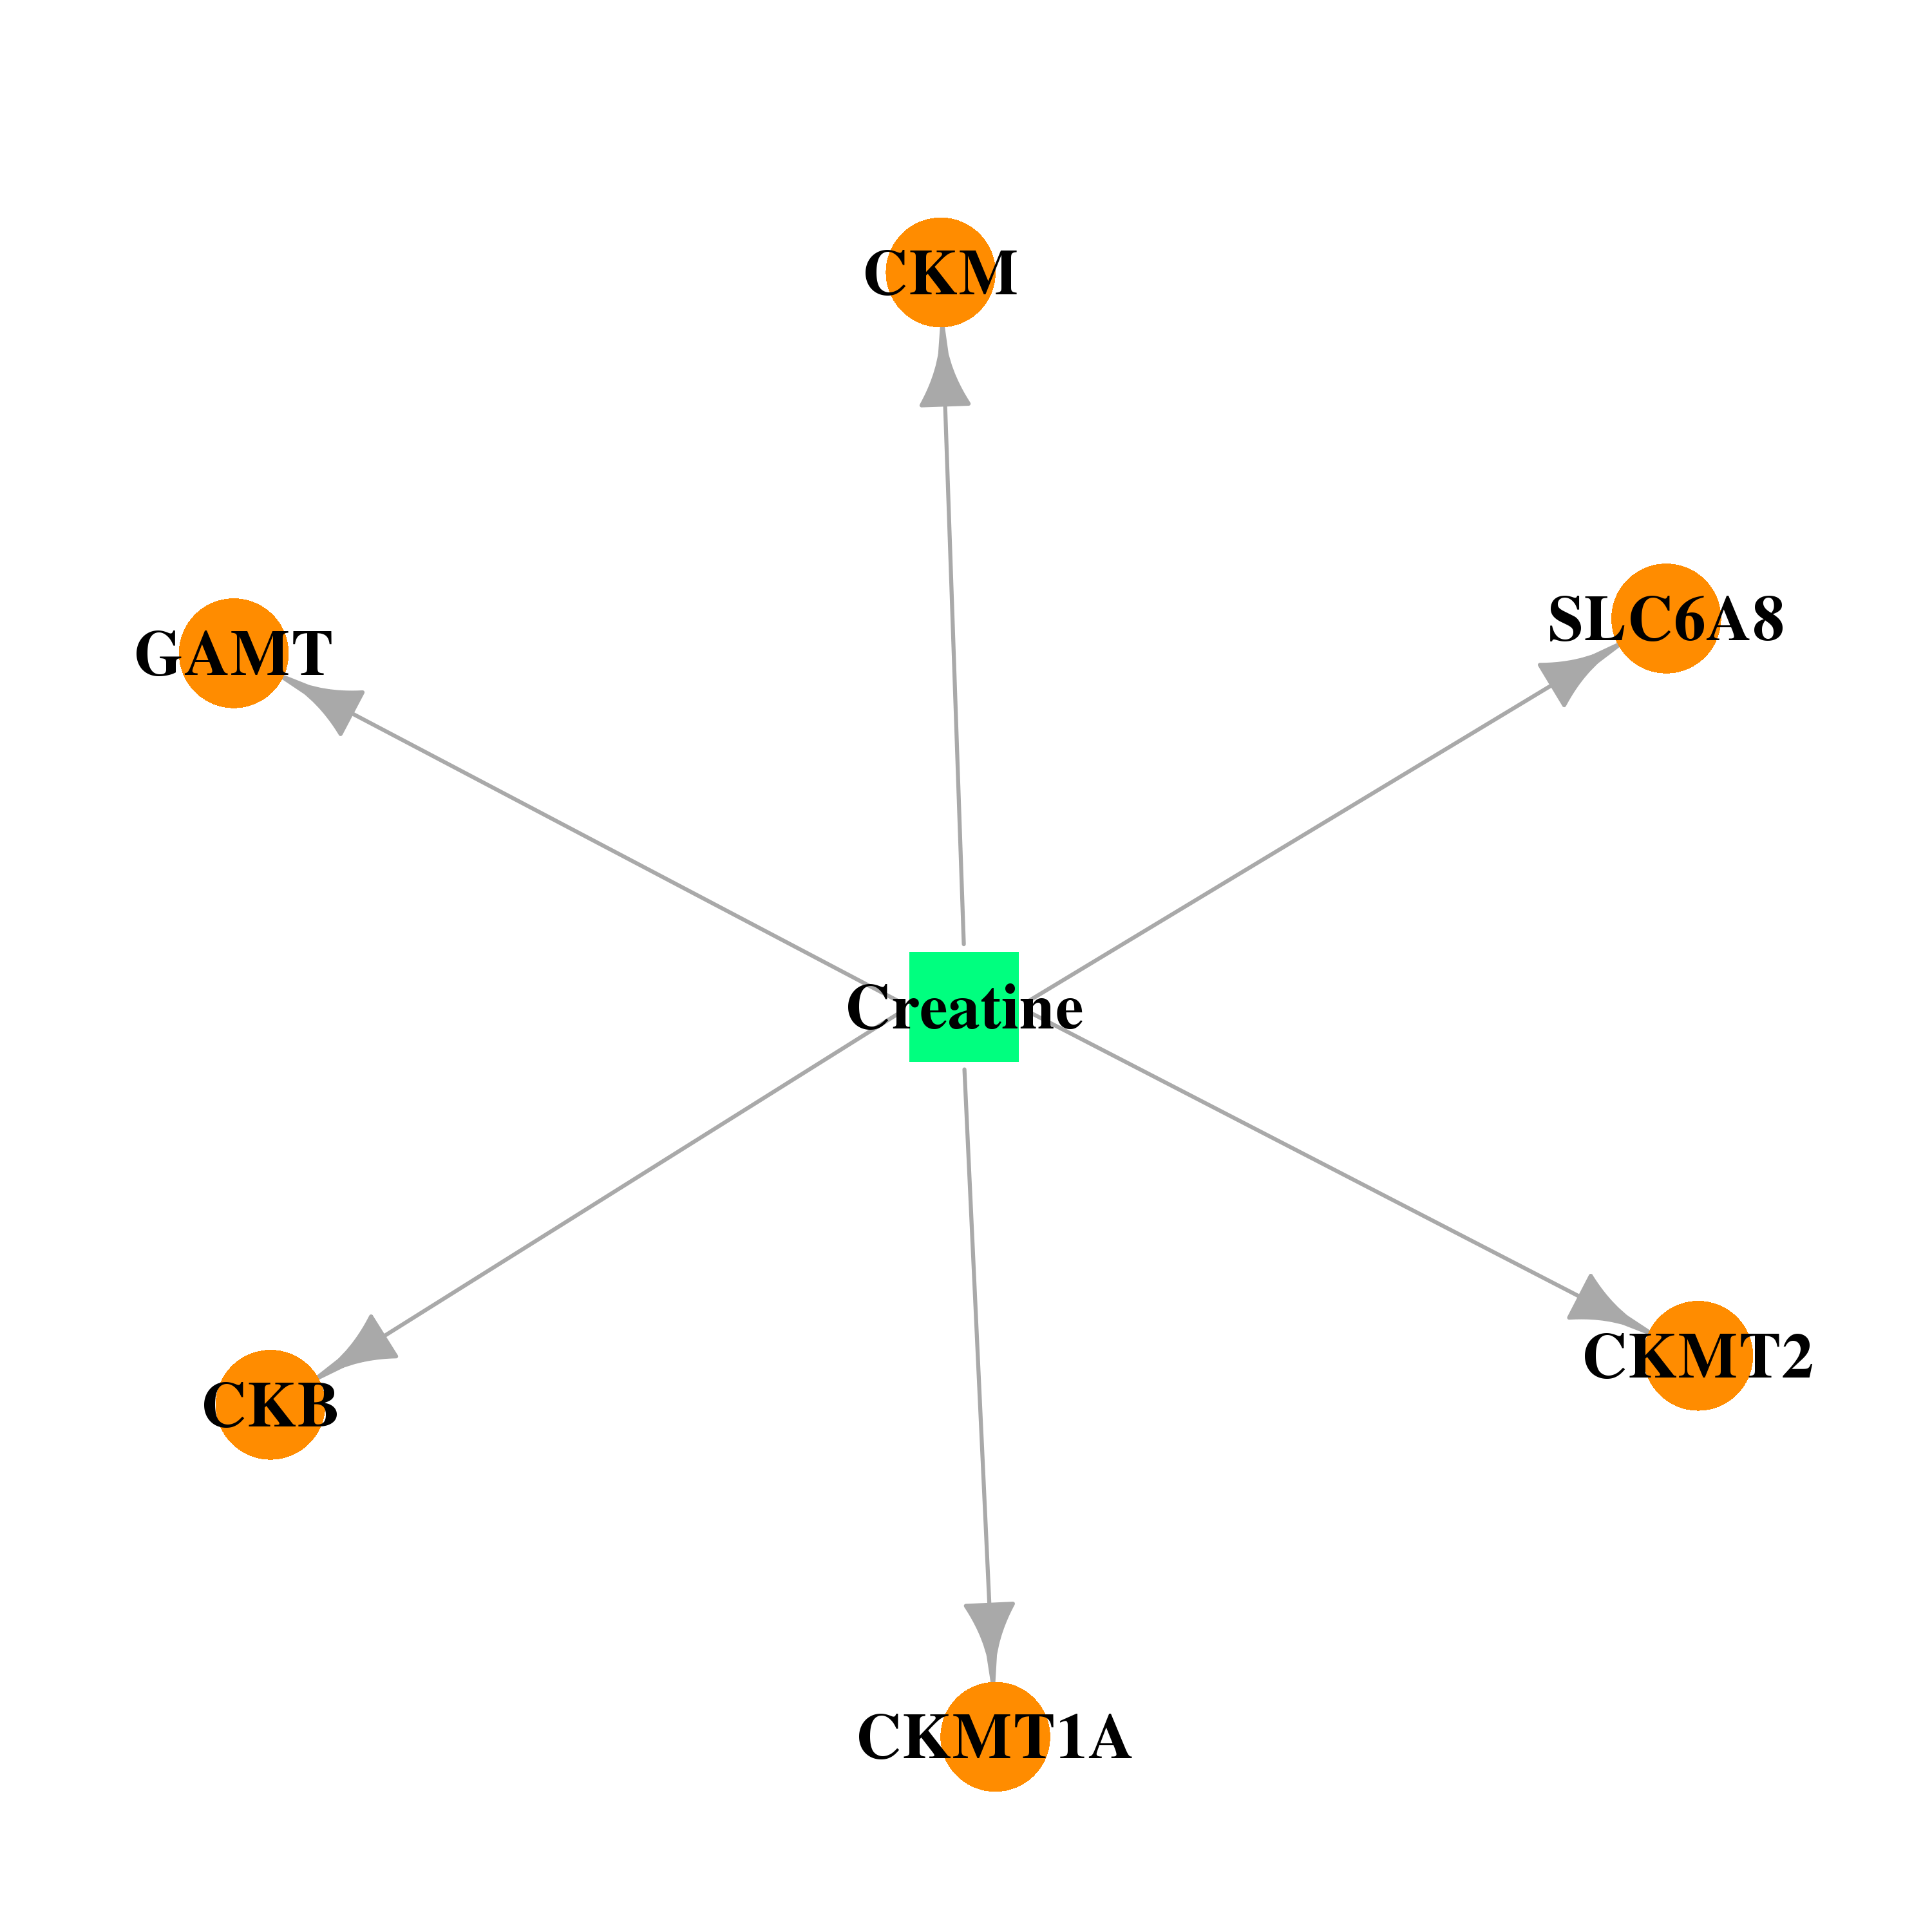 | 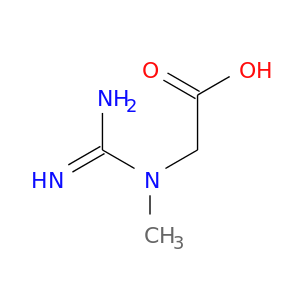 |
| Top |
| Cross referenced IDs for CKB |
| * We obtained these cross-references from Uniprot database. It covers 150 different DBs, 18 categories. http://www.uniprot.org/help/cross_references_section |
: Open all cross reference information
|
Copyright © 2016-Present - The Univsersity of Texas Health Science Center at Houston @ |