|
||||||||||||||||||||
| |
| Phenotypic Information (metabolism pathway, cancer, disease, phenome) |
| |
| |
| Gene-Gene Network Information: Co-Expression Network, Interacting Genes & KEGG |
| |
|


| Gene Summary for TBCB |
| Top |
| Phenotypic Information for TBCB(metabolism pathway, cancer, disease, phenome) |
| Cancer | CGAP: TBCB |
| Familial Cancer Database: TBCB | |
| * This gene is included in those cancer gene databases. |
|
|
|
|
|
| . | ||||||||||||||
Oncogene 1 | Significant driver gene in | |||||||||||||||||||
| cf) number; DB name 1 Oncogene; http://nar.oxfordjournals.org/content/35/suppl_1/D721.long, 2 Tumor Suppressor gene; https://bioinfo.uth.edu/TSGene/, 3 Cancer Gene Census; http://www.nature.com/nrc/journal/v4/n3/abs/nrc1299.html, 4 CancerGenes; http://nar.oxfordjournals.org/content/35/suppl_1/D721.long, 5 Network of Cancer Gene; http://ncg.kcl.ac.uk/index.php, 1Therapeutic Vulnerabilities in Cancer; http://cbio.mskcc.org/cancergenomics/statius/ |
| REACTOME_METABOLISM_OF_PROTEINS | |
| OMIM | |
| Orphanet | |
| Disease | KEGG Disease: TBCB |
| MedGen: TBCB (Human Medical Genetics with Condition) | |
| ClinVar: TBCB | |
| Phenotype | MGI: TBCB (International Mouse Phenotyping Consortium) |
| PhenomicDB: TBCB | |
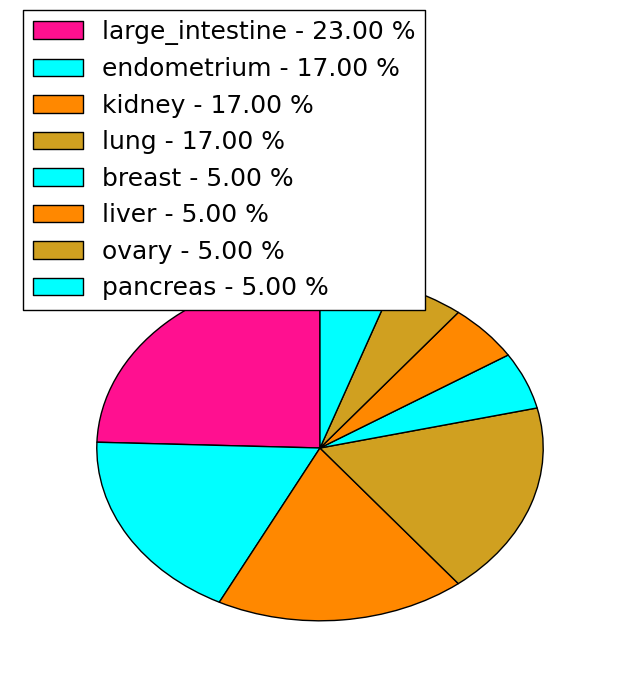
| Mutations for TBCB |
| * Under tables are showing count per each tissue to give us broad intuition about tissue specific mutation patterns.You can go to the detailed page for each mutation database's web site. |
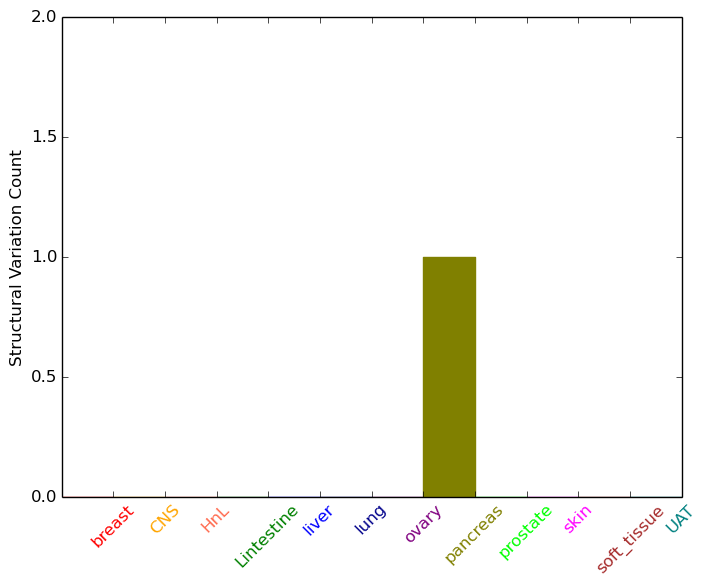
| - Statistics for Tissue and Mutation type | Top |
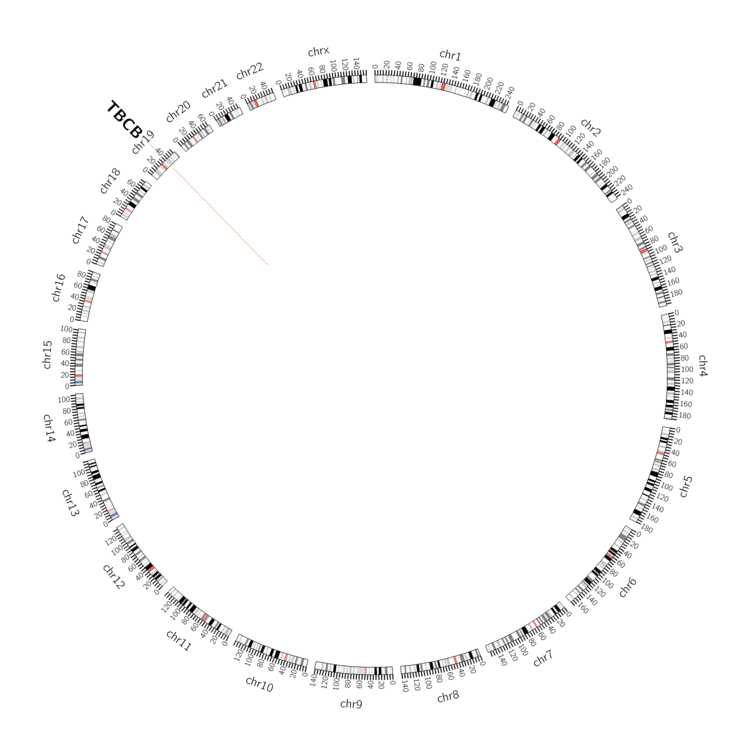 |
| - For Inter-chromosomal Variations |
| There's no inter-chromosomal structural variation. |
| - For Intra-chromosomal Variations |
| * Intra-chromosomal variantions includes 'intrachromosomal amplicon to amplicon', 'intrachromosomal amplicon to non-amplified dna', 'intrachromosomal deletion', 'intrachromosomal fold-back inversion', 'intrachromosomal inversion', 'intrachromosomal tandem duplication', 'Intrachromosomal unknown type', 'intrachromosomal with inverted orientation', 'intrachromosomal with non-inverted orientation'. |
 |
| Sample | Symbol_a | Chr_a | Start_a | End_a | Symbol_b | Chr_b | Start_b | End_b |
| pancreas | TBCB | chr19 | 36616167 | 36616167 | chr19 | 36618964 | 36618964 |
| cf) Tissue number; Tissue name (1;Breast, 2;Central_nervous_system, 3;Haematopoietic_and_lymphoid_tissue, 4;Large_intestine, 5;Liver, 6;Lung, 7;Ovary, 8;Pancreas, 9;Prostate, 10;Skin, 11;Soft_tissue, 12;Upper_aerodigestive_tract) |
| * From mRNA Sanger sequences, Chitars2.0 arranged chimeric transcripts. This table shows TBCB related fusion information. |
| ID | Head Gene | Tail Gene | Accession | Gene_a | qStart_a | qEnd_a | Chromosome_a | tStart_a | tEnd_a | Gene_a | qStart_a | qEnd_a | Chromosome_a | tStart_a | tEnd_a |
| CD522326 | TBCB | 3 | 72 | 19 | 36616653 | 36616722 | SERPINB2 | 69 | 721 | 18 | 61558822 | 61569752 | |
| AL561402 | TBCB | 1 | 169 | 19 | 36606387 | 36606557 | EIF4EBP2 | 160 | 947 | 10 | 72164111 | 72181884 | |
| BP390379 | TBCB | 1 | 283 | 19 | 36616407 | 36616833 | LOC728554 | 284 | 500 | 5 | 177311007 | 177311223 | |
| DA235308 | TBCB | 1 | 363 | 19 | 36606384 | 36611637 | B3GALNT1 | 360 | 591 | 3 | 160804308 | 160804539 | |
| Top |
| There's no copy number variation information in COSMIC data for this gene. |
| Top |
|
 |
| Top |
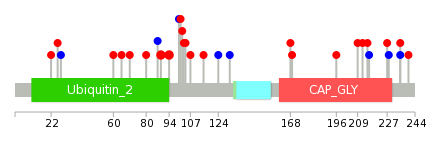
| Stat. for Non-Synonymous SNVs (# total SNVs=17) | (# total SNVs=4) |
 |  |
(# total SNVs=0) | (# total SNVs=0) |
| Top |
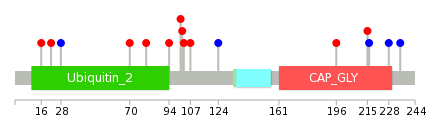
| * When you move the cursor on each content, you can see more deailed mutation information on the Tooltip. Those are primary_site,primary_histology,mutation(aa),pubmedID. |
| GRCh37 position | Mutation(aa) | Unique sampleID count |
| chr19:36611634-36611634 | p.R94H | 2 |
| chr19:36611618-36611618 | p.D89N | 2 |
| chr19:36612576-36612576 | p.R168L | 1 |
| chr19:36616654-36616654 | p.P235P | 1 |
| chr19:36612578-36612578 | p.A169P | 1 |
| chr19:36606528-36606528 | p.F22L | 1 |
| chr19:36616667-36616667 | p.G240W | 1 |
| chr19:36611653-36611653 | p.D100D | 1 |
| chr19:36612584-36612584 | p.G171* | 1 |
| chr19:36606539-36606539 | p.K26M | 1 |
| Top |
|
 |
| Point Mutation/ Tissue ID | 1 | 2 | 3 | 4 | 5 | 6 | 7 | 8 | 9 | 10 | 11 | 12 | 13 | 14 | 15 | 16 | 17 | 18 | 19 | 20 |
| # sample | 3 | 1 | 1 | 1 | 1 | 3 | 3 | 2 | ||||||||||||
| # mutation | 3 | 1 | 1 | 1 | 1 | 3 | 3 | 3 | ||||||||||||
| nonsynonymous SNV | 1 | 1 | 1 | 1 | 1 | 3 | 3 | |||||||||||||
| synonymous SNV | 3 | 2 |
| cf) Tissue ID; Tissue type (1; BLCA[Bladder Urothelial Carcinoma], 2; BRCA[Breast invasive carcinoma], 3; CESC[Cervical squamous cell carcinoma and endocervical adenocarcinoma], 4; COAD[Colon adenocarcinoma], 5; GBM[Glioblastoma multiforme], 6; Glioma Low Grade, 7; HNSC[Head and Neck squamous cell carcinoma], 8; KICH[Kidney Chromophobe], 9; KIRC[Kidney renal clear cell carcinoma], 10; KIRP[Kidney renal papillary cell carcinoma], 11; LAML[Acute Myeloid Leukemia], 12; LUAD[Lung adenocarcinoma], 13; LUSC[Lung squamous cell carcinoma], 14; OV[Ovarian serous cystadenocarcinoma ], 15; PAAD[Pancreatic adenocarcinoma], 16; PRAD[Prostate adenocarcinoma], 17; SKCM[Skin Cutaneous Melanoma], 18:STAD[Stomach adenocarcinoma], 19:THCA[Thyroid carcinoma], 20:UCEC[Uterine Corpus Endometrial Carcinoma]) |
| Top |
| * We represented just top 10 SNVs. When you move the cursor on each content, you can see more deailed mutation information on the Tooltip. Those are primary_site, primary_histology, mutation(aa), pubmedID. |
| Genomic Position | Mutation(aa) | Unique sampleID count |
| chr19:36612445 | p.V228V | 1 |
| chr19:36606509 | p.P235P | 1 |
| chr19:36616392 | p.S16T | 1 |
| chr19:36606528 | p.F22L | 1 |
| chr19:36616592 | p.Y28Y | 1 |
| chr19:36606546 | p.E70D | 1 |
| chr19:36616597 | p.D80G | 1 |
| chr19:36607038 | p.R94H | 1 |
| chr19:36616633 | p.V101M | 1 |
| chr19:36607067 | p.S102F | 1 |
| * Copy number data were extracted from TCGA using R package TCGA-Assembler. The URLs of all public data files on TCGA DCC data server were gathered on Jan-05-2015. Function ProcessCNAData in TCGA-Assembler package was used to obtain gene-level copy number value which is calculated as the average copy number of the genomic region of a gene. |
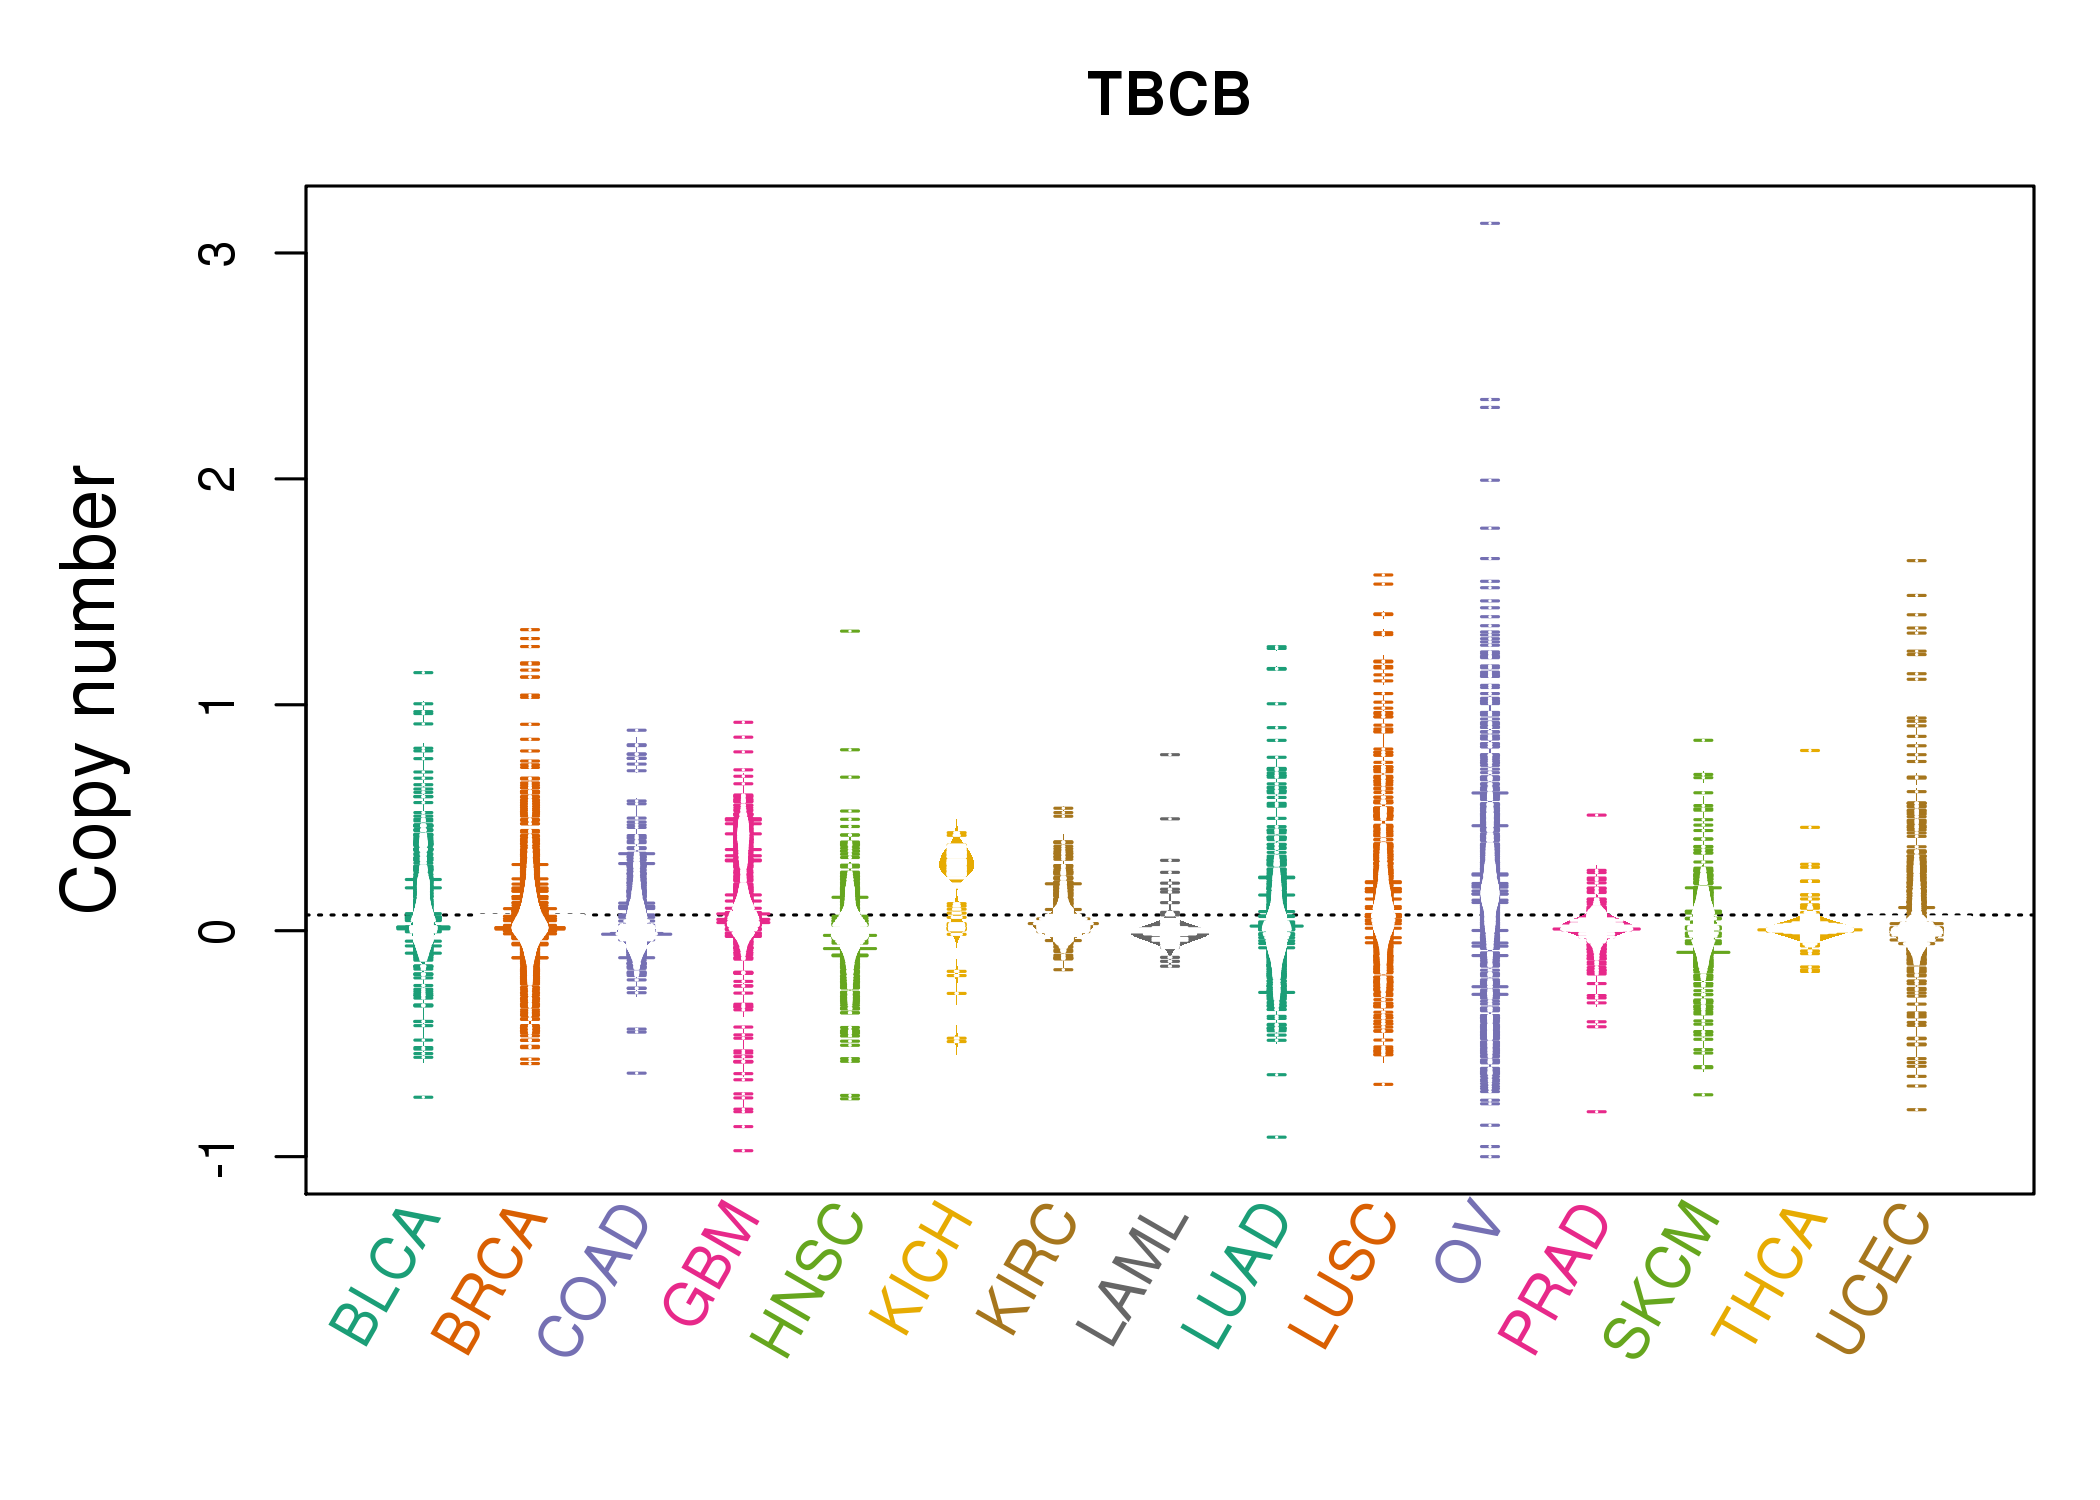 |
| cf) Tissue ID[Tissue type]: BLCA[Bladder Urothelial Carcinoma], BRCA[Breast invasive carcinoma], CESC[Cervical squamous cell carcinoma and endocervical adenocarcinoma], COAD[Colon adenocarcinoma], GBM[Glioblastoma multiforme], Glioma Low Grade, HNSC[Head and Neck squamous cell carcinoma], KICH[Kidney Chromophobe], KIRC[Kidney renal clear cell carcinoma], KIRP[Kidney renal papillary cell carcinoma], LAML[Acute Myeloid Leukemia], LUAD[Lung adenocarcinoma], LUSC[Lung squamous cell carcinoma], OV[Ovarian serous cystadenocarcinoma ], PAAD[Pancreatic adenocarcinoma], PRAD[Prostate adenocarcinoma], SKCM[Skin Cutaneous Melanoma], STAD[Stomach adenocarcinoma], THCA[Thyroid carcinoma], UCEC[Uterine Corpus Endometrial Carcinoma] |
| Top |
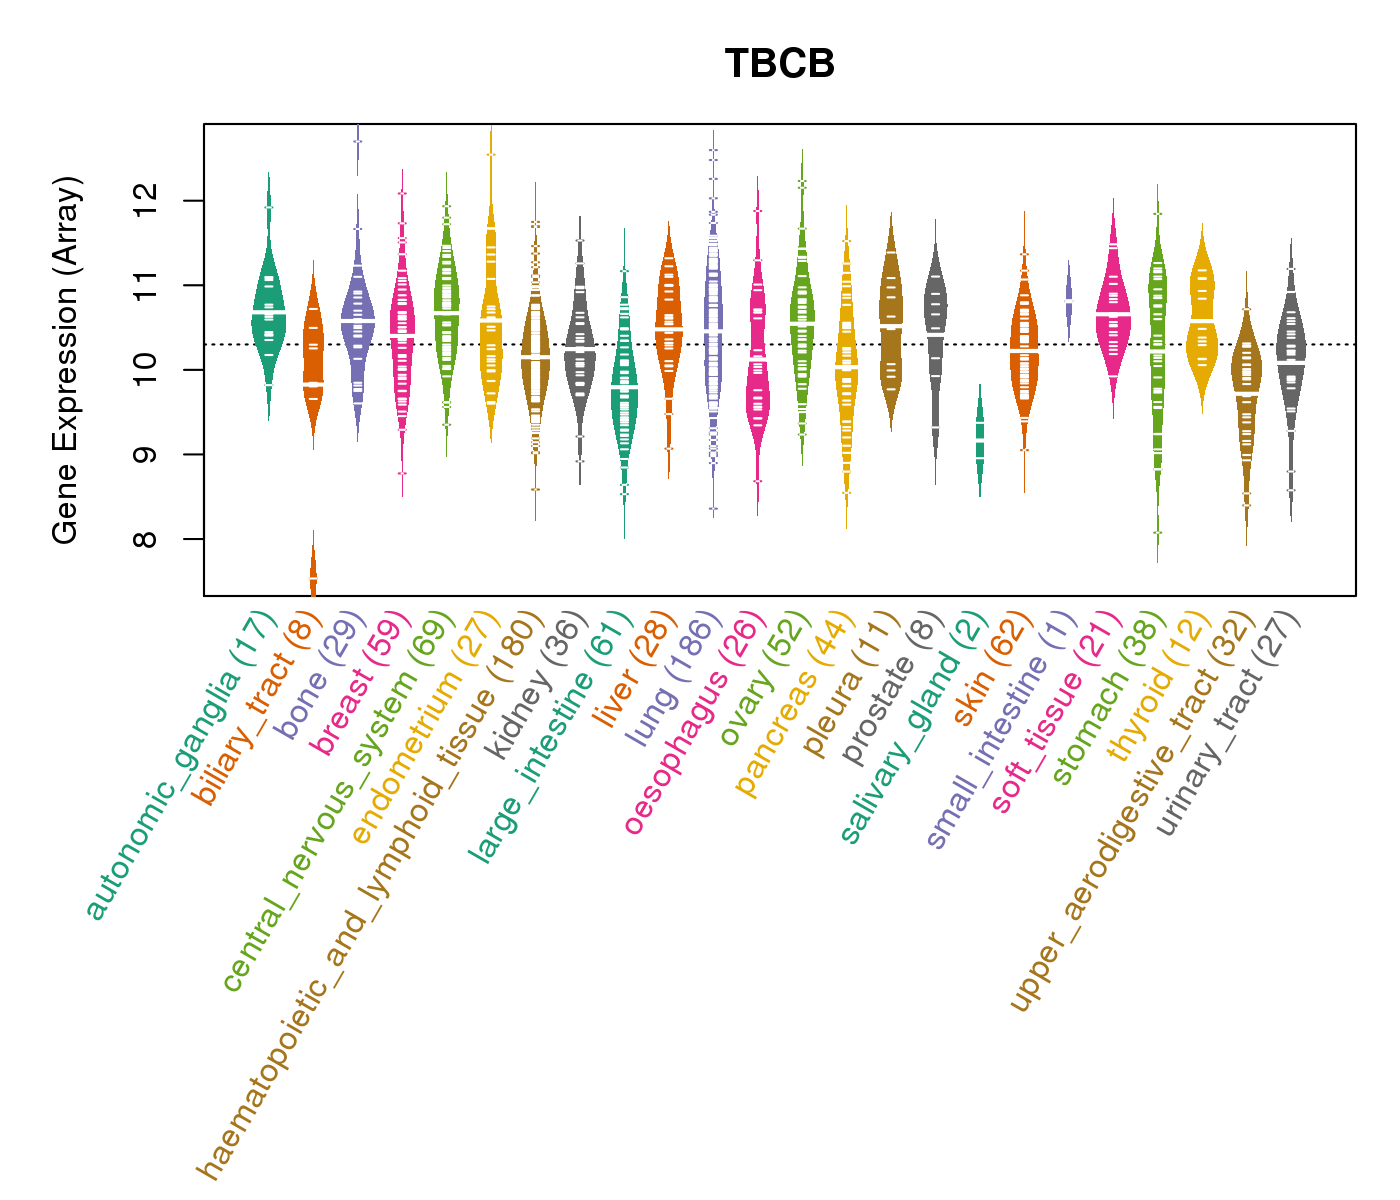
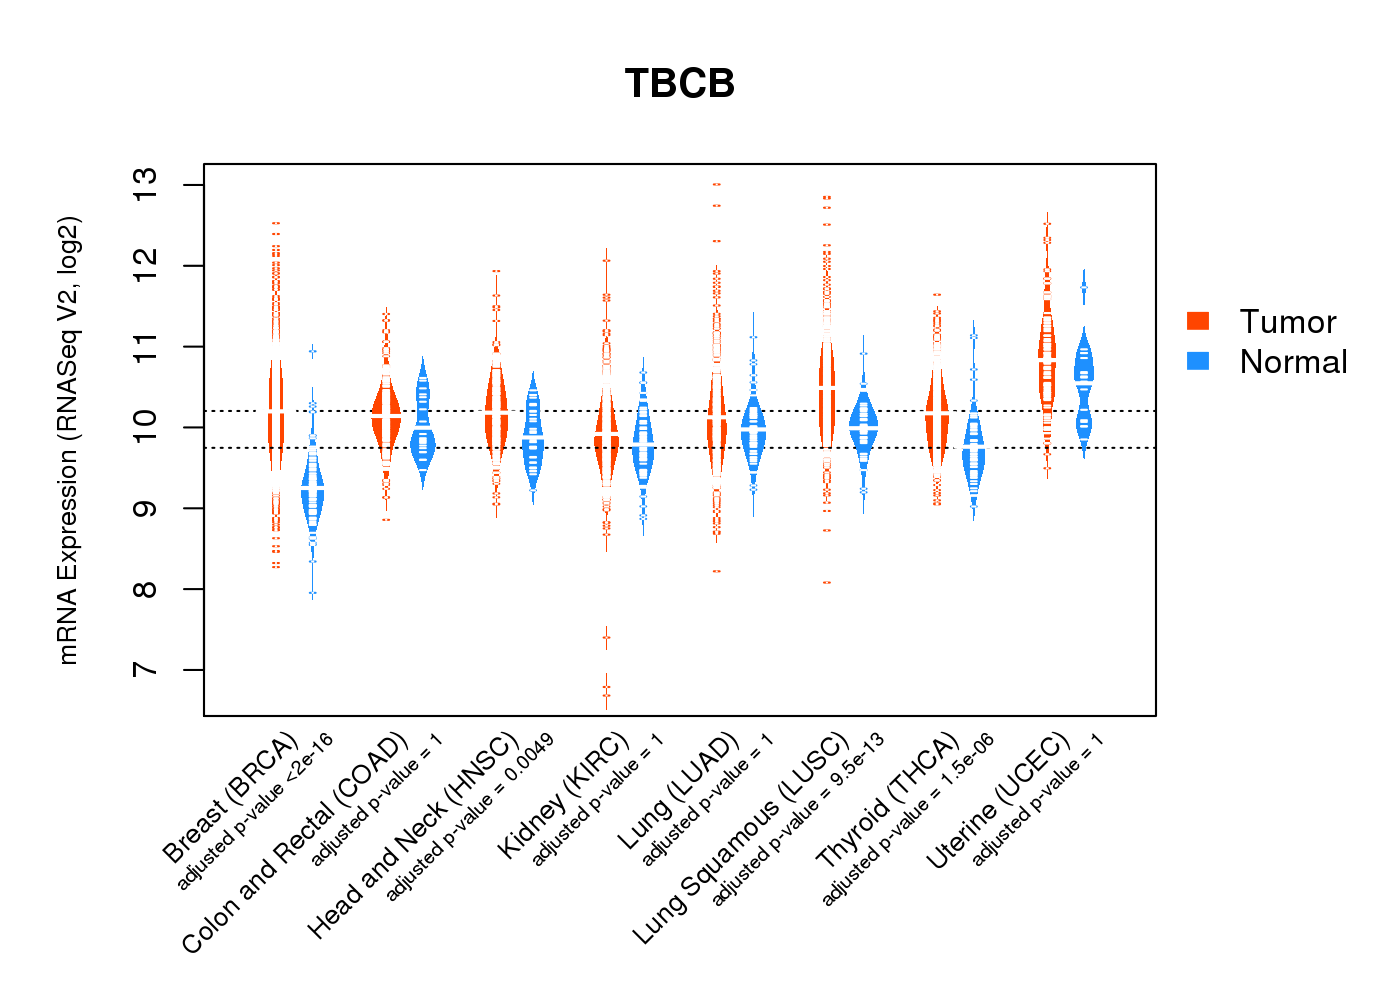
| Gene Expression for TBCB |
| * CCLE gene expression data were extracted from CCLE_Expression_Entrez_2012-10-18.res: Gene-centric RMA-normalized mRNA expression data. |
 |
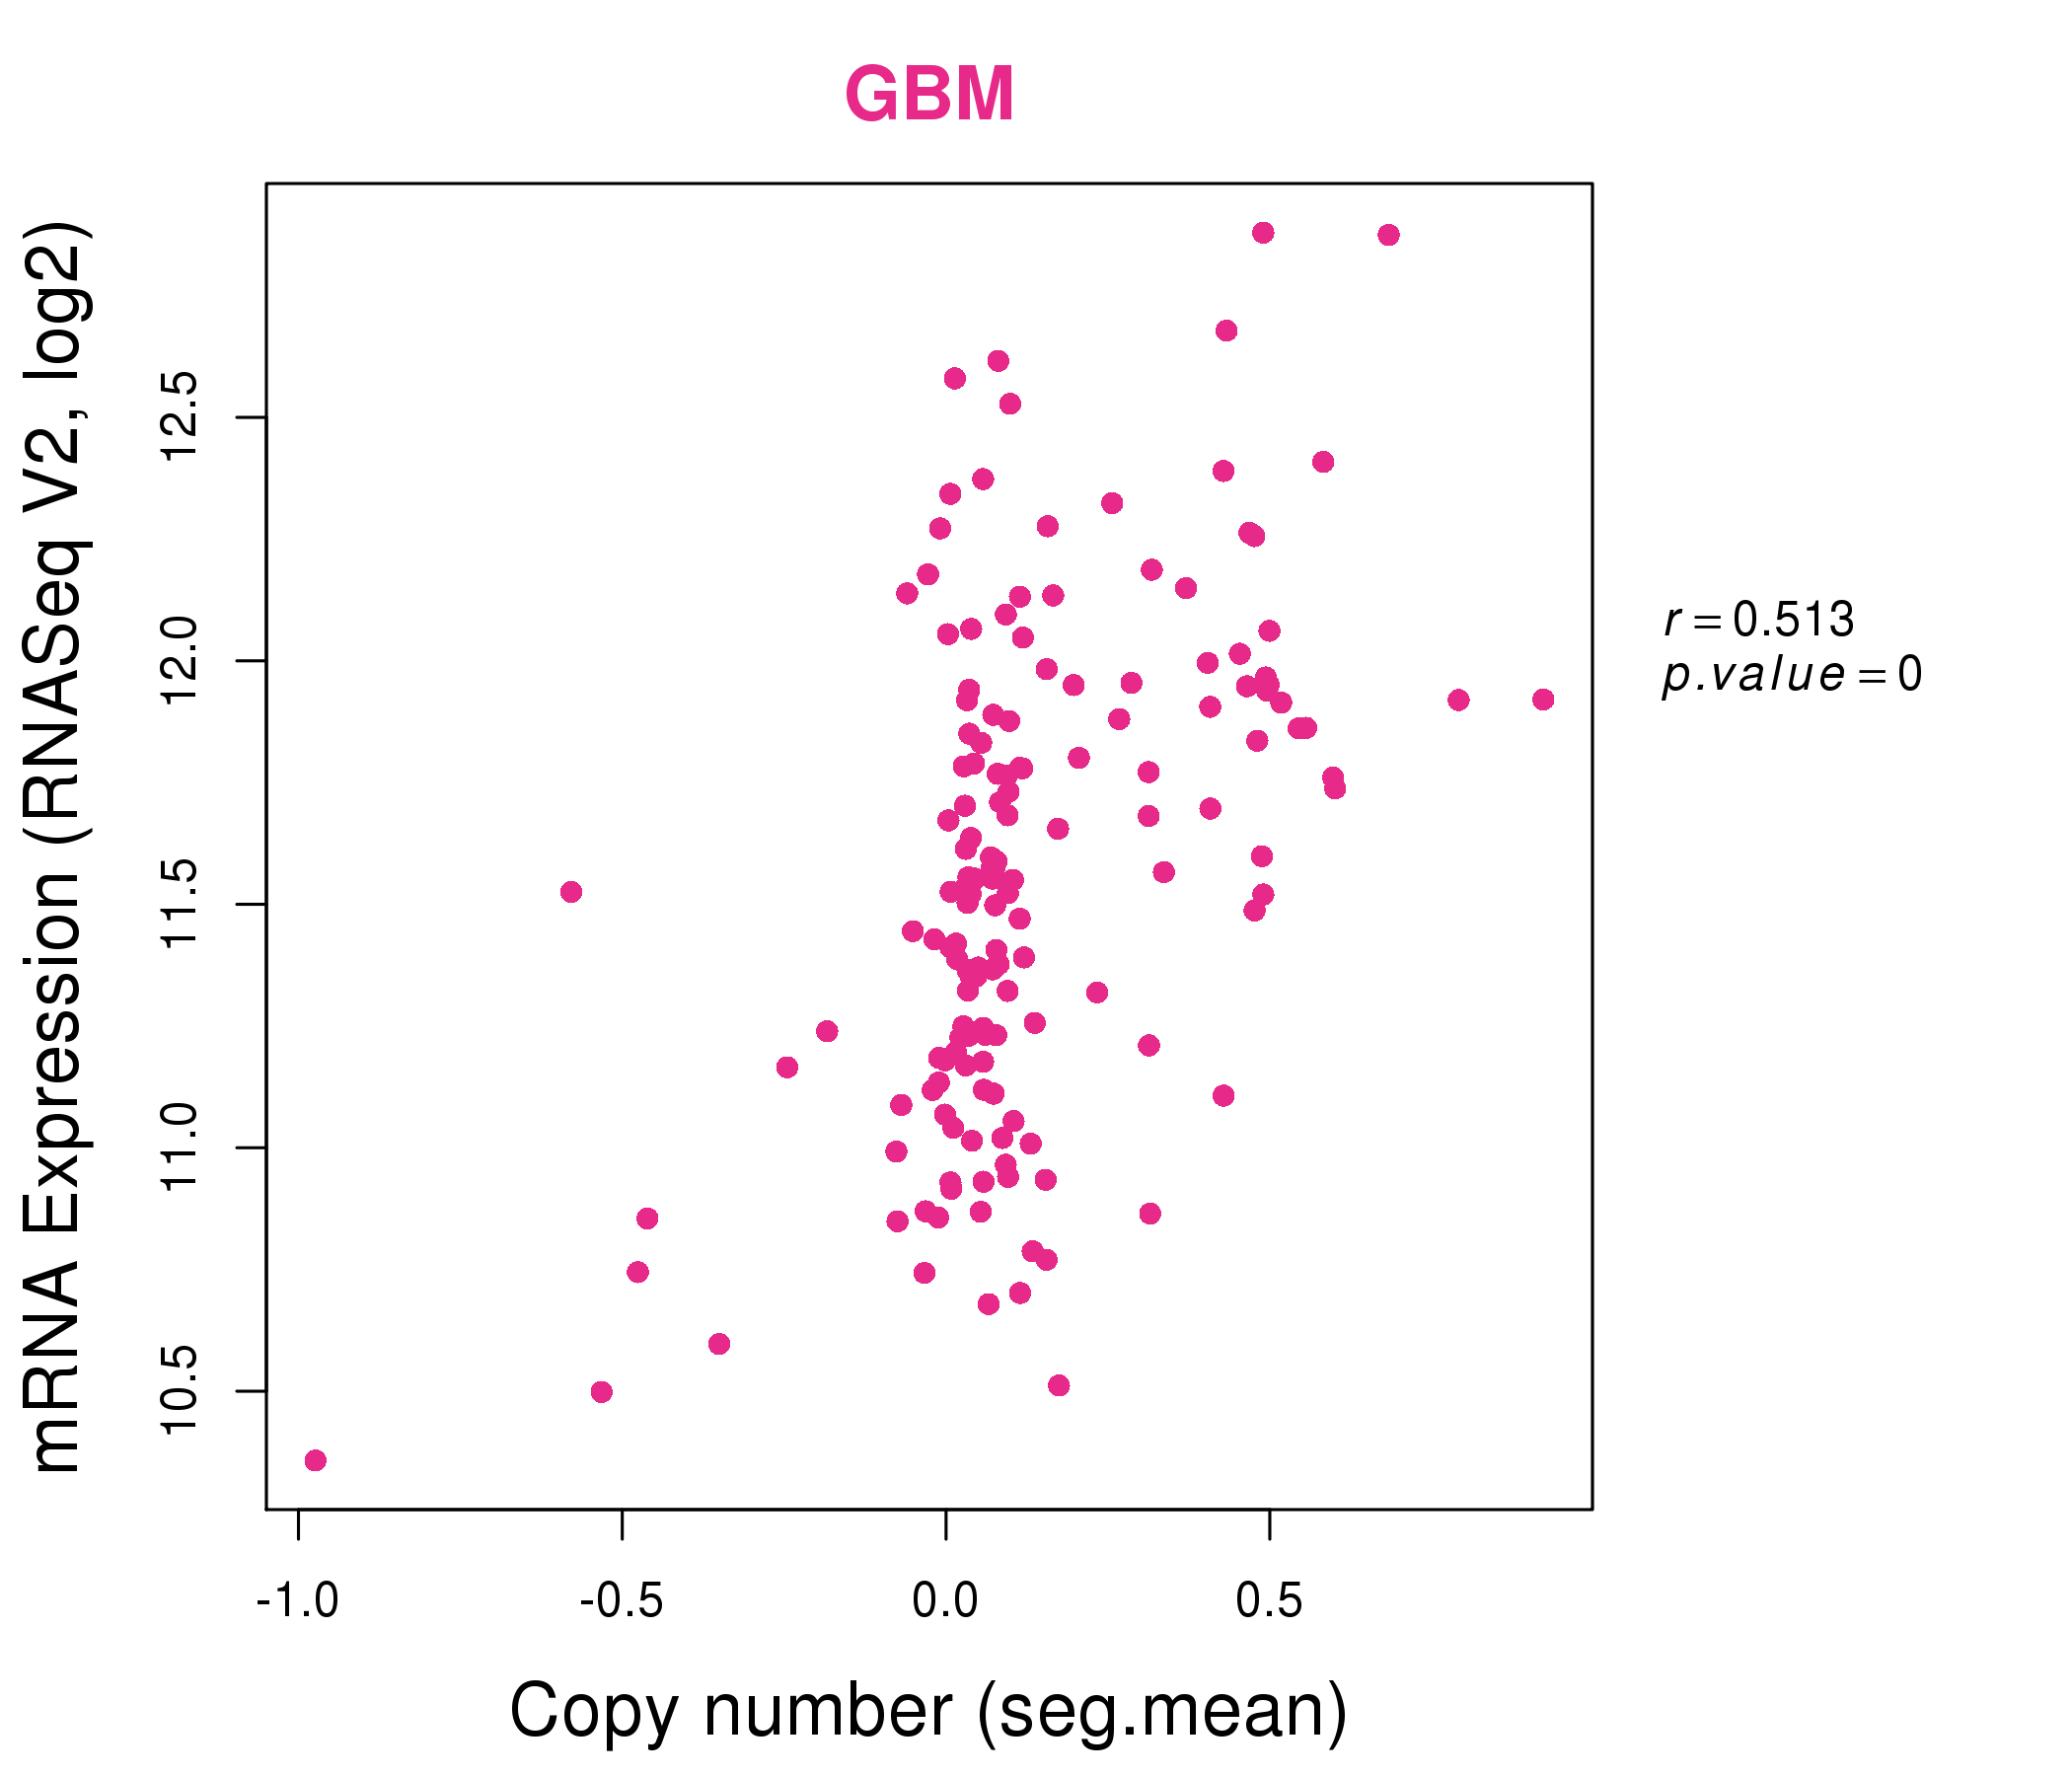
| * Normalized gene expression data of RNASeqV2 was extracted from TCGA using R package TCGA-Assembler. The URLs of all public data files on TCGA DCC data server were gathered at Jan-05-2015. Only eight cancer types have enough normal control samples for differential expression analysis. (t test, adjusted p<0.05 (using Benjamini-Hochberg FDR)) |
 |
| Top |
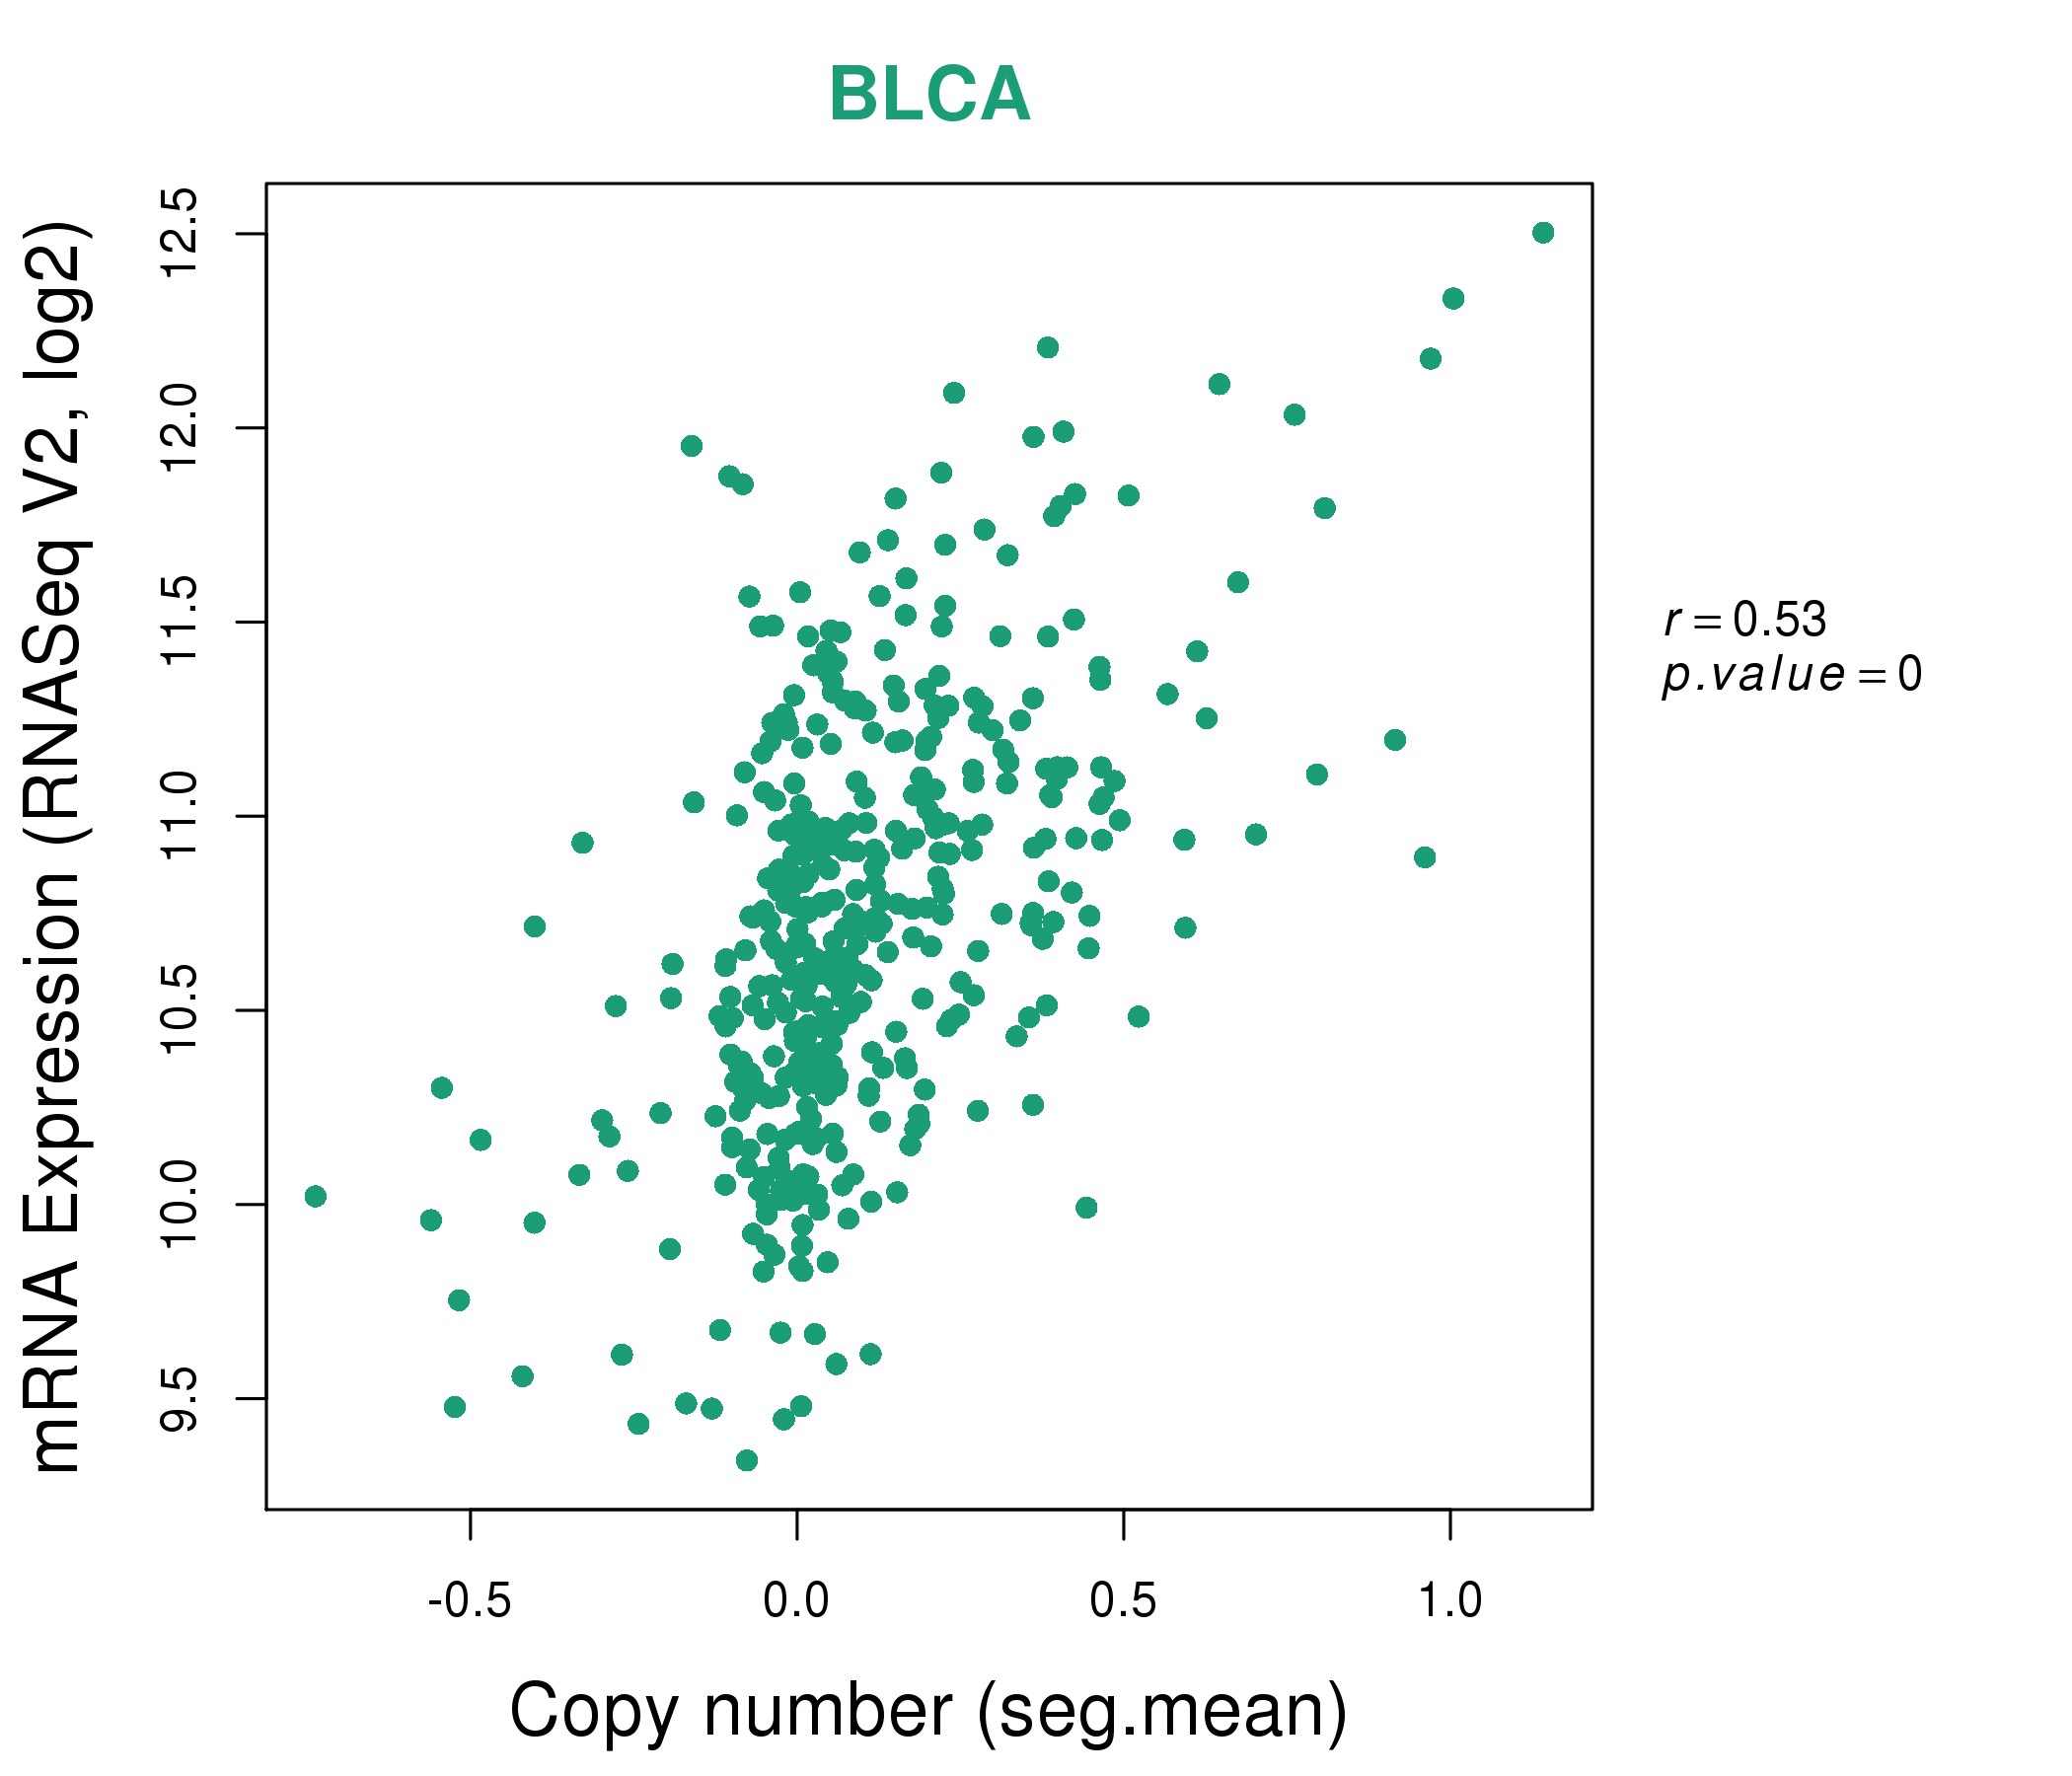
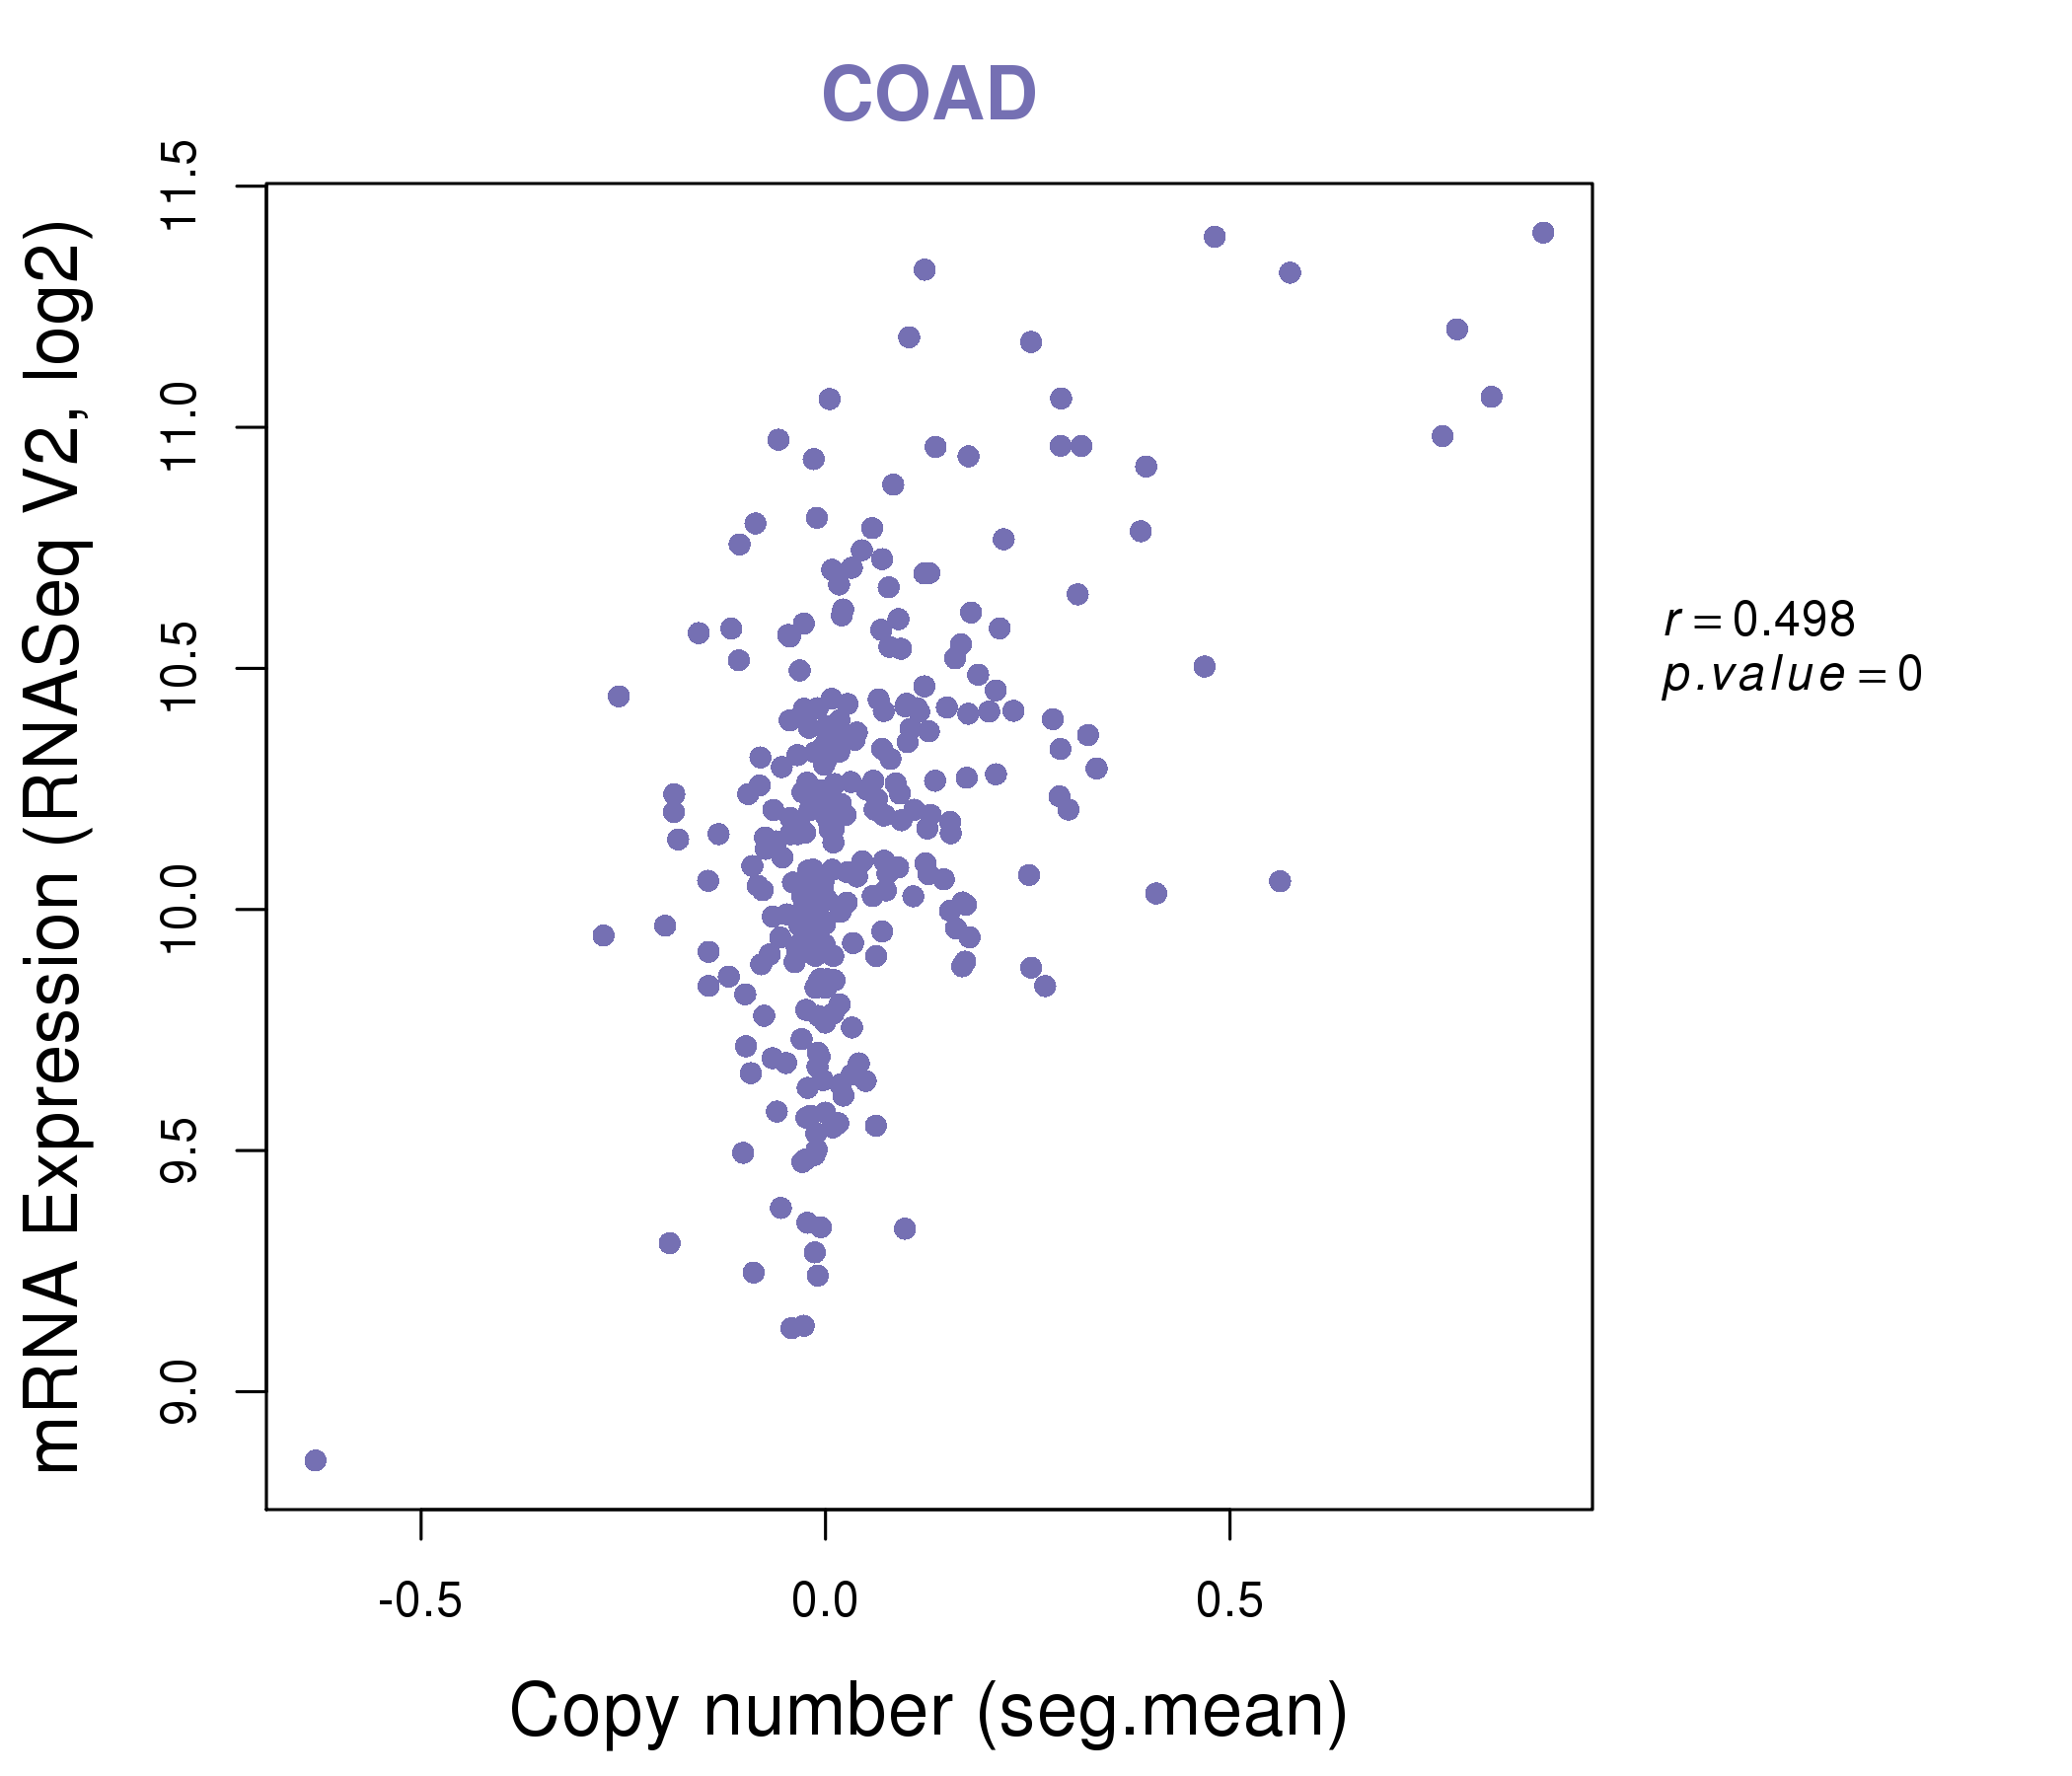
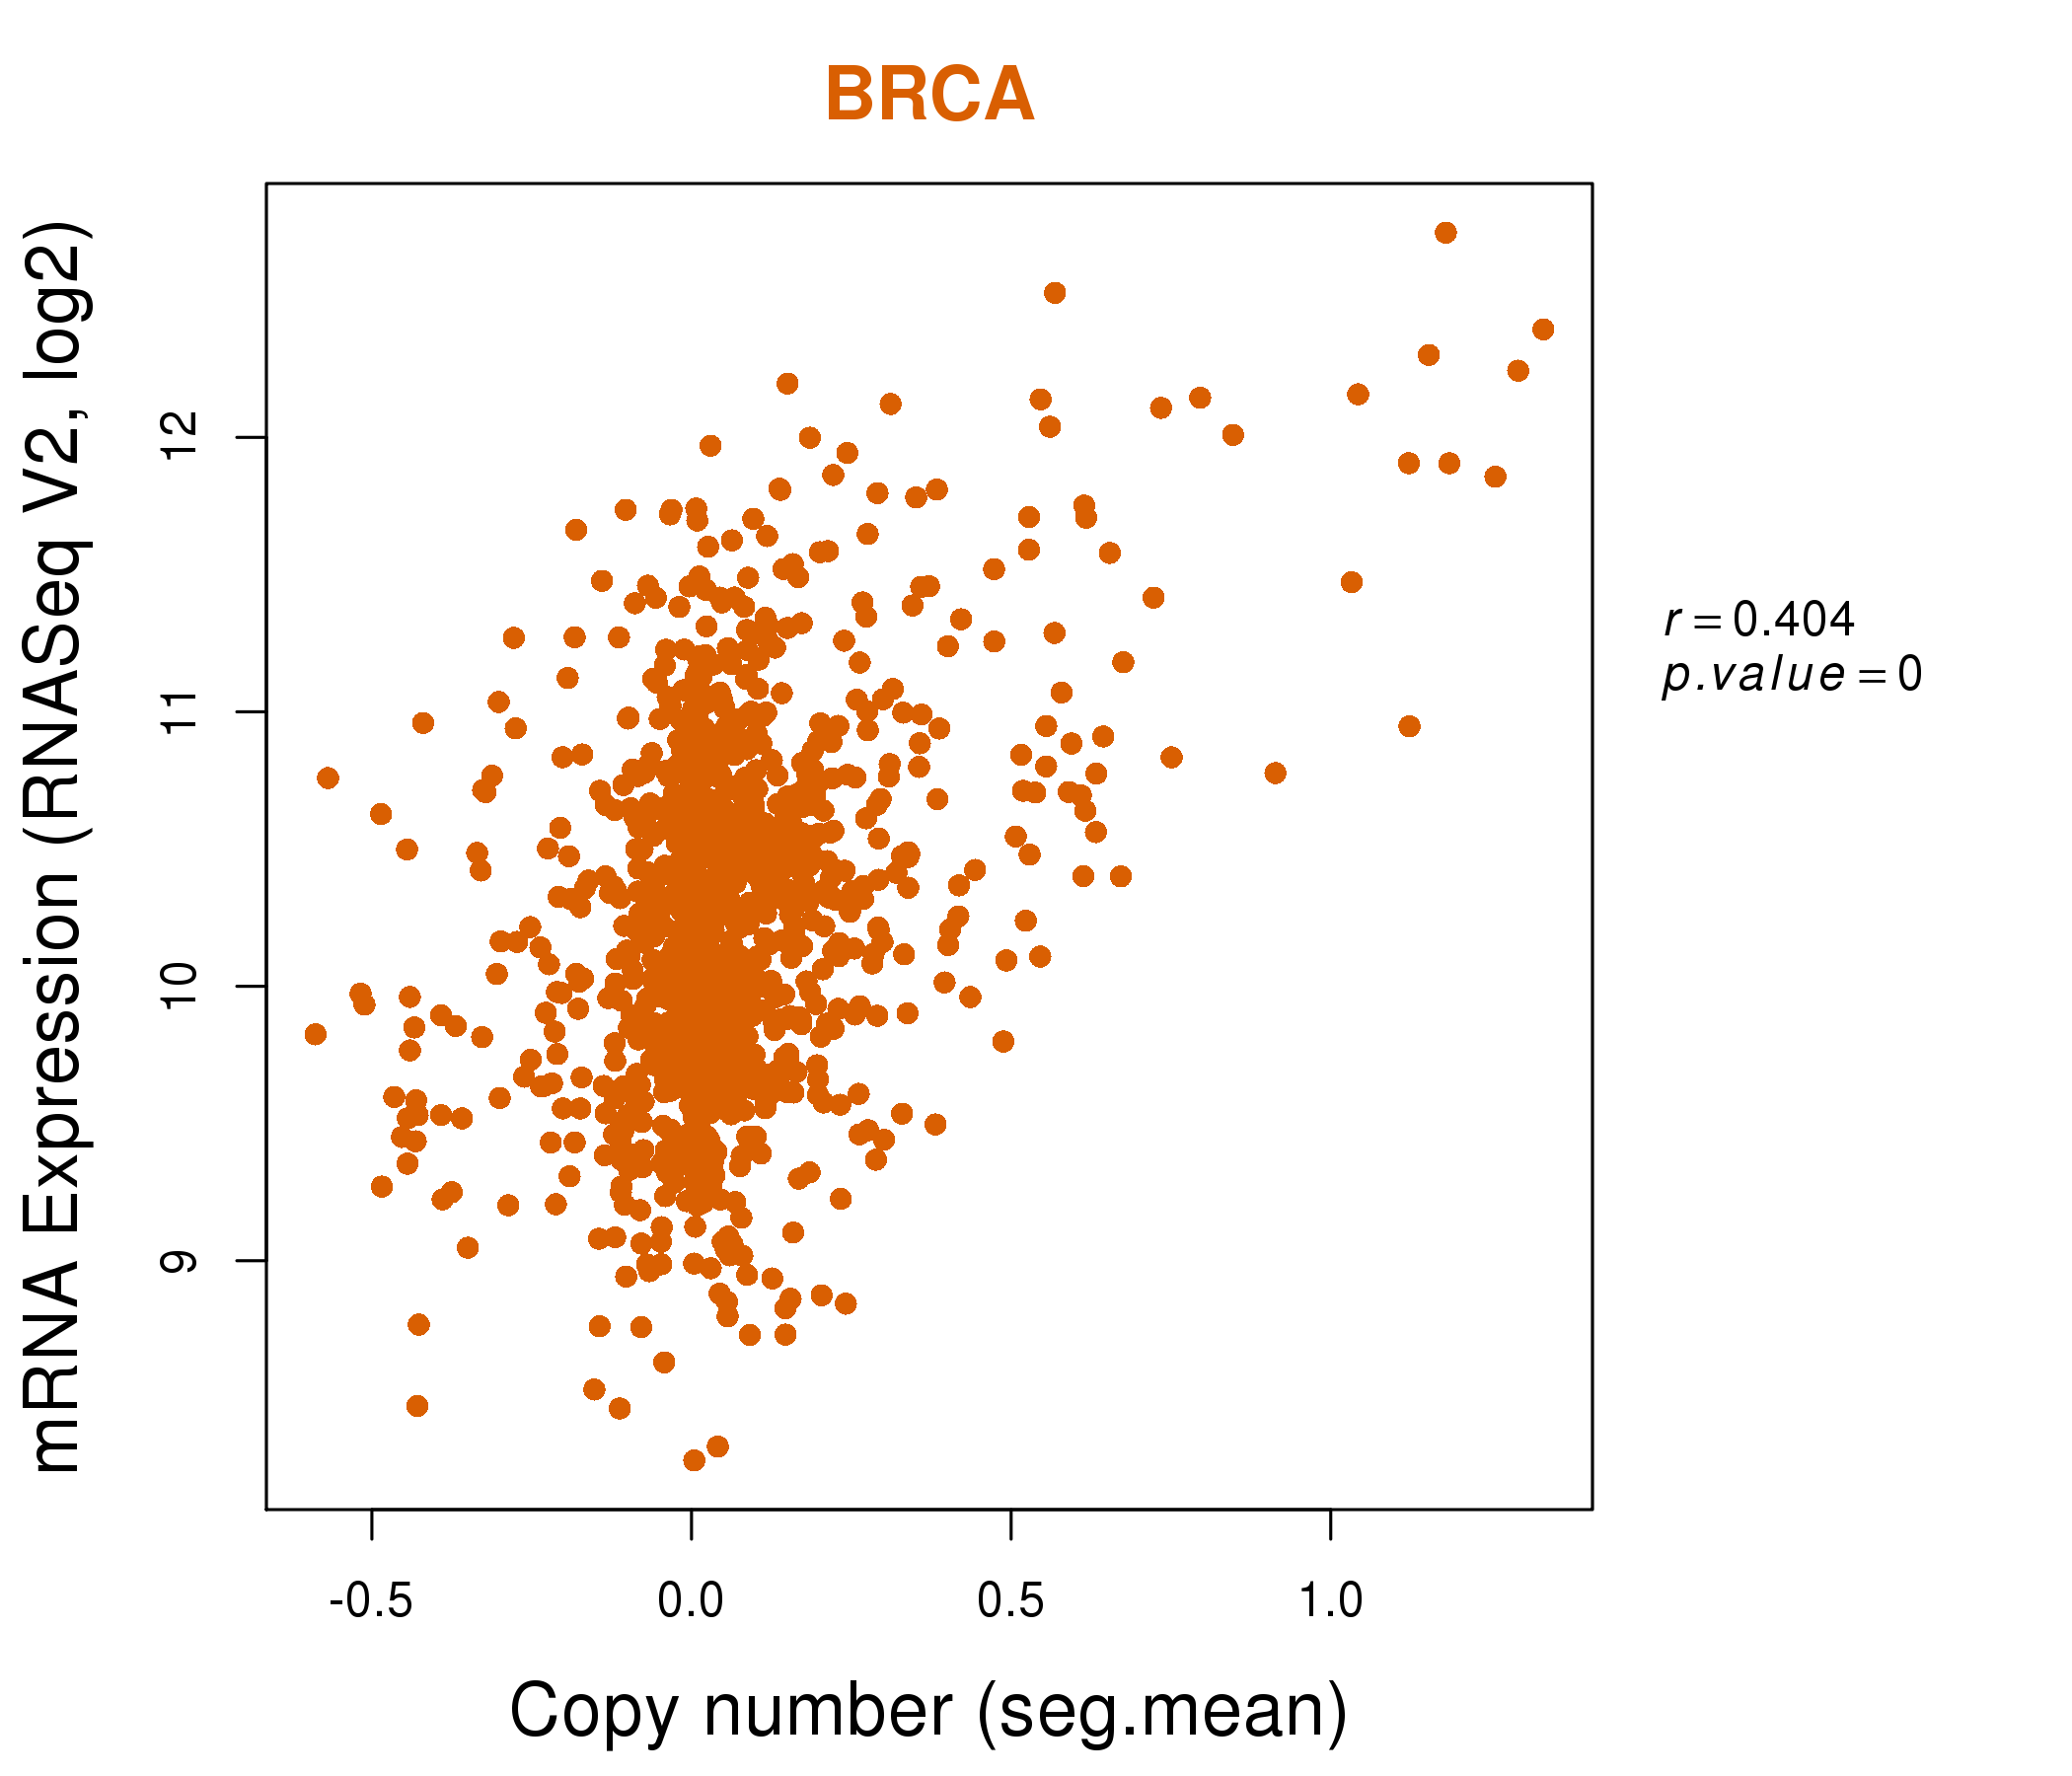
| * This plots show the correlation between CNV and gene expression. |
: Open all plots for all cancer types
 |
|
 |
|
| Top |
| Gene-Gene Network Information |
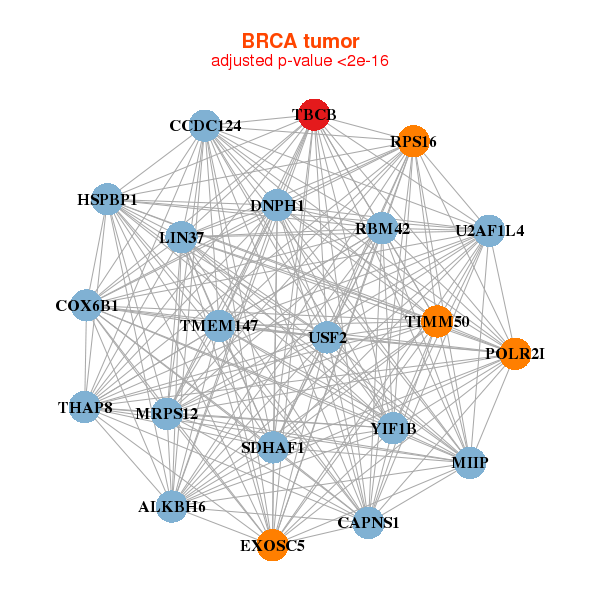
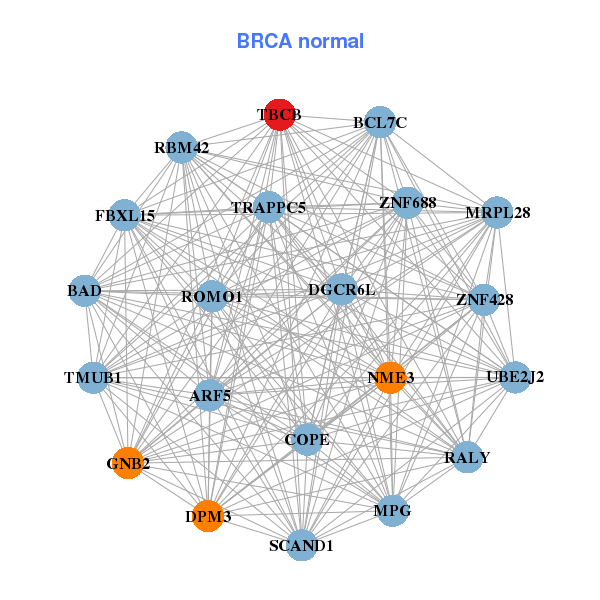
| * Co-Expression network figures were drawn using R package igraph. Only the top 20 genes with the highest correlations were shown. Red circle: input gene, orange circle: cell metabolism gene, sky circle: other gene |
: Open all plots for all cancer types
 |
|
| ALKBH6,DNPH1,CAPNS1,CCDC124,COX6B1,EXOSC5,HSPBP1, LIN37,MIIP,MRPS12,POLR2I,RBM42,RPS16,SDHAF1, TBCB,THAP8,TIMM50,TMEM147,U2AF1L4,USF2,YIF1B | ARF5,BAD,BCL7C,COPE,DGCR6L,DPM3,FBXL15, GNB2,MPG,MRPL28,NME3,RALY,RBM42,ROMO1, SCAND1,TBCB,TMUB1,TRAPPC5,UBE2J2,ZNF428,ZNF688 |
 |
|
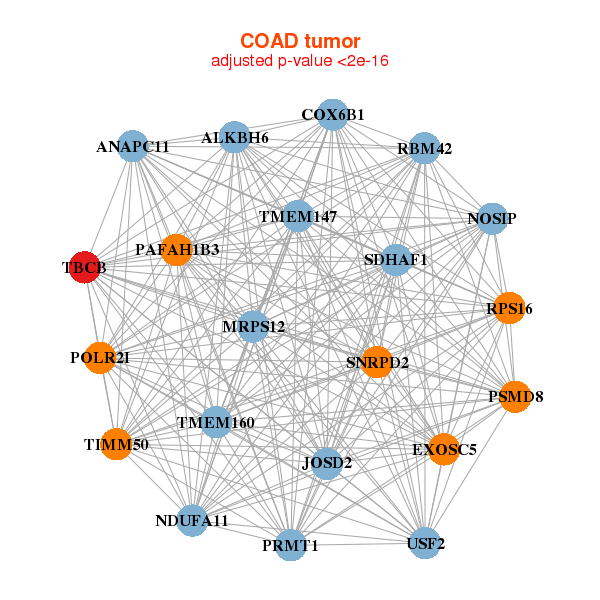
| ALKBH6,ANAPC11,COX6B1,EXOSC5,JOSD2,MRPS12,NDUFA11, NOSIP,PAFAH1B3,POLR2I,PRMT1,PSMD8,RBM42,RPS16, SDHAF1,SNRPD2,TBCB,TIMM50,TMEM147,TMEM160,USF2 | ARL2,C1orf122,CCDC23,DCTN3,DRAP1,EEF1D,FLOT1, MRPL10,MRPL40,PIN1,PKIG,POLR2I,RPP21,SNAPIN, SNX17,SSSCA1,STOML1,TBCB,UROD,VPS72,ZMAT5 |
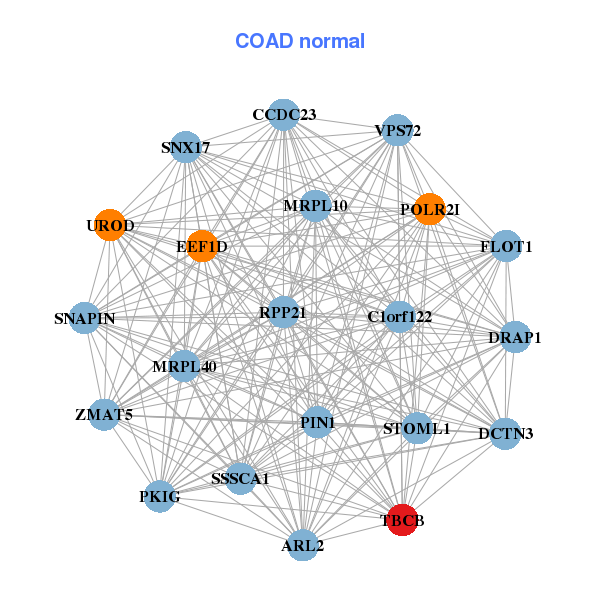
| * Co-Expression network figures were drawn using R package igraph. Only the top 20 genes with the highest correlations were shown. Red circle: input gene, orange circle: cell metabolism gene, sky circle: other gene |
: Open all plots for all cancer types
| Top |
: Open all interacting genes' information including KEGG pathway for all interacting genes from DAVID
| Top |
| Pharmacological Information for TBCB |
| There's no related Drug. |
| Top |
| Cross referenced IDs for TBCB |
| * We obtained these cross-references from Uniprot database. It covers 150 different DBs, 18 categories. http://www.uniprot.org/help/cross_references_section |
: Open all cross reference information
|
Copyright © 2016-Present - The Univsersity of Texas Health Science Center at Houston @ |