|
|||||||||||||||||||||||||||||||||||||||||||||||||||||||||||||||||||||||||||||||||||||||||||||||||||||||||||||||||||||||||||||||||||||||||||||||||||||||||||||||||||||||||||||||||||||||||||||||||||||||||||||||||||||||||||||||||||||||||||||||||||||||||||||||||||||||||||||||||||||||||||||||||||||||||||||||||||||||||||||||||||||||||||||||||||
| |
| Phenotypic Information (metabolism pathway, cancer, disease, phenome) |
| |
| |
| Gene-Gene Network Information: Co-Expression Network, Interacting Genes & KEGG |
| |
|


| Gene Summary for ACSM1 |
| Basic gene info. | Gene symbol | ACSM1 |
| Gene name | acyl-CoA synthetase medium-chain family member 1 | |
| Synonyms | BUCS1|MACS1 | |
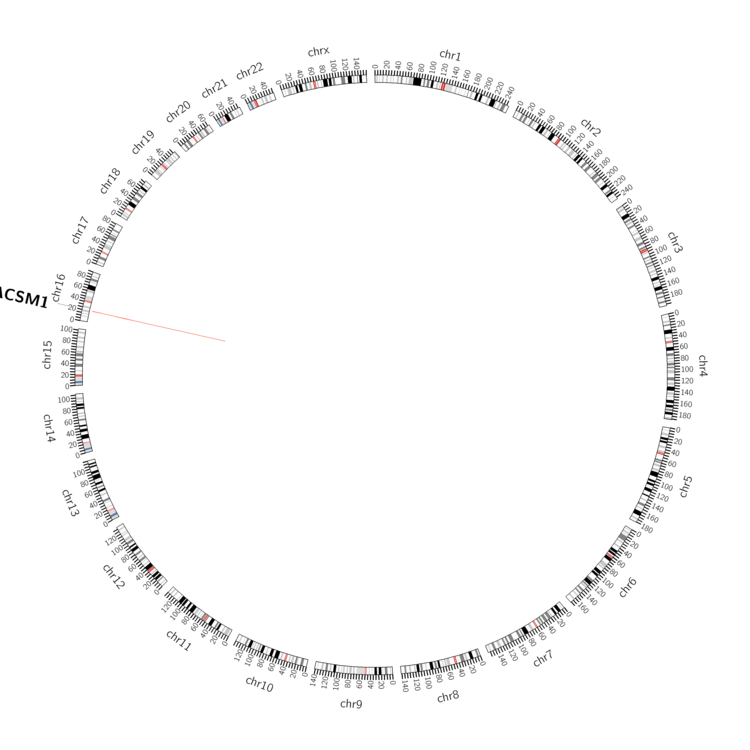
| Cytomap | UCSC genome browser: 16p12.3 | |
| Genomic location | chr16 :20634558-20702578 | |
| Type of gene | protein-coding | |
| RefGenes | NM_052956.2, | |
| Ensembl id | ENSG00000166743 | |
| Description | Butyrate CoA ligaseacyl-coenzyme A synthetase ACSM1, mitochondrialbutyrate--CoA ligase 1butyryl Coenzyme A synthetase 1butyryl-coenzyme A synthetase 1lipoate-activating enzymemedium-chain acyl-CoA synthetasemiddle-chain acyl-CoA synthetase 1 | |
| Modification date | 20141207 | |
| dbXrefs | MIM : 614357 | |
| HGNC : HGNC | ||
| Ensembl : ENSG00000166743 | ||
| HPRD : 12551 | ||
| Vega : OTTHUMG00000131550 | ||
| Protein | UniProt: go to UniProt's Cross Reference DB Table | |
| Expression | CleanEX: HS_ACSM1 | |
| BioGPS: 116285 | ||
| Gene Expression Atlas: ENSG00000166743 | ||
| The Human Protein Atlas: ENSG00000166743 | ||
| Pathway | NCI Pathway Interaction Database: ACSM1 | |
| KEGG: ACSM1 | ||
| REACTOME: ACSM1 | ||
| ConsensusPathDB | ||
| Pathway Commons: ACSM1 | ||
| Metabolism | MetaCyc: ACSM1 | |
| HUMANCyc: ACSM1 | ||
| Regulation | Ensembl's Regulation: ENSG00000166743 | |
| miRBase: chr16 :20,634,558-20,702,578 | ||
| TargetScan: NM_052956 | ||
| cisRED: ENSG00000166743 | ||
| Context | iHOP: ACSM1 | |
| cancer metabolism search in PubMed: ACSM1 | ||
| UCL Cancer Institute: ACSM1 | ||
| Assigned class in ccmGDB | C | |
| Top |
| Phenotypic Information for ACSM1(metabolism pathway, cancer, disease, phenome) |
| Cancer | CGAP: ACSM1 |
| Familial Cancer Database: ACSM1 | |
| * This gene is included in those cancer gene databases. |
|
|
|
|
|
|
| |||||||||||||||||||||||||||||||||||||||||||||||||||||||||||||||||||||||||||||||||||||||||||||||||||||||||||||||||||||||||||||||||||||||||||||||||||||||||||||||||||||||||||||||||||||||||||||||||||||||||||||||||||||||||||||||||||||||||||||||||||||||||||||||||||||||||||||||||||||||||||||||||||||||||||||||||||||||||||||||||||||||||||||
Oncogene 1 | Significant driver gene in | ||||||||||||||||||||||||||||||||||||||||||||||||||||||||||||||||||||||||||||||||||||||||||||||||||||||||||||||||||||||||||||||||||||||||||||||||||||||||||||||||||||||||||||||||||||||||||||||||||||||||||||||||||||||||||||||||||||||||||||||||||||||||||||||||||||||||||||||||||||||||||||||||||||||||||||||||||||||||||||||||||||||||||||||||||
| cf) number; DB name 1 Oncogene; http://nar.oxfordjournals.org/content/35/suppl_1/D721.long, 2 Tumor Suppressor gene; https://bioinfo.uth.edu/TSGene/, 3 Cancer Gene Census; http://www.nature.com/nrc/journal/v4/n3/abs/nrc1299.html, 4 CancerGenes; http://nar.oxfordjournals.org/content/35/suppl_1/D721.long, 5 Network of Cancer Gene; http://ncg.kcl.ac.uk/index.php, 1Therapeutic Vulnerabilities in Cancer; http://cbio.mskcc.org/cancergenomics/statius/ |
| KEGG_BUTANOATE_METABOLISM | |
| OMIM | |
| Orphanet | |
| Disease | KEGG Disease: ACSM1 |
| MedGen: ACSM1 (Human Medical Genetics with Condition) | |
| ClinVar: ACSM1 | |
| Phenotype | MGI: ACSM1 (International Mouse Phenotyping Consortium) |
| PhenomicDB: ACSM1 | |
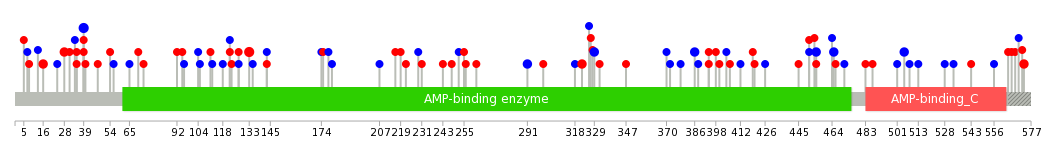
| Mutations for ACSM1 |
| * Under tables are showing count per each tissue to give us broad intuition about tissue specific mutation patterns.You can go to the detailed page for each mutation database's web site. |
| - Statistics for Tissue and Mutation type | Top |
 |
| - For Inter-chromosomal Variations |
| There's no inter-chromosomal structural variation. |
| - For Intra-chromosomal Variations |
| * Intra-chromosomal variantions includes 'intrachromosomal amplicon to amplicon', 'intrachromosomal amplicon to non-amplified dna', 'intrachromosomal deletion', 'intrachromosomal fold-back inversion', 'intrachromosomal inversion', 'intrachromosomal tandem duplication', 'Intrachromosomal unknown type', 'intrachromosomal with inverted orientation', 'intrachromosomal with non-inverted orientation'. |
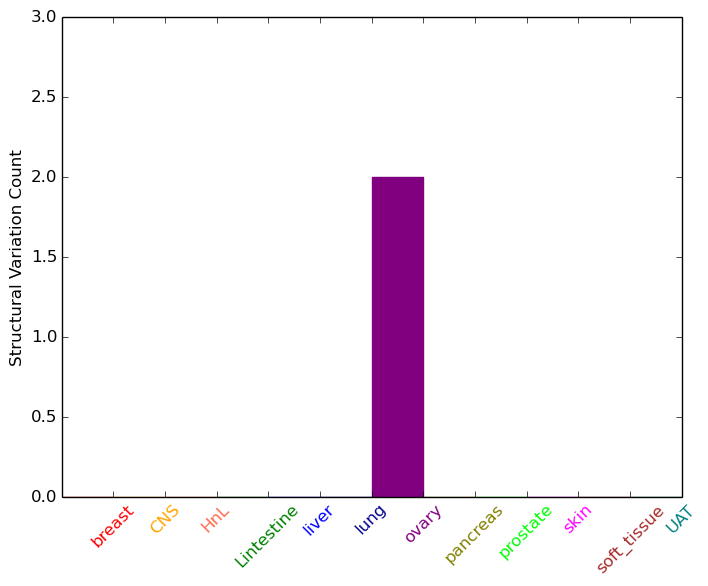 |
| Sample | Symbol_a | Chr_a | Start_a | End_a | Symbol_b | Chr_b | Start_b | End_b |
| ovary | ACSM1 | chr16 | 20655764 | 20655784 | ACSM1 | chr16 | 20657580 | 20657600 |
| ovary | ACSM1 | chr16 | 20702082 | 20702102 | ACSM1 | chr16 | 20682417 | 20682437 |
| cf) Tissue number; Tissue name (1;Breast, 2;Central_nervous_system, 3;Haematopoietic_and_lymphoid_tissue, 4;Large_intestine, 5;Liver, 6;Lung, 7;Ovary, 8;Pancreas, 9;Prostate, 10;Skin, 11;Soft_tissue, 12;Upper_aerodigestive_tract) |
| * From mRNA Sanger sequences, Chitars2.0 arranged chimeric transcripts. This table shows ACSM1 related fusion information. |
| ID | Head Gene | Tail Gene | Accession | Gene_a | qStart_a | qEnd_a | Chromosome_a | tStart_a | tEnd_a | Gene_a | qStart_a | qEnd_a | Chromosome_a | tStart_a | tEnd_a |
| BF932027 | KAT2A | 13 | 184 | 17 | 40265390 | 40265561 | ACSM1 | 172 | 192 | 16 | 20688194 | 20688214 | |
| Top |
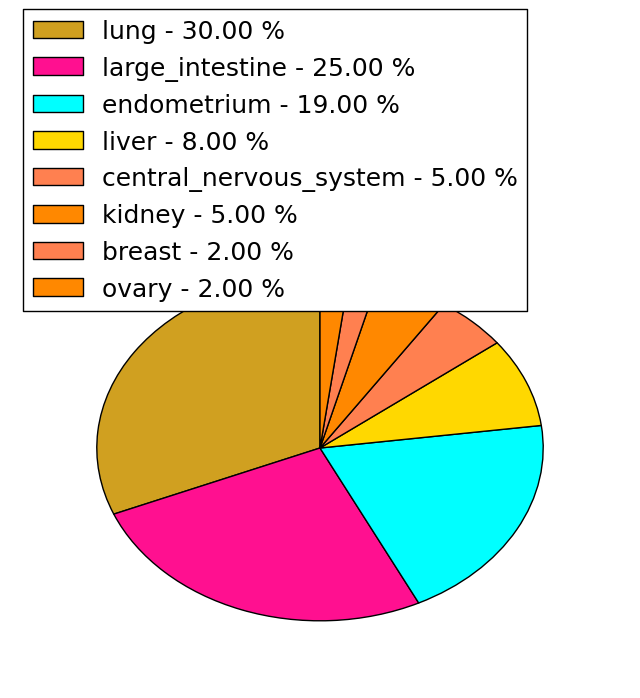
| Mutation type/ Tissue ID | brca | cns | cerv | endome | haematopo | kidn | Lintest | liver | lung | ns | ovary | pancre | prost | skin | stoma | thyro | urina | |||
| Total # sample | 1 | |||||||||||||||||||
| GAIN (# sample) | 1 | |||||||||||||||||||
| LOSS (# sample) |
| cf) Tissue ID; Tissue type (1; Breast, 2; Central_nervous_system, 3; Cervix, 4; Endometrium, 5; Haematopoietic_and_lymphoid_tissue, 6; Kidney, 7; Large_intestine, 8; Liver, 9; Lung, 10; NS, 11; Ovary, 12; Pancreas, 13; Prostate, 14; Skin, 15; Stomach, 16; Thyroid, 17; Urinary_tract) |
| Top |
|
 |
| Top |
| Stat. for Non-Synonymous SNVs (# total SNVs=62) | (# total SNVs=36) |
 |  |
(# total SNVs=0) | (# total SNVs=1) |
 |
| Top |
| * When you move the cursor on each content, you can see more deailed mutation information on the Tooltip. Those are primary_site,primary_histology,mutation(aa),pubmedID. |
| GRCh37 position | Mutation(aa) | Unique sampleID count |
| chr16:20673143-20673143 | p.R322L | 6 |
| chr16:20696520-20696520 | p.R133Q | 4 |
| chr16:20702394-20702394 | p.R39R | 3 |
| chr16:20638573-20638573 | p.K455N | 3 |
| chr16:20648698-20648698 | p.V398I | 3 |
| chr16:20702428-20702428 | p.R28H | 2 |
| chr16:20648726-20648726 | p.F388F | 2 |
| chr16:20638635-20638635 | p.D435N | 2 |
| chr16:20702464-20702464 | p.S16F | 2 |
| chr16:20636840-20636840 | p.R478C | 2 |
| Top |
|
 |
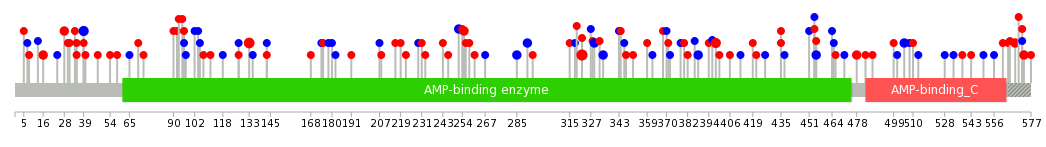
| Point Mutation/ Tissue ID | 1 | 2 | 3 | 4 | 5 | 6 | 7 | 8 | 9 | 10 | 11 | 12 | 13 | 14 | 15 | 16 | 17 | 18 | 19 | 20 |
| # sample | 1 | 13 | 2 | 3 | 2 | 13 | 11 | 1 | 40 | 4 | 14 | |||||||||
| # mutation | 1 | 11 | 2 | 3 | 2 | 12 | 11 | 1 | 43 | 5 | 15 | |||||||||
| nonsynonymous SNV | 8 | 1 | 2 | 6 | 6 | 23 | 3 | 8 | ||||||||||||
| synonymous SNV | 1 | 3 | 1 | 1 | 2 | 6 | 5 | 1 | 20 | 2 | 7 |
| cf) Tissue ID; Tissue type (1; BLCA[Bladder Urothelial Carcinoma], 2; BRCA[Breast invasive carcinoma], 3; CESC[Cervical squamous cell carcinoma and endocervical adenocarcinoma], 4; COAD[Colon adenocarcinoma], 5; GBM[Glioblastoma multiforme], 6; Glioma Low Grade, 7; HNSC[Head and Neck squamous cell carcinoma], 8; KICH[Kidney Chromophobe], 9; KIRC[Kidney renal clear cell carcinoma], 10; KIRP[Kidney renal papillary cell carcinoma], 11; LAML[Acute Myeloid Leukemia], 12; LUAD[Lung adenocarcinoma], 13; LUSC[Lung squamous cell carcinoma], 14; OV[Ovarian serous cystadenocarcinoma ], 15; PAAD[Pancreatic adenocarcinoma], 16; PRAD[Prostate adenocarcinoma], 17; SKCM[Skin Cutaneous Melanoma], 18:STAD[Stomach adenocarcinoma], 19:THCA[Thyroid carcinoma], 20:UCEC[Uterine Corpus Endometrial Carcinoma]) |
| Top |
| * We represented just top 10 SNVs. When you move the cursor on each content, you can see more deailed mutation information on the Tooltip. Those are primary_site, primary_histology, mutation(aa), pubmedID. |
| Genomic Position | Mutation(aa) | Unique sampleID count |
| chr16:20702394 | p.K455K | 3 |
| chr16:20696520 | p.R133Q | 3 |
| chr16:20638573 | p.R39R | 3 |
| chr16:20702464 | p.P505P | 2 |
| chr16:20673143 | p.R322Q | 2 |
| chr16:20648732 | p.E573K | 2 |
| chr16:20681188 | p.R28H | 2 |
| chr16:20638543 | p.I291I | 2 |
| chr16:20673121 | p.L465L | 2 |
| chr16:20634825 | p.S16F | 2 |
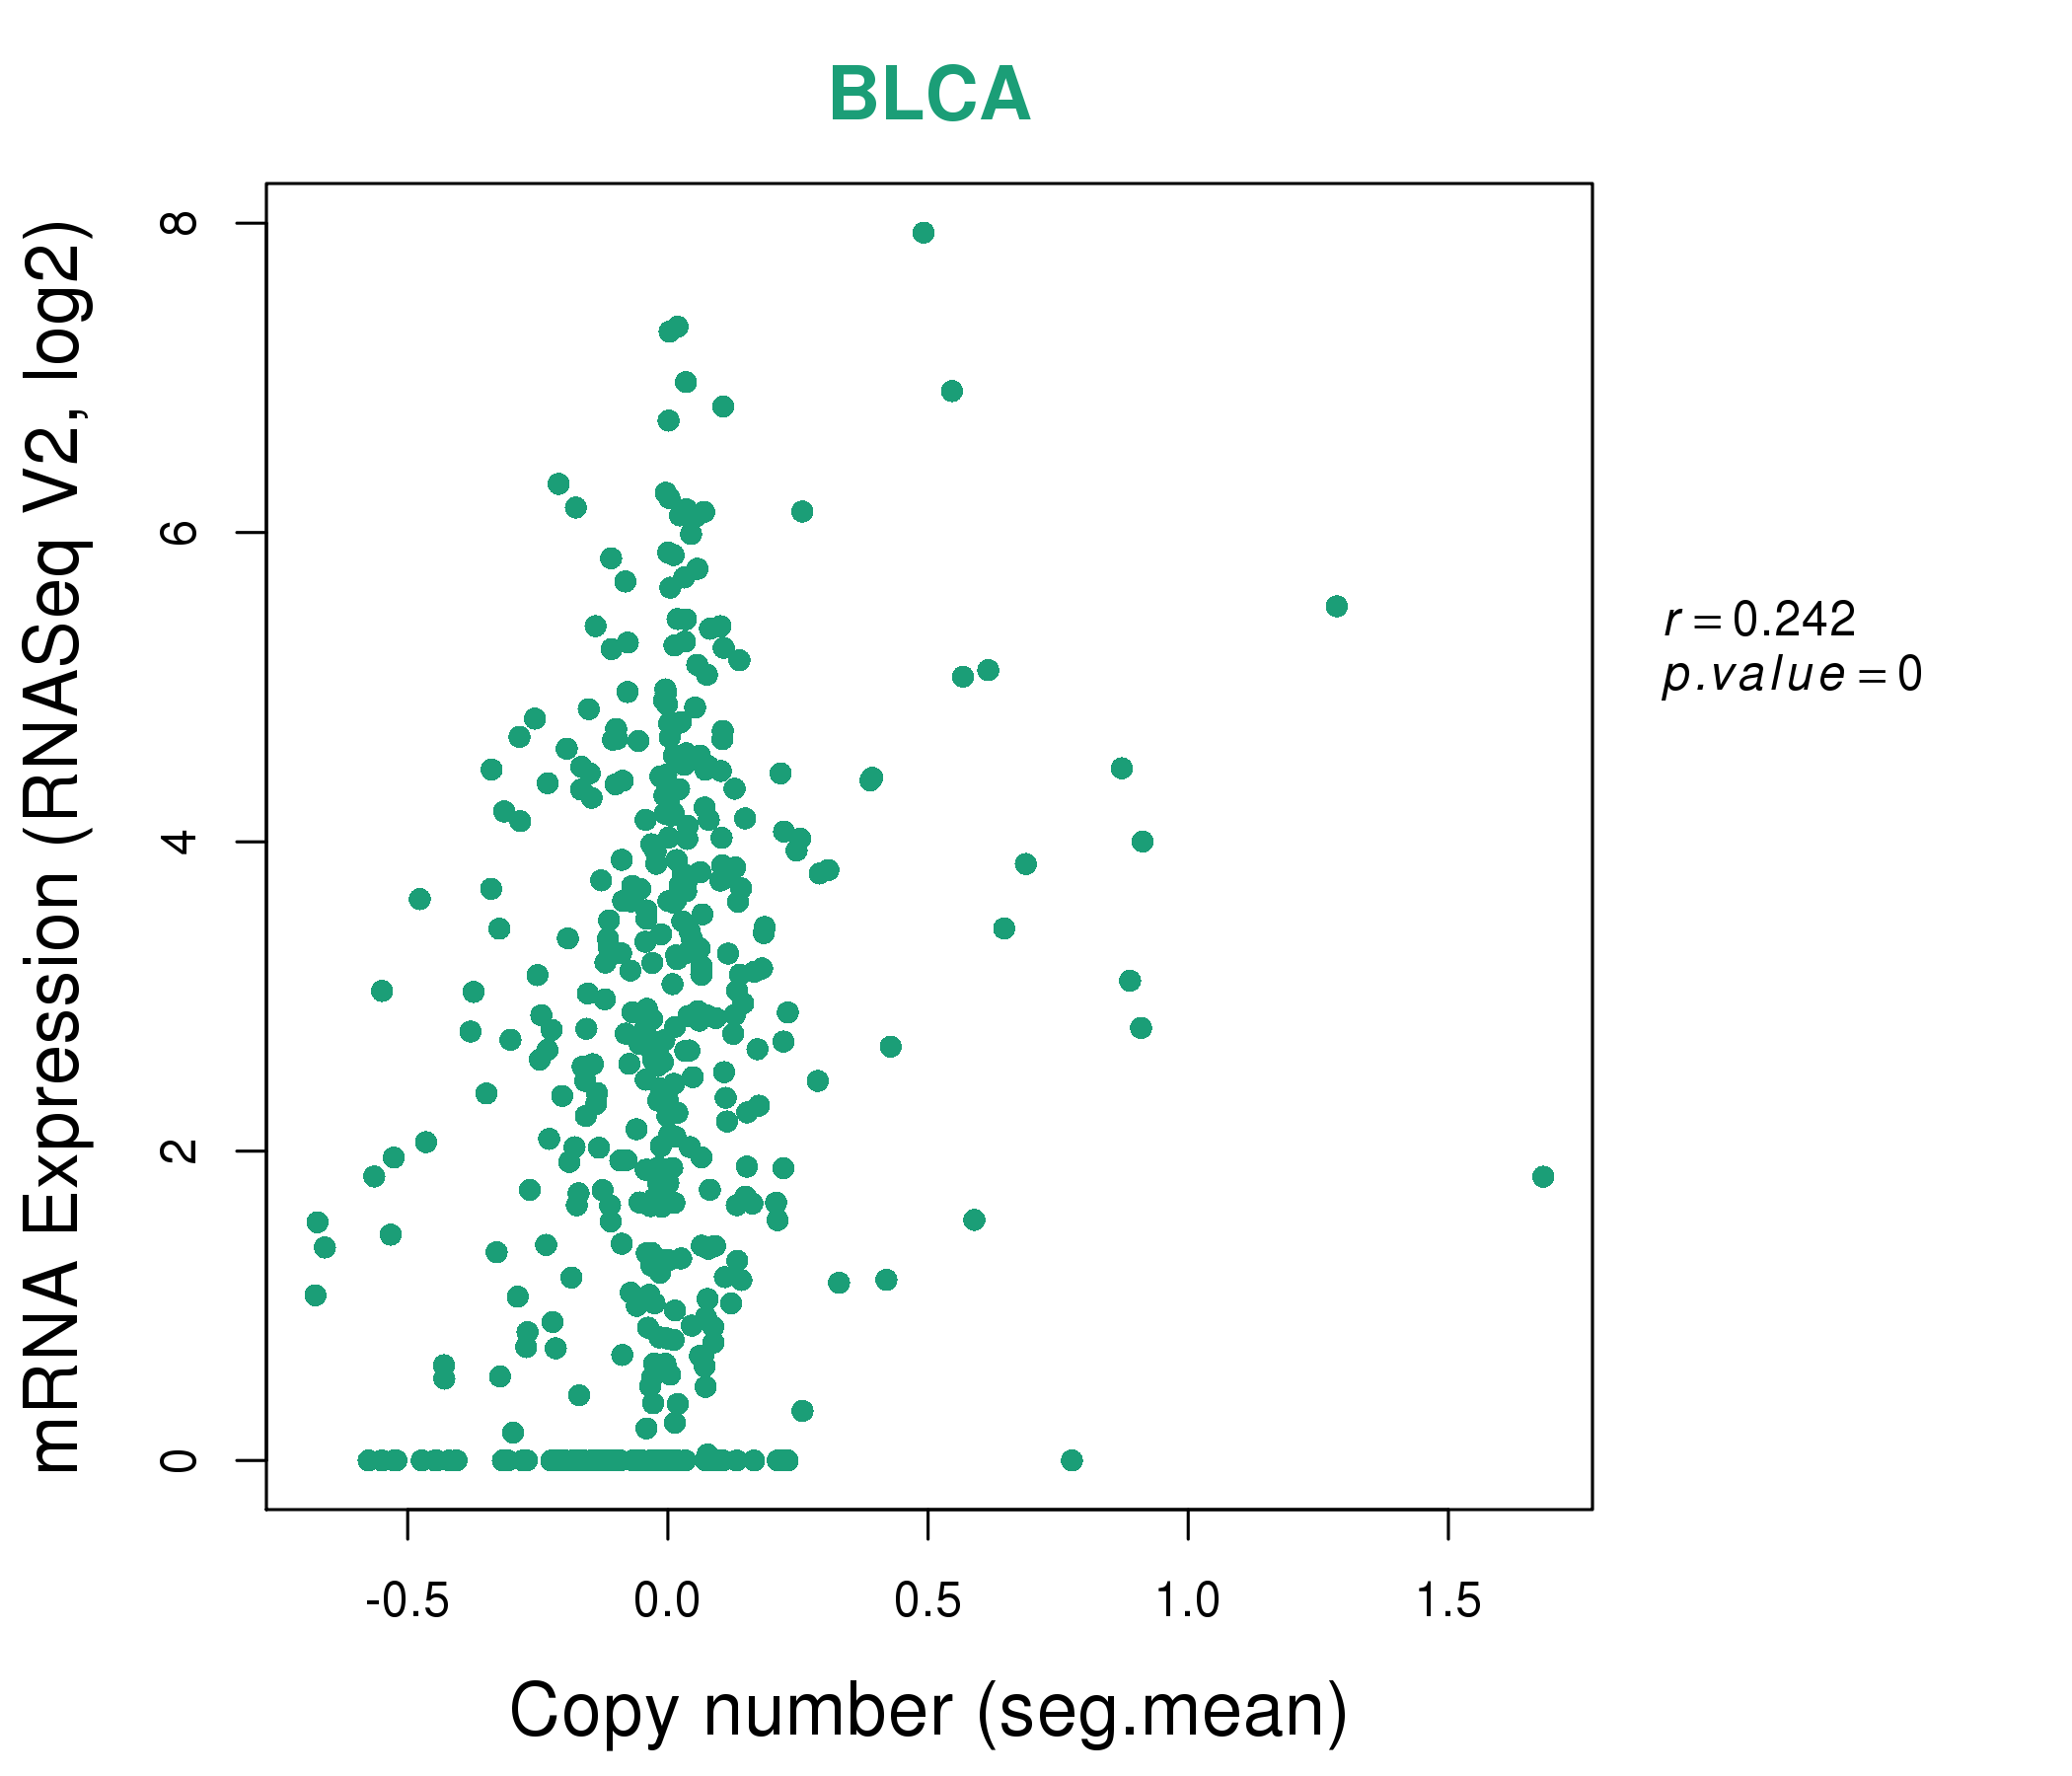
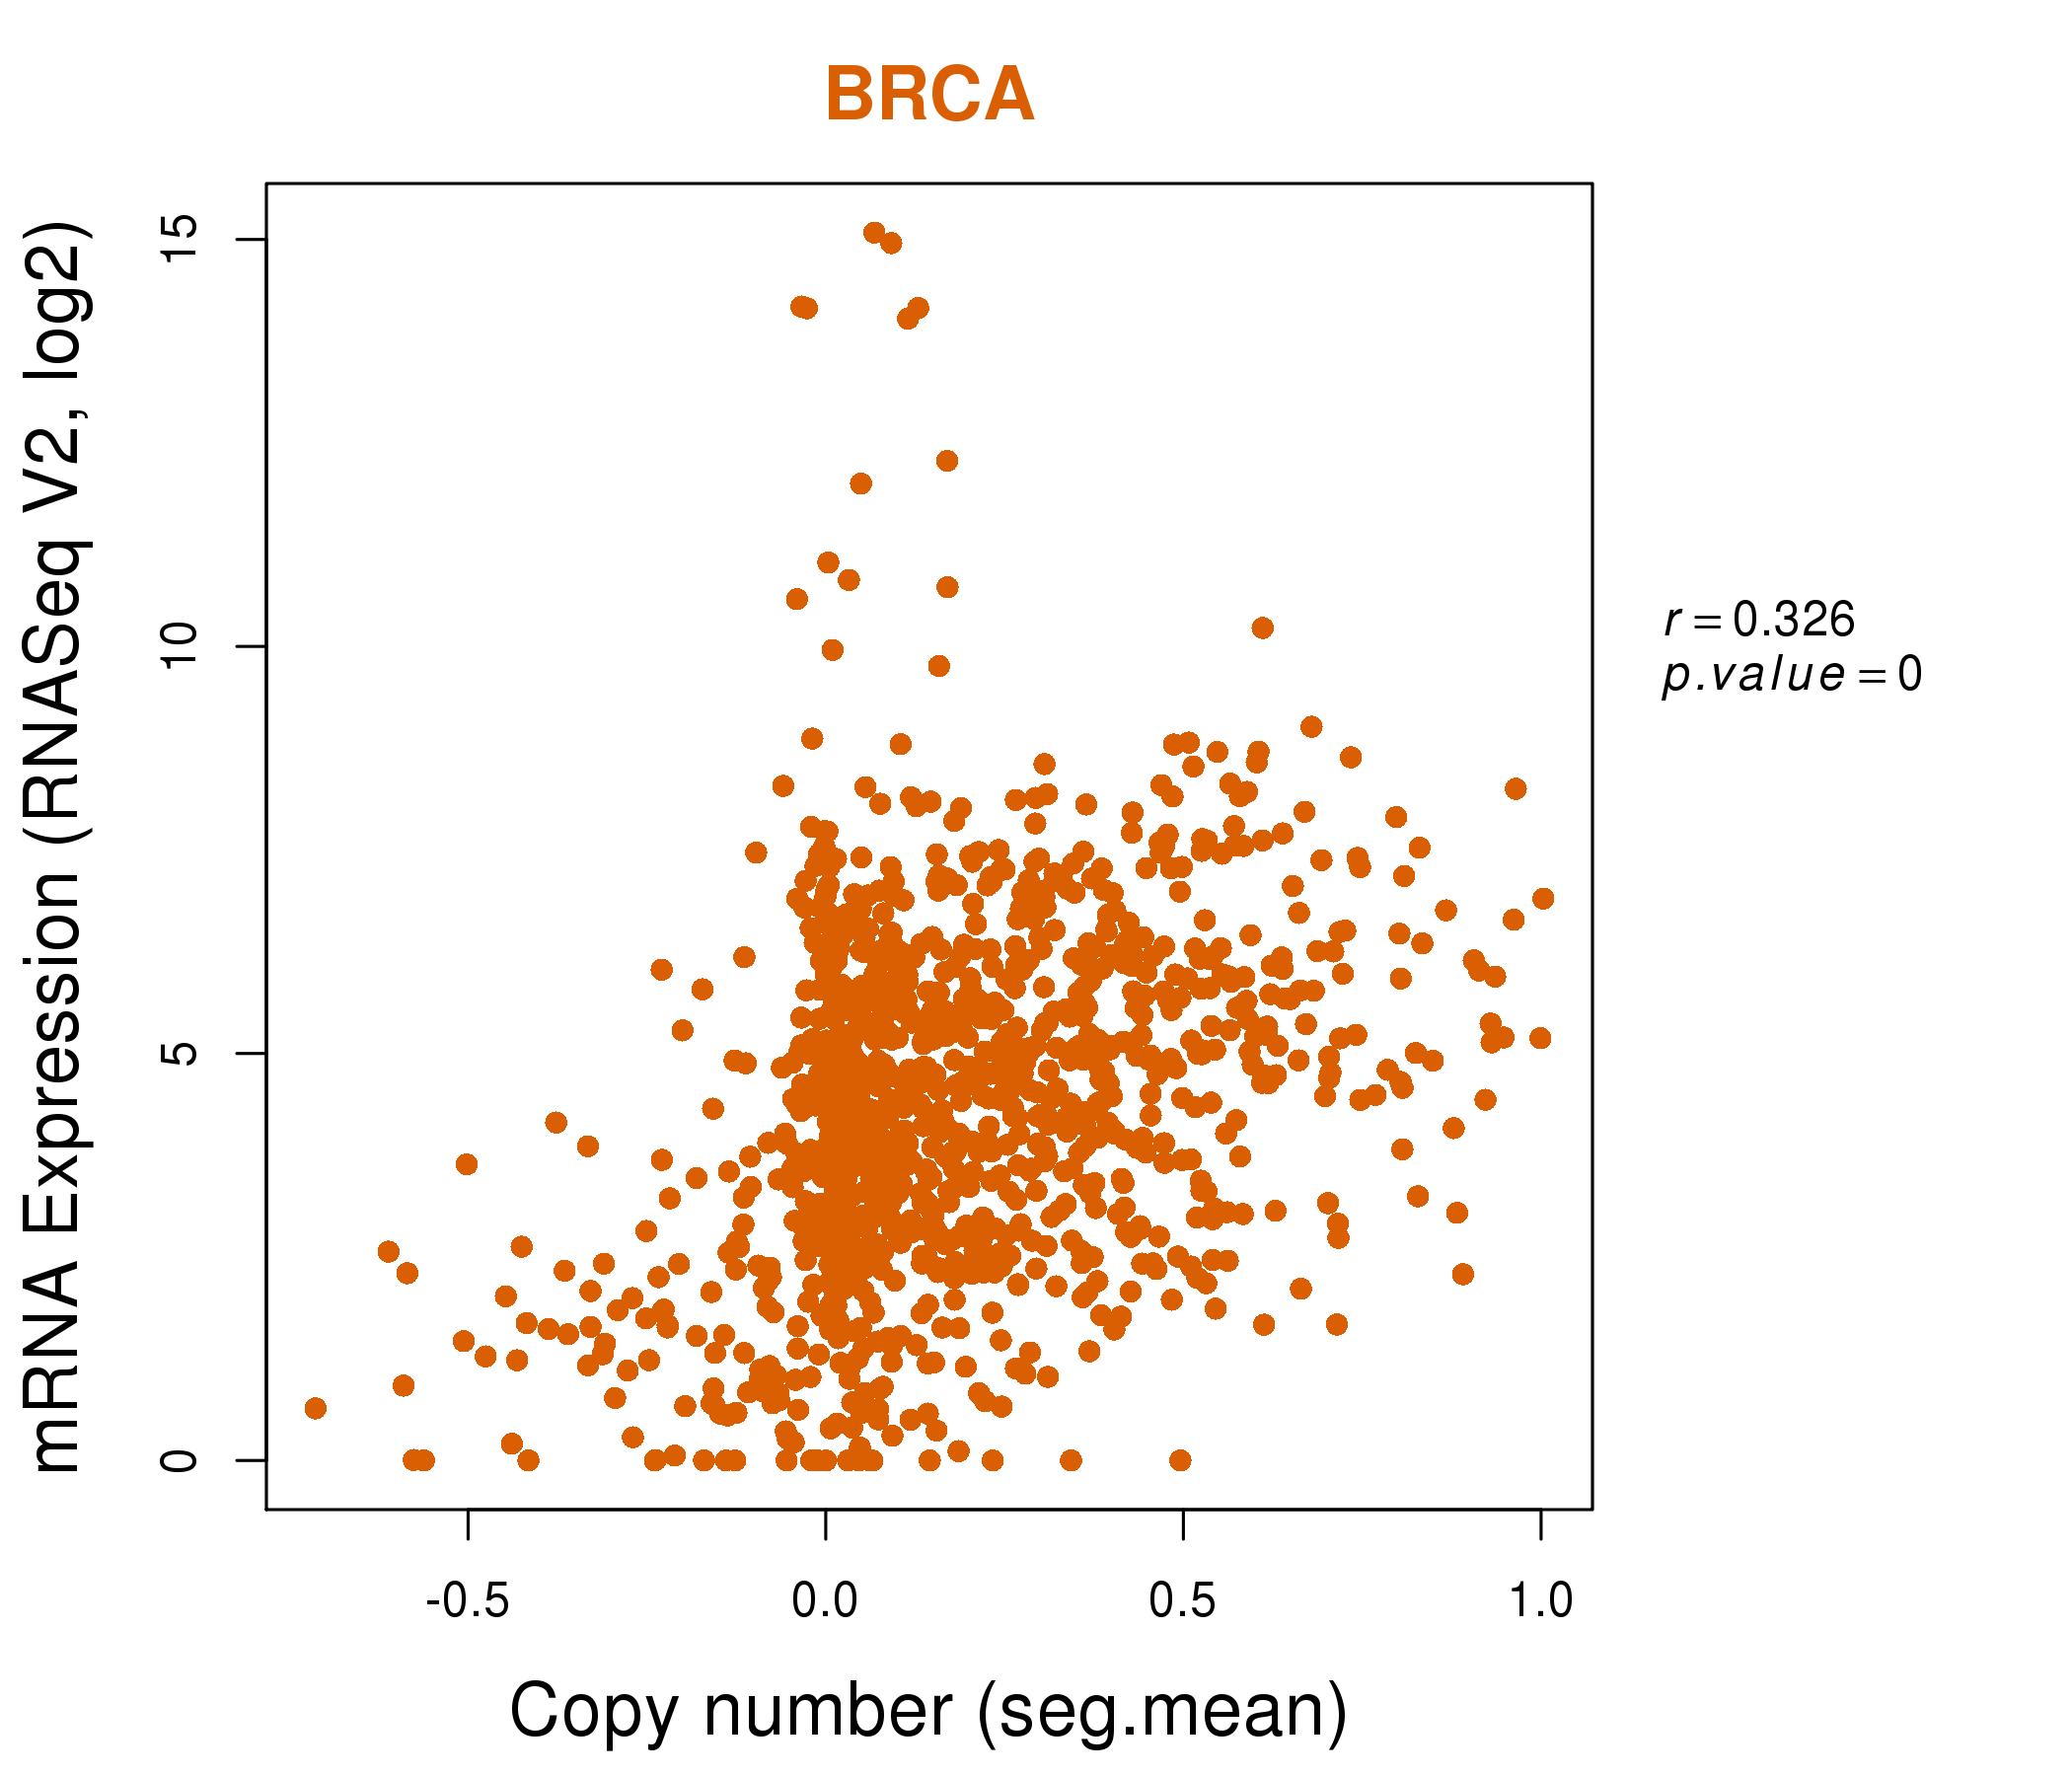
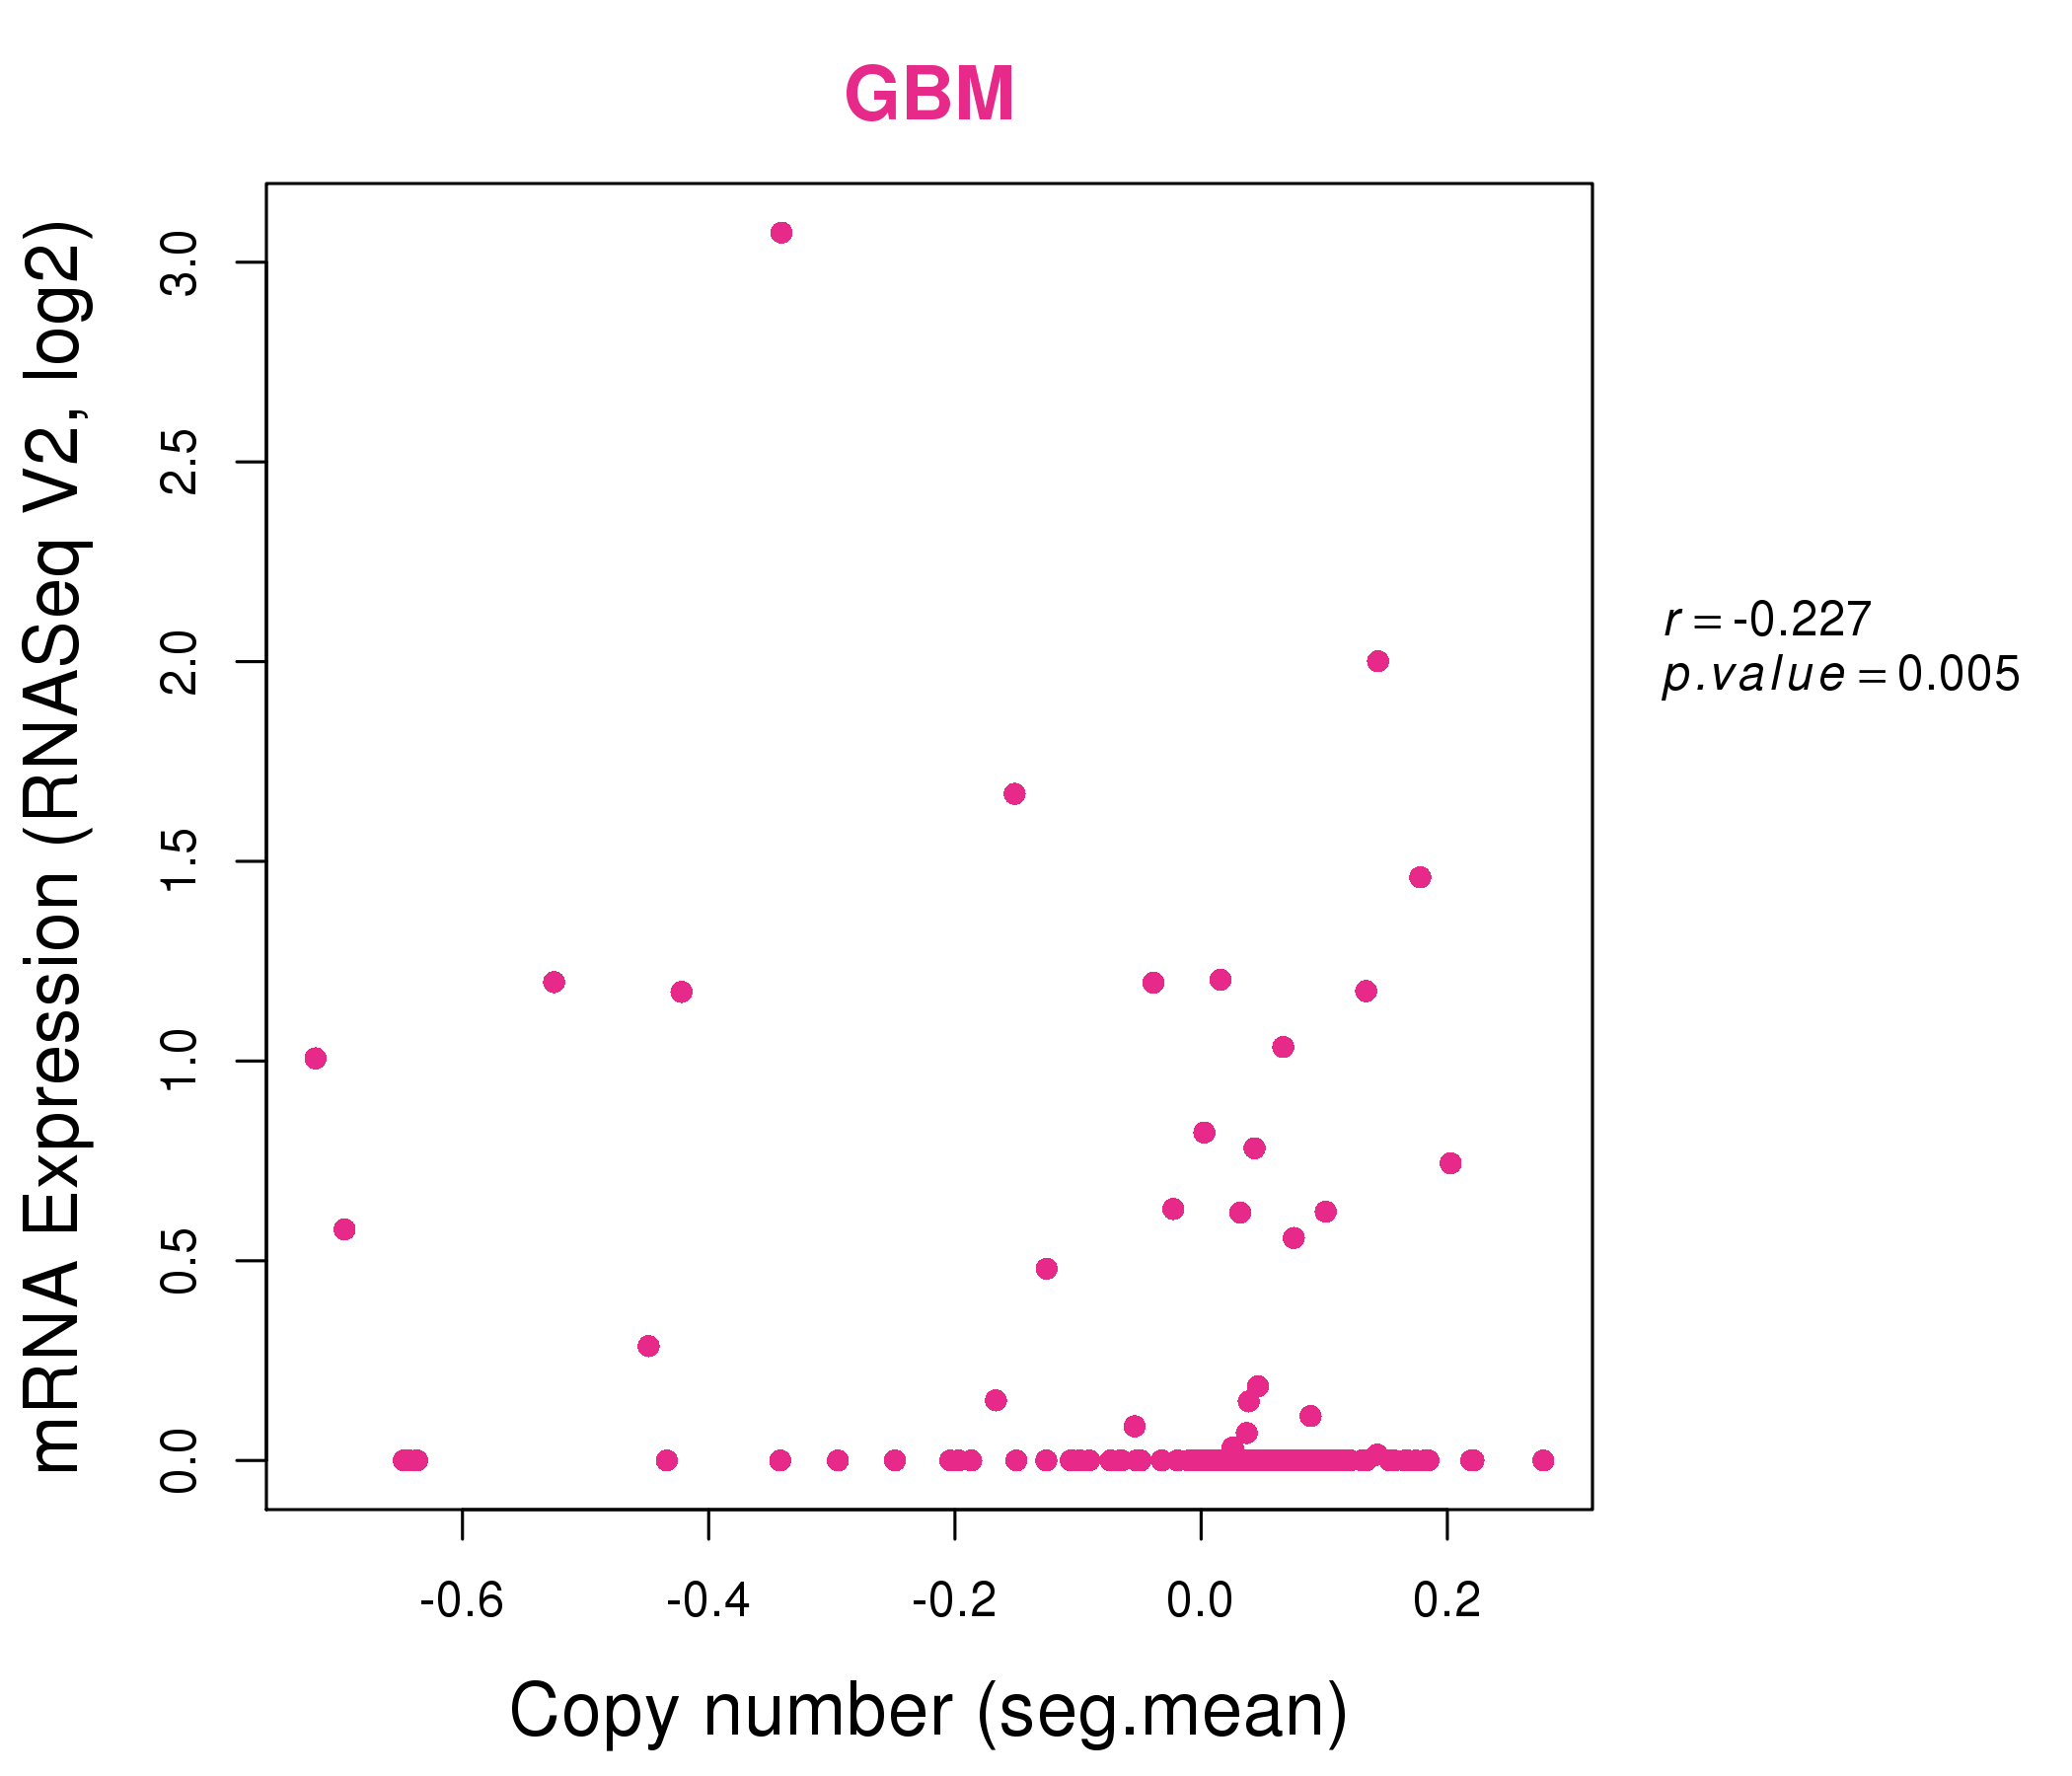
| * Copy number data were extracted from TCGA using R package TCGA-Assembler. The URLs of all public data files on TCGA DCC data server were gathered on Jan-05-2015. Function ProcessCNAData in TCGA-Assembler package was used to obtain gene-level copy number value which is calculated as the average copy number of the genomic region of a gene. |
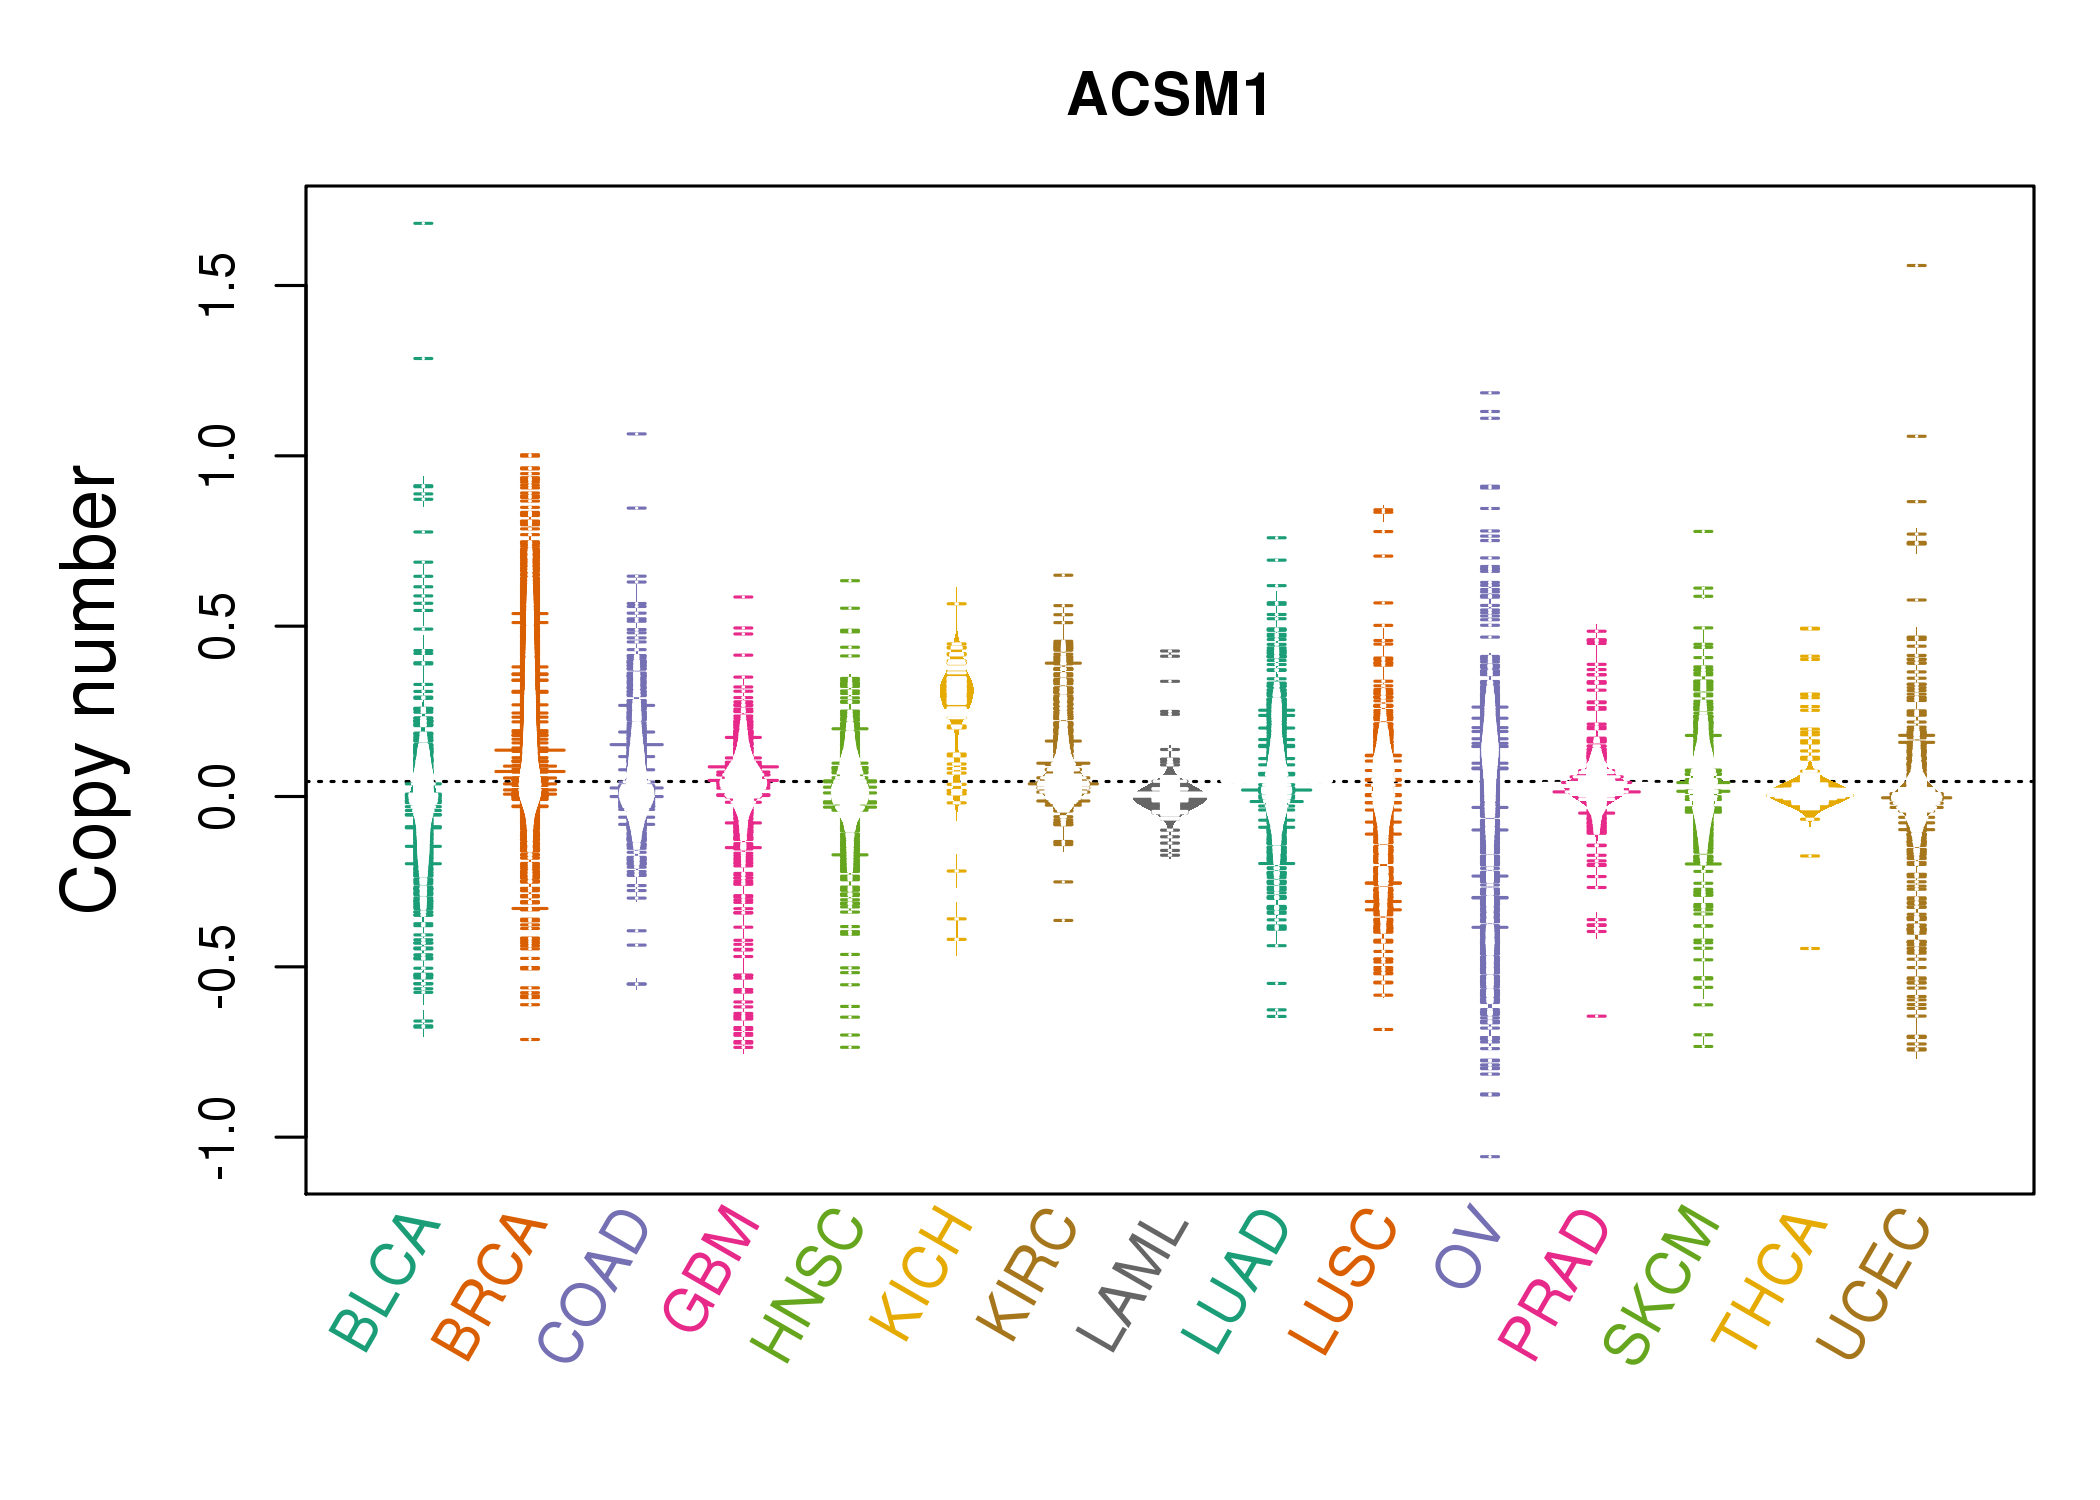 |
| cf) Tissue ID[Tissue type]: BLCA[Bladder Urothelial Carcinoma], BRCA[Breast invasive carcinoma], CESC[Cervical squamous cell carcinoma and endocervical adenocarcinoma], COAD[Colon adenocarcinoma], GBM[Glioblastoma multiforme], Glioma Low Grade, HNSC[Head and Neck squamous cell carcinoma], KICH[Kidney Chromophobe], KIRC[Kidney renal clear cell carcinoma], KIRP[Kidney renal papillary cell carcinoma], LAML[Acute Myeloid Leukemia], LUAD[Lung adenocarcinoma], LUSC[Lung squamous cell carcinoma], OV[Ovarian serous cystadenocarcinoma ], PAAD[Pancreatic adenocarcinoma], PRAD[Prostate adenocarcinoma], SKCM[Skin Cutaneous Melanoma], STAD[Stomach adenocarcinoma], THCA[Thyroid carcinoma], UCEC[Uterine Corpus Endometrial Carcinoma] |
| Top |
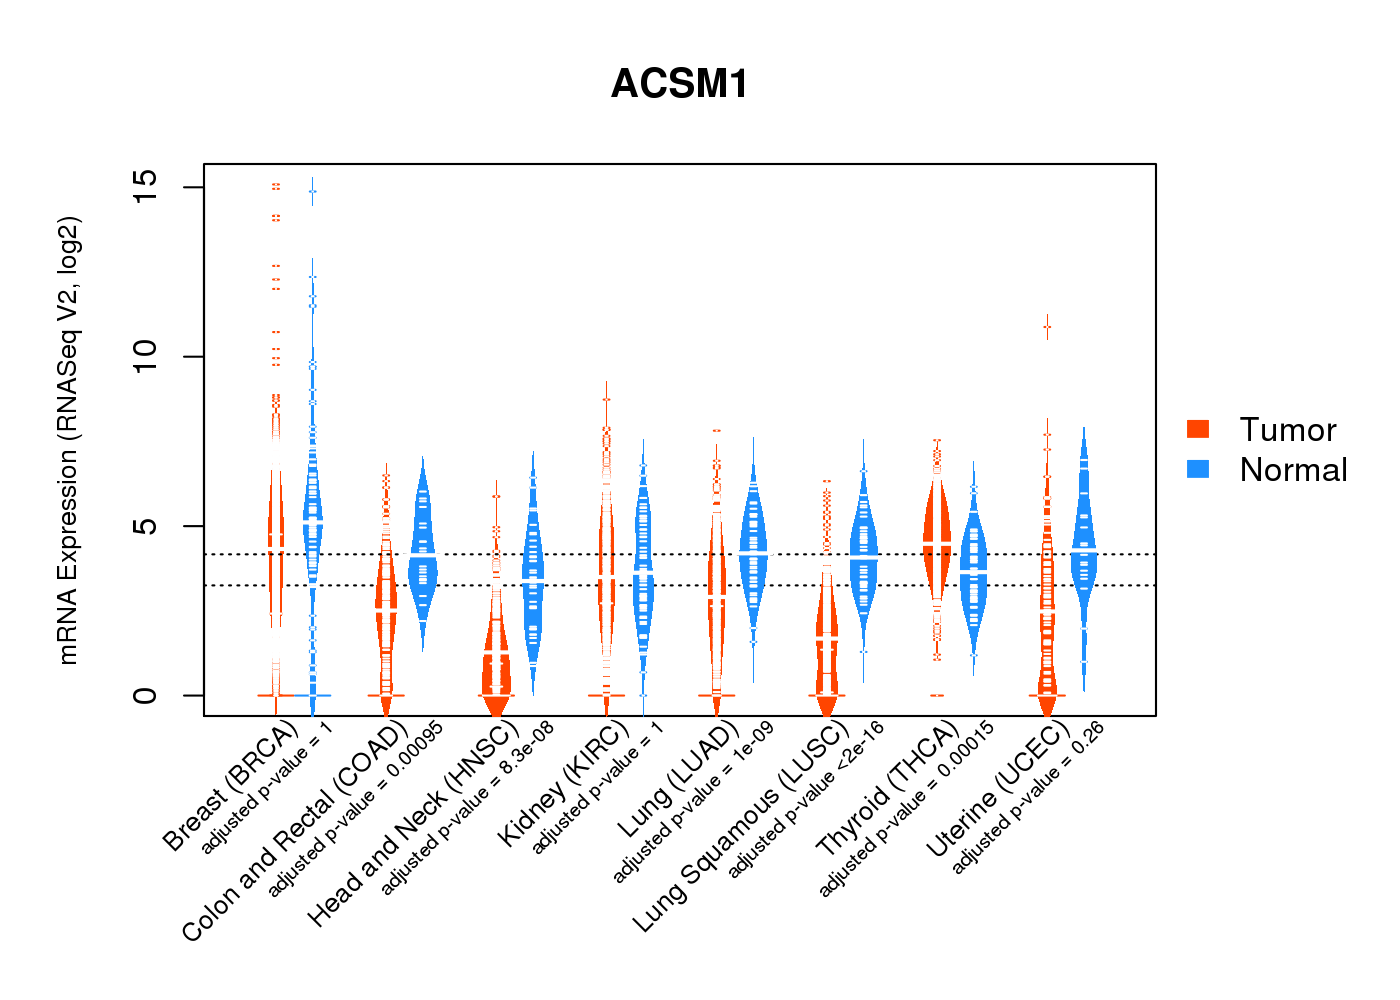
| Gene Expression for ACSM1 |
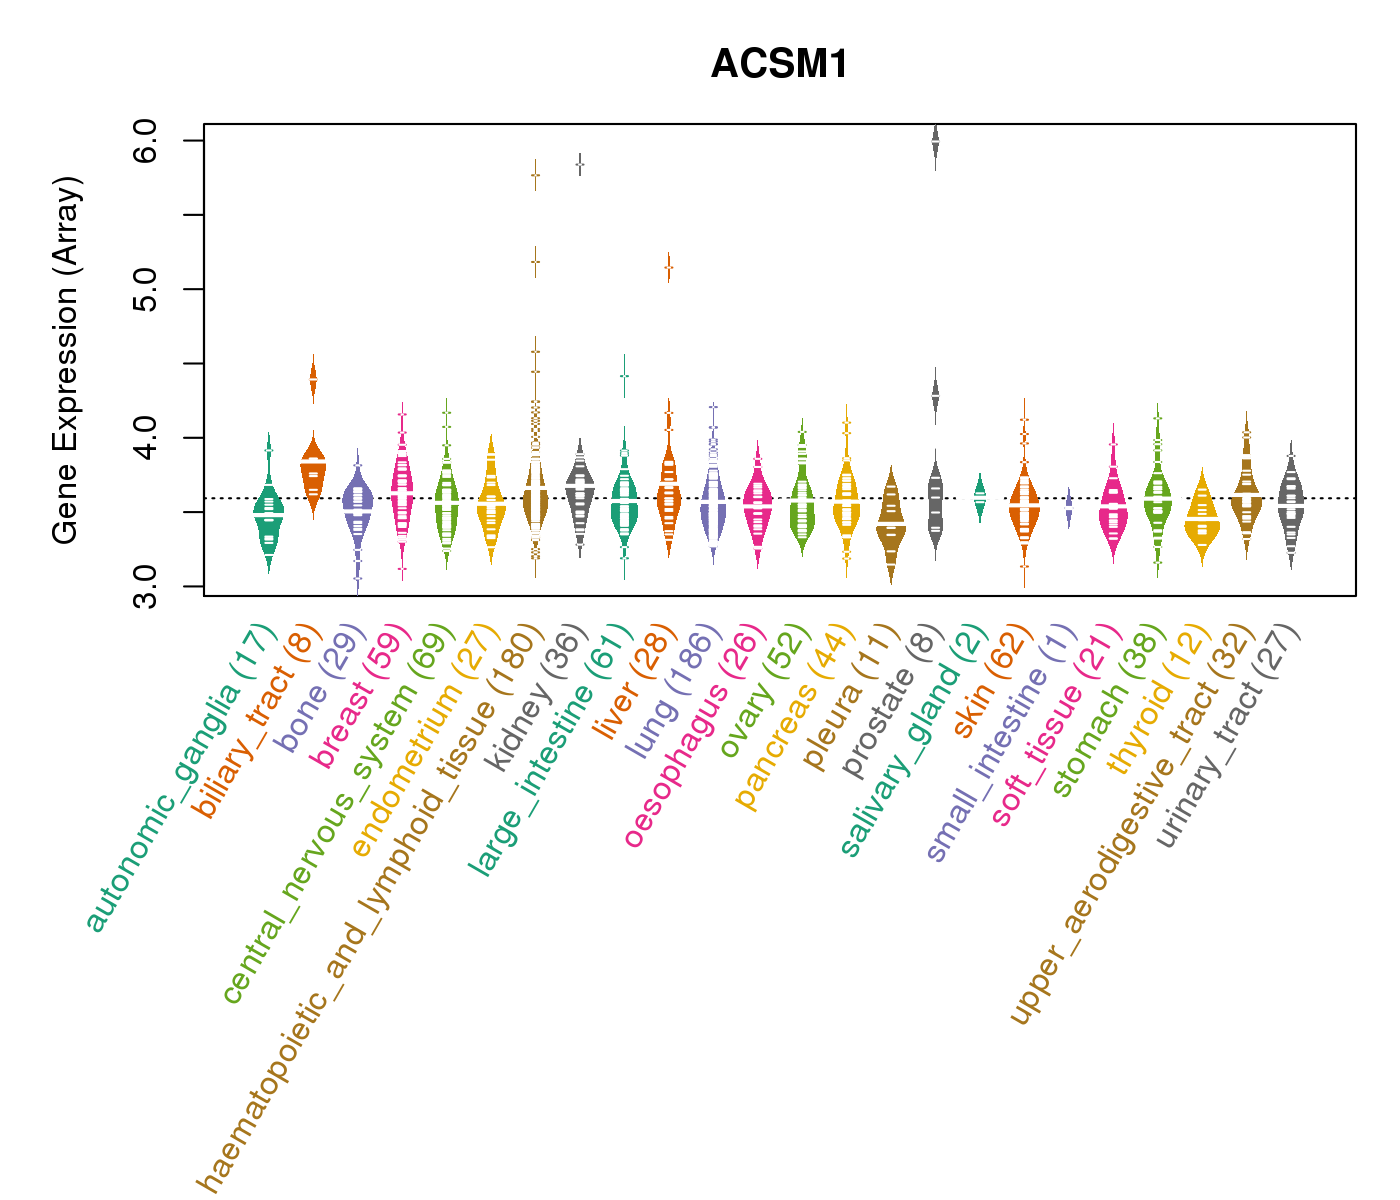
| * CCLE gene expression data were extracted from CCLE_Expression_Entrez_2012-10-18.res: Gene-centric RMA-normalized mRNA expression data. |
 |
| * Normalized gene expression data of RNASeqV2 was extracted from TCGA using R package TCGA-Assembler. The URLs of all public data files on TCGA DCC data server were gathered at Jan-05-2015. Only eight cancer types have enough normal control samples for differential expression analysis. (t test, adjusted p<0.05 (using Benjamini-Hochberg FDR)) |
 |
| Top |
| * This plots show the correlation between CNV and gene expression. |
: Open all plots for all cancer types
 |
|
 |
|
| Top |
| Gene-Gene Network Information |
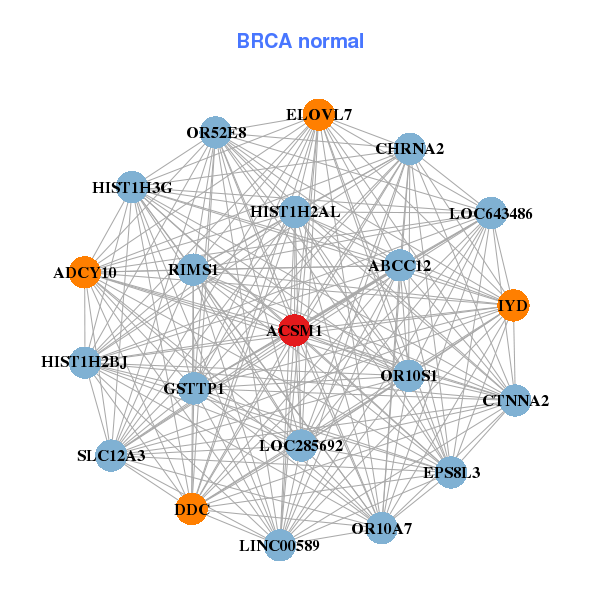
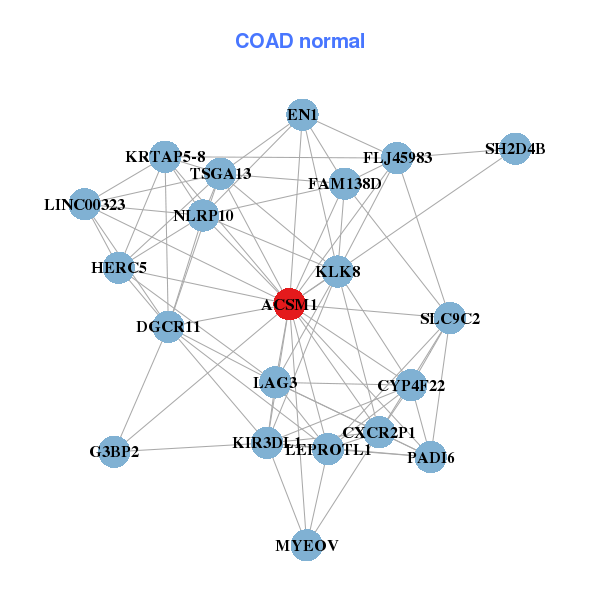
| * Co-Expression network figures were drawn using R package igraph. Only the top 20 genes with the highest correlations were shown. Red circle: input gene, orange circle: cell metabolism gene, sky circle: other gene |
: Open all plots for all cancer types
 |
| ||||
| ACSM1,B3GAT1,C15orf43,CLDN8,FCN2,GGT1,GGT3P, GUSB,ISX,LST-3TM12,MYOM2,PNLIPRP3,RLN3,SCP2, SERHL2,SERHL,SLC38A4,SLCO1B1,SPINK8,SULT1C3,UGT2B28 | ABCC12,ACSM1,ADCY10,LINC00589,CHRNA2,CTNNA2,DDC, ELOVL7,EPS8L3,GSTTP1,HIST1H2AL,HIST1H2BJ,HIST1H3G,IYD, LOC285692,LOC643486,OR10A7,OR10S1,OR52E8,RIMS1,SLC12A3 | ||||
 |
| ||||
| ACSM1,ACSM3,ALDH1L1,APOBR,SMCO4,HMGN2P46,C2orf72, CES3,CYB561,ERN2,GJA9,MOGAT2,MRAP2,NXF3, SGSM3,SH3RF2,SLC9A2,TXNDC11,VSIG2,VWA5A,ZBTB7C | ACSM1,LINC00323,CXCR2P1,CYP4F22,DGCR11,EN1,FAM138D, FLJ45983,G3BP2,HERC5,KIR3DL1,KLK8,KRTAP5-8,LAG3, LEPROTL1,MYEOV,NLRP10,PADI6,SH2D4B,SLC9C2,TSGA13 |
| * Co-Expression network figures were drawn using R package igraph. Only the top 20 genes with the highest correlations were shown. Red circle: input gene, orange circle: cell metabolism gene, sky circle: other gene |
: Open all plots for all cancer types
| Top |
: Open all interacting genes' information including KEGG pathway for all interacting genes from DAVID
| Top |
| Pharmacological Information for ACSM1 |
| DB Category | DB Name | DB's ID and Url link |
| * Gene Centered Interaction Network. |
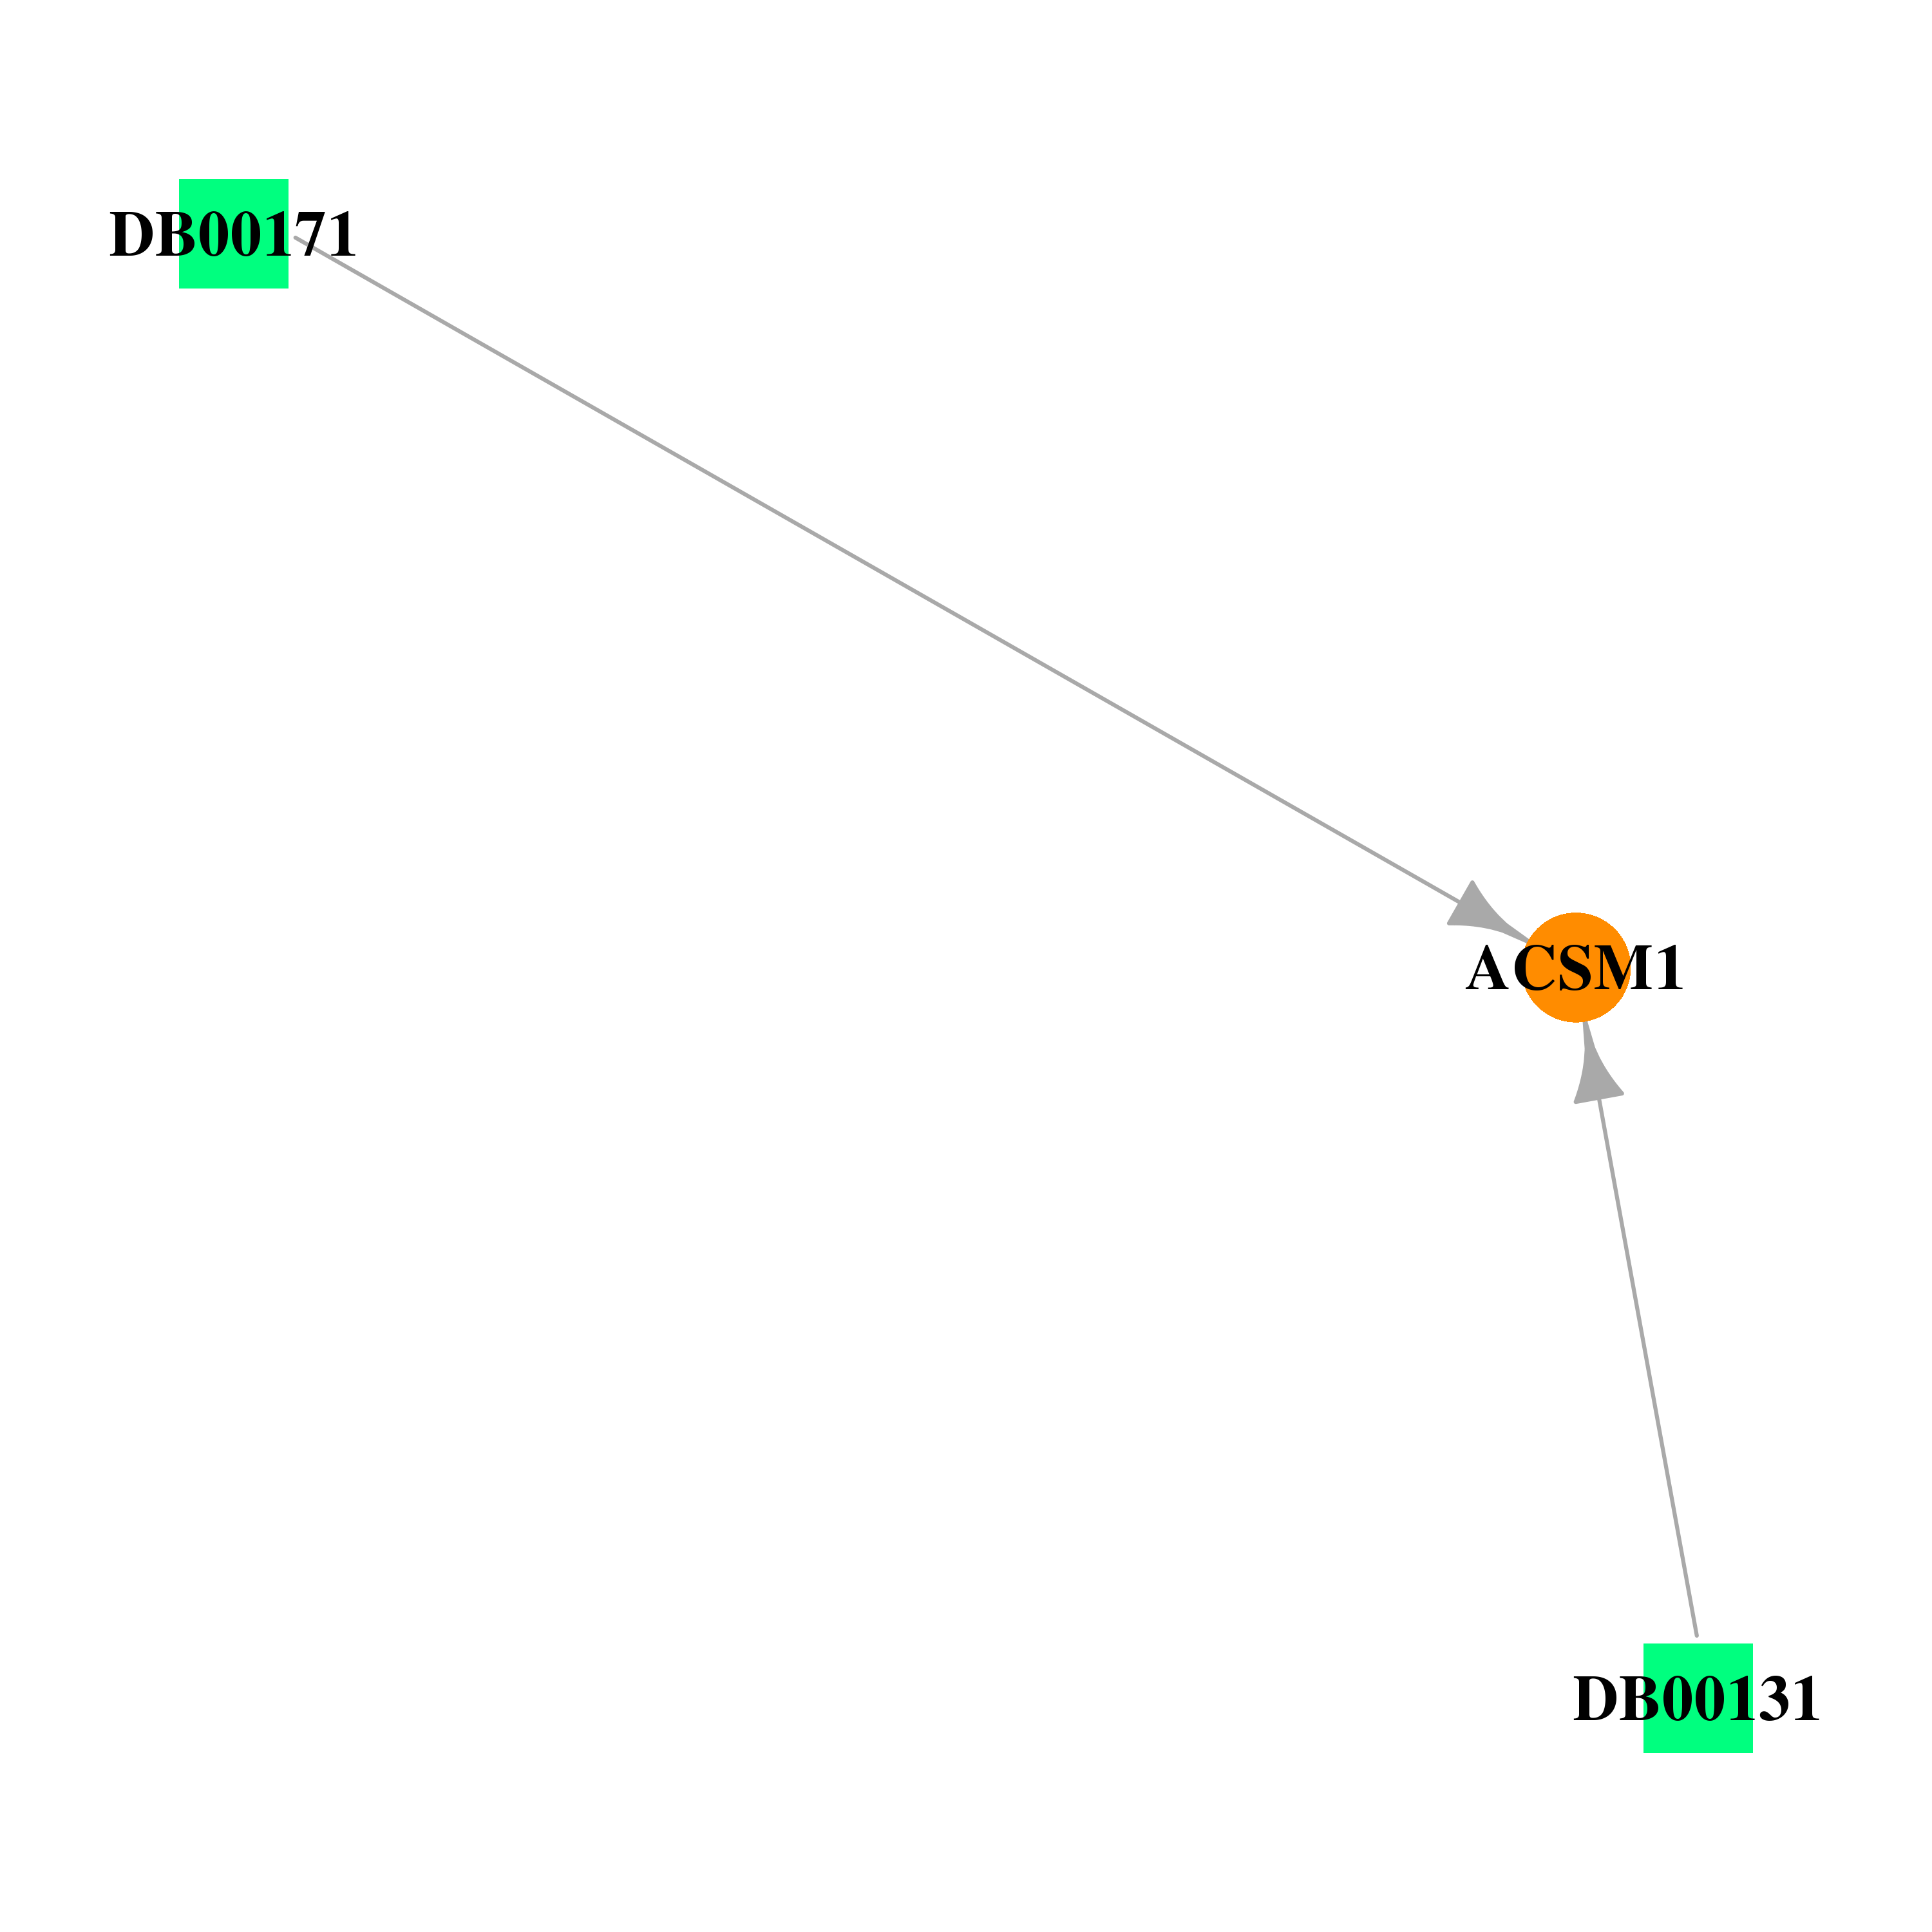 |
| * Drug Centered Interaction Network. |
| DrugBank ID | Target Name | Drug Groups | Generic Name | Drug Centered Network | Drug Structure |
| DB00131 | acyl-CoA synthetase medium-chain family member 1 | approved; nutraceutical | Adenosine monophosphate | 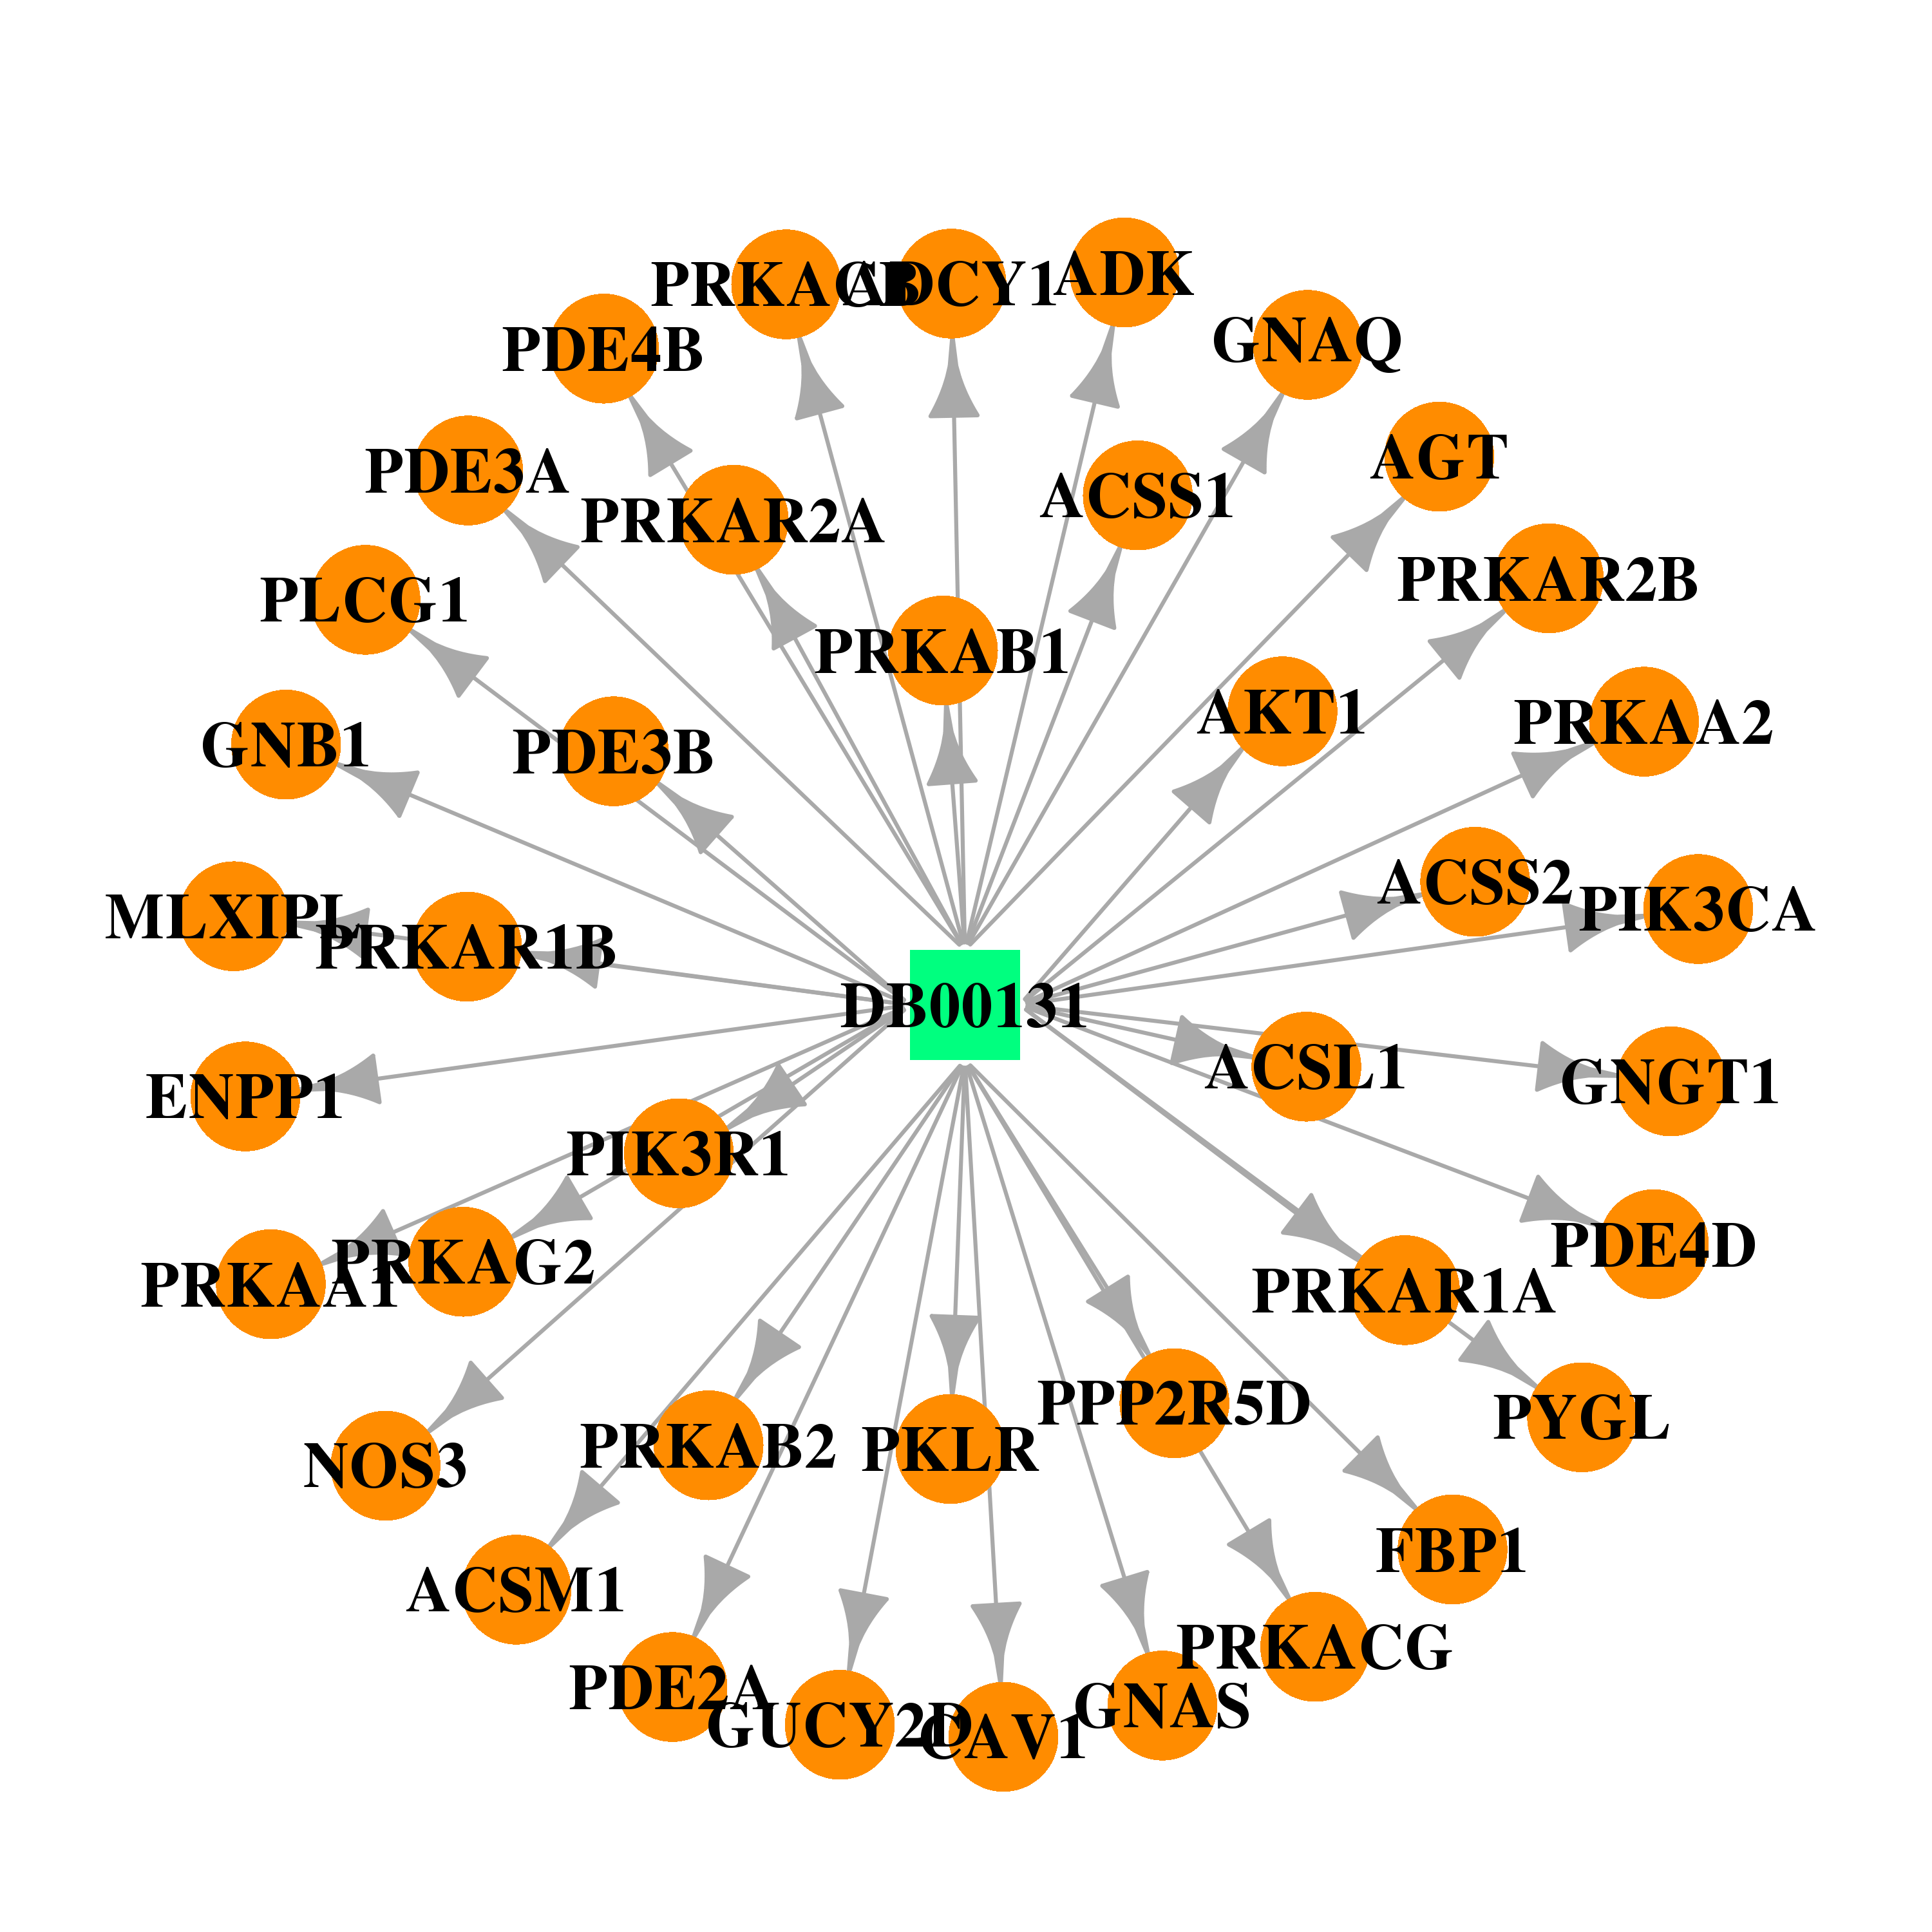 | 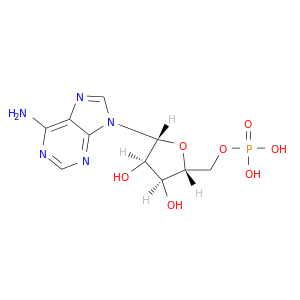 |
| DB00171 | acyl-CoA synthetase medium-chain family member 1 | approved; nutraceutical | Adenosine triphosphate |  |  |
| Top |
| Cross referenced IDs for ACSM1 |
| * We obtained these cross-references from Uniprot database. It covers 150 different DBs, 18 categories. http://www.uniprot.org/help/cross_references_section |
: Open all cross reference information
|
Copyright © 2016-Present - The Univsersity of Texas Health Science Center at Houston @ |