|
|||||||||||||||||||||||||||||||||||||||||||||||||||||||||||||||||||||||||||||||||||||||||||||||||||||||||||||||||||||||||||||||||||||||||||||||||||||||||||||||||||||||||||||||||||||||||||||||||||||||||||||||||||||||||||||||||||||||||||||||||||||||||||||||||||||||||||||||||||||||||||||||||||||||||||||||||||||||||||||||||||||||||||||||||||||||||
| |
| Phenotypic Information (metabolism pathway, cancer, disease, phenome) |
| |
| |
| Gene-Gene Network Information: Co-Expression Network, Interacting Genes & KEGG |
| |
|


| Gene Summary for GSTO2 |
| Basic gene info. | Gene symbol | GSTO2 |
| Gene name | glutathione S-transferase omega 2 | |
| Synonyms | GSTO 2-2|bA127L20.1 | |
| Cytomap | UCSC genome browser: 10q25.1 | |
| Genomic location | chr10 :106028630-106059176 | |
| Type of gene | protein-coding | |
| RefGenes | NM_001191013.1, NM_001191014.1,NM_001191015.1,NM_183239.1, | |
| Ensembl id | ENSG00000065621 | |
| Description | GSTO-2MMA(V) reductasebA127L20.1 (novel glutathione-S-transferase)glutathione S-transferase omega 2-2glutathione S-transferase omega-2glutathione-S-transferase-like proteinglutathione-dependent dehydroascorbate reductasemonomethylarsonic acid reduc | |
| Modification date | 20141207 | |
| dbXrefs | MIM : 612314 | |
| HGNC : HGNC | ||
| Ensembl : ENSG00000065621 | ||
| HPRD : 13614 | ||
| Protein | UniProt: go to UniProt's Cross Reference DB Table | |
| Expression | CleanEX: HS_GSTO2 | |
| BioGPS: 119391 | ||
| Gene Expression Atlas: ENSG00000065621 | ||
| The Human Protein Atlas: ENSG00000065621 | ||
| Pathway | NCI Pathway Interaction Database: GSTO2 | |
| KEGG: GSTO2 | ||
| REACTOME: GSTO2 | ||
| ConsensusPathDB | ||
| Pathway Commons: GSTO2 | ||
| Metabolism | MetaCyc: GSTO2 | |
| HUMANCyc: GSTO2 | ||
| Regulation | Ensembl's Regulation: ENSG00000065621 | |
| miRBase: chr10 :106,028,630-106,059,176 | ||
| TargetScan: NM_001191013 | ||
| cisRED: ENSG00000065621 | ||
| Context | iHOP: GSTO2 | |
| cancer metabolism search in PubMed: GSTO2 | ||
| UCL Cancer Institute: GSTO2 | ||
| Assigned class in ccmGDB | C | |
| Top |
| Phenotypic Information for GSTO2(metabolism pathway, cancer, disease, phenome) |
| Cancer | CGAP: GSTO2 |
| Familial Cancer Database: GSTO2 | |
| * This gene is included in those cancer gene databases. |
|
|
|
|
|
|
| |||||||||||||||||||||||||||||||||||||||||||||||||||||||||||||||||||||||||||||||||||||||||||||||||||||||||||||||||||||||||||||||||||||||||||||||||||||||||||||||||||||||||||||||||||||||||||||||||||||||||||||||||||||||||||||||||||||||||||||||||||||||||||||||||||||||||||||||||||||||||||||||||||||||||||||||||||||||||||||||||||||||||||||||||||
Oncogene 1 | Significant driver gene in | ||||||||||||||||||||||||||||||||||||||||||||||||||||||||||||||||||||||||||||||||||||||||||||||||||||||||||||||||||||||||||||||||||||||||||||||||||||||||||||||||||||||||||||||||||||||||||||||||||||||||||||||||||||||||||||||||||||||||||||||||||||||||||||||||||||||||||||||||||||||||||||||||||||||||||||||||||||||||||||||||||||||||||||||||||||||||
| cf) number; DB name 1 Oncogene; http://nar.oxfordjournals.org/content/35/suppl_1/D721.long, 2 Tumor Suppressor gene; https://bioinfo.uth.edu/TSGene/, 3 Cancer Gene Census; http://www.nature.com/nrc/journal/v4/n3/abs/nrc1299.html, 4 CancerGenes; http://nar.oxfordjournals.org/content/35/suppl_1/D721.long, 5 Network of Cancer Gene; http://ncg.kcl.ac.uk/index.php, 1Therapeutic Vulnerabilities in Cancer; http://cbio.mskcc.org/cancergenomics/statius/ |
| KEGG_GLUTATHIONE_METABOLISM KEGG_METABOLISM_OF_XENOBIOTICS_BY_CYTOCHROME_P450 KEGG_DRUG_METABOLISM_CYTOCHROME_P450 REACTOME_METABOLISM_OF_VITAMINS_AND_COFACTORS | |
| OMIM | |
| Orphanet | |
| Disease | KEGG Disease: GSTO2 |
| MedGen: GSTO2 (Human Medical Genetics with Condition) | |
| ClinVar: GSTO2 | |
| Phenotype | MGI: GSTO2 (International Mouse Phenotyping Consortium) |
| PhenomicDB: GSTO2 | |
| Mutations for GSTO2 |
| * Under tables are showing count per each tissue to give us broad intuition about tissue specific mutation patterns.You can go to the detailed page for each mutation database's web site. |
| There's no structural variation information in COSMIC data for this gene. |
| * From mRNA Sanger sequences, Chitars2.0 arranged chimeric transcripts. This table shows GSTO2 related fusion information. |
| ID | Head Gene | Tail Gene | Accession | Gene_a | qStart_a | qEnd_a | Chromosome_a | tStart_a | tEnd_a | Gene_a | qStart_a | qEnd_a | Chromosome_a | tStart_a | tEnd_a |
| BE771867 | GSTO2 | 14 | 49 | 10 | 106059051 | 106059086 | GSTO2 | 49 | 244 | 10 | 106058886 | 106059081 | |
| BQ369613 | ZFAT | 9 | 232 | 8 | 135627327 | 135627551 | GSTO2 | 233 | 254 | 10 | 106046882 | 106046903 | |
| Top |
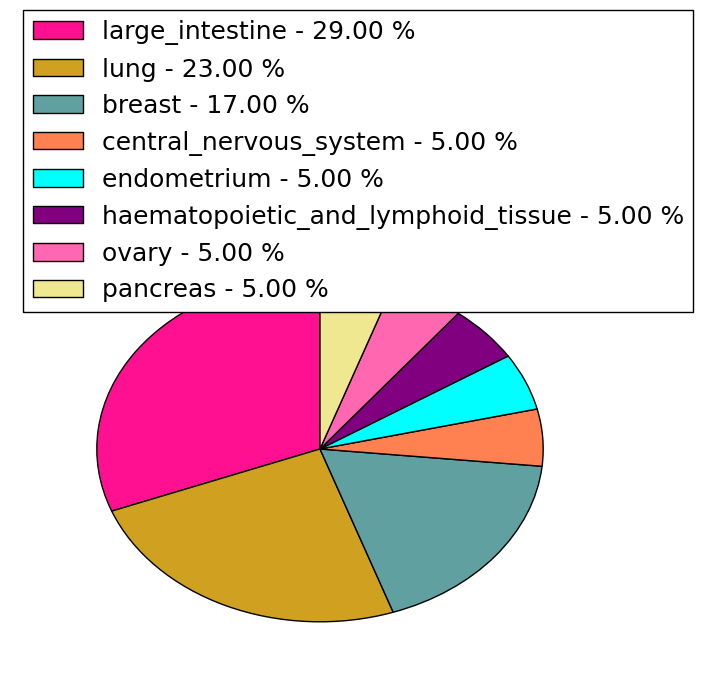
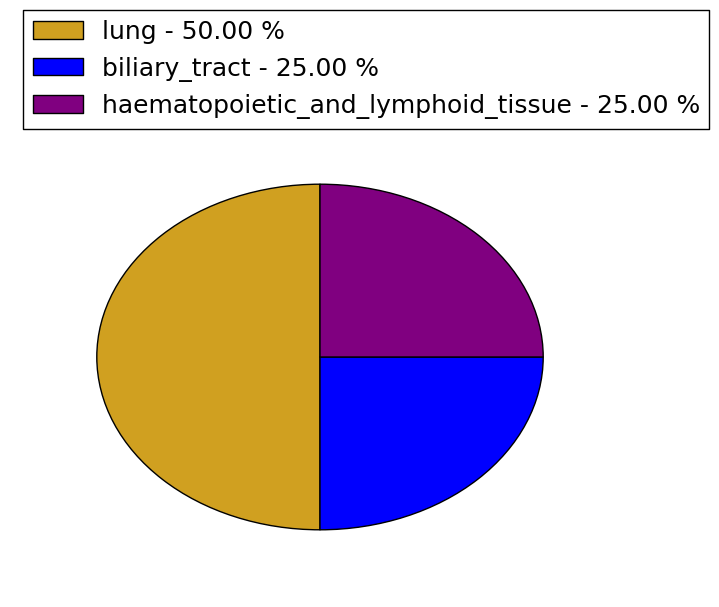
| Mutation type/ Tissue ID | brca | cns | cerv | endome | haematopo | kidn | Lintest | liver | lung | ns | ovary | pancre | prost | skin | stoma | thyro | urina | |||
| Total # sample | 1 | 2 | ||||||||||||||||||
| GAIN (# sample) | 1 | |||||||||||||||||||
| LOSS (# sample) | 2 |
| cf) Tissue ID; Tissue type (1; Breast, 2; Central_nervous_system, 3; Cervix, 4; Endometrium, 5; Haematopoietic_and_lymphoid_tissue, 6; Kidney, 7; Large_intestine, 8; Liver, 9; Lung, 10; NS, 11; Ovary, 12; Pancreas, 13; Prostate, 14; Skin, 15; Stomach, 16; Thyroid, 17; Urinary_tract) |
| Top |
|
 |
| Top |
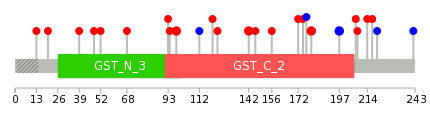
| Stat. for Non-Synonymous SNVs (# total SNVs=17) | (# total SNVs=4) |
 |  |
(# total SNVs=0) | (# total SNVs=0) |
| Top |
| * When you move the cursor on each content, you can see more deailed mutation information on the Tooltip. Those are primary_site,primary_histology,mutation(aa),pubmedID. |
| GRCh37 position | Mutation(aa) | Unique sampleID count |
| chr10:106039209-106039209 | p.E150* | 2 |
| chr10:106037800-106037800 | p.P98S | 2 |
| chr10:106057406-106057406 | p.P180L | 2 |
| chr10:106058901-106058901 | p.T197T | 2 |
| chr10:106039185-106039185 | p.N142D | 2 |
| chr10:106037663-106037663 | p.V52G | 1 |
| chr10:106039197-106039197 | p.A146T | 1 |
| chr10:106058959-106058959 | p.L217I | 1 |
| chr10:106037710-106037710 | p.P68A | 1 |
| chr10:106058970-106058970 | p.K220K | 1 |
| Top |
|
 |
| Point Mutation/ Tissue ID | 1 | 2 | 3 | 4 | 5 | 6 | 7 | 8 | 9 | 10 | 11 | 12 | 13 | 14 | 15 | 16 | 17 | 18 | 19 | 20 |
| # sample | 2 | 2 | 3 | 1 | 4 | 1 | ||||||||||||||
| # mutation | 2 | 2 | 3 | 1 | 4 | 1 | ||||||||||||||
| nonsynonymous SNV | 2 | 2 | 2 | 1 | 3 | 1 | ||||||||||||||
| synonymous SNV | 1 | 1 |
| cf) Tissue ID; Tissue type (1; BLCA[Bladder Urothelial Carcinoma], 2; BRCA[Breast invasive carcinoma], 3; CESC[Cervical squamous cell carcinoma and endocervical adenocarcinoma], 4; COAD[Colon adenocarcinoma], 5; GBM[Glioblastoma multiforme], 6; Glioma Low Grade, 7; HNSC[Head and Neck squamous cell carcinoma], 8; KICH[Kidney Chromophobe], 9; KIRC[Kidney renal clear cell carcinoma], 10; KIRP[Kidney renal papillary cell carcinoma], 11; LAML[Acute Myeloid Leukemia], 12; LUAD[Lung adenocarcinoma], 13; LUSC[Lung squamous cell carcinoma], 14; OV[Ovarian serous cystadenocarcinoma ], 15; PAAD[Pancreatic adenocarcinoma], 16; PRAD[Prostate adenocarcinoma], 17; SKCM[Skin Cutaneous Melanoma], 18:STAD[Stomach adenocarcinoma], 19:THCA[Thyroid carcinoma], 20:UCEC[Uterine Corpus Endometrial Carcinoma]) |
| Top |
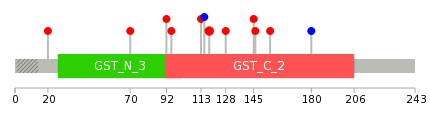
| * We represented just top 10 SNVs. When you move the cursor on each content, you can see more deailed mutation information on the Tooltip. Those are primary_site, primary_histology, mutation(aa), pubmedID. |
| Genomic Position | Mutation(aa) | Unique sampleID count |
| chr10:106057406 | p.P118L,GSTO2 | 2 |
| chr10:106039228 | p.P70S,GSTO2 | 1 |
| chr10:106057391 | p.F92I,GSTO2 | 1 |
| chr10:106057398 | p.V95A,GSTO2 | 1 |
| chr10:106058929 | p.E128V,GSTO2 | 1 |
| chr10:106058933 | p.D113G,GSTO2 | 1 |
| chr10:106058959 | p.L115L,GSTO2 | 1 |
| chr10:106035092 | p.M145L,GSTO2 | 1 |
| chr10:106059034 | p.K146T,GSTO2 | 1 |
| chr10:106037800 | p.L155I,GSTO2 | 1 |
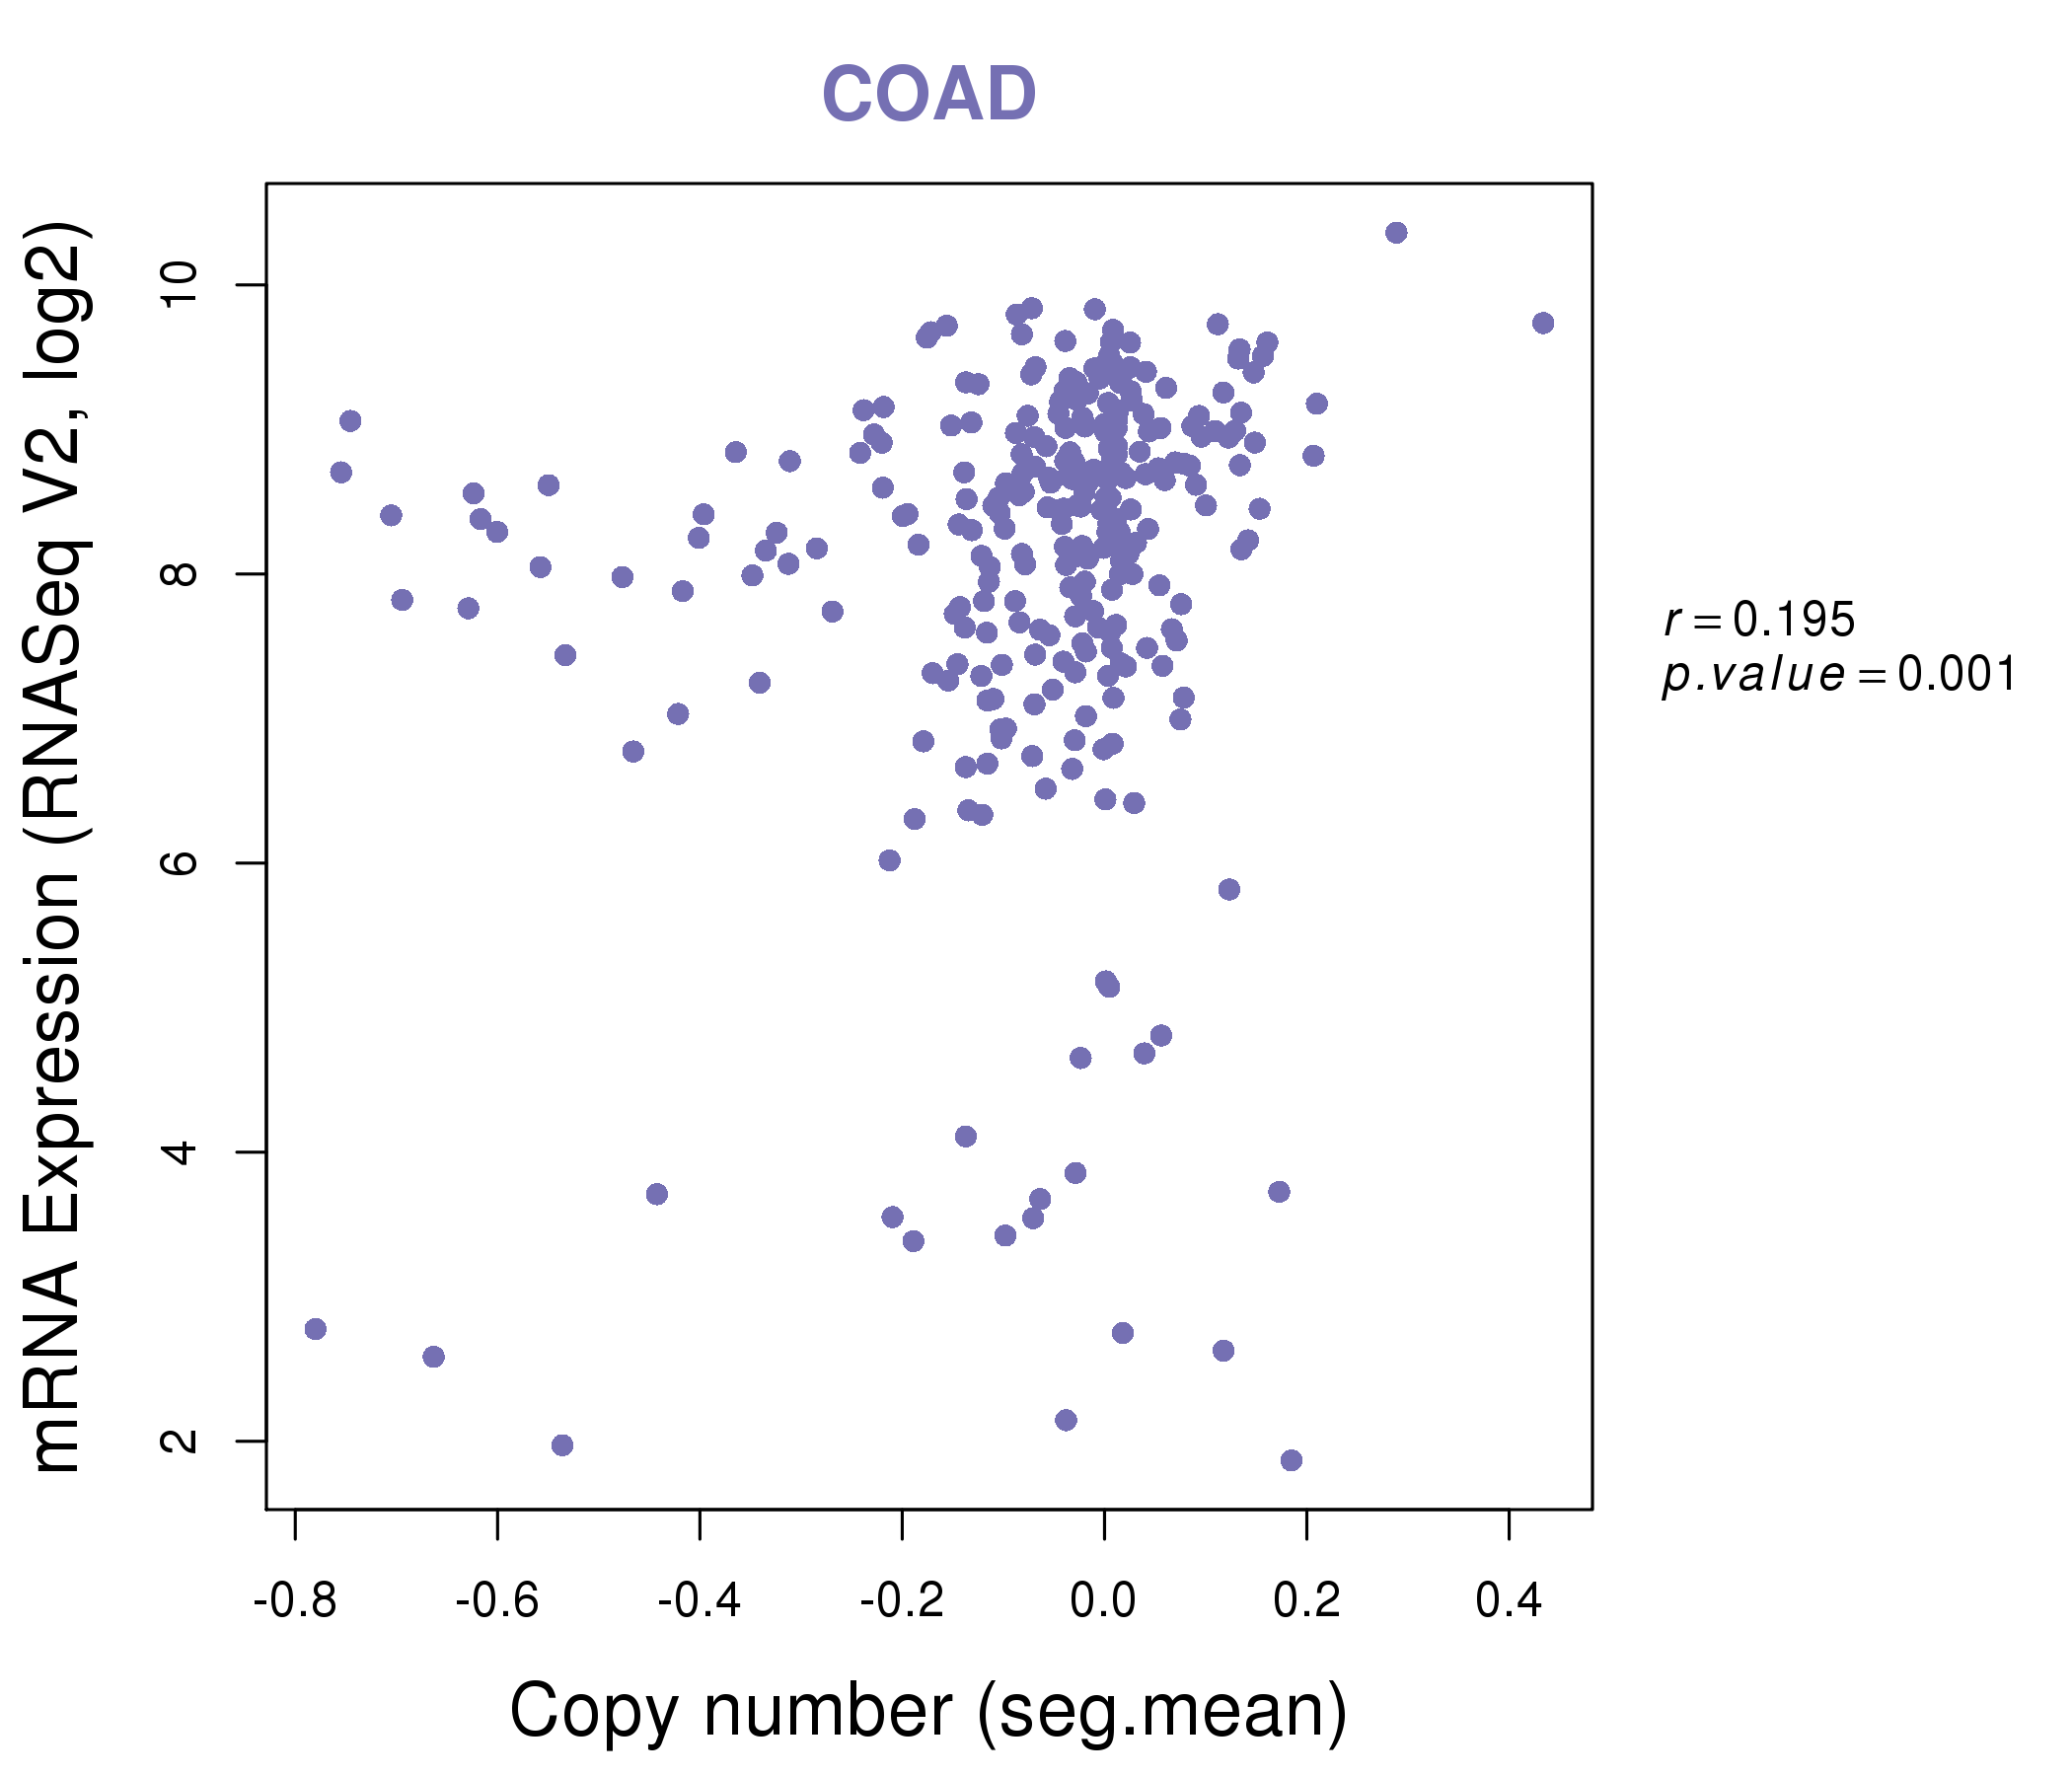
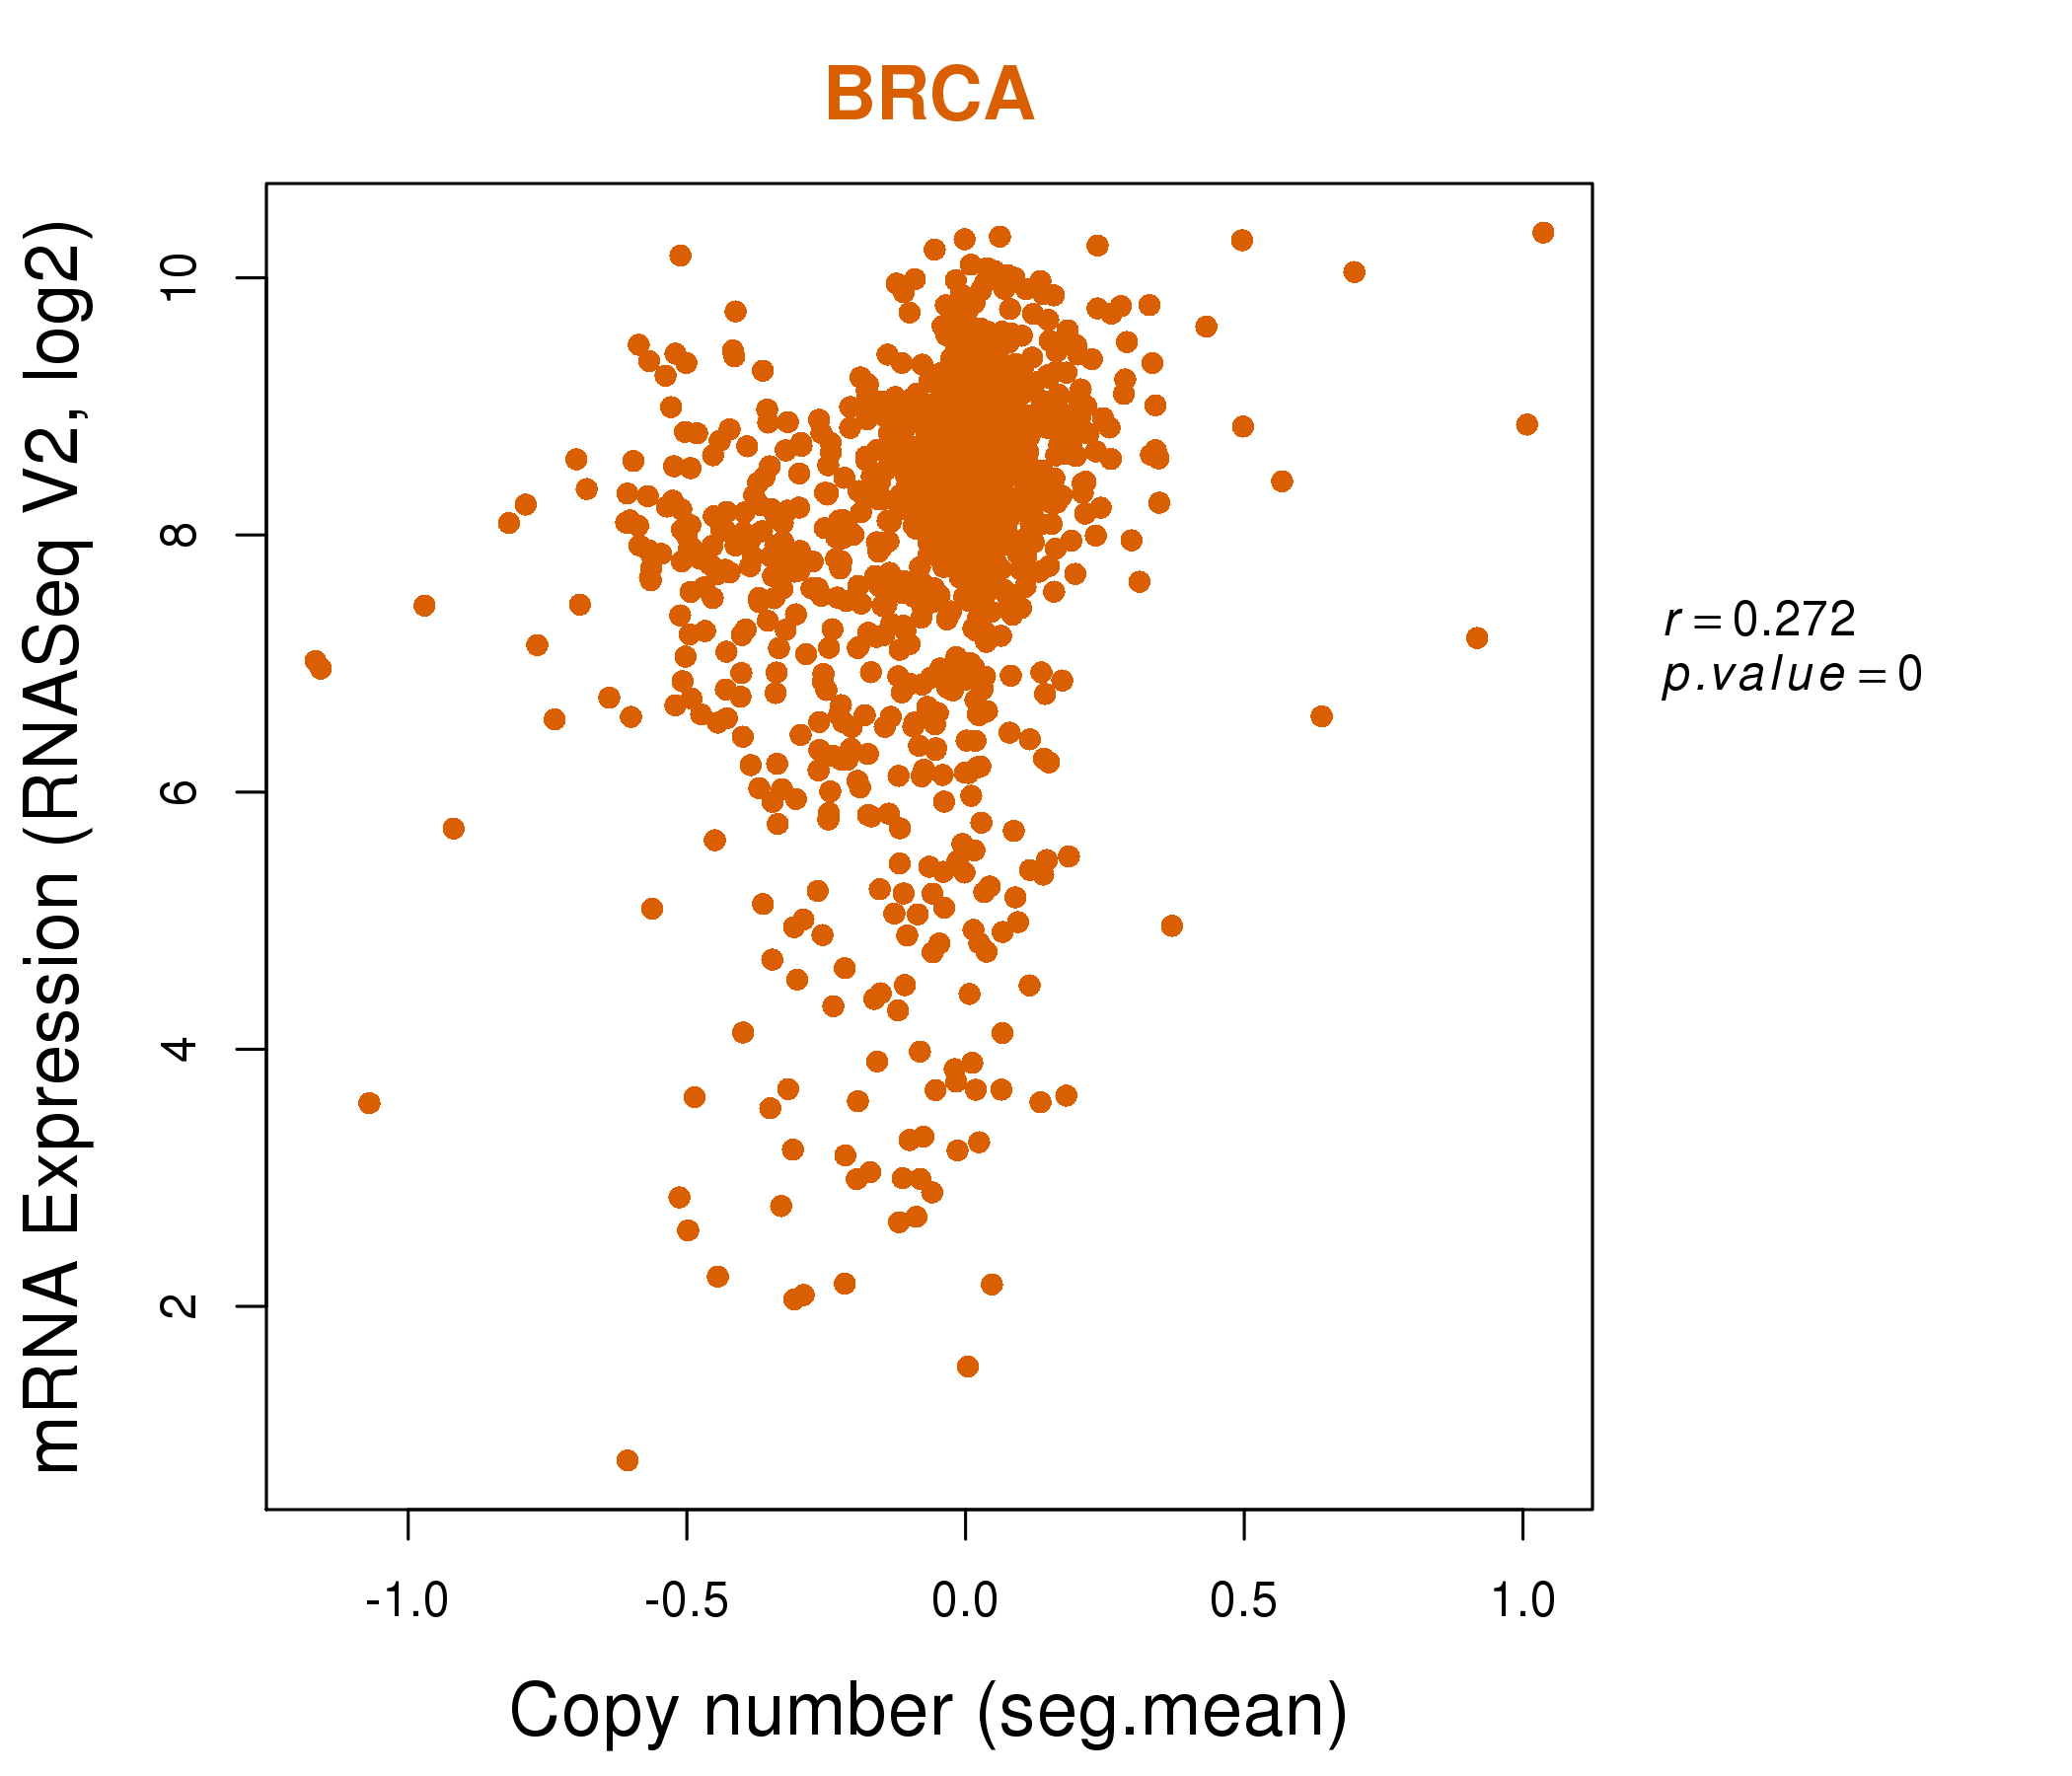
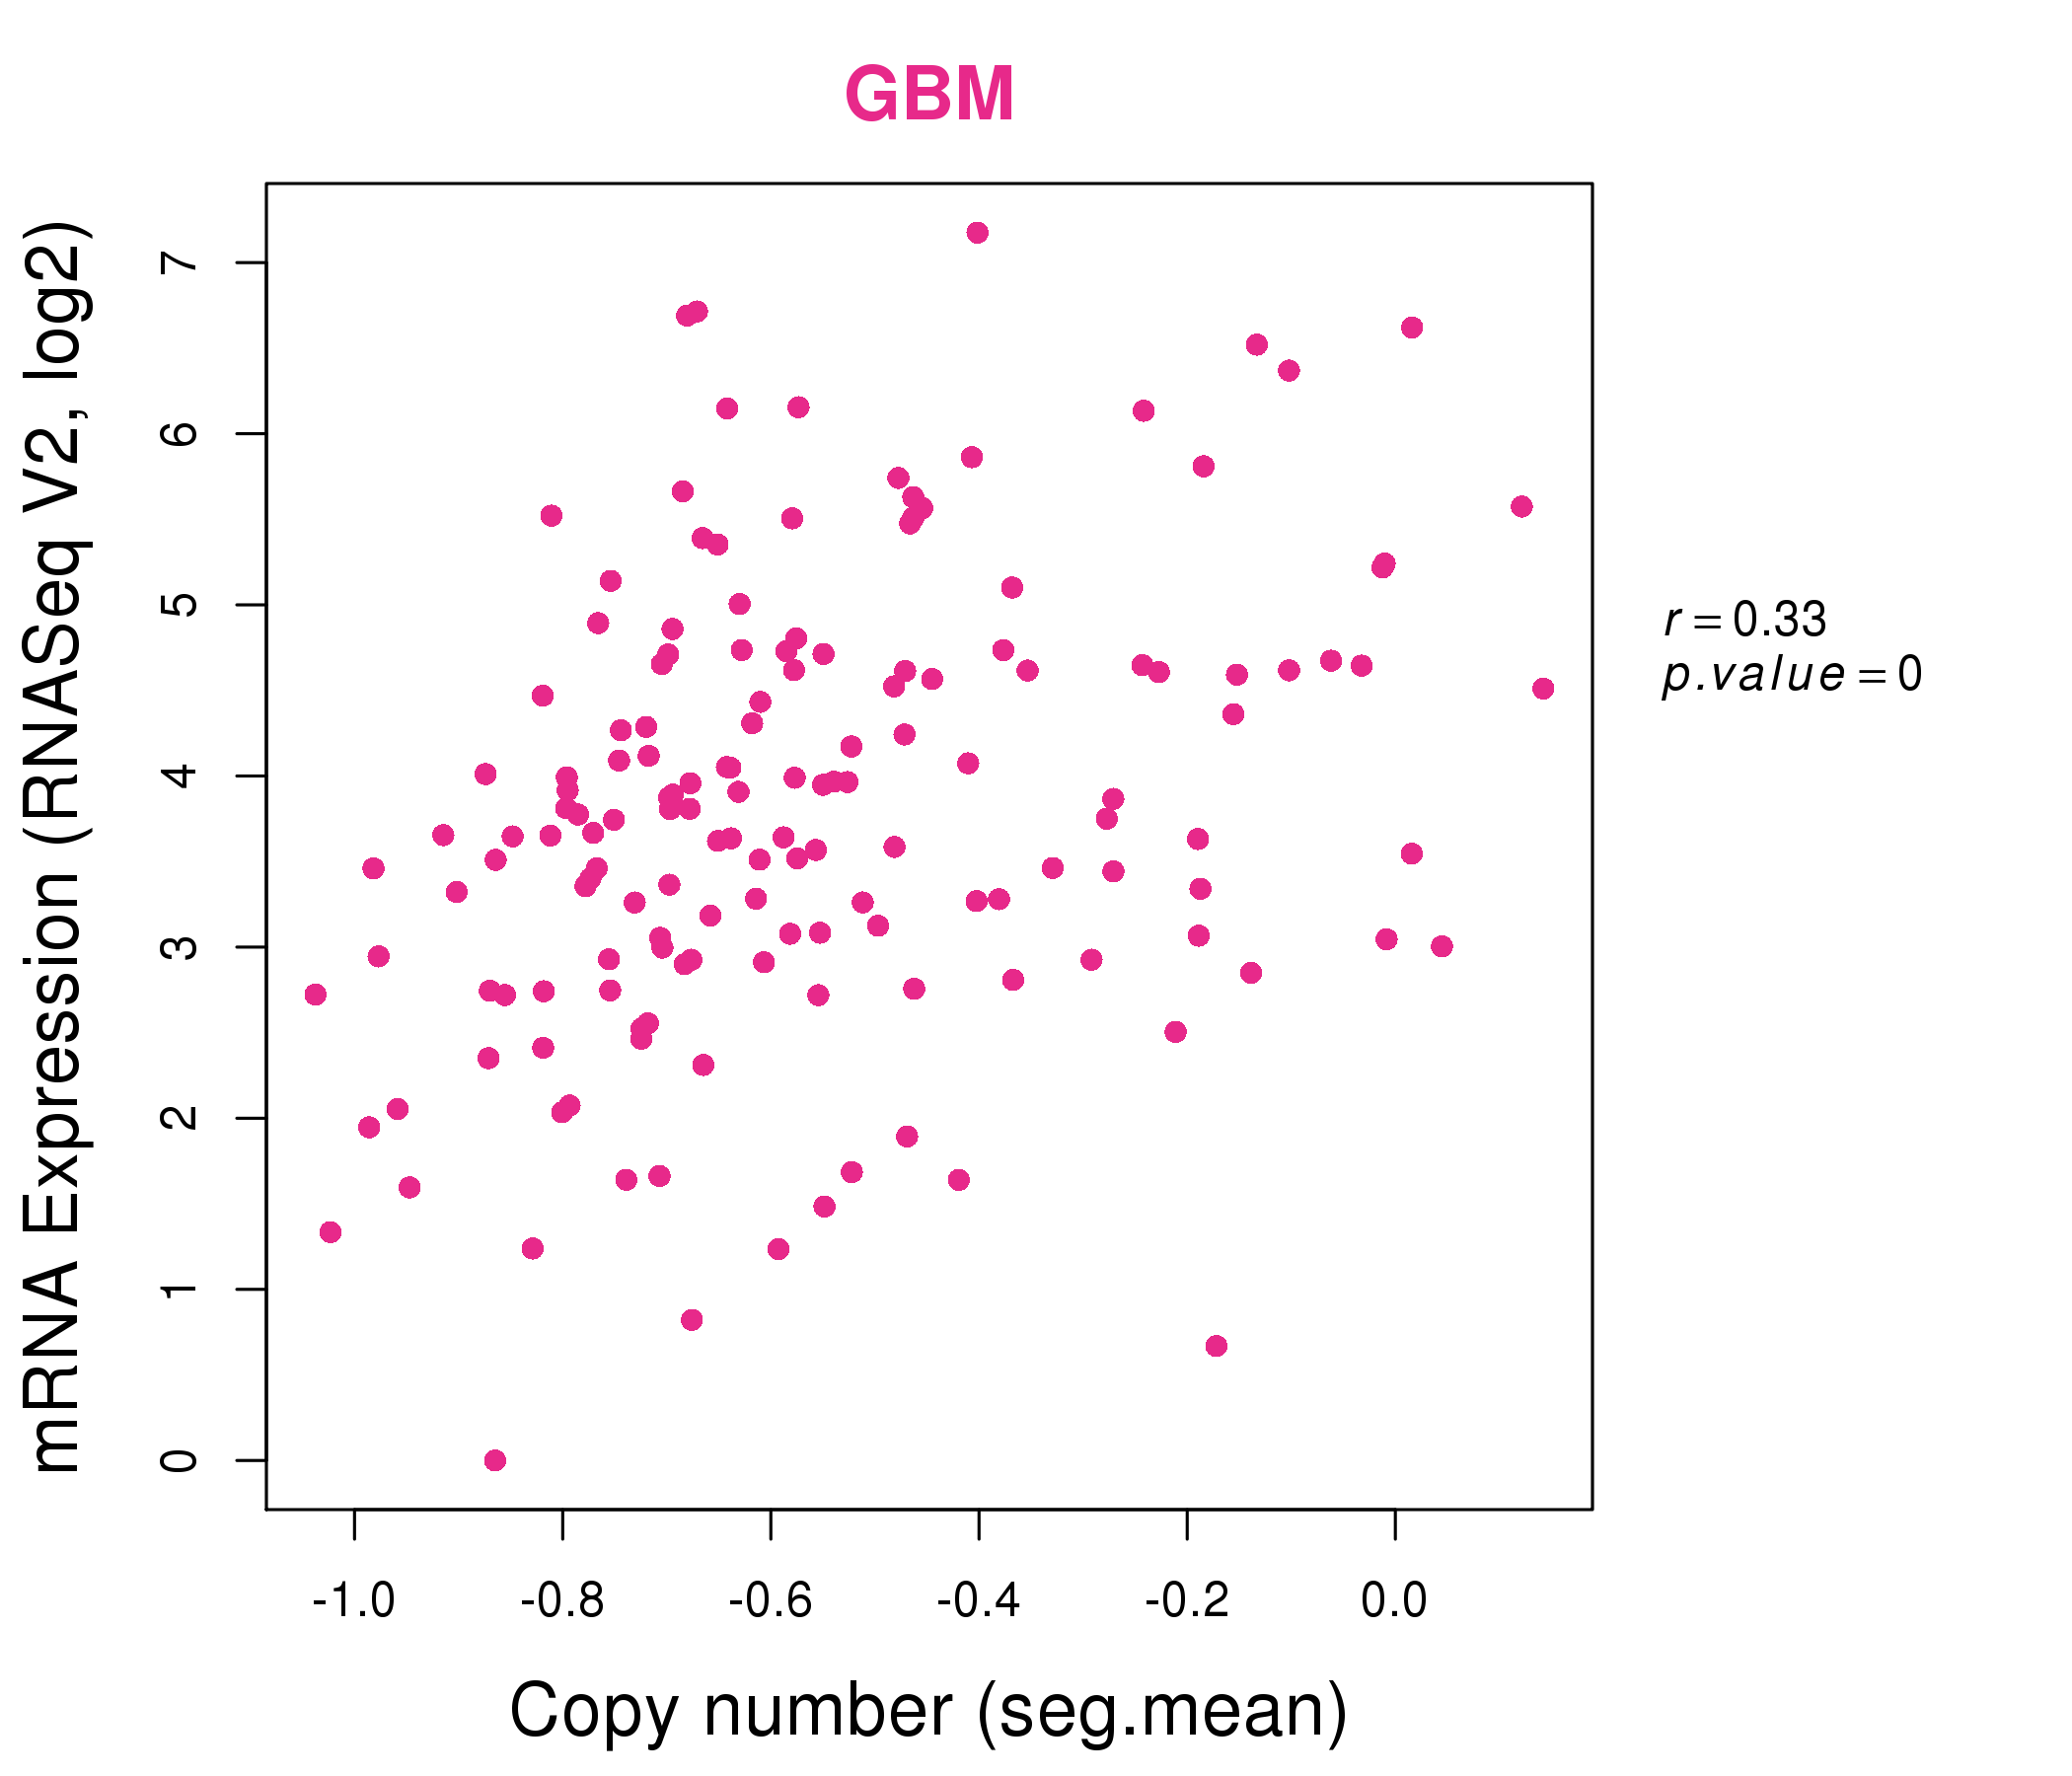
| * Copy number data were extracted from TCGA using R package TCGA-Assembler. The URLs of all public data files on TCGA DCC data server were gathered on Jan-05-2015. Function ProcessCNAData in TCGA-Assembler package was used to obtain gene-level copy number value which is calculated as the average copy number of the genomic region of a gene. |
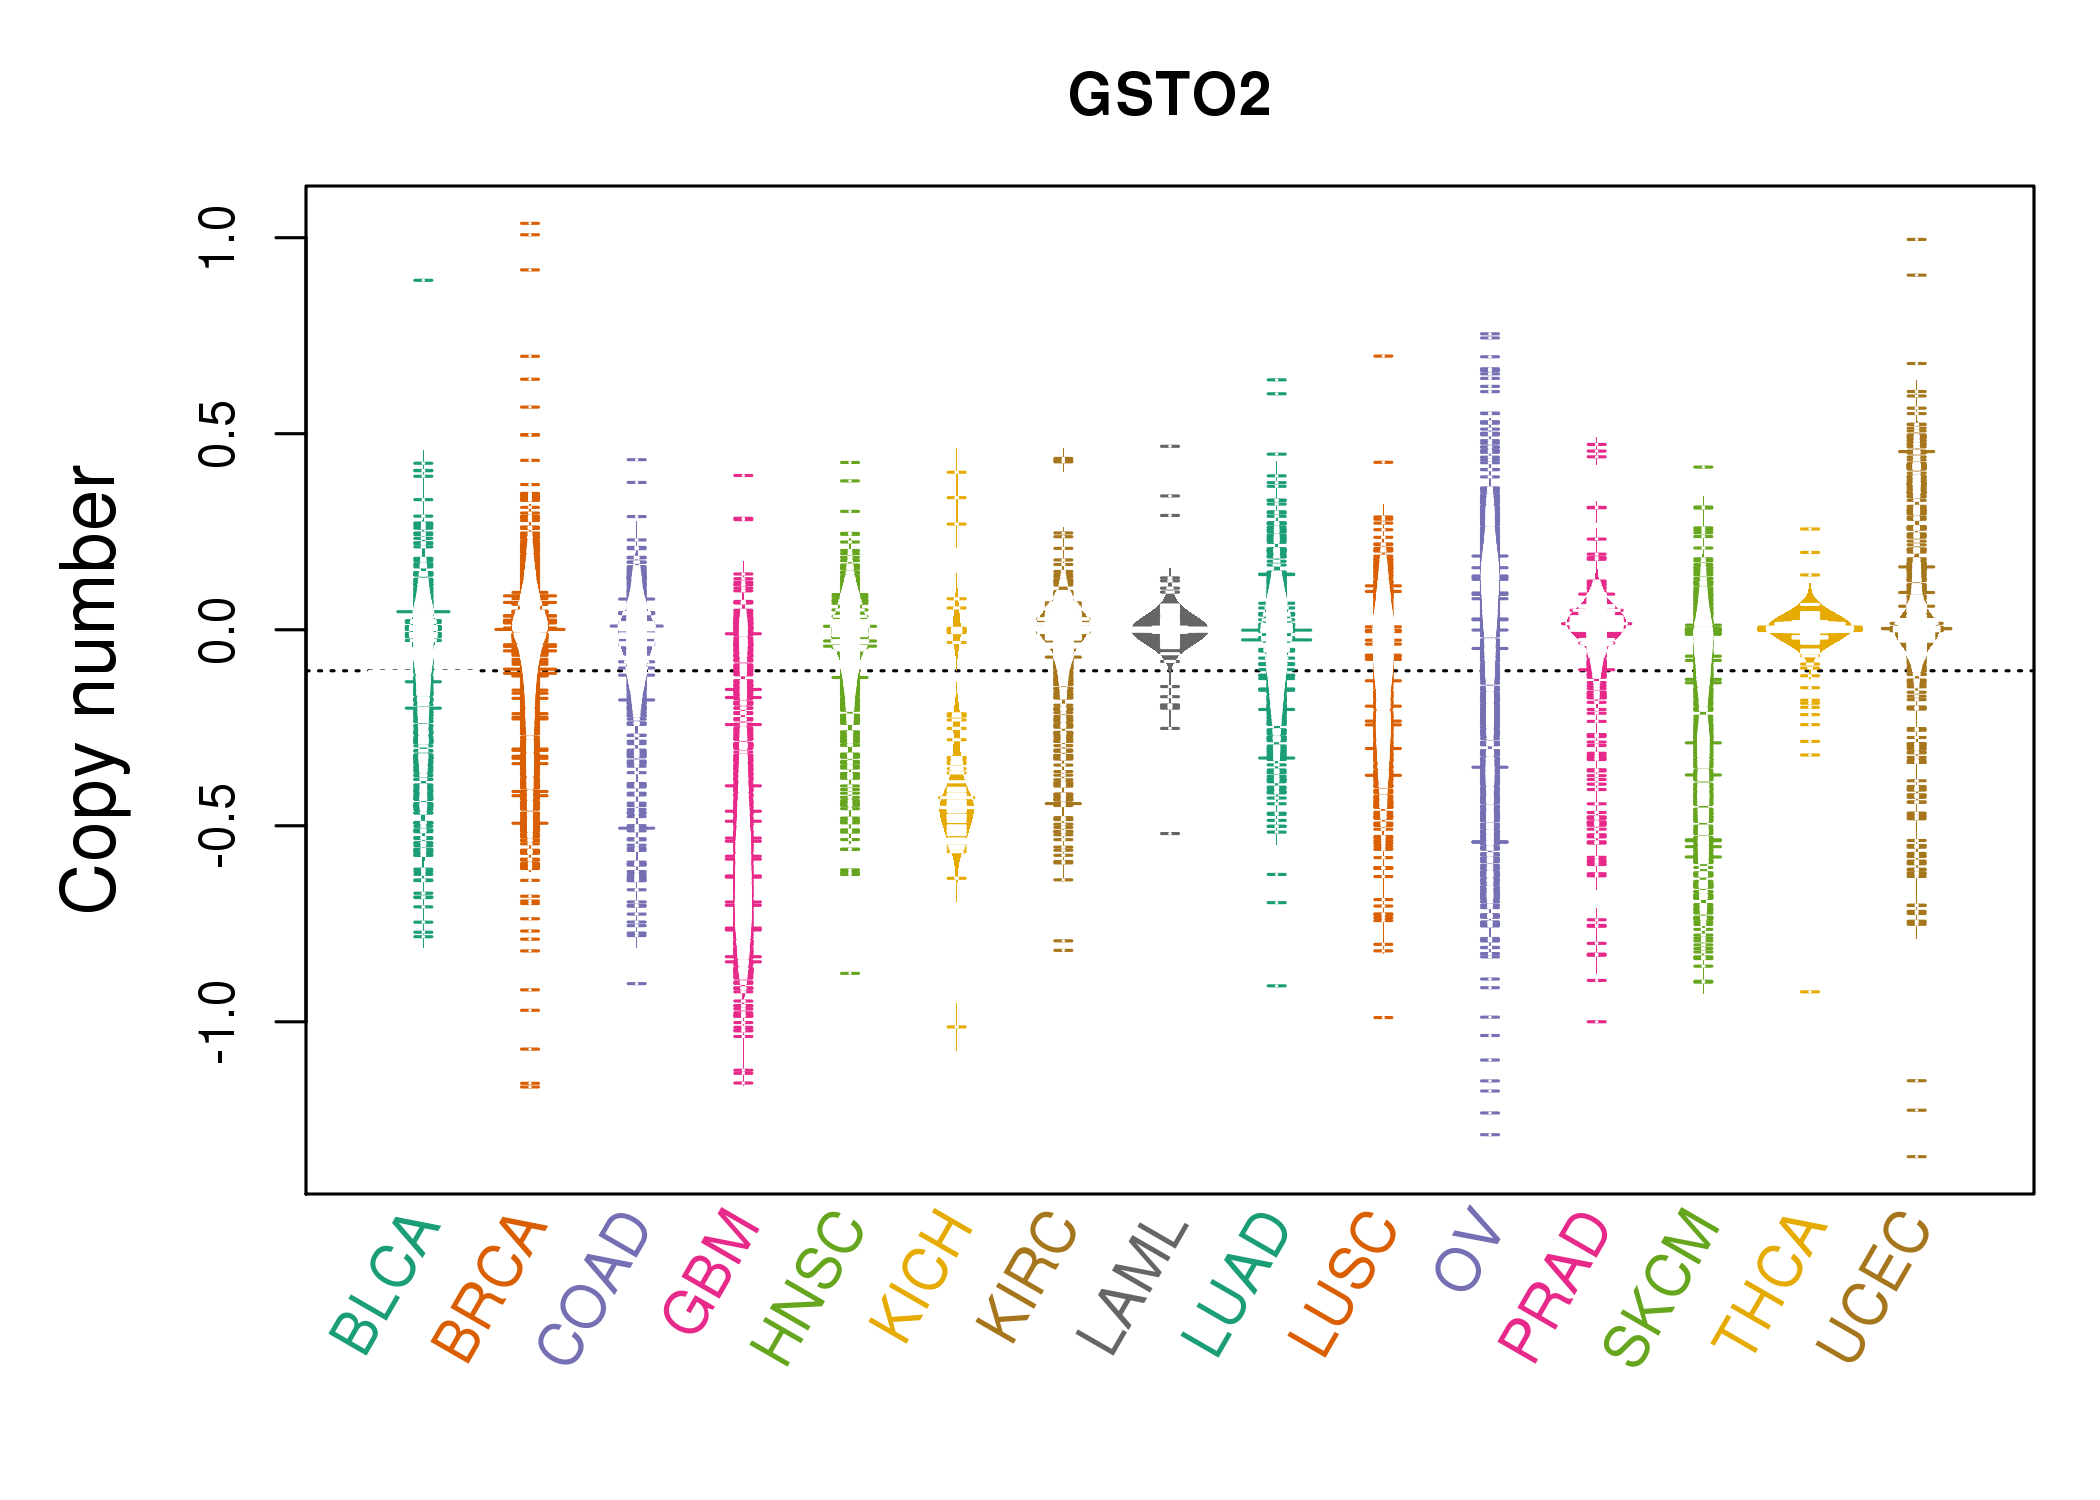 |
| cf) Tissue ID[Tissue type]: BLCA[Bladder Urothelial Carcinoma], BRCA[Breast invasive carcinoma], CESC[Cervical squamous cell carcinoma and endocervical adenocarcinoma], COAD[Colon adenocarcinoma], GBM[Glioblastoma multiforme], Glioma Low Grade, HNSC[Head and Neck squamous cell carcinoma], KICH[Kidney Chromophobe], KIRC[Kidney renal clear cell carcinoma], KIRP[Kidney renal papillary cell carcinoma], LAML[Acute Myeloid Leukemia], LUAD[Lung adenocarcinoma], LUSC[Lung squamous cell carcinoma], OV[Ovarian serous cystadenocarcinoma ], PAAD[Pancreatic adenocarcinoma], PRAD[Prostate adenocarcinoma], SKCM[Skin Cutaneous Melanoma], STAD[Stomach adenocarcinoma], THCA[Thyroid carcinoma], UCEC[Uterine Corpus Endometrial Carcinoma] |
| Top |
| Gene Expression for GSTO2 |
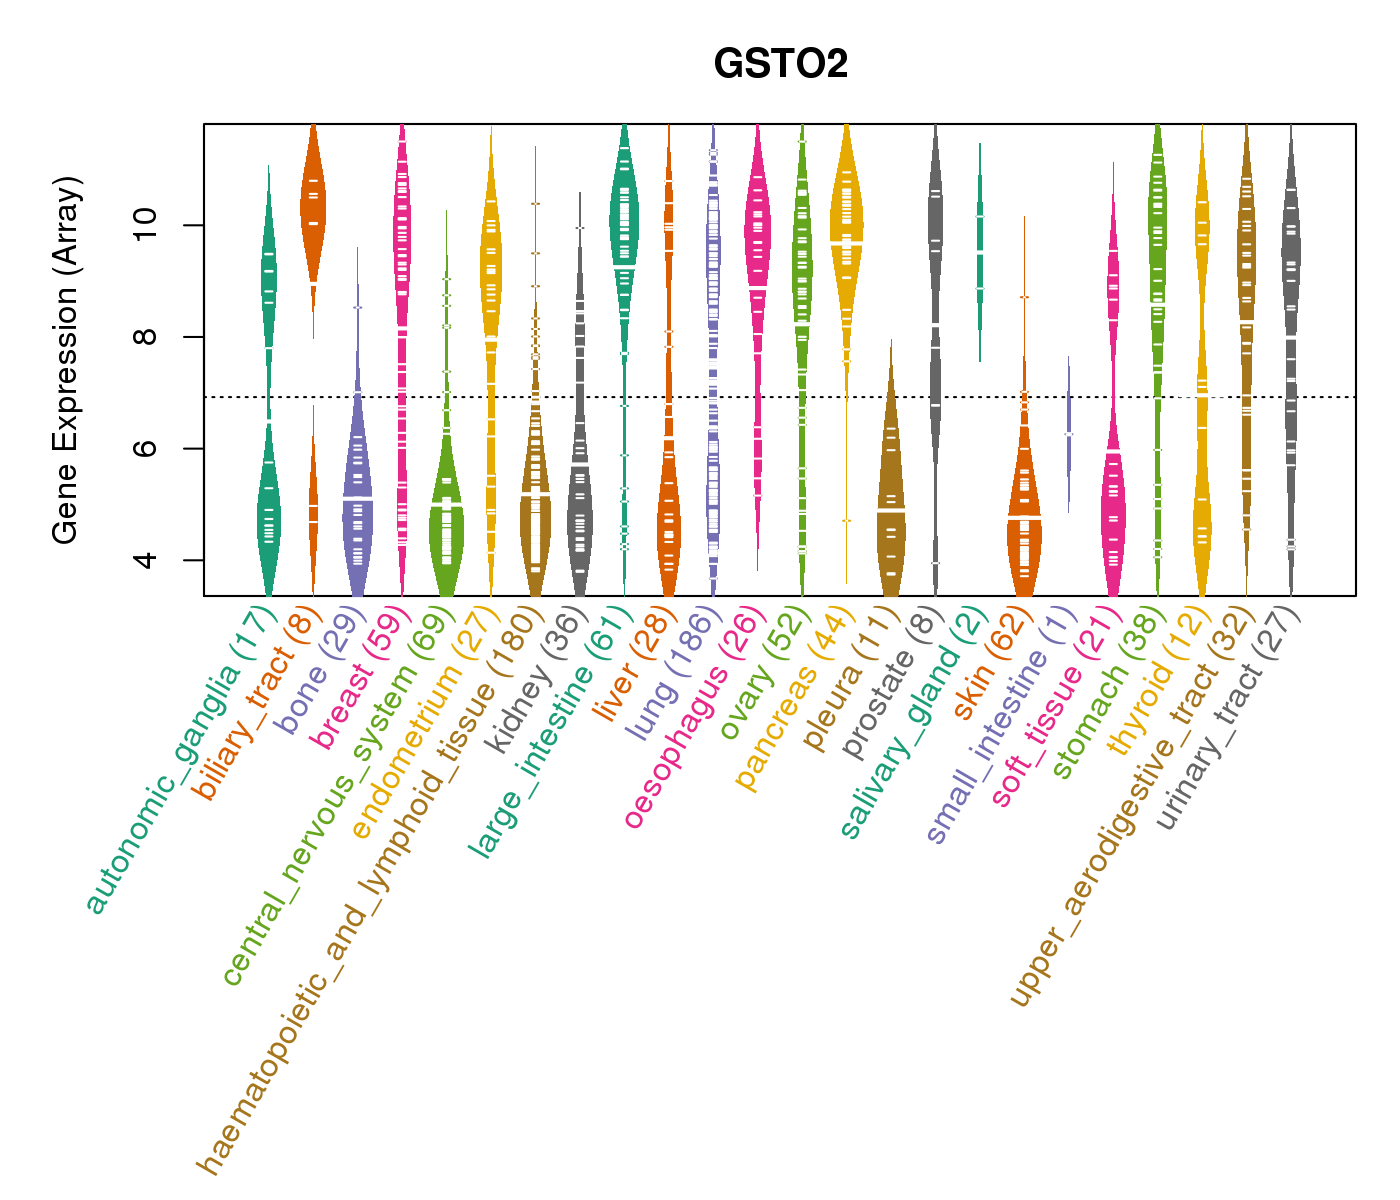
| * CCLE gene expression data were extracted from CCLE_Expression_Entrez_2012-10-18.res: Gene-centric RMA-normalized mRNA expression data. |
 |
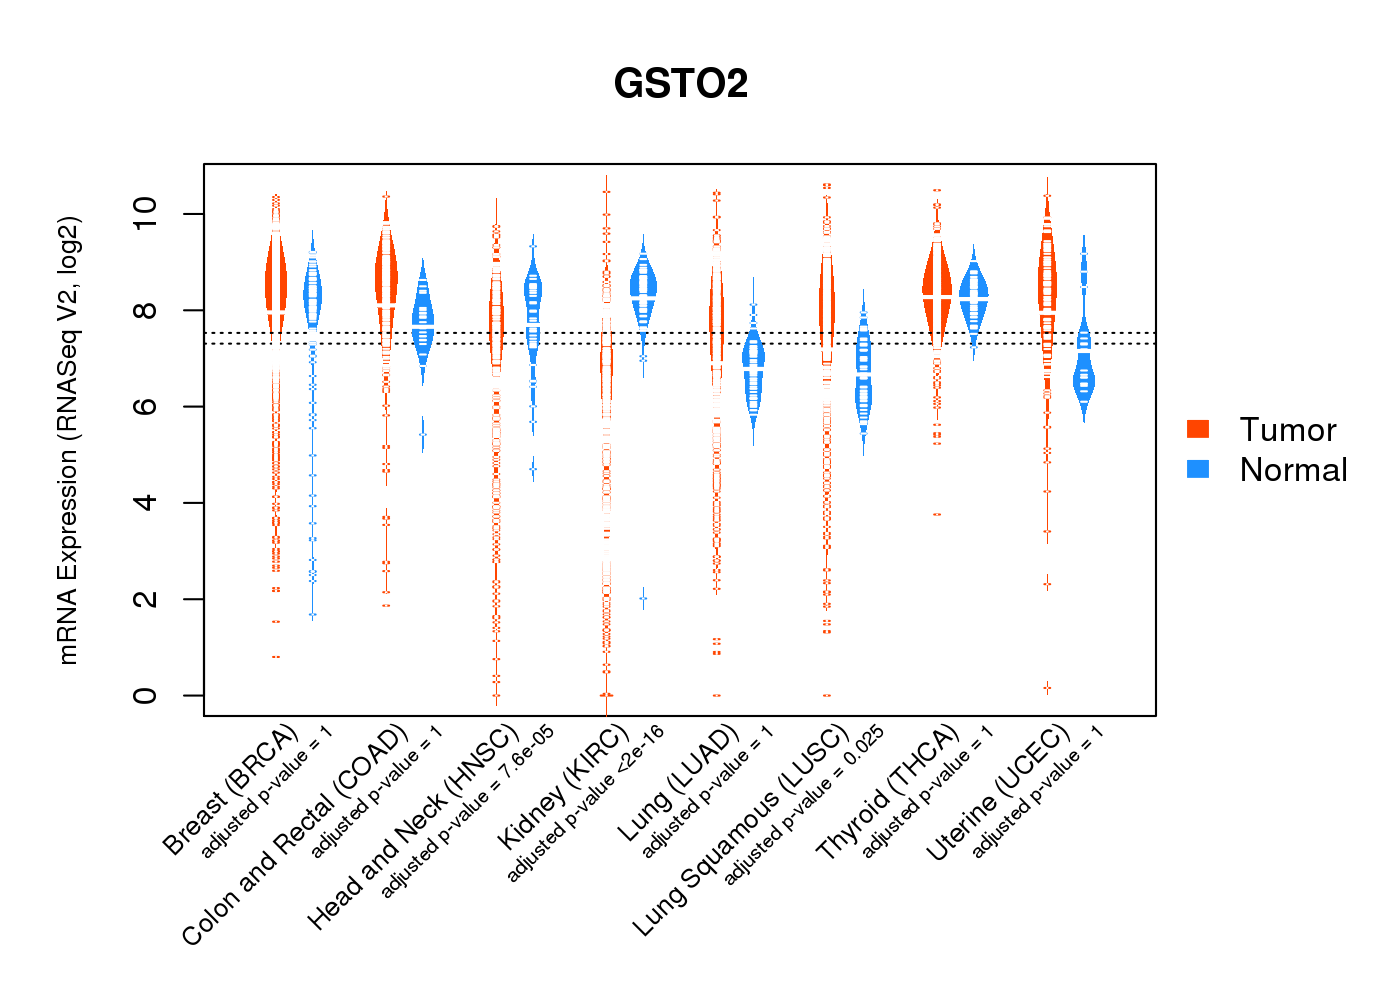
| * Normalized gene expression data of RNASeqV2 was extracted from TCGA using R package TCGA-Assembler. The URLs of all public data files on TCGA DCC data server were gathered at Jan-05-2015. Only eight cancer types have enough normal control samples for differential expression analysis. (t test, adjusted p<0.05 (using Benjamini-Hochberg FDR)) |
 |
| Top |
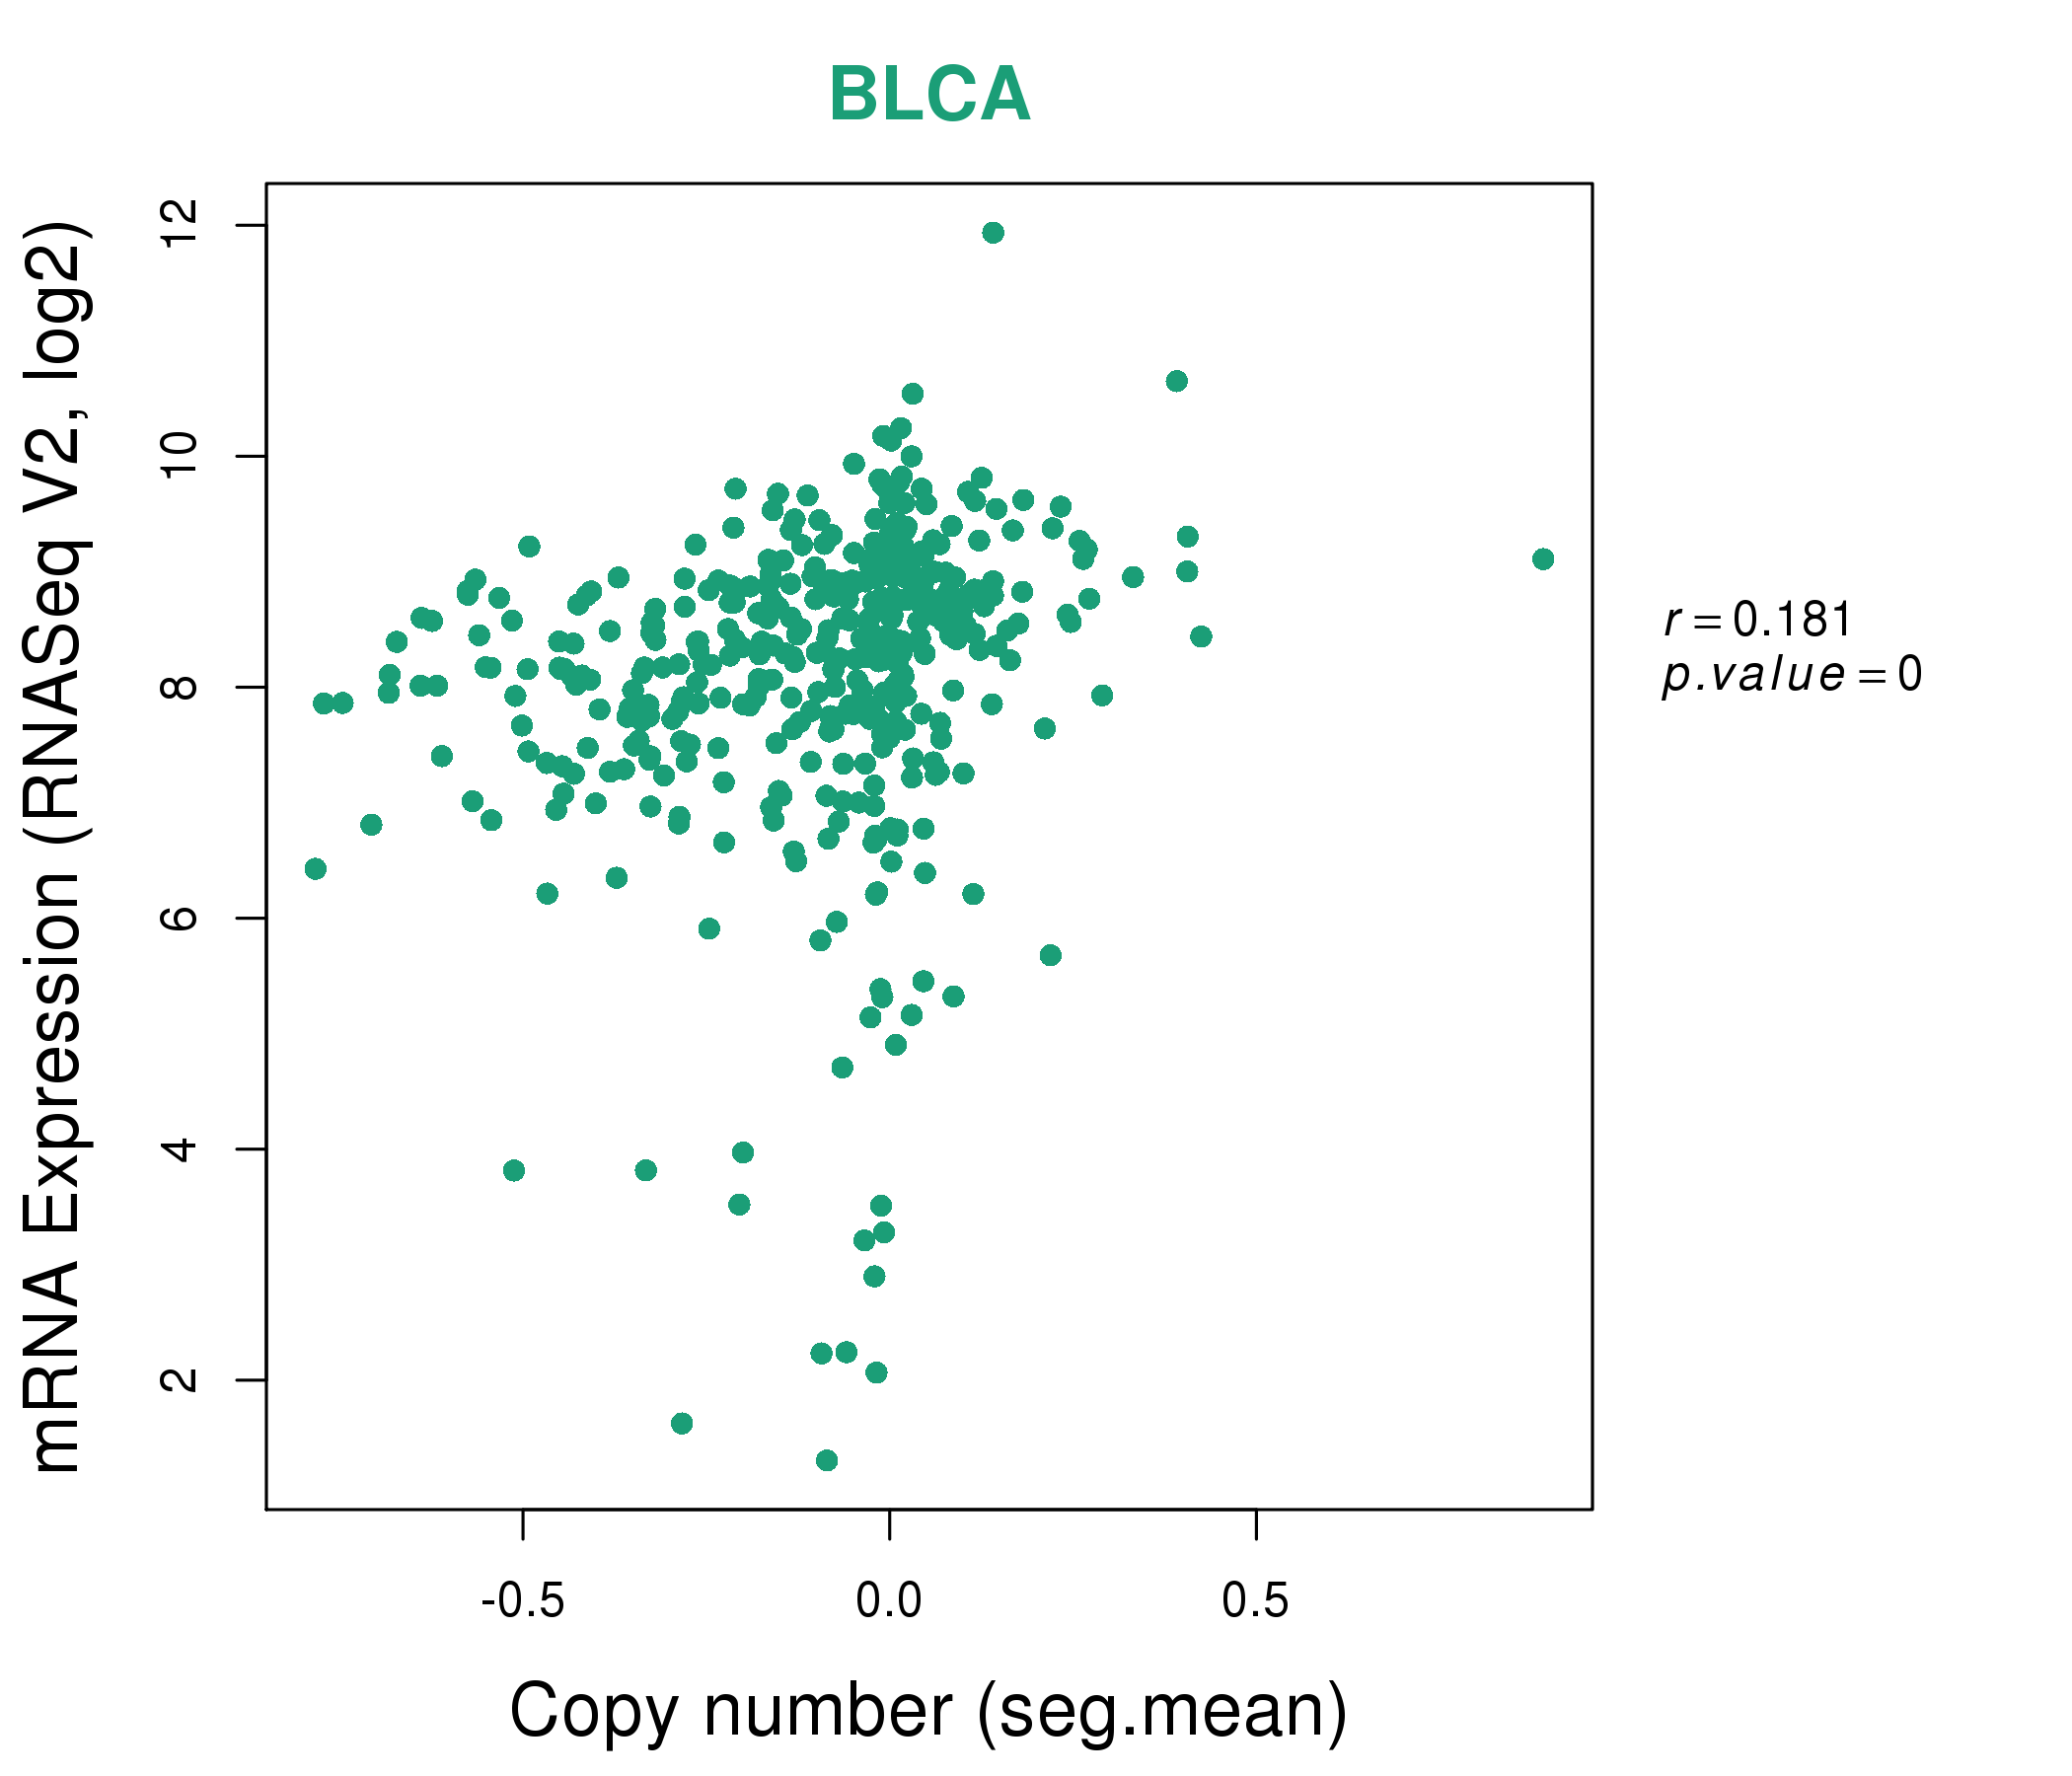
| * This plots show the correlation between CNV and gene expression. |
: Open all plots for all cancer types
 |
|
 |
|
| Top |
| Gene-Gene Network Information |
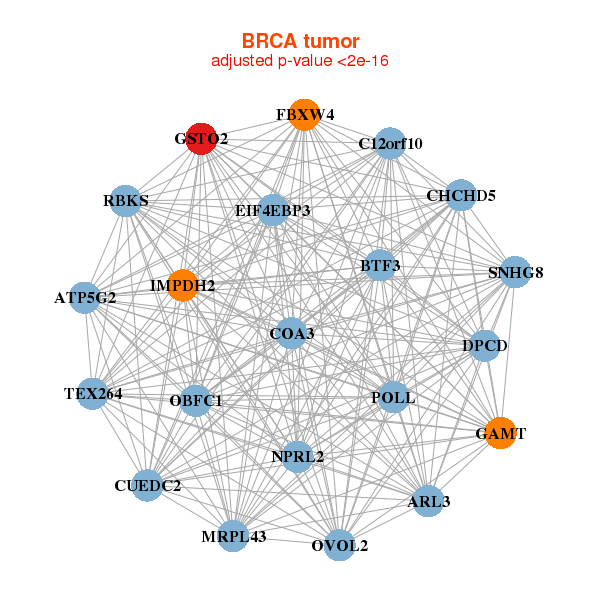
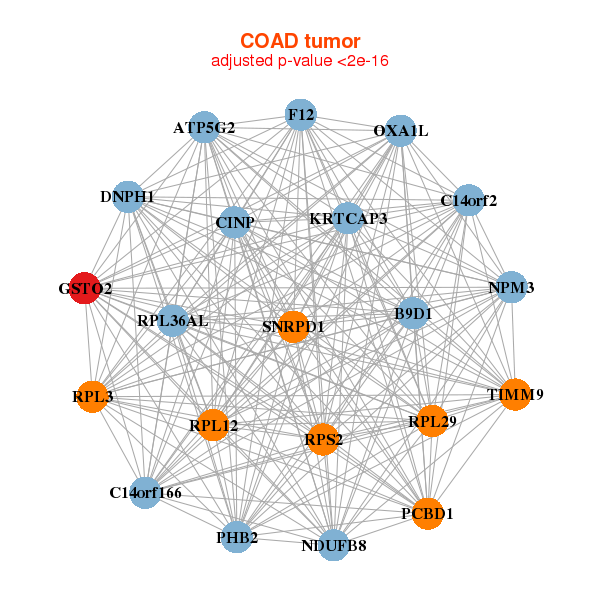
| * Co-Expression network figures were drawn using R package igraph. Only the top 20 genes with the highest correlations were shown. Red circle: input gene, orange circle: cell metabolism gene, sky circle: other gene |
: Open all plots for all cancer types
 |
| ||||
| ARL3,ATP5G2,BTF3,C12orf10,COA3,CHCHD5,CUEDC2, DPCD,EIF4EBP3,FBXW4,GAMT,GSTO2,IMPDH2,MRPL43, NPRL2,OBFC1,OVOL2,POLL,RBKS,SNHG8,TEX264 | BSPRY,RHNO1,VWA9,GSTO2,HMGN1,KCTD1,KDM1A, KRTCAP3,LOC348926,LOC645332,OCIAD2,PATZ1,PDE6B,PGAP2, PLEK2,PRSS16,RAB25,SPINT1,TMC4,TMEM125,TRIM27 | ||||
 |
| ||||
| ATP5G2,B9D1,C14orf166,C14orf2,DNPH1,CINP,F12, GSTO2,KRTCAP3,NDUFB8,NPM3,OXA1L,PCBD1,PHB2, RPL12,RPL29,RPL3,RPL36AL,RPS2,SNRPD1,TIMM9 | AFMID,VWA9,C1orf131,ZFAS1,COG2,CRYM,FAM60A, GSTO2,KRTCAP3,NGLY1,NUDT16P1,SAMD13,SLC25A38,SLC35A1, SNX5,STARD10,TTPA,TXNDC12,YIPF2,ZNF28,ZNF468 |
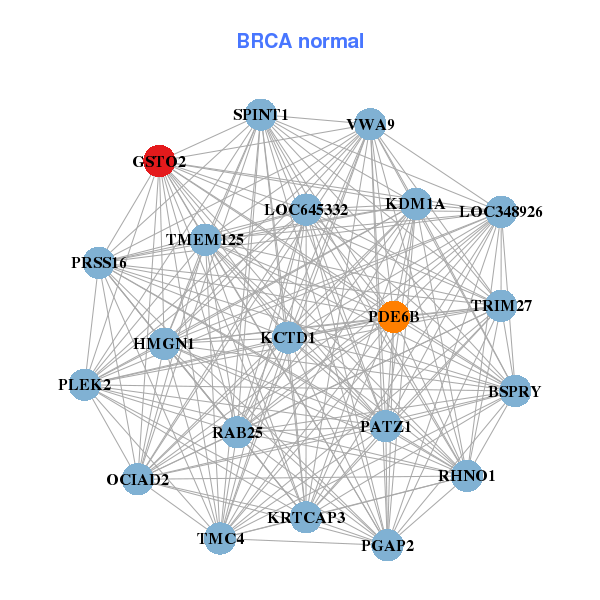
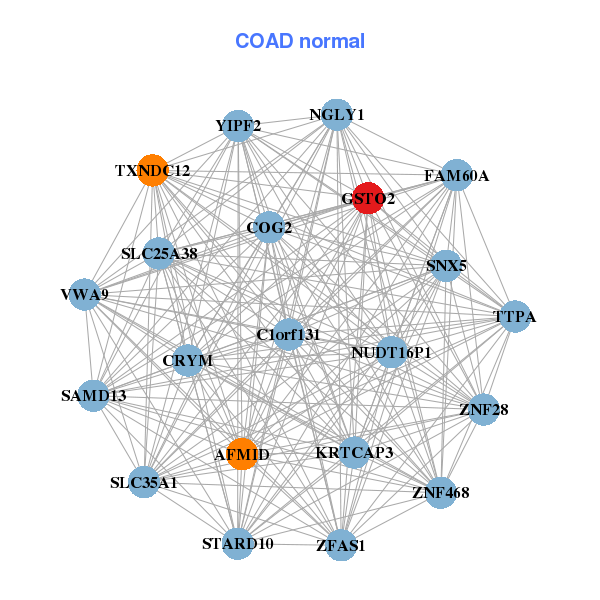
| * Co-Expression network figures were drawn using R package igraph. Only the top 20 genes with the highest correlations were shown. Red circle: input gene, orange circle: cell metabolism gene, sky circle: other gene |
: Open all plots for all cancer types
| Top |
: Open all interacting genes' information including KEGG pathway for all interacting genes from DAVID
| Top |
| Pharmacological Information for GSTO2 |
| DB Category | DB Name | DB's ID and Url link |
| * Gene Centered Interaction Network. |
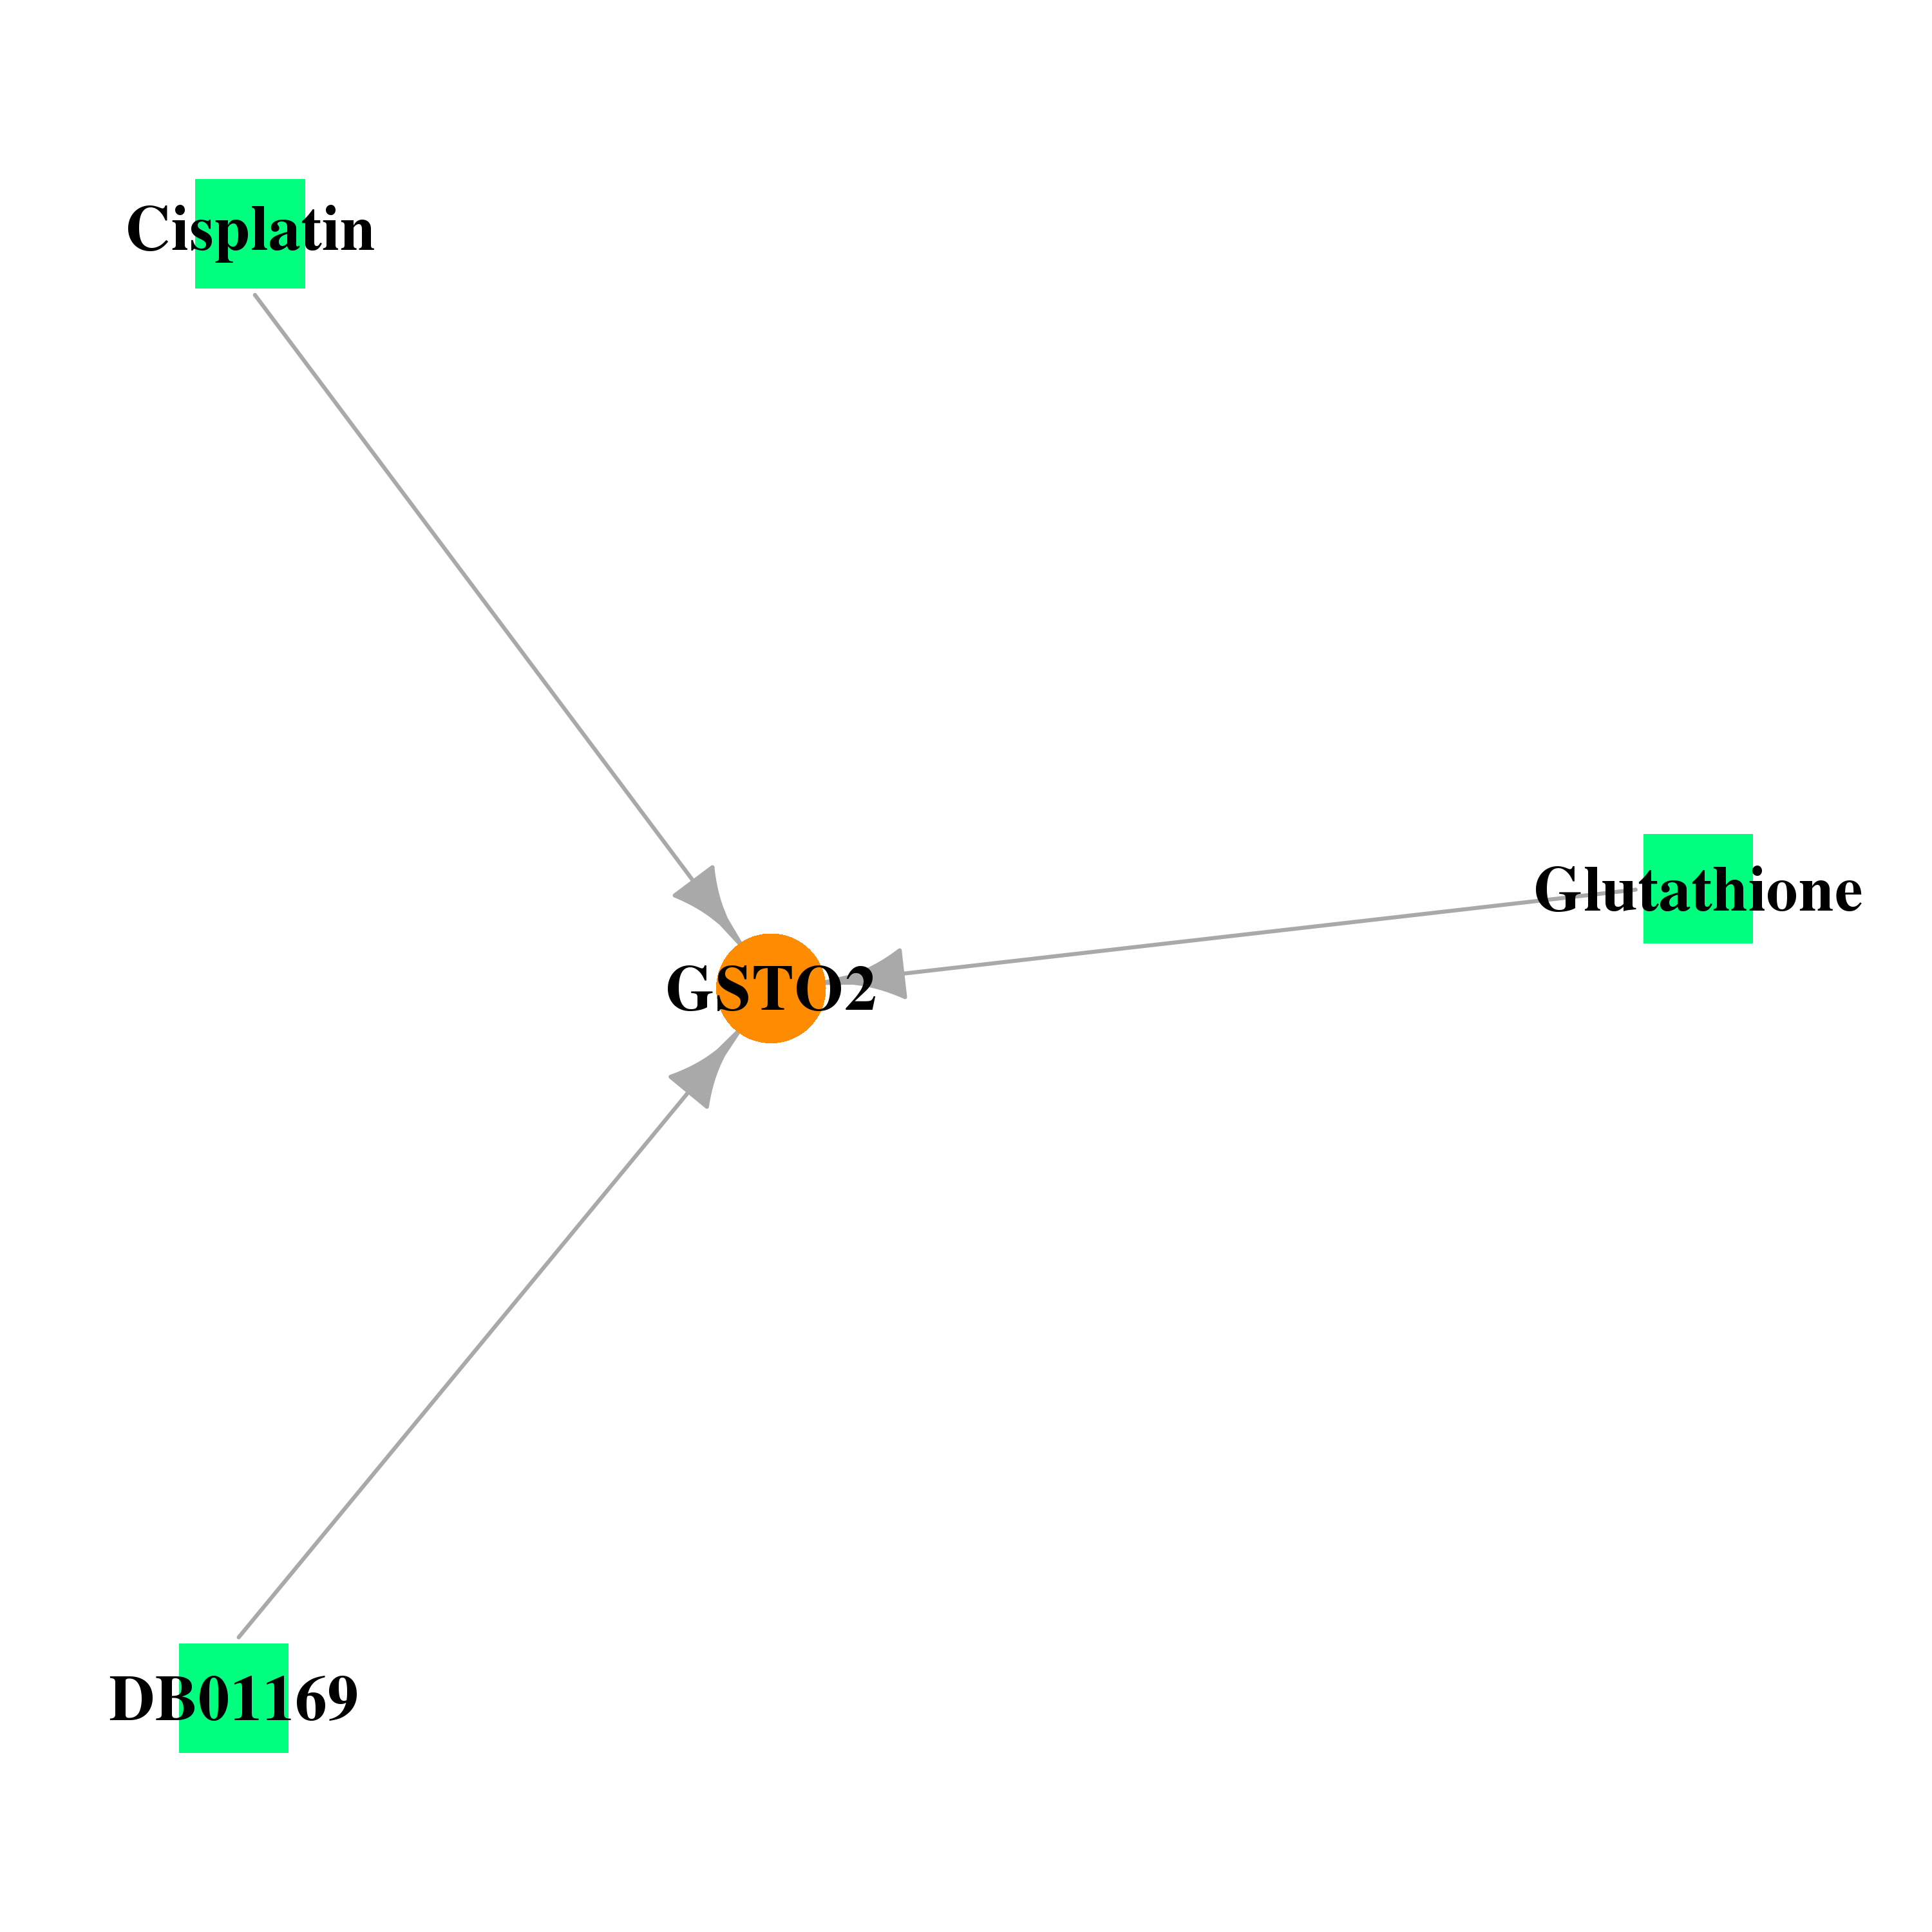 |
| * Drug Centered Interaction Network. |
| DrugBank ID | Target Name | Drug Groups | Generic Name | Drug Centered Network | Drug Structure |
| DB00143 | glutathione S-transferase omega 2 | approved; nutraceutical | Glutathione |  |  |
| DB00515 | glutathione S-transferase omega 2 | approved | Cisplatin |  |  |
| DB01169 | glutathione S-transferase omega 2 | approved; investigational | Arsenic trioxide | 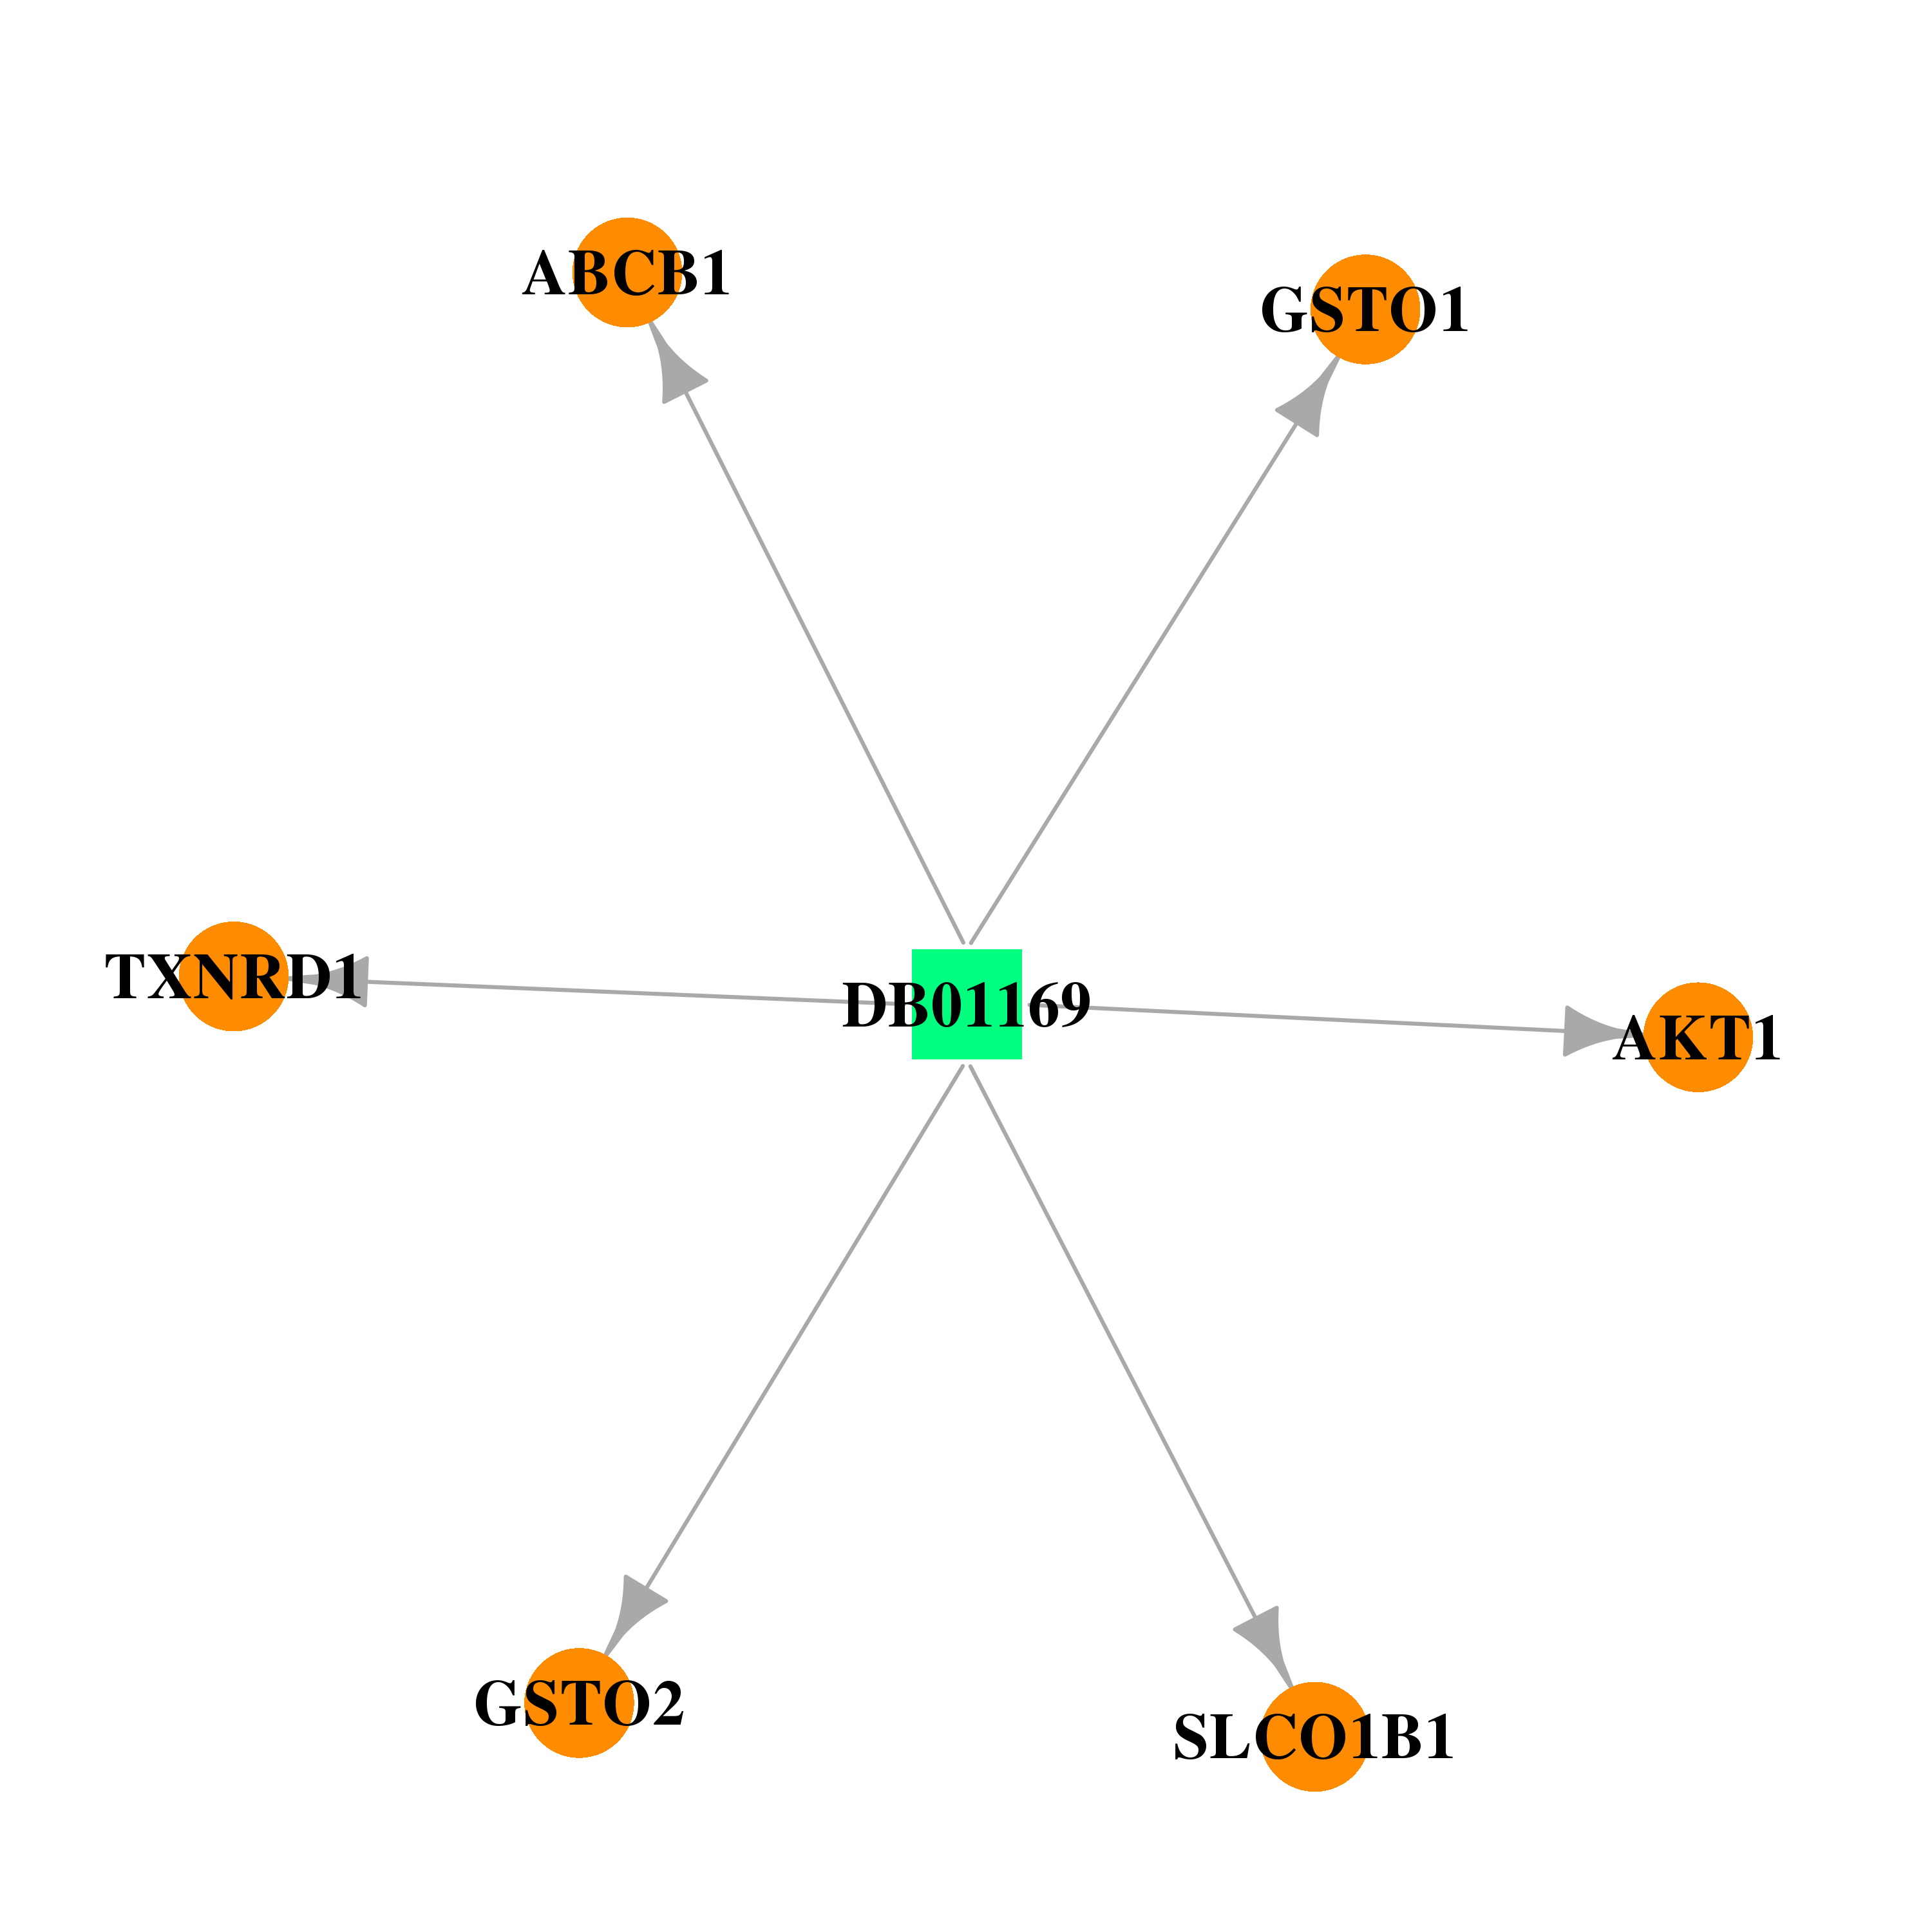 | 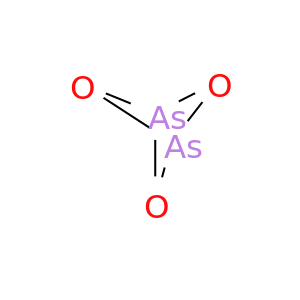 |
| Top |
| Cross referenced IDs for GSTO2 |
| * We obtained these cross-references from Uniprot database. It covers 150 different DBs, 18 categories. http://www.uniprot.org/help/cross_references_section |
: Open all cross reference information
|
Copyright © 2016-Present - The Univsersity of Texas Health Science Center at Houston @ |