|
||||||||||||||||||||
| |
| Phenotypic Information (metabolism pathway, cancer, disease, phenome) |
| |
| |
| Gene-Gene Network Information: Co-Expression Network, Interacting Genes & KEGG |
| |
|


| Gene Summary for CLPS |
| Basic gene info. | Gene symbol | CLPS |
| Gene name | colipase, pancreatic | |
| Synonyms | - | |
| Cytomap | UCSC genome browser: 6p21.31 | |
| Genomic location | chr6 :35762758-35765121 | |
| Type of gene | protein-coding | |
| RefGenes | NM_001252597.1, NM_001252598.1,NM_001832.3, | |
| Ensembl id | ENSG00000137392 | |
| Description | colipasepancreatic colipase preproprotein | |
| Modification date | 20141207 | |
| dbXrefs | MIM : 120105 | |
| HGNC : HGNC | ||
| Ensembl : ENSG00000137392 | ||
| HPRD : 00356 | ||
| Vega : OTTHUMG00000014578 | ||
| Protein | UniProt: go to UniProt's Cross Reference DB Table | |
| Expression | CleanEX: HS_CLPS | |
| BioGPS: 1208 | ||
| Gene Expression Atlas: ENSG00000137392 | ||
| The Human Protein Atlas: ENSG00000137392 | ||
| Pathway | NCI Pathway Interaction Database: CLPS | |
| KEGG: CLPS | ||
| REACTOME: CLPS | ||
| ConsensusPathDB | ||
| Pathway Commons: CLPS | ||
| Metabolism | MetaCyc: CLPS | |
| HUMANCyc: CLPS | ||
| Regulation | Ensembl's Regulation: ENSG00000137392 | |
| miRBase: chr6 :35,762,758-35,765,121 | ||
| TargetScan: NM_001252597 | ||
| cisRED: ENSG00000137392 | ||
| Context | iHOP: CLPS | |
| cancer metabolism search in PubMed: CLPS | ||
| UCL Cancer Institute: CLPS | ||
| Assigned class in ccmGDB | C | |
| Top |
| Phenotypic Information for CLPS(metabolism pathway, cancer, disease, phenome) |
| Cancer | CGAP: CLPS |
| Familial Cancer Database: CLPS | |
| * This gene is included in those cancer gene databases. |
|
|
|
|
|
|
| ||||||||||||||
Oncogene 1 | Significant driver gene in | |||||||||||||||||||
| cf) number; DB name 1 Oncogene; http://nar.oxfordjournals.org/content/35/suppl_1/D721.long, 2 Tumor Suppressor gene; https://bioinfo.uth.edu/TSGene/, 3 Cancer Gene Census; http://www.nature.com/nrc/journal/v4/n3/abs/nrc1299.html, 4 CancerGenes; http://nar.oxfordjournals.org/content/35/suppl_1/D721.long, 5 Network of Cancer Gene; http://ncg.kcl.ac.uk/index.php, 1Therapeutic Vulnerabilities in Cancer; http://cbio.mskcc.org/cancergenomics/statius/ |
| REACTOME_METABOLISM_OF_STEROID_HORMONES_AND_VITAMINS_A_AND_D REACTOME_METABOLISM_OF_LIPIDS_AND_LIPOPROTEINS | |
| OMIM | |
| Orphanet | |
| Disease | KEGG Disease: CLPS |
| MedGen: CLPS (Human Medical Genetics with Condition) | |
| ClinVar: CLPS | |
| Phenotype | MGI: CLPS (International Mouse Phenotyping Consortium) |
| PhenomicDB: CLPS | |
| Mutations for CLPS |
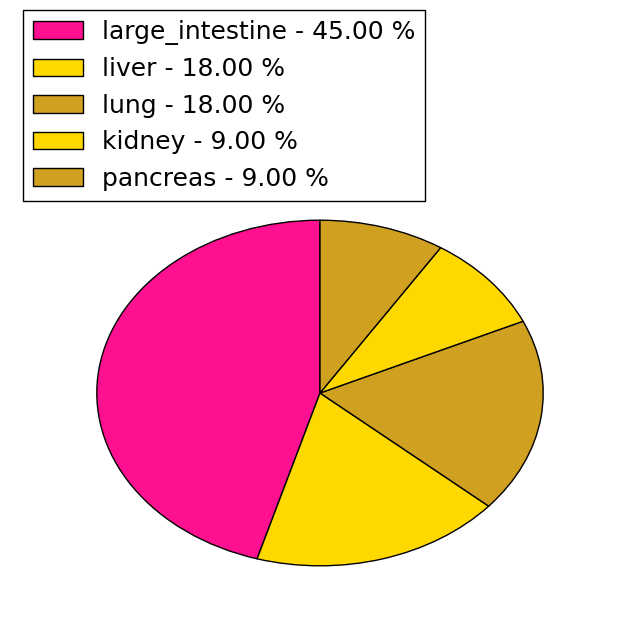
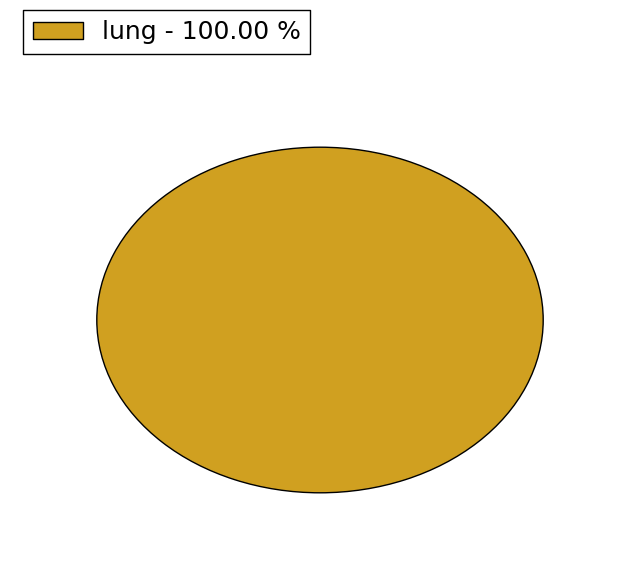
| * Under tables are showing count per each tissue to give us broad intuition about tissue specific mutation patterns.You can go to the detailed page for each mutation database's web site. |
| There's no structural variation information in COSMIC data for this gene. |
| * From mRNA Sanger sequences, Chitars2.0 arranged chimeric transcripts. This table shows CLPS related fusion information. |
| ID | Head Gene | Tail Gene | Accession | Gene_a | qStart_a | qEnd_a | Chromosome_a | tStart_a | tEnd_a | Gene_a | qStart_a | qEnd_a | Chromosome_a | tStart_a | tEnd_a |
| Top |
| There's no copy number variation information in COSMIC data for this gene. |
| Top |
|
 |
| Top |
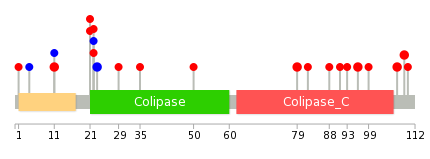
| Stat. for Non-Synonymous SNVs (# total SNVs=11) | (# total SNVs=2) |
 |  |
(# total SNVs=0) | (# total SNVs=0) |
| Top |
| * When you move the cursor on each content, you can see more deailed mutation information on the Tooltip. Those are primary_site,primary_histology,mutation(aa),pubmedID. |
| GRCh37 position | Mutation(aa) | Unique sampleID count |
| chr6:35762936-35762936 | p.R109H | 2 |
| chr6:35762943-35762943 | p.A107T | 2 |
| chr6:35764997-35764997 | p.G23G | 2 |
| chr6:35762976-35762976 | p.I96V | 2 |
| chr6:35765001-35765001 | p.R22P | 2 |
| chr6:35765035-35765035 | p.A11T | 2 |
| chr6:35763027-35763027 | p.P79S | 2 |
| chr6:35762933-35762933 | p.S110F | 1 |
| chr6:35763610-35763610 | p.M35I | 1 |
| chr6:35763630-35763630 | p.E29K | 1 |
| Top |
|
 |
| Point Mutation/ Tissue ID | 1 | 2 | 3 | 4 | 5 | 6 | 7 | 8 | 9 | 10 | 11 | 12 | 13 | 14 | 15 | 16 | 17 | 18 | 19 | 20 |
| # sample | 3 | 1 | 3 | 1 | 9 | 2 | ||||||||||||||
| # mutation | 2 | 1 | 3 | 1 | 8 | 2 | ||||||||||||||
| nonsynonymous SNV | 2 | 1 | 1 | 6 | 2 | |||||||||||||||
| synonymous SNV | 2 | 1 | 2 |
| cf) Tissue ID; Tissue type (1; BLCA[Bladder Urothelial Carcinoma], 2; BRCA[Breast invasive carcinoma], 3; CESC[Cervical squamous cell carcinoma and endocervical adenocarcinoma], 4; COAD[Colon adenocarcinoma], 5; GBM[Glioblastoma multiforme], 6; Glioma Low Grade, 7; HNSC[Head and Neck squamous cell carcinoma], 8; KICH[Kidney Chromophobe], 9; KIRC[Kidney renal clear cell carcinoma], 10; KIRP[Kidney renal papillary cell carcinoma], 11; LAML[Acute Myeloid Leukemia], 12; LUAD[Lung adenocarcinoma], 13; LUSC[Lung squamous cell carcinoma], 14; OV[Ovarian serous cystadenocarcinoma ], 15; PAAD[Pancreatic adenocarcinoma], 16; PRAD[Prostate adenocarcinoma], 17; SKCM[Skin Cutaneous Melanoma], 18:STAD[Stomach adenocarcinoma], 19:THCA[Thyroid carcinoma], 20:UCEC[Uterine Corpus Endometrial Carcinoma]) |
| Top |
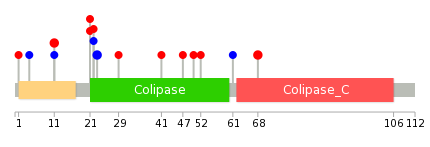
| * We represented just top 10 SNVs. When you move the cursor on each content, you can see more deailed mutation information on the Tooltip. Those are primary_site, primary_histology, mutation(aa), pubmedID. |
| Genomic Position | Mutation(aa) | Unique sampleID count |
| chr6:35762936 | p.A11T,CLPS | 2 |
| chr6:35765035 | p.R68H,CLPS | 2 |
| chr6:35764997 | p.G23G,CLPS | 2 |
| chr6:35765004 | p.I4I,CLPS | 1 |
| chr6:35765005 | p.M1I,CLPS | 1 |
| chr6:35762985 | p.V52M,CLPS | 1 |
| chr6:35765033 | p.T50I,CLPS | 1 |
| chr6:35762990 | p.G47R,CLPS | 1 |
| chr6:35763000 | p.R41C,CLPS | 1 |
| chr6:35765054 | p.S61S,CLPS | 1 |
| * Copy number data were extracted from TCGA using R package TCGA-Assembler. The URLs of all public data files on TCGA DCC data server were gathered on Jan-05-2015. Function ProcessCNAData in TCGA-Assembler package was used to obtain gene-level copy number value which is calculated as the average copy number of the genomic region of a gene. |
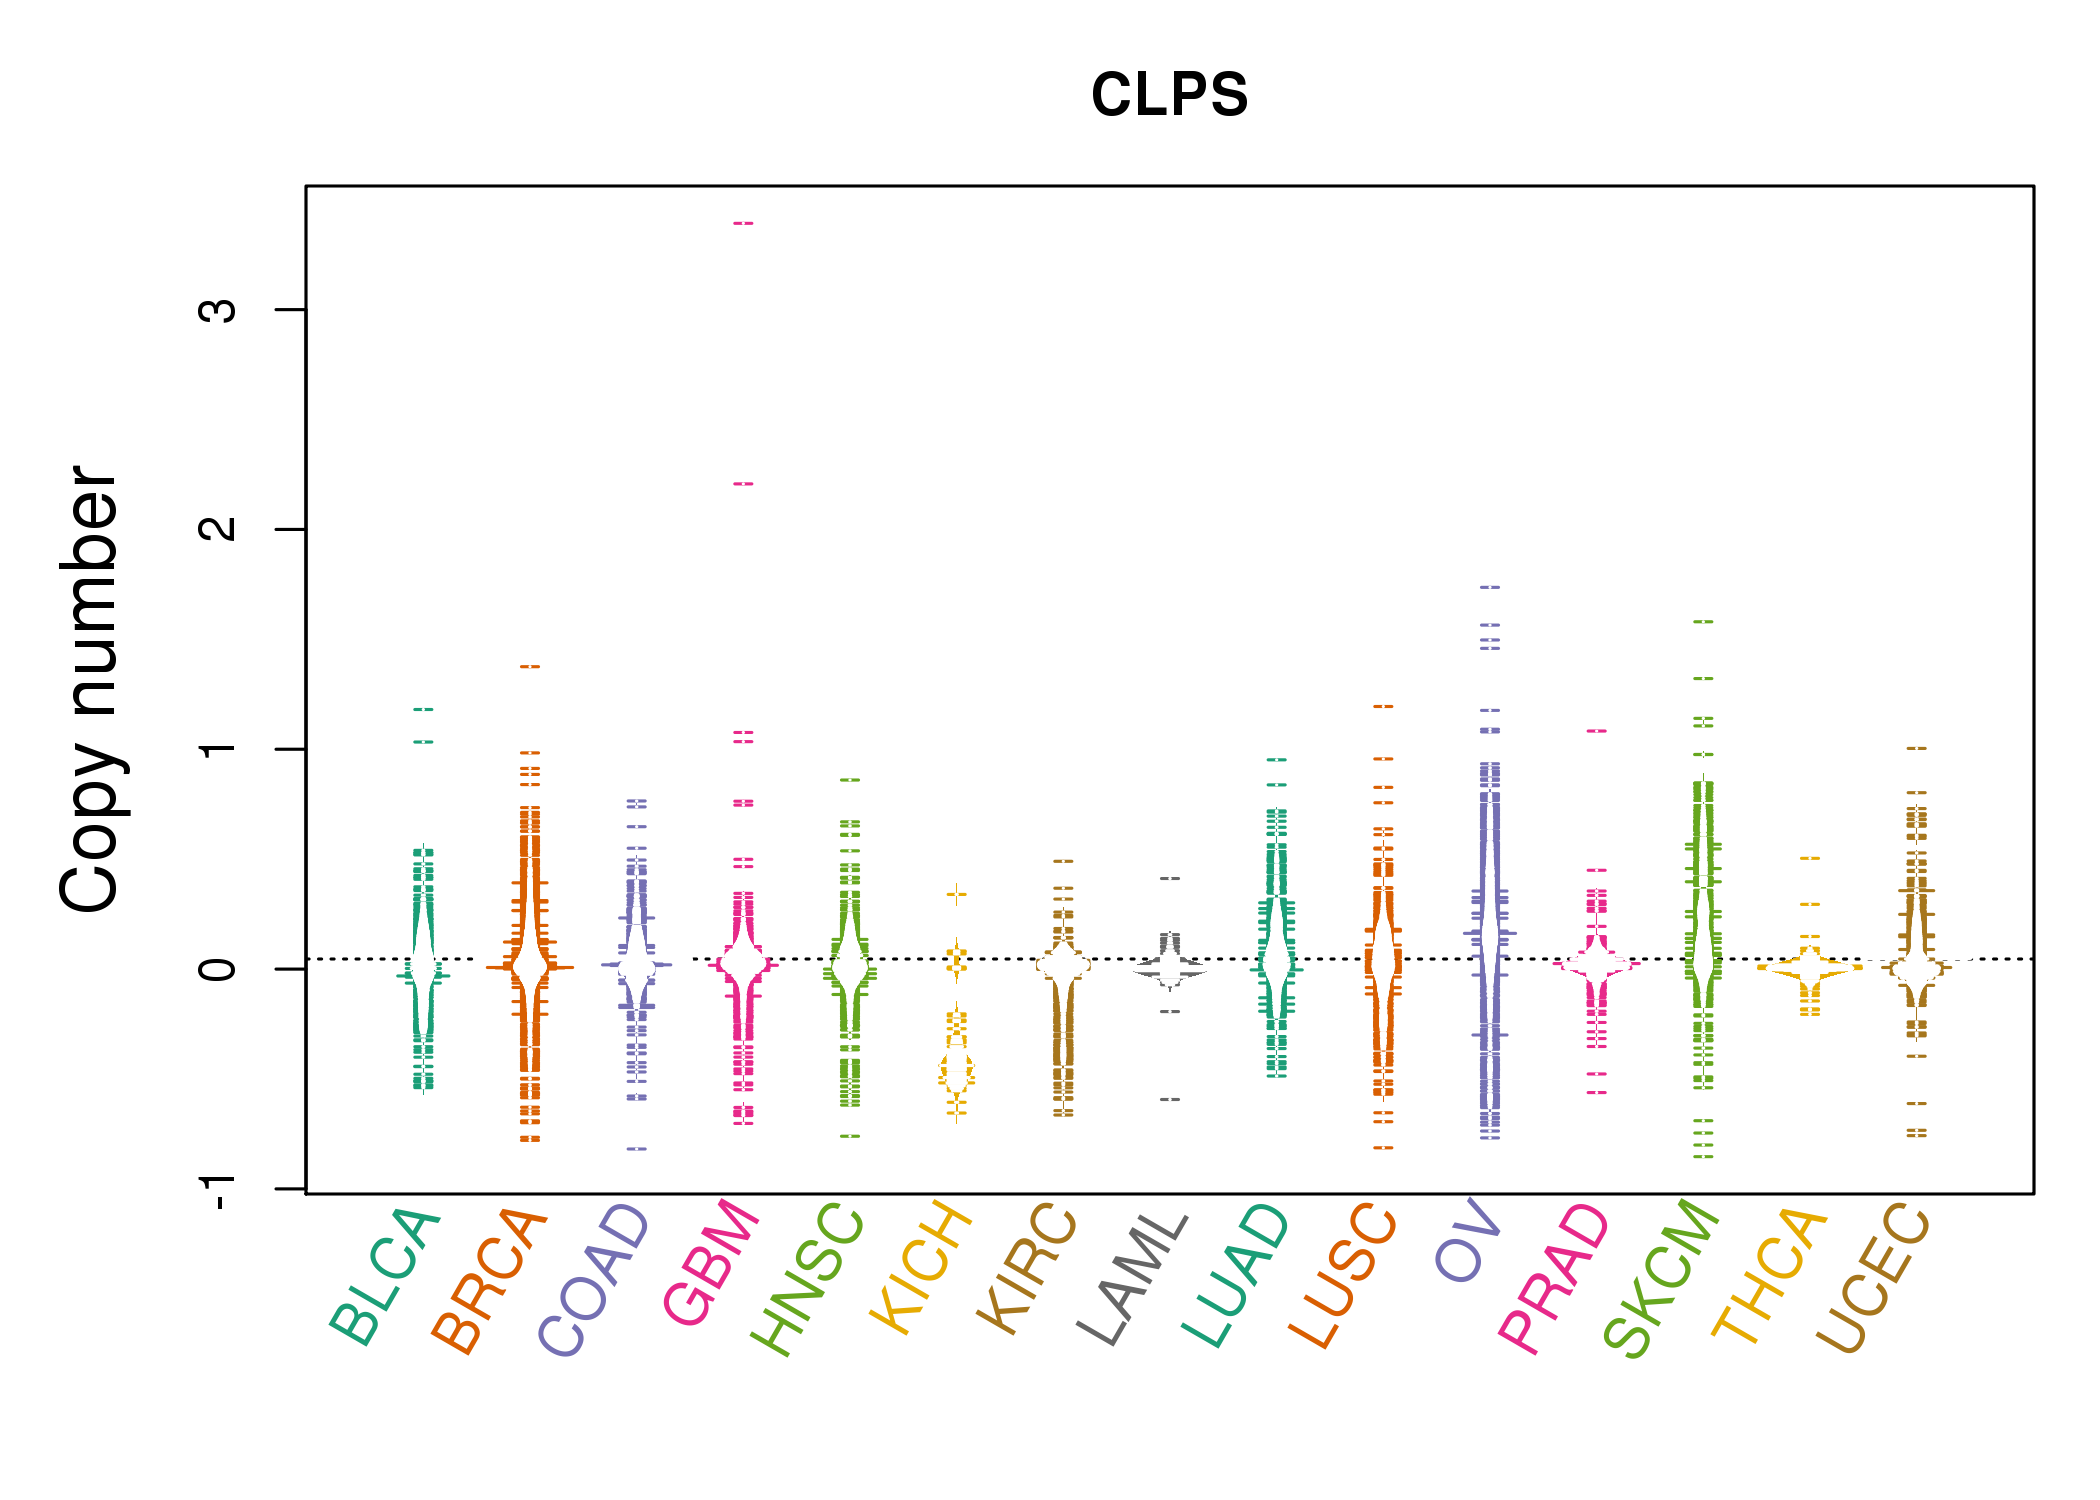 |
| cf) Tissue ID[Tissue type]: BLCA[Bladder Urothelial Carcinoma], BRCA[Breast invasive carcinoma], CESC[Cervical squamous cell carcinoma and endocervical adenocarcinoma], COAD[Colon adenocarcinoma], GBM[Glioblastoma multiforme], Glioma Low Grade, HNSC[Head and Neck squamous cell carcinoma], KICH[Kidney Chromophobe], KIRC[Kidney renal clear cell carcinoma], KIRP[Kidney renal papillary cell carcinoma], LAML[Acute Myeloid Leukemia], LUAD[Lung adenocarcinoma], LUSC[Lung squamous cell carcinoma], OV[Ovarian serous cystadenocarcinoma ], PAAD[Pancreatic adenocarcinoma], PRAD[Prostate adenocarcinoma], SKCM[Skin Cutaneous Melanoma], STAD[Stomach adenocarcinoma], THCA[Thyroid carcinoma], UCEC[Uterine Corpus Endometrial Carcinoma] |
| Top |
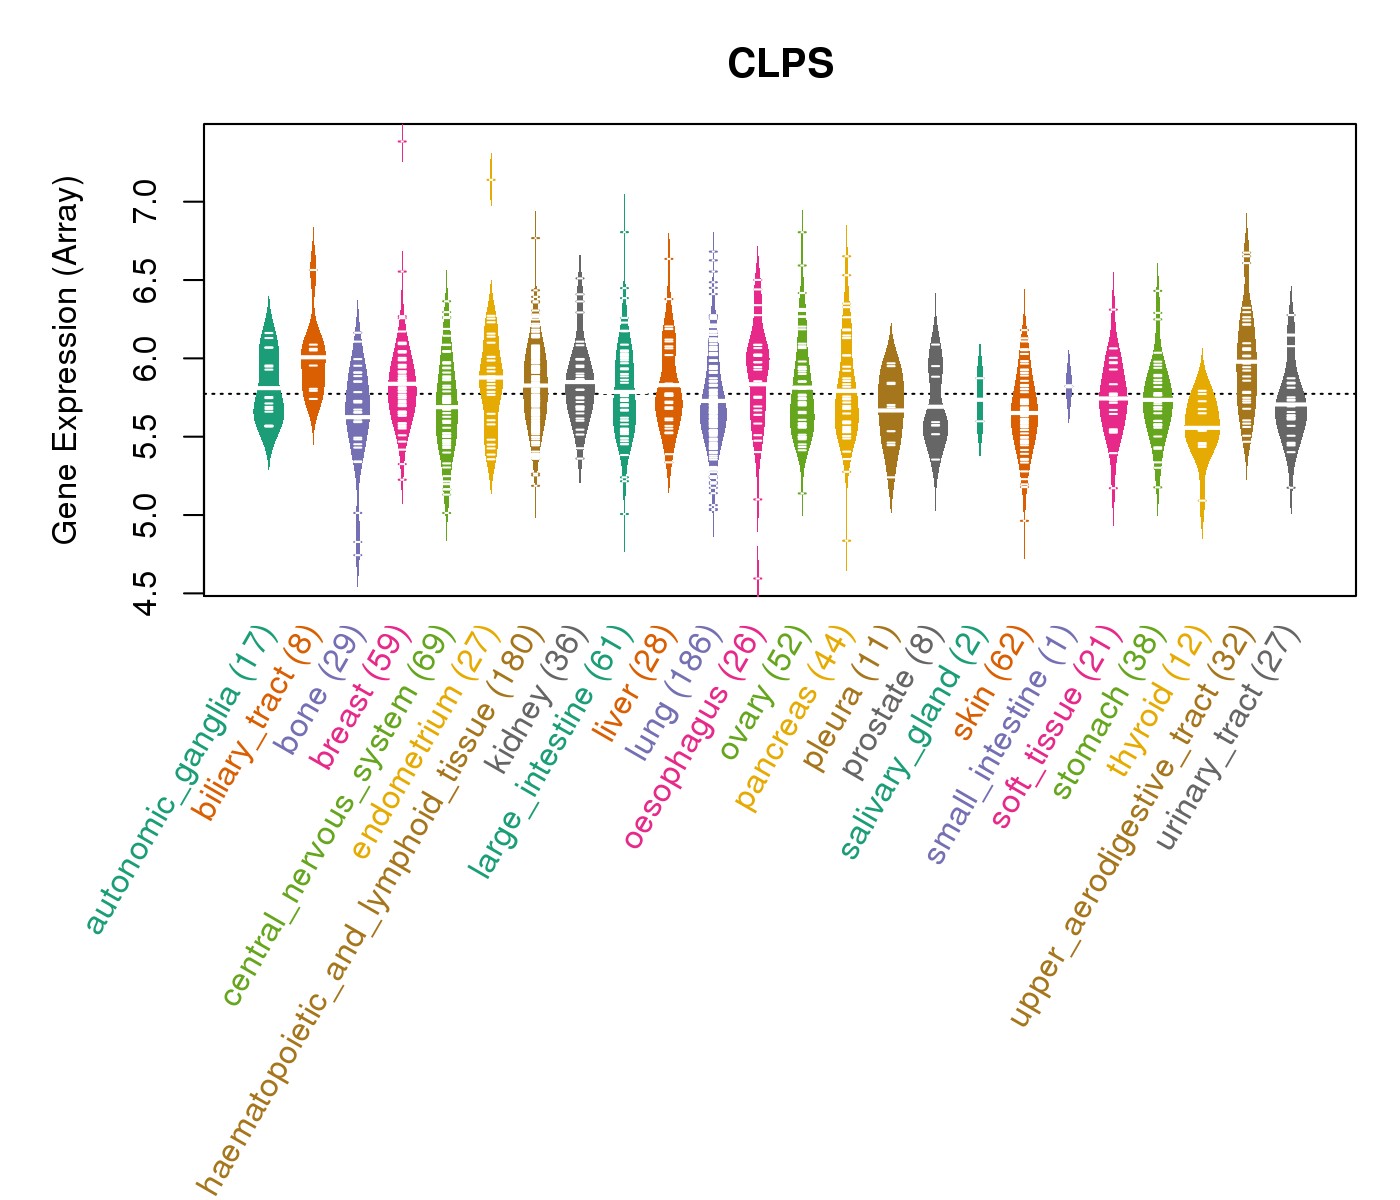
| Gene Expression for CLPS |
| * CCLE gene expression data were extracted from CCLE_Expression_Entrez_2012-10-18.res: Gene-centric RMA-normalized mRNA expression data. |
 |
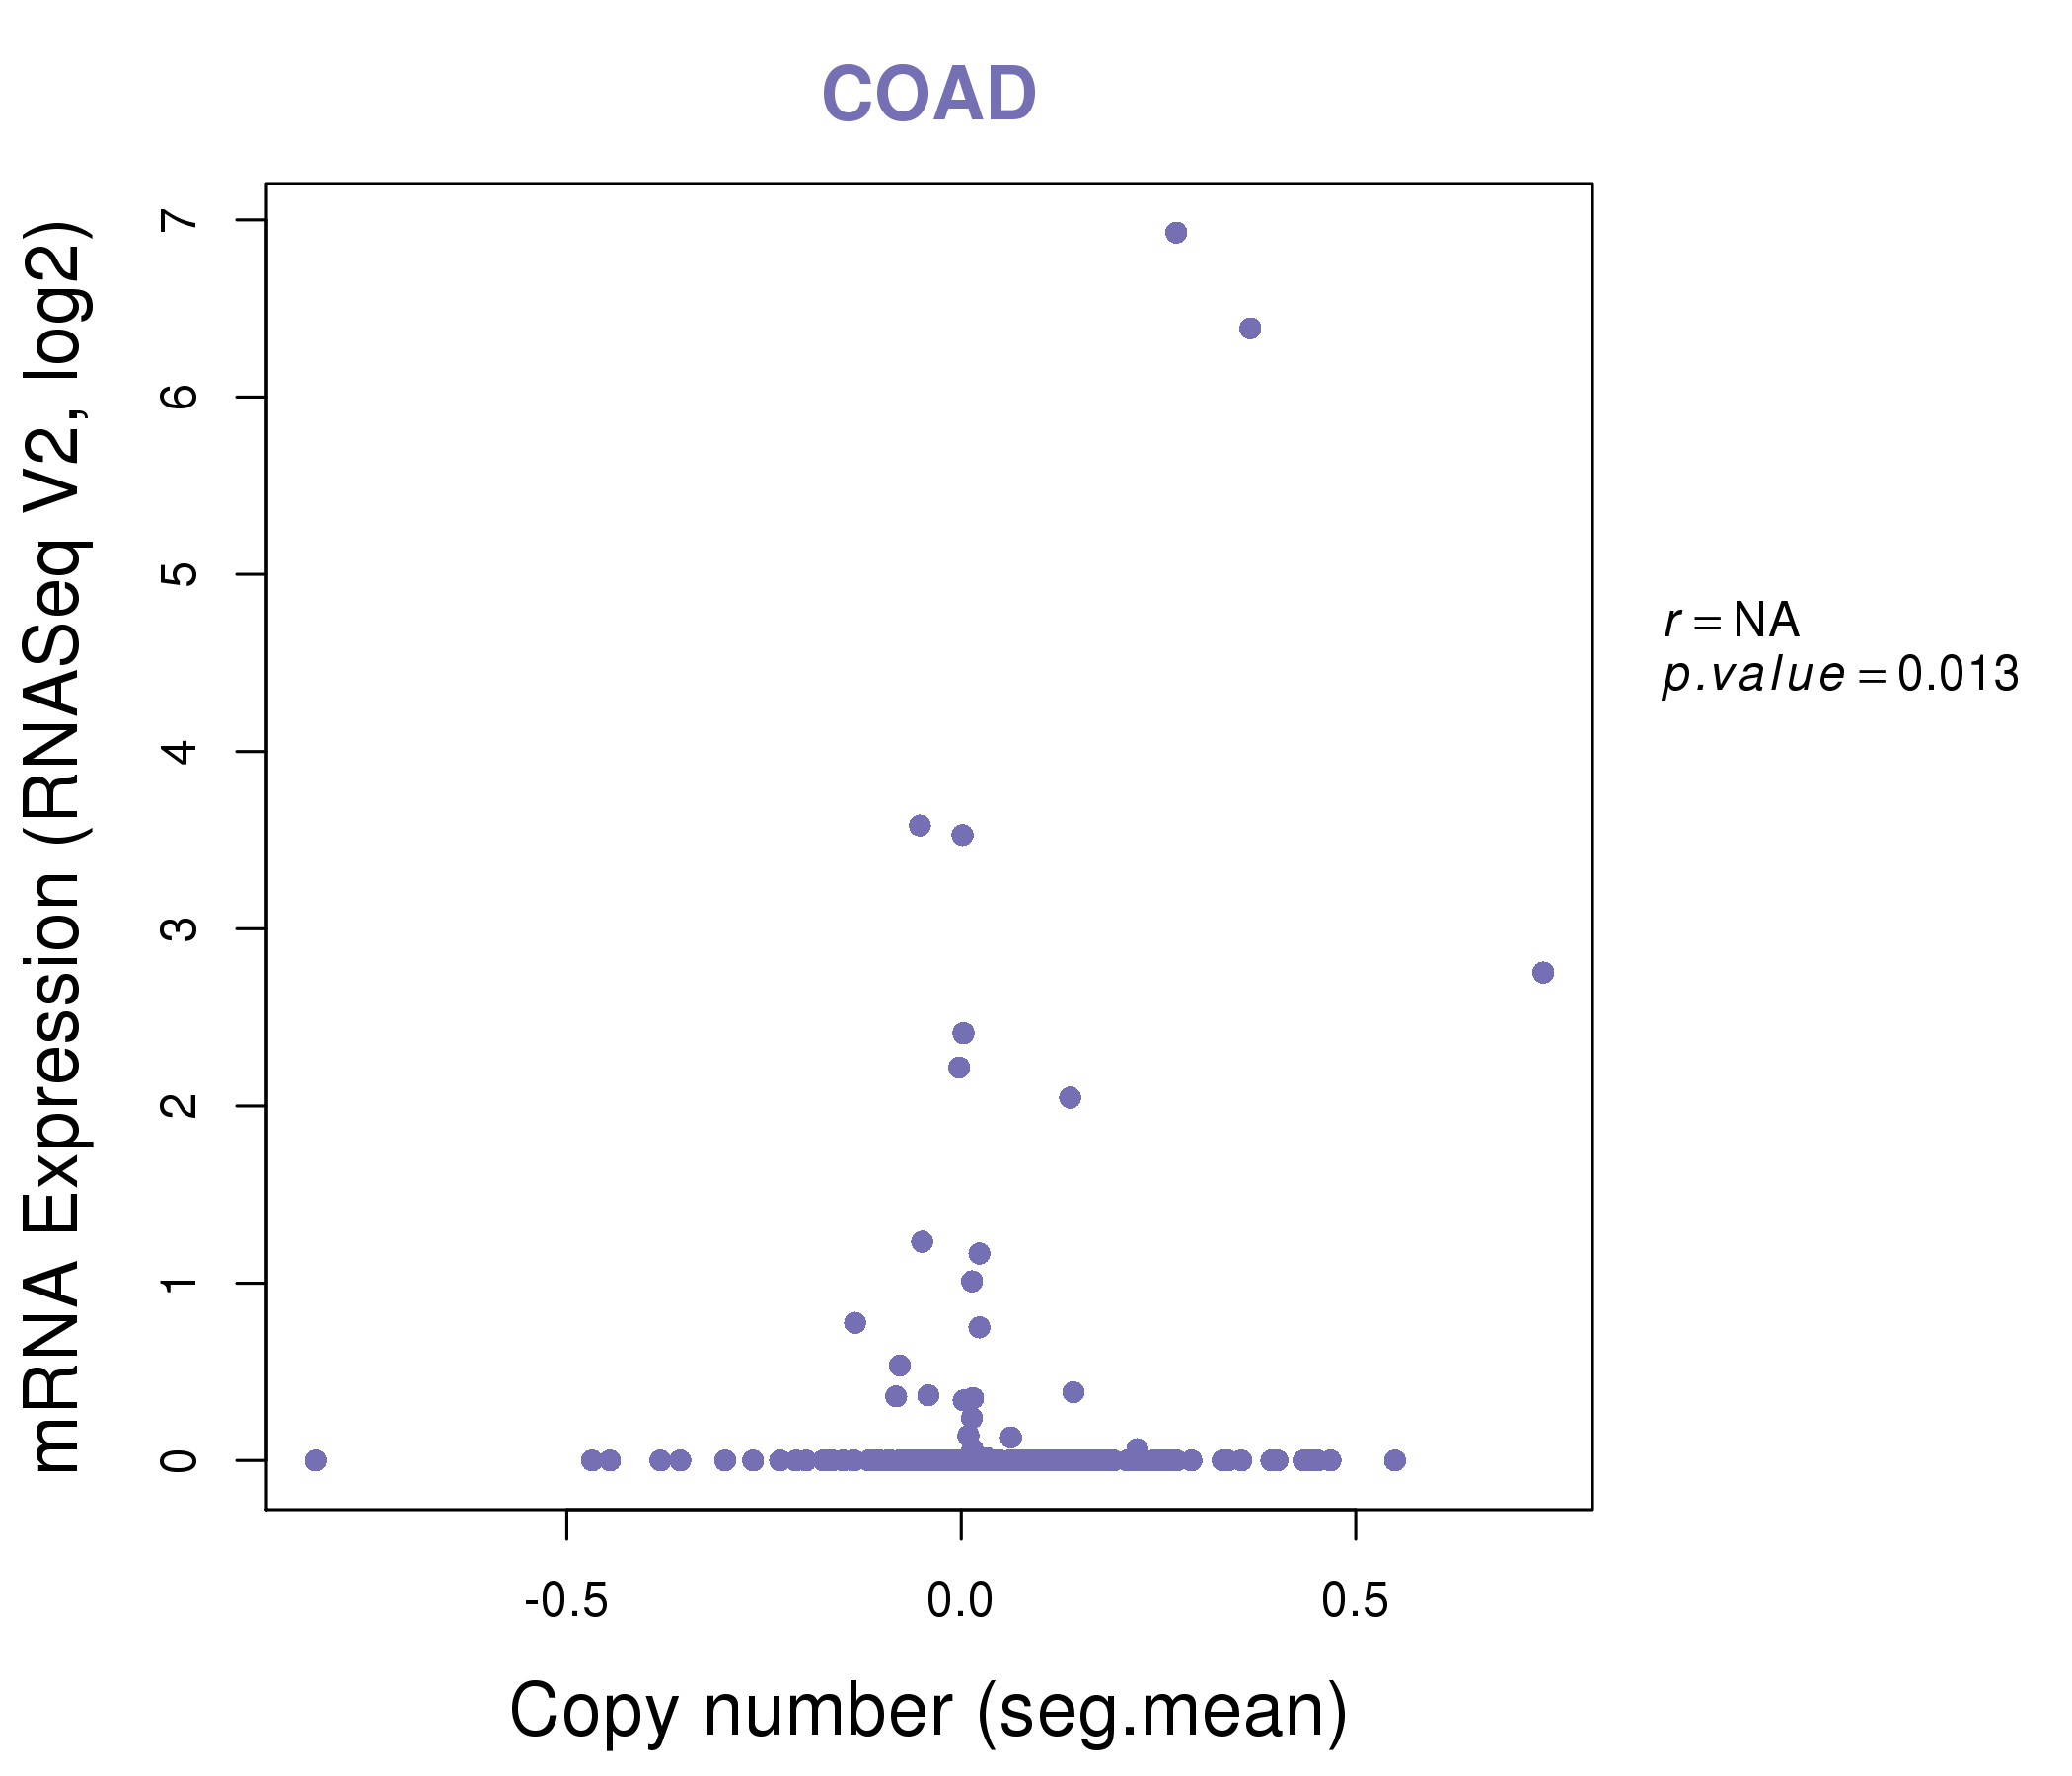
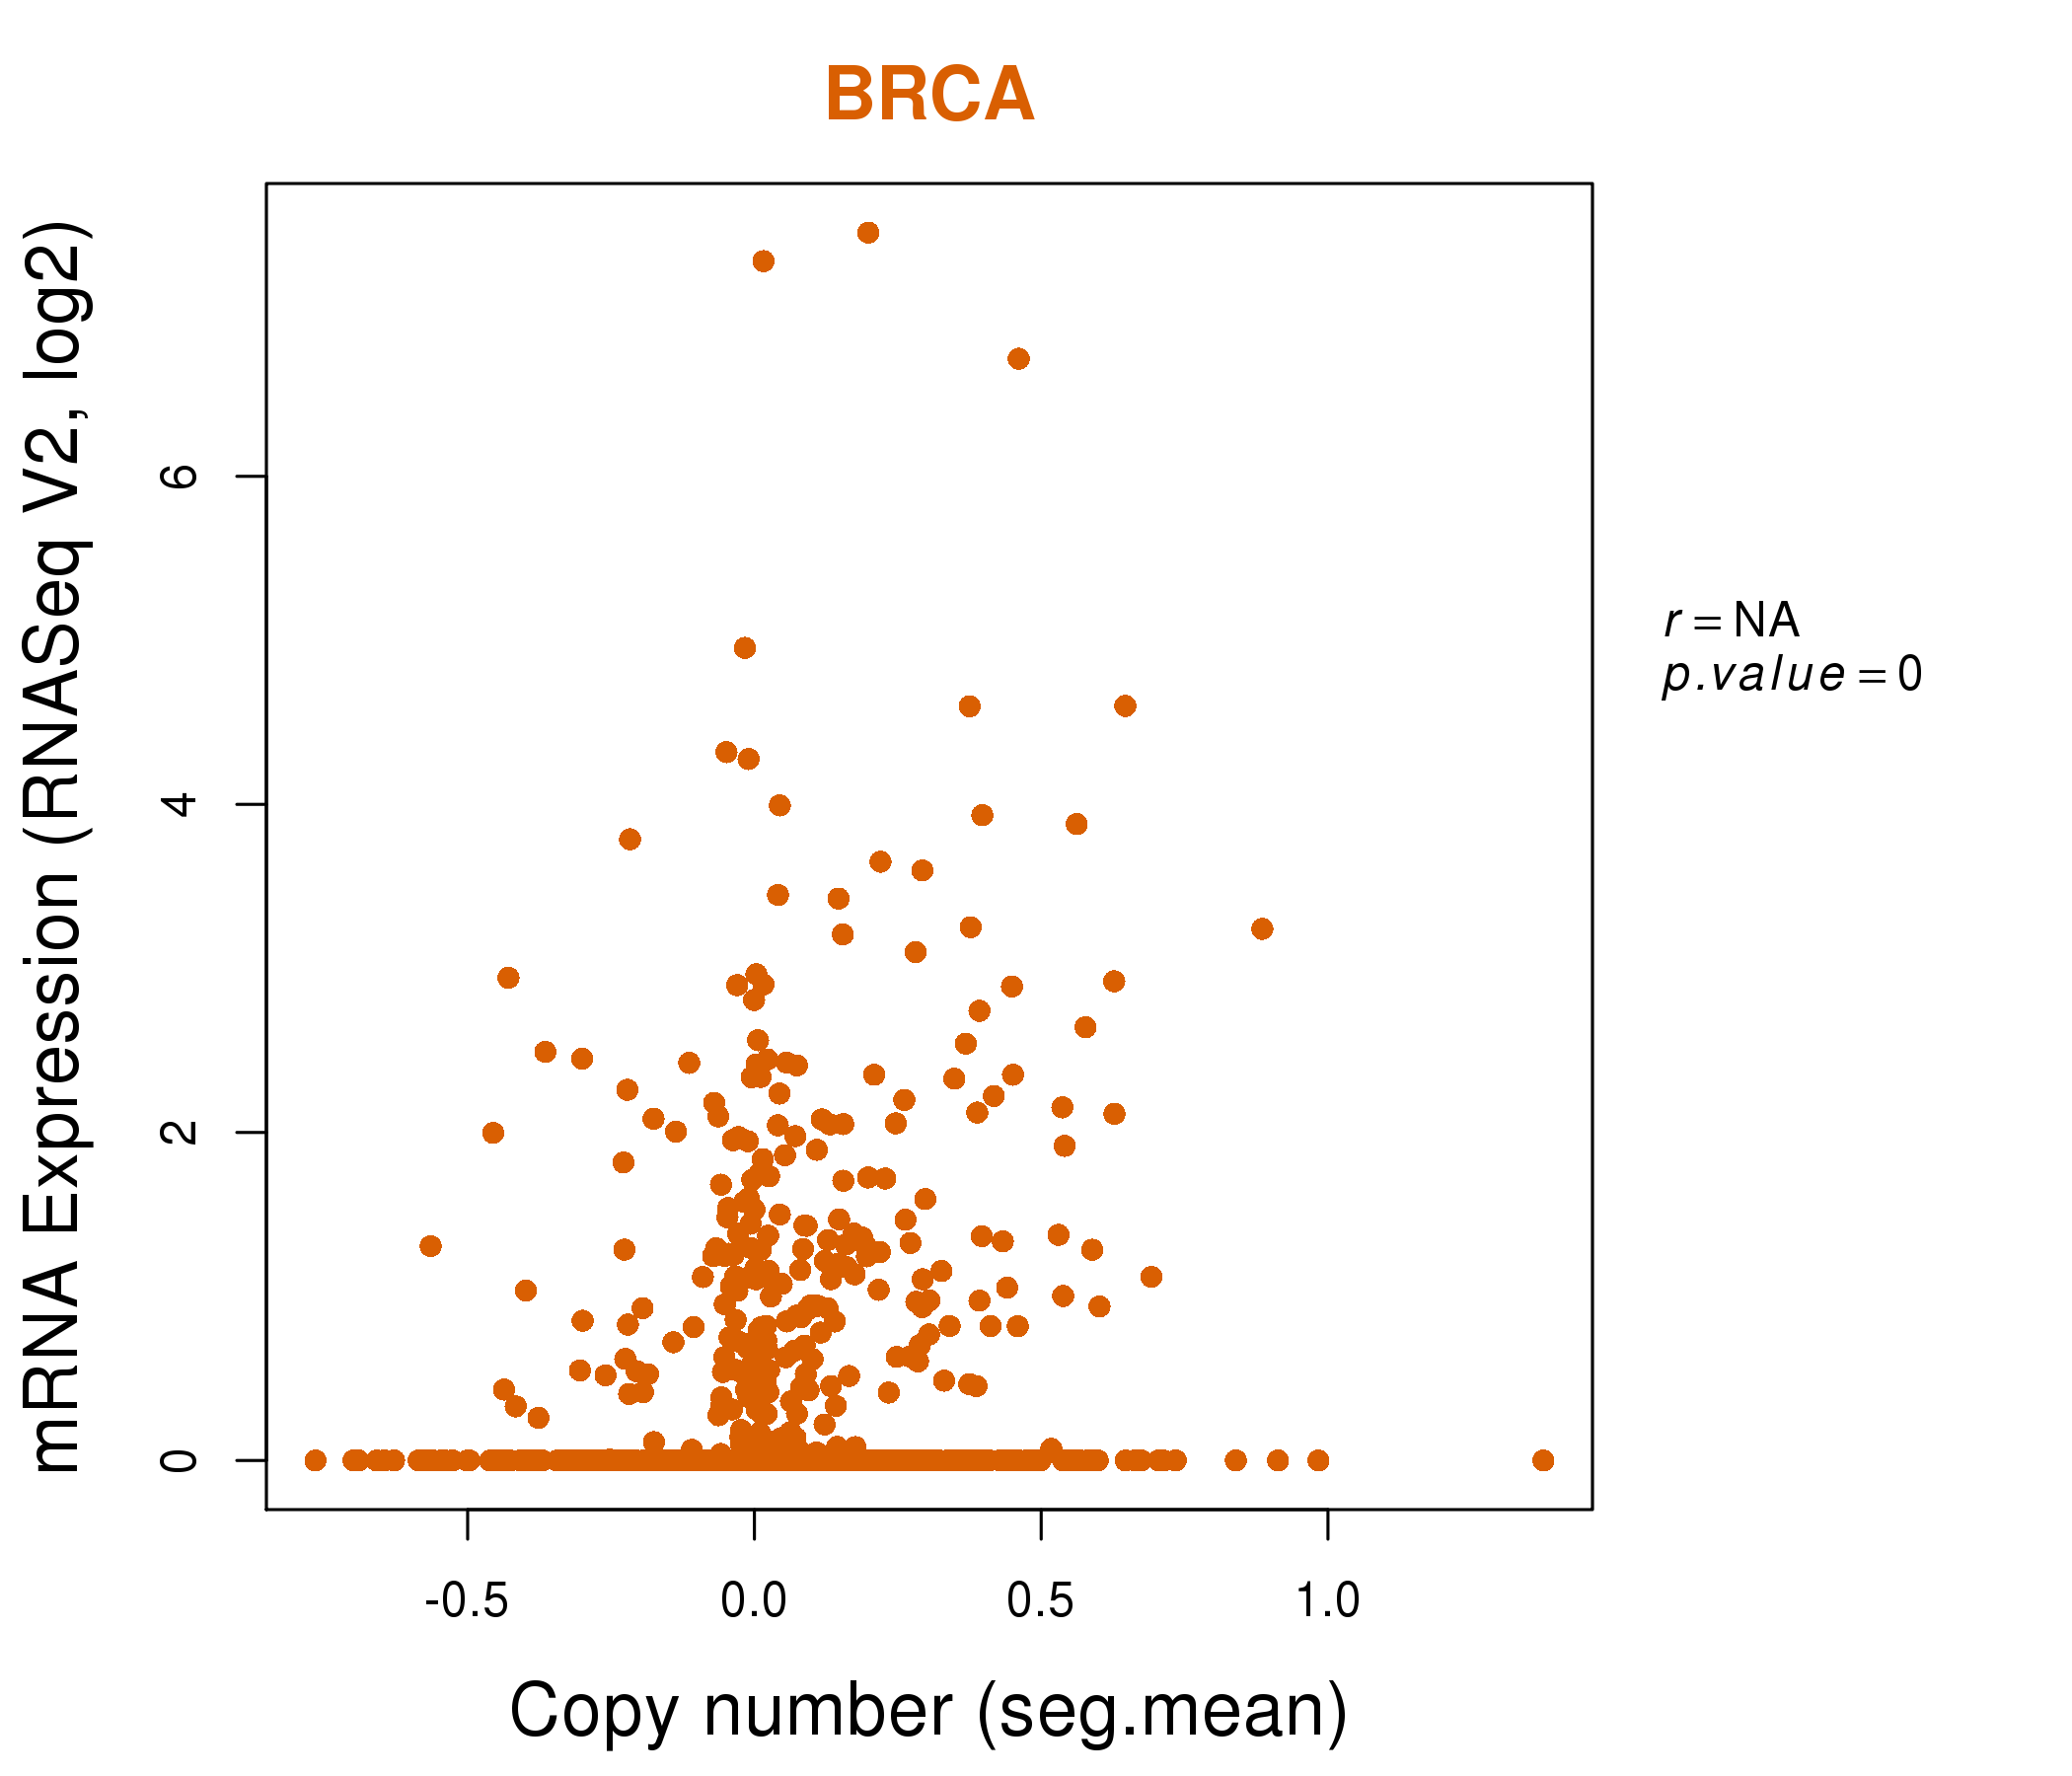
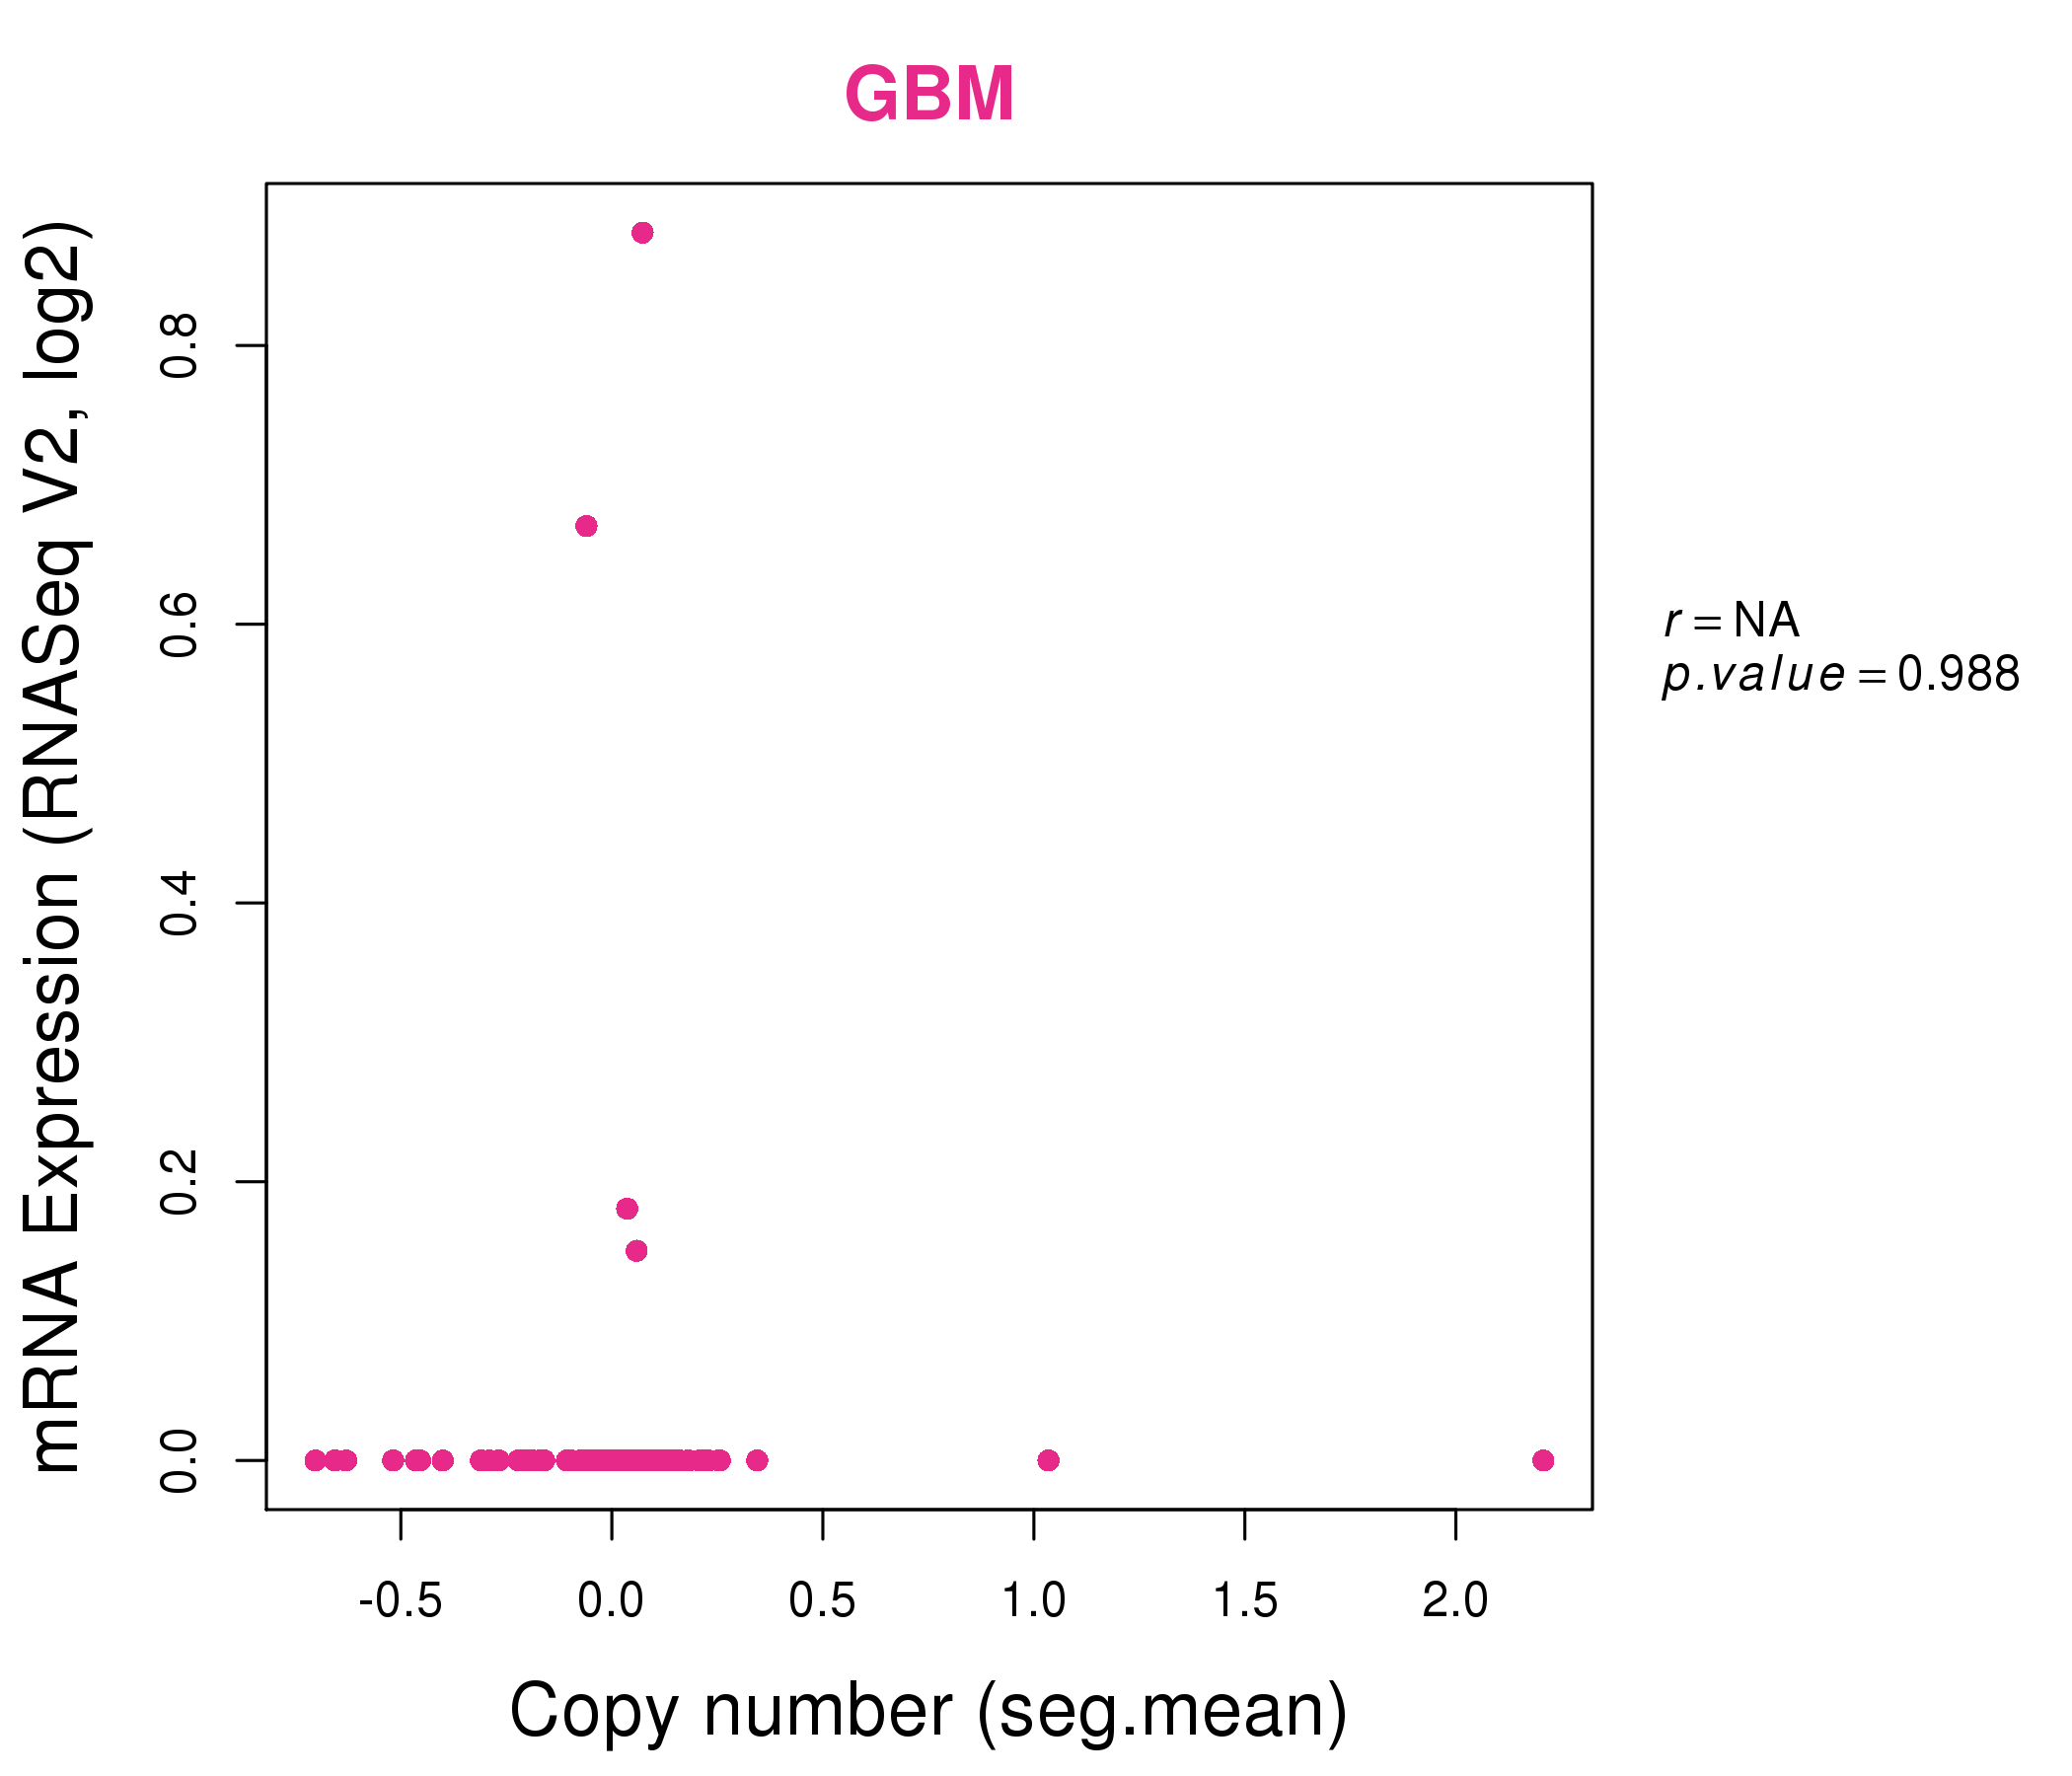
| * Normalized gene expression data of RNASeqV2 was extracted from TCGA using R package TCGA-Assembler. The URLs of all public data files on TCGA DCC data server were gathered at Jan-05-2015. Only eight cancer types have enough normal control samples for differential expression analysis. (t test, adjusted p<0.05 (using Benjamini-Hochberg FDR)) |
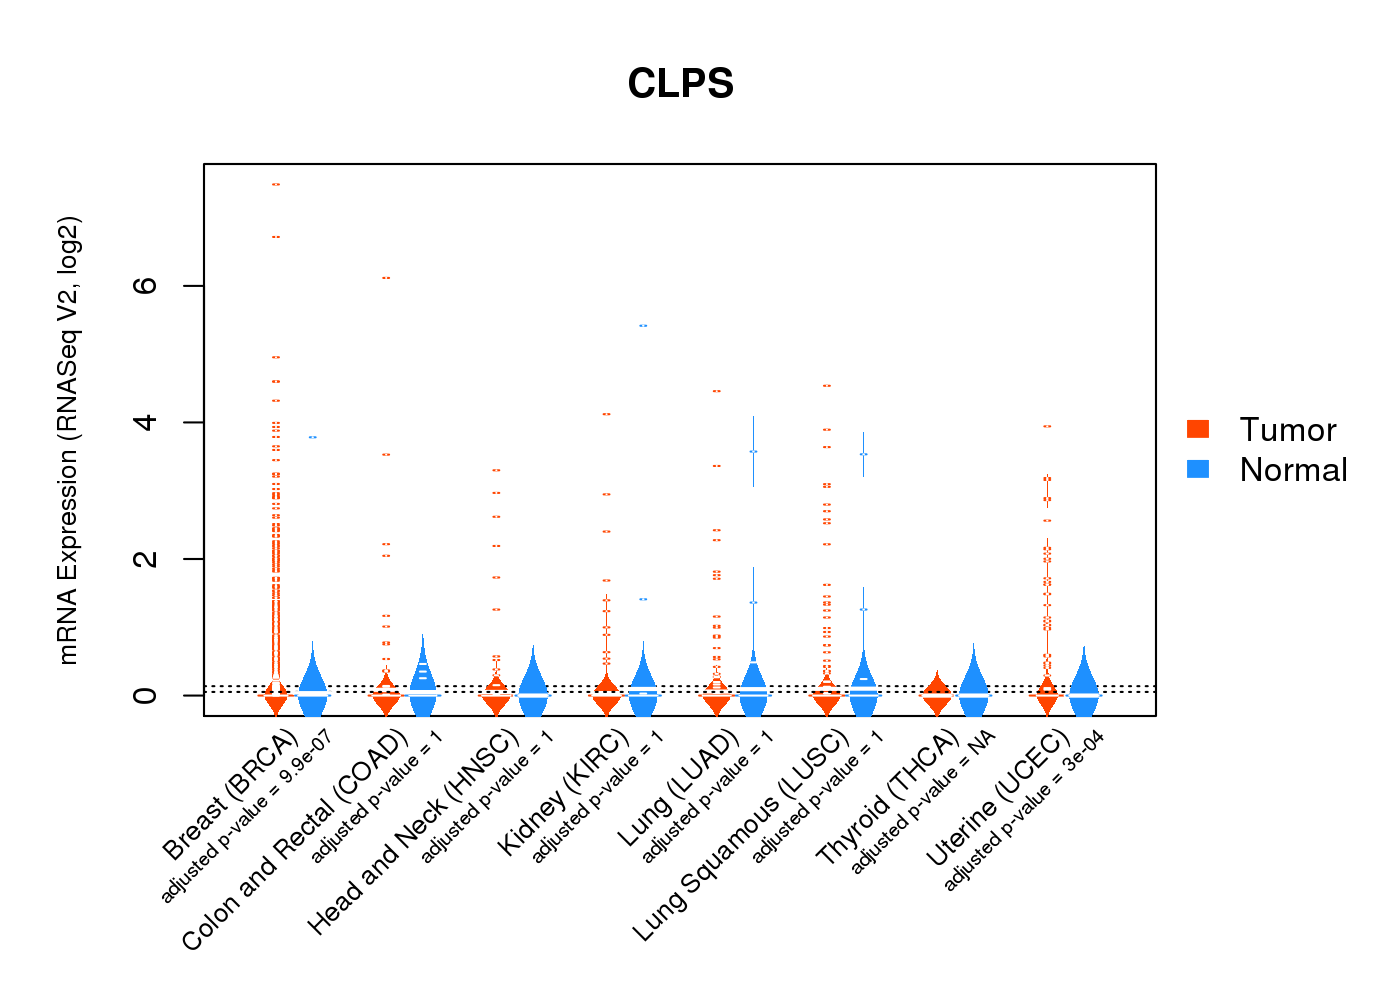 |
| Top |
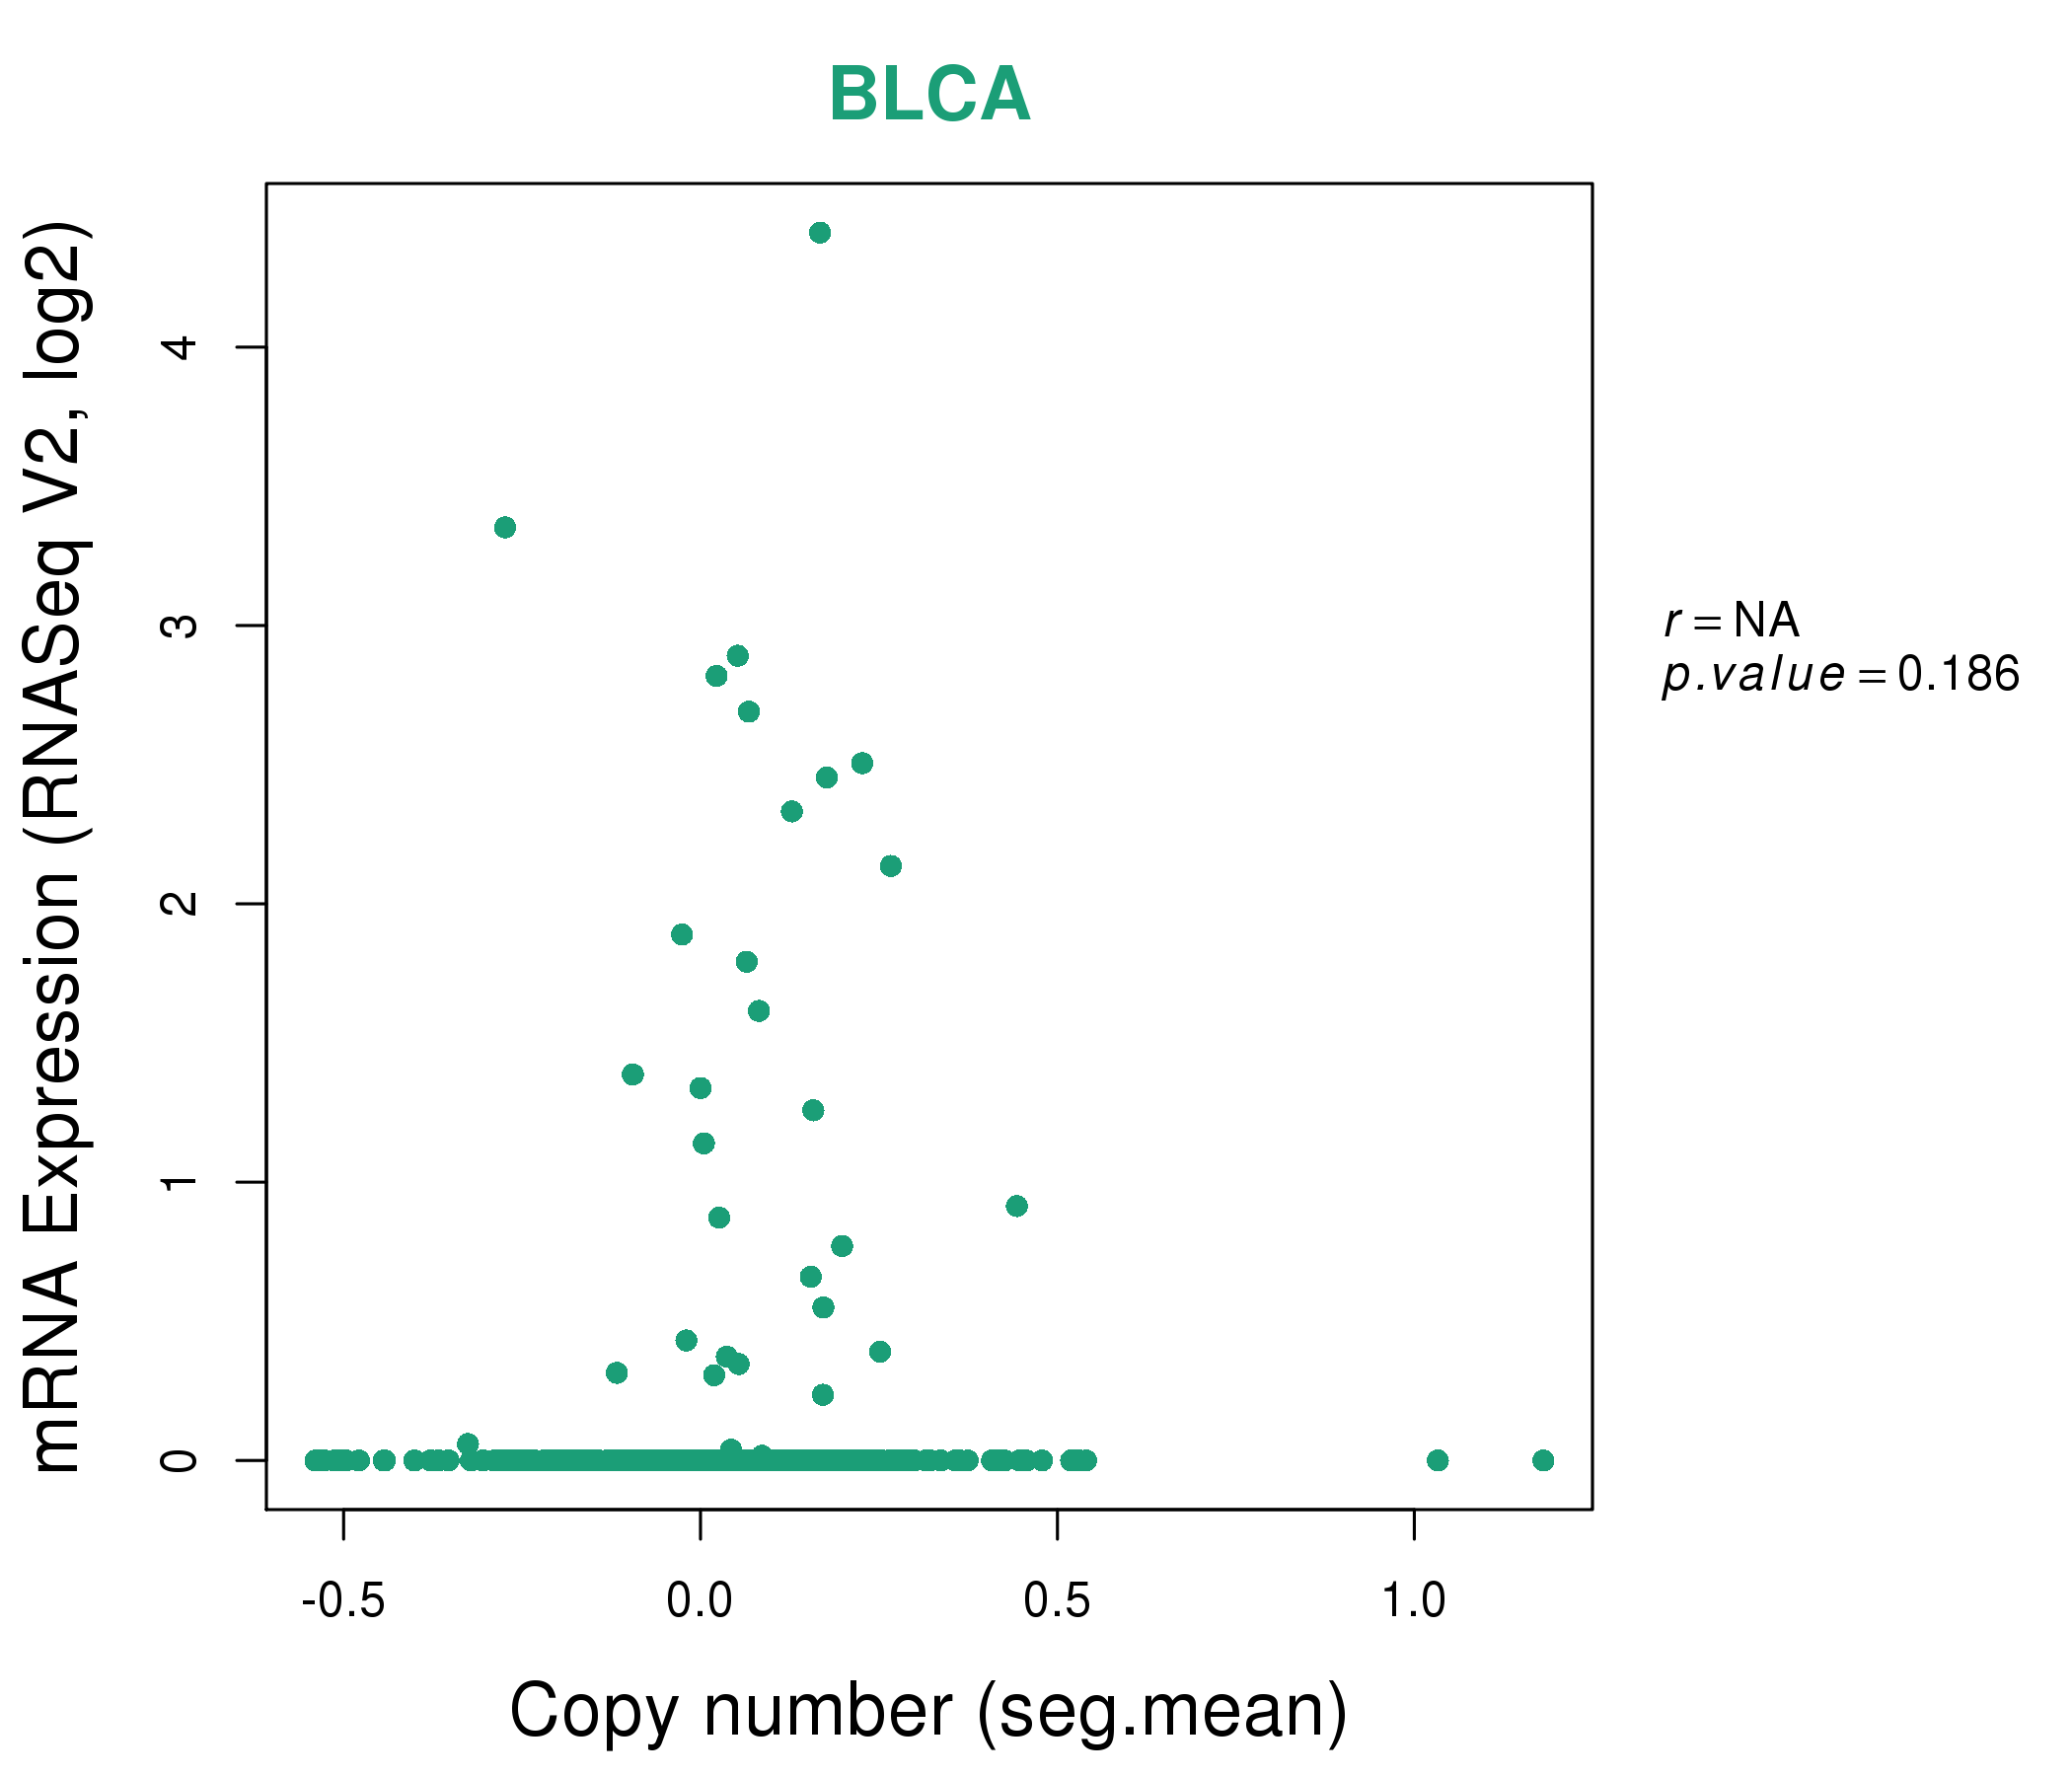
| * This plots show the correlation between CNV and gene expression. |
: Open all plots for all cancer types
 |
|
 |
|
| Top |
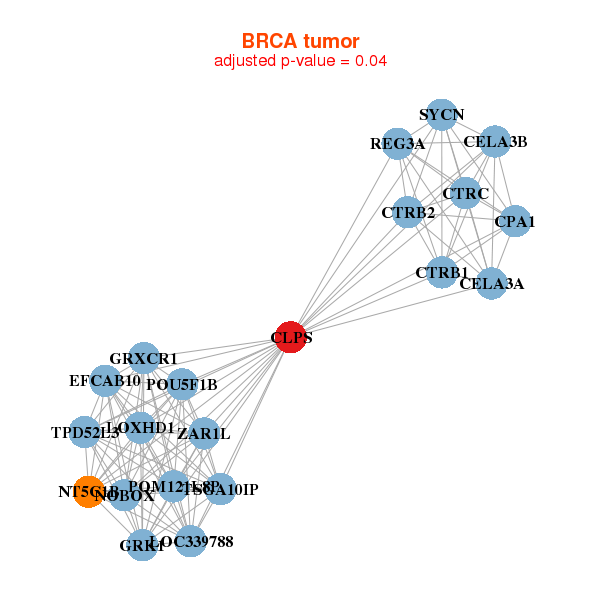
| Gene-Gene Network Information |
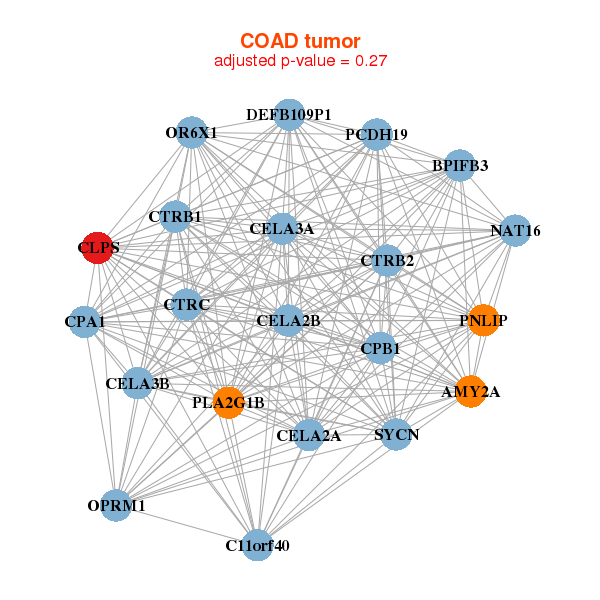
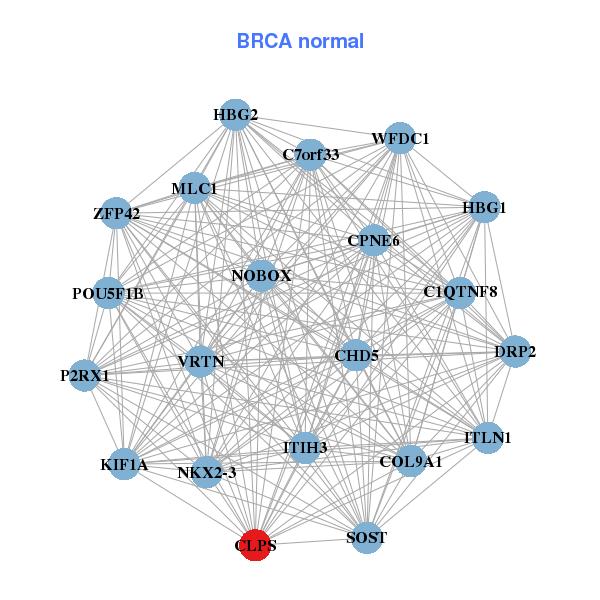
| * Co-Expression network figures were drawn using R package igraph. Only the top 20 genes with the highest correlations were shown. Red circle: input gene, orange circle: cell metabolism gene, sky circle: other gene |
: Open all plots for all cancer types
 |
| ||||
| CELA3A,CELA3B,CLPS,CPA1,CTRB1,CTRB2,CTRC, EFCAB10,GRK1,GRXCR1,LOC339788,LOXHD1,NOBOX,NT5C1B, POM121L8P,POU5F1B,REG3A,SYCN,TPD52L3,TSGA10IP,ZAR1L | VRTN,C1QTNF8,C7orf33,CHD5,CLPS,COL9A1,CPNE6, DRP2,HBG1,HBG2,ITIH3,ITLN1,KIF1A,MLC1, NKX2-3,NOBOX,P2RX1,POU5F1B,SOST,WFDC1,ZFP42 | ||||
 |
| ||||
| AMY2A,C11orf40,BPIFB3,NAT16,CELA2A,CELA2B,CELA3A, CELA3B,CLPS,CPA1,CPB1,CTRB1,CTRB2,CTRC, DEFB109P1,OPRM1,OR6X1,PCDH19,PLA2G1B,PNLIP,SYCN | ANKRD30B,CYP4F30P,SPTSSB,CLPS,CREB3L4,GPR98,HAPLN1, HMGN1,HPVC1,IGFALS,LOC100128023,LOC284578,LRRC36,LYPD6, MFSD6L,PARP8,PAX4,RLN2,TMEFF2,TMEM231,WFDC2 |
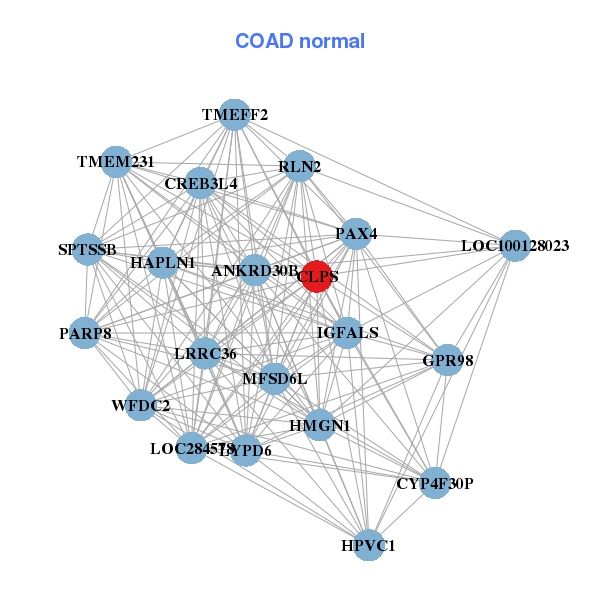
| * Co-Expression network figures were drawn using R package igraph. Only the top 20 genes with the highest correlations were shown. Red circle: input gene, orange circle: cell metabolism gene, sky circle: other gene |
: Open all plots for all cancer types
| Top |
: Open all interacting genes' information including KEGG pathway for all interacting genes from DAVID
| Top |
| Pharmacological Information for CLPS |
| DB Category | DB Name | DB's ID and Url link |
| * Gene Centered Interaction Network. |
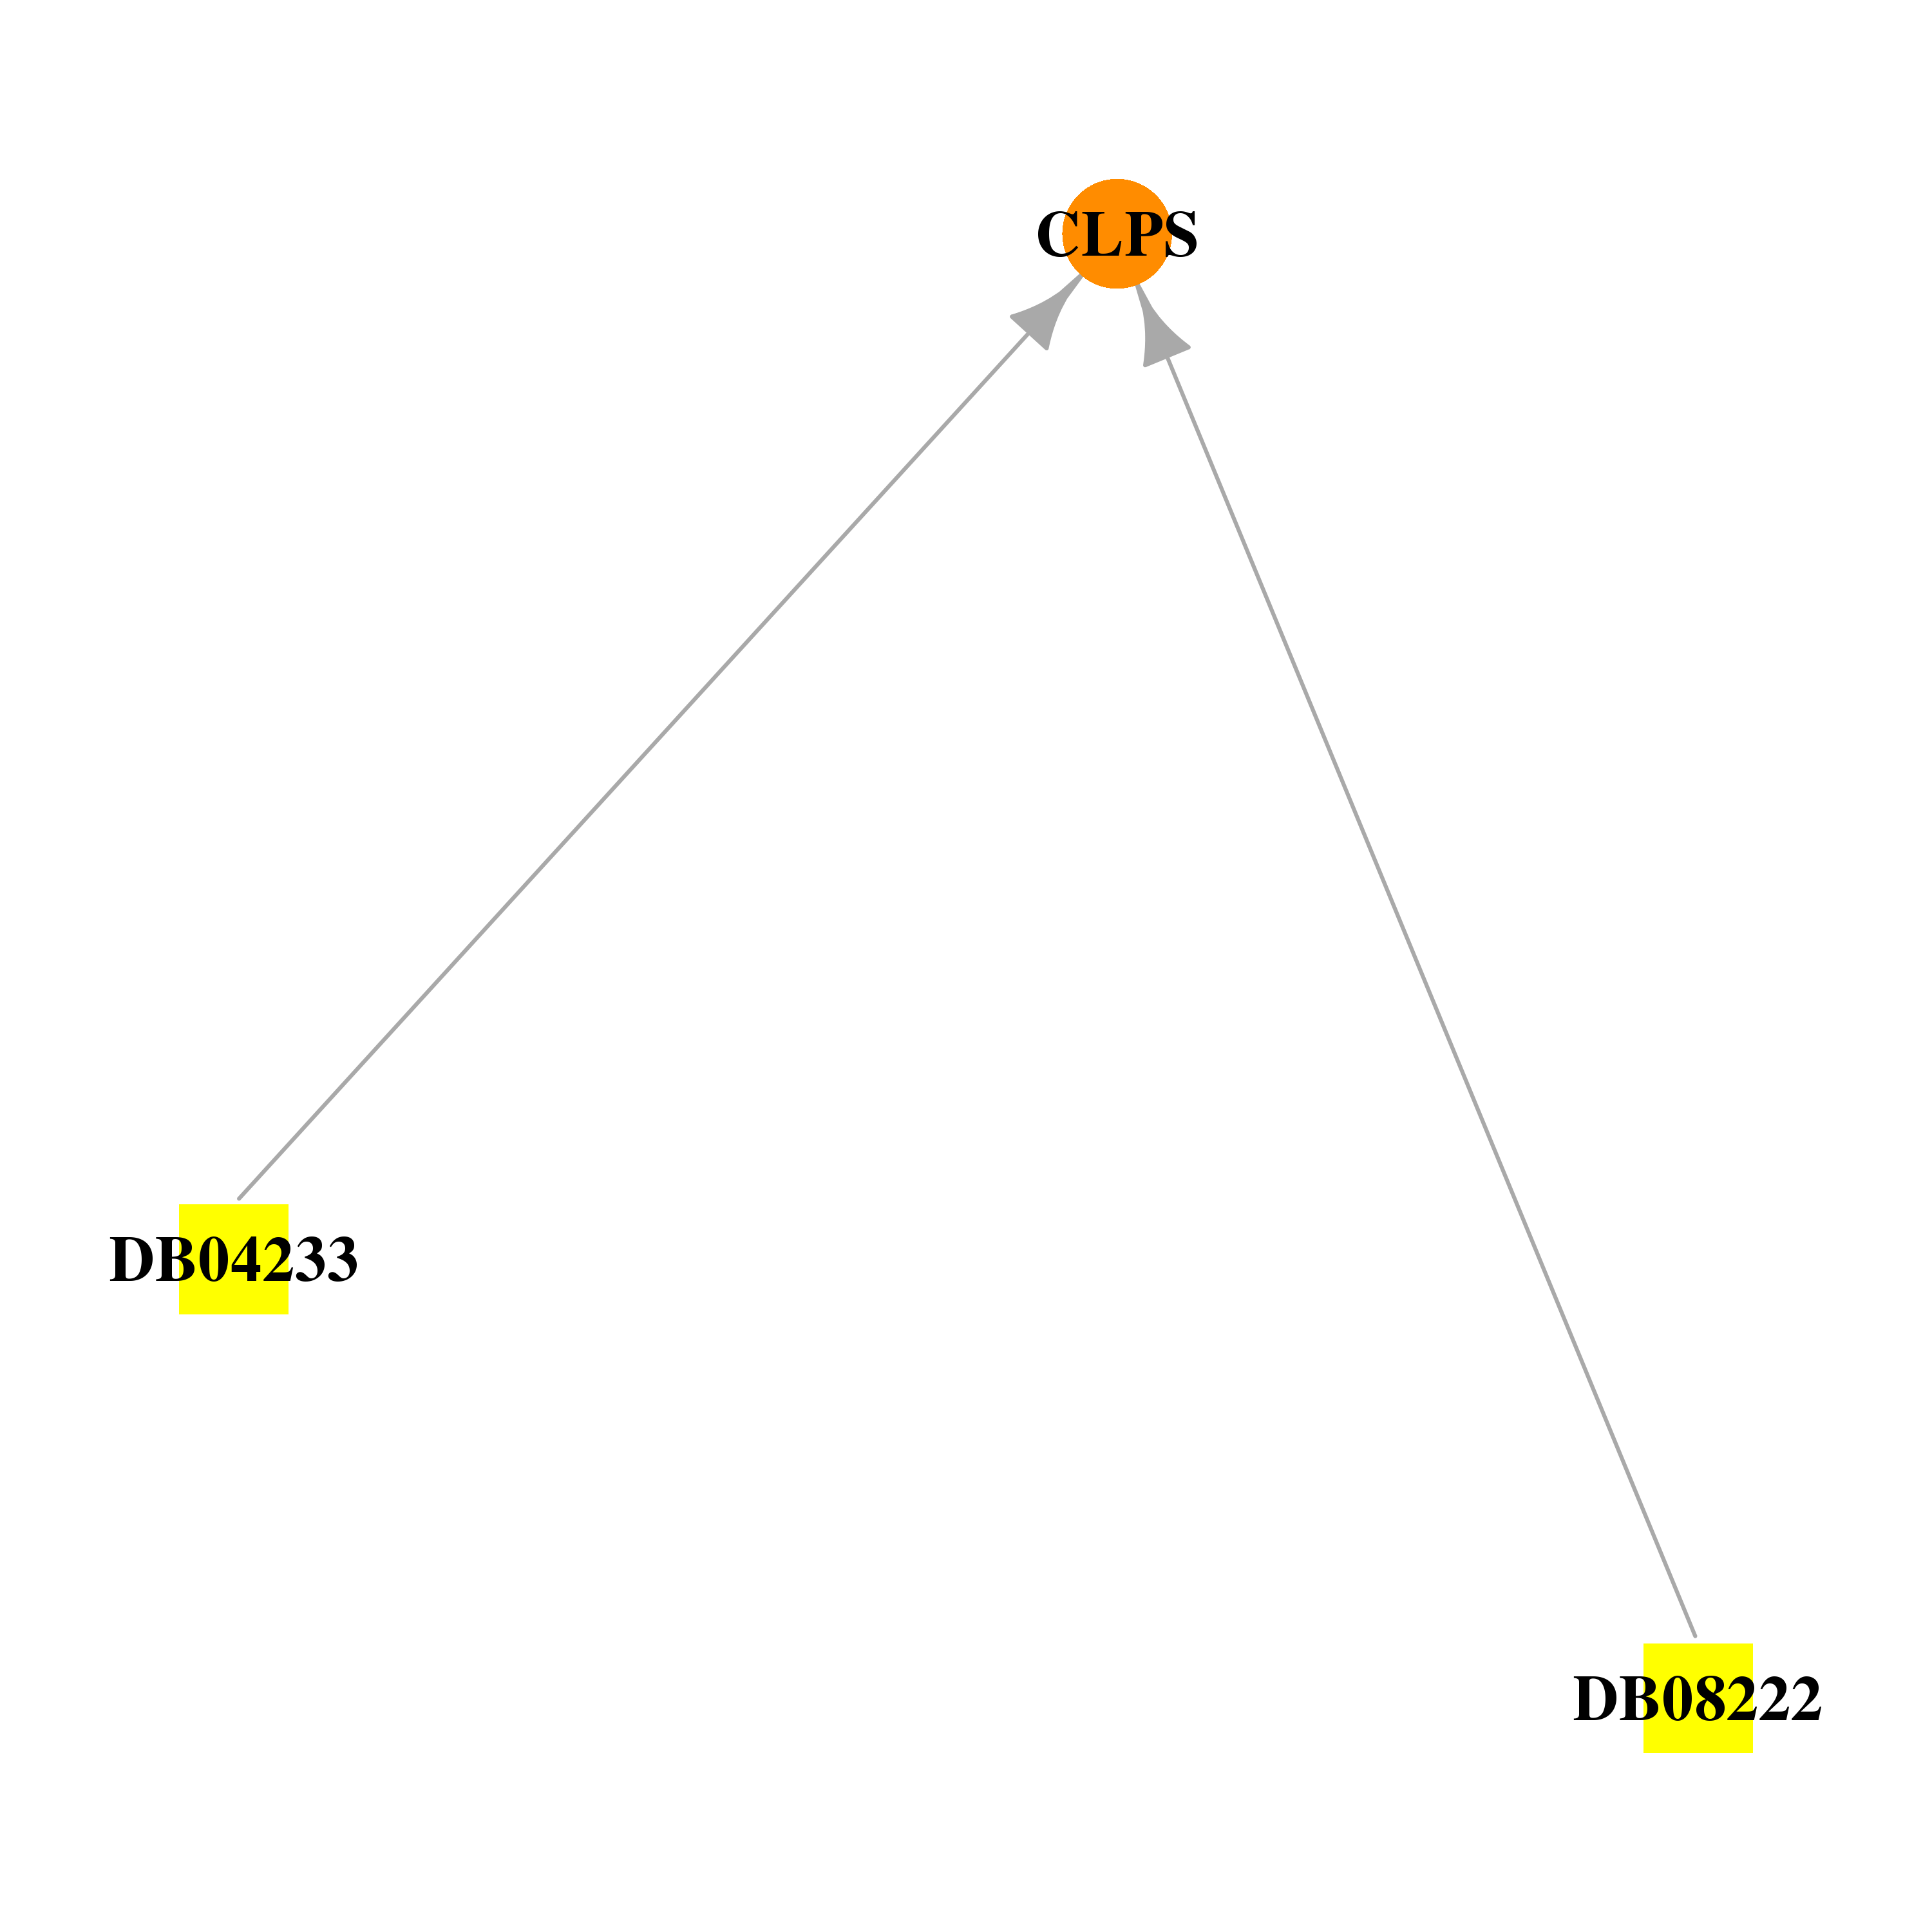 |
| * Drug Centered Interaction Network. |
| DrugBank ID | Target Name | Drug Groups | Generic Name | Drug Centered Network | Drug Structure |
| DB04233 | colipase, pancreatic | experimental | (Hydroxyethyloxy)Tri(Ethyloxy)Octane | 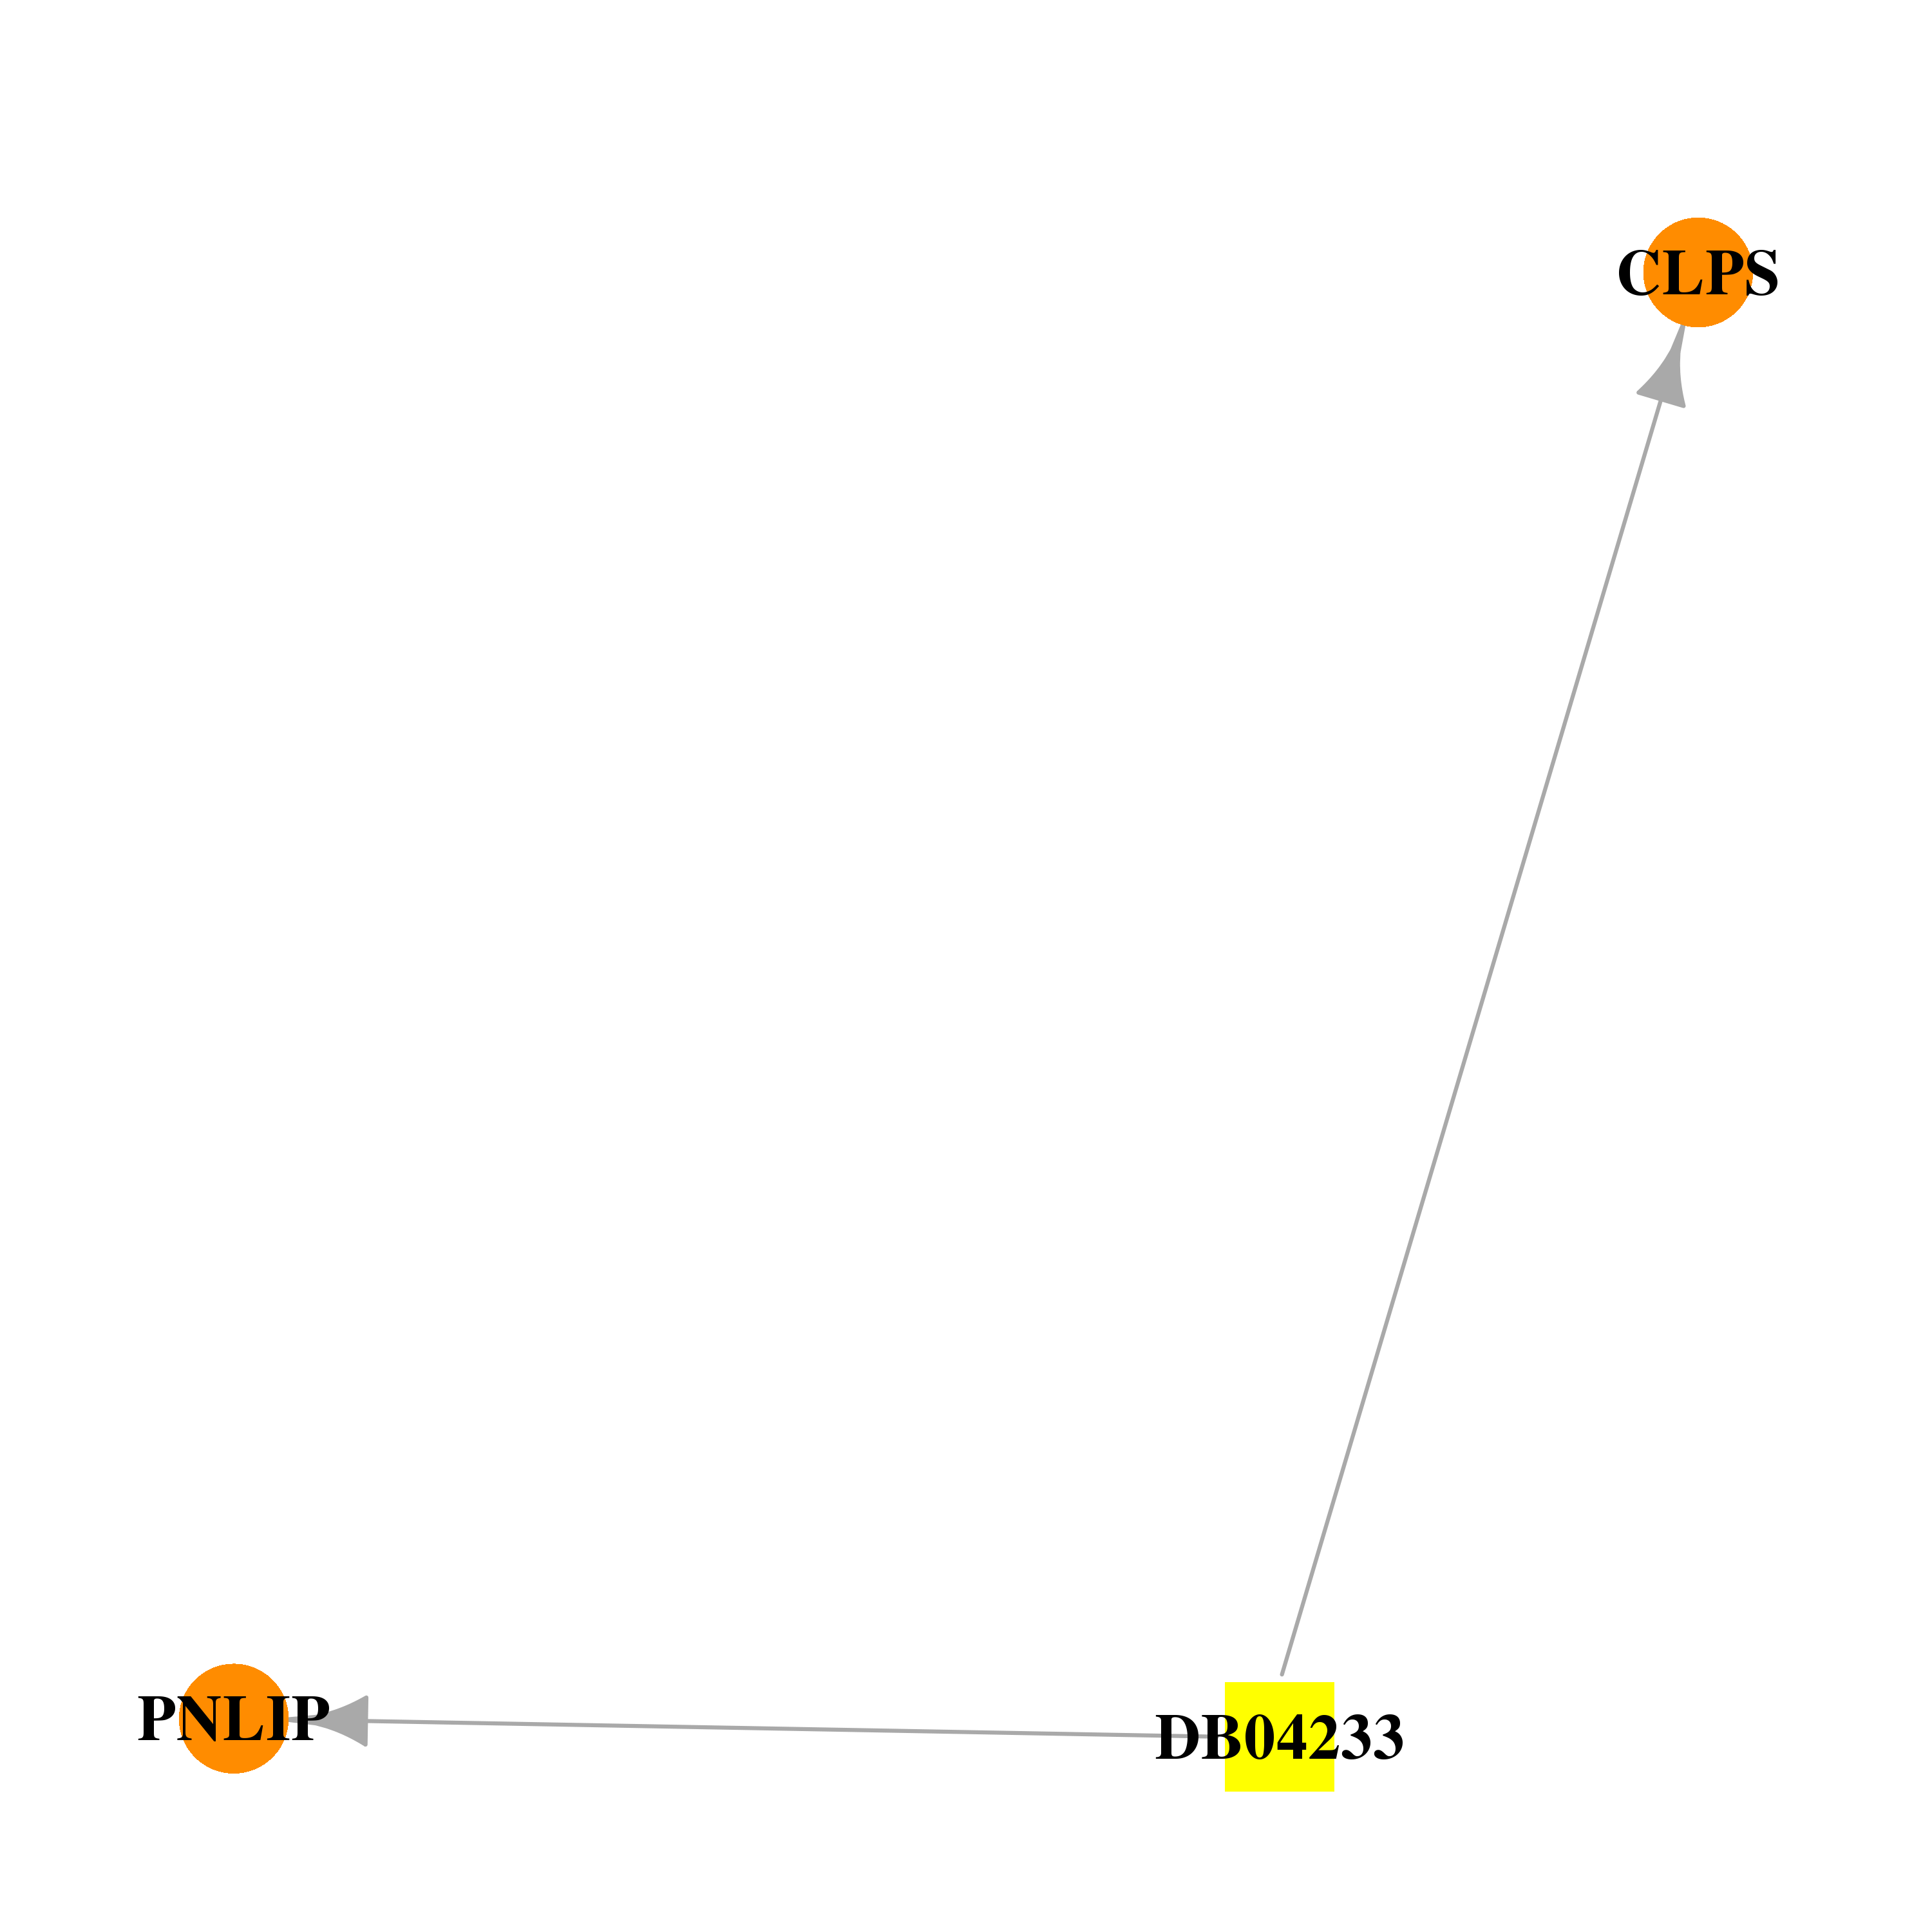 | 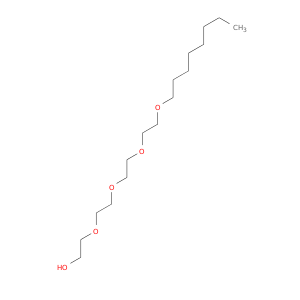 |
| DB08222 | colipase, pancreatic | experimental | METHOXYUNDECYLPHOSPHINIC ACID | 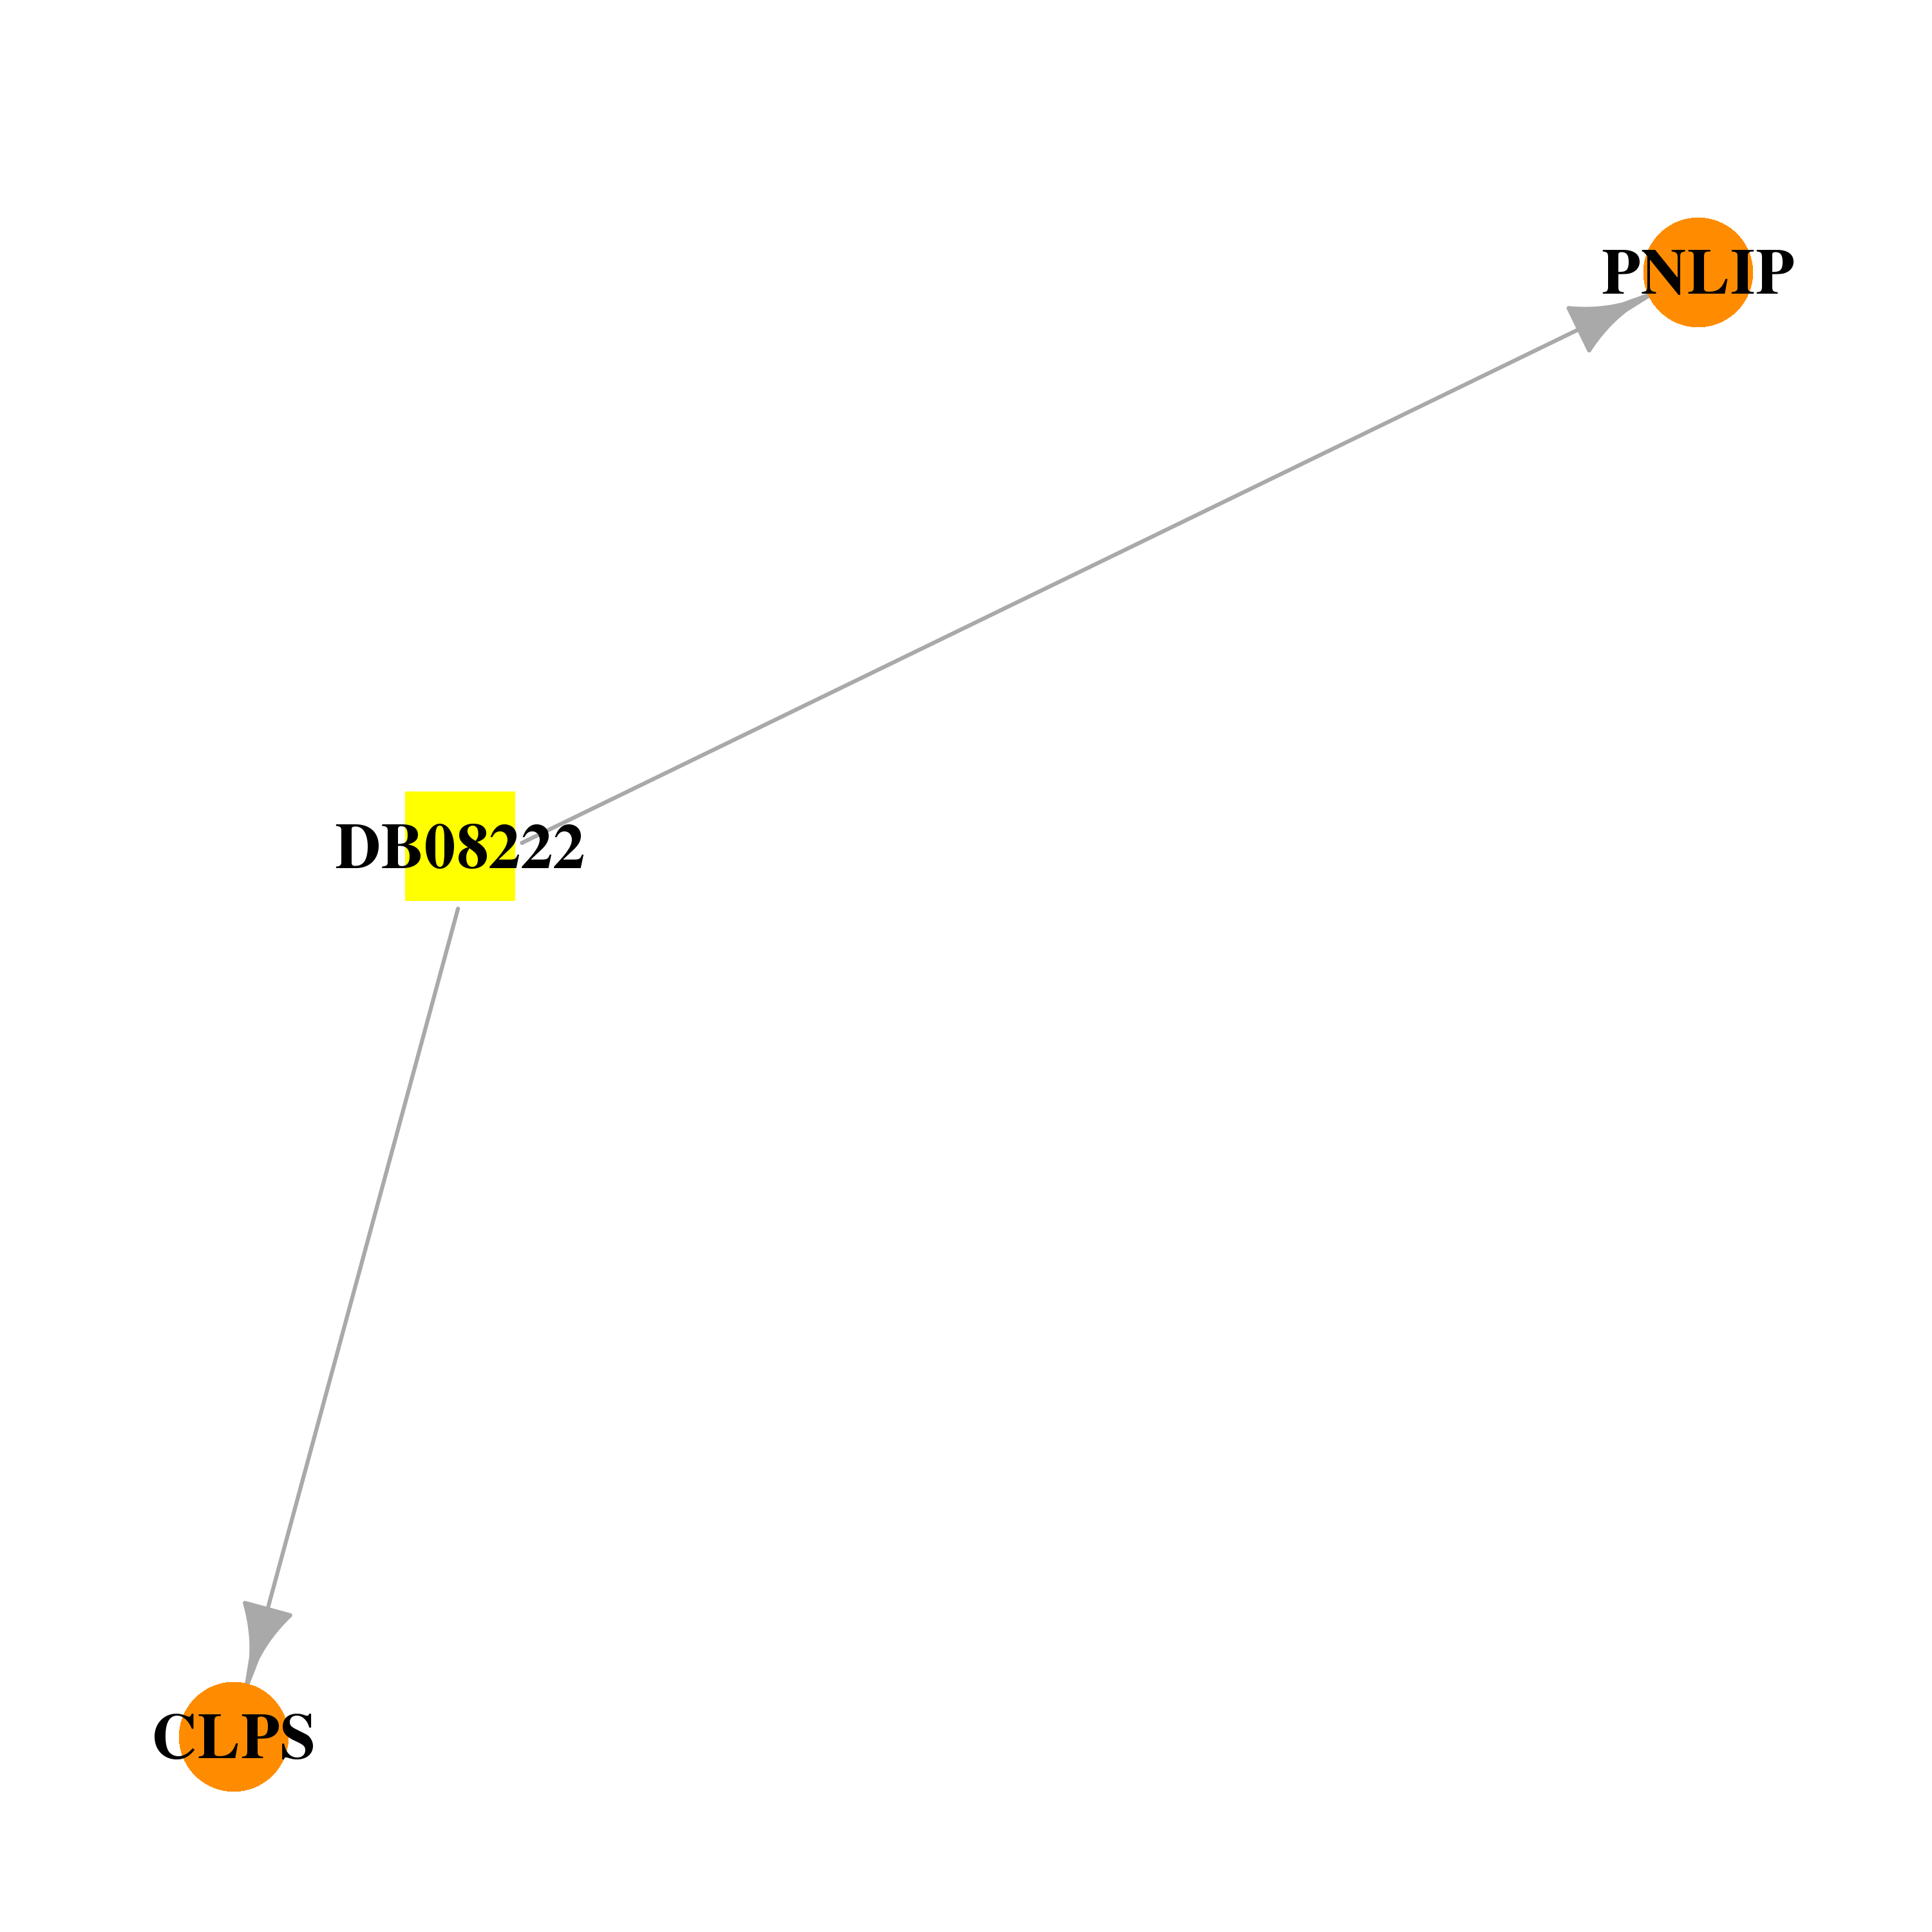 | 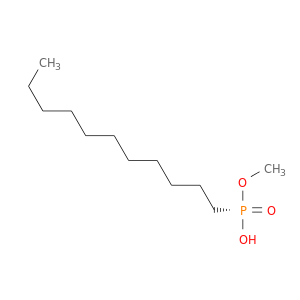 |
| Top |
| Cross referenced IDs for CLPS |
| * We obtained these cross-references from Uniprot database. It covers 150 different DBs, 18 categories. http://www.uniprot.org/help/cross_references_section |
: Open all cross reference information
|
Copyright © 2016-Present - The Univsersity of Texas Health Science Center at Houston @ |