|
||||||||||||||||||||
| |
| Phenotypic Information (metabolism pathway, cancer, disease, phenome) |
| |
| |
| Gene-Gene Network Information: Co-Expression Network, Interacting Genes & KEGG |
| |
|


| Gene Summary for PLD4 |
| Top |
| Phenotypic Information for PLD4(metabolism pathway, cancer, disease, phenome) |
| Cancer | CGAP: PLD4 |
| Familial Cancer Database: PLD4 | |
| * This gene is included in those cancer gene databases. |
|
|
|
|
|
|
| ||||||||||||||
Oncogene 1 | Significant driver gene in | |||||||||||||||||||
| cf) number; DB name 1 Oncogene; http://nar.oxfordjournals.org/content/35/suppl_1/D721.long, 2 Tumor Suppressor gene; https://bioinfo.uth.edu/TSGene/, 3 Cancer Gene Census; http://www.nature.com/nrc/journal/v4/n3/abs/nrc1299.html, 4 CancerGenes; http://nar.oxfordjournals.org/content/35/suppl_1/D721.long, 5 Network of Cancer Gene; http://ncg.kcl.ac.uk/index.php, 1Therapeutic Vulnerabilities in Cancer; http://cbio.mskcc.org/cancergenomics/statius/ |
| REACTOME_PHOSPHOLIPID_METABOLISM REACTOME_METABOLISM_OF_LIPIDS_AND_LIPOPROTEINS | |
| OMIM | |
| Orphanet | |
| Disease | KEGG Disease: PLD4 |
| MedGen: PLD4 (Human Medical Genetics with Condition) | |
| ClinVar: PLD4 | |
| Phenotype | MGI: PLD4 (International Mouse Phenotyping Consortium) |
| PhenomicDB: PLD4 | |
| Mutations for PLD4 |
| * Under tables are showing count per each tissue to give us broad intuition about tissue specific mutation patterns.You can go to the detailed page for each mutation database's web site. |
| There's no structural variation information in COSMIC data for this gene. |
| * From mRNA Sanger sequences, Chitars2.0 arranged chimeric transcripts. This table shows PLD4 related fusion information. |
| ID | Head Gene | Tail Gene | Accession | Gene_a | qStart_a | qEnd_a | Chromosome_a | tStart_a | tEnd_a | Gene_a | qStart_a | qEnd_a | Chromosome_a | tStart_a | tEnd_a |
| Top |
| There's no copy number variation information in COSMIC data for this gene. |
| Top |
|
 |
| Top |
| Stat. for Non-Synonymous SNVs (# total SNVs=24) | (# total SNVs=8) |
 |  |
(# total SNVs=1) | (# total SNVs=0) |
 |
| Top |
| * When you move the cursor on each content, you can see more deailed mutation information on the Tooltip. Those are primary_site,primary_histology,mutation(aa),pubmedID. |
| GRCh37 position | Mutation(aa) | Unique sampleID count |
| chr14:105397224-105397224 | p.R271H | 3 |
| chr14:105395273-105395273 | p.? | 2 |
| chr14:105396392-105396392 | p.R206W | 2 |
| chr14:105394088-105394088 | p.P40T | 1 |
| chr14:105398141-105398141 | p.L308L | 1 |
| chr14:105399139-105399139 | p.T436T | 1 |
| chr14:105396438-105396438 | p.T221M | 1 |
| chr14:105394089-105394089 | p.P40L | 1 |
| chr14:105398157-105398157 | p.A314T | 1 |
| chr14:105395279-105395279 | p.? | 1 |
| Top |
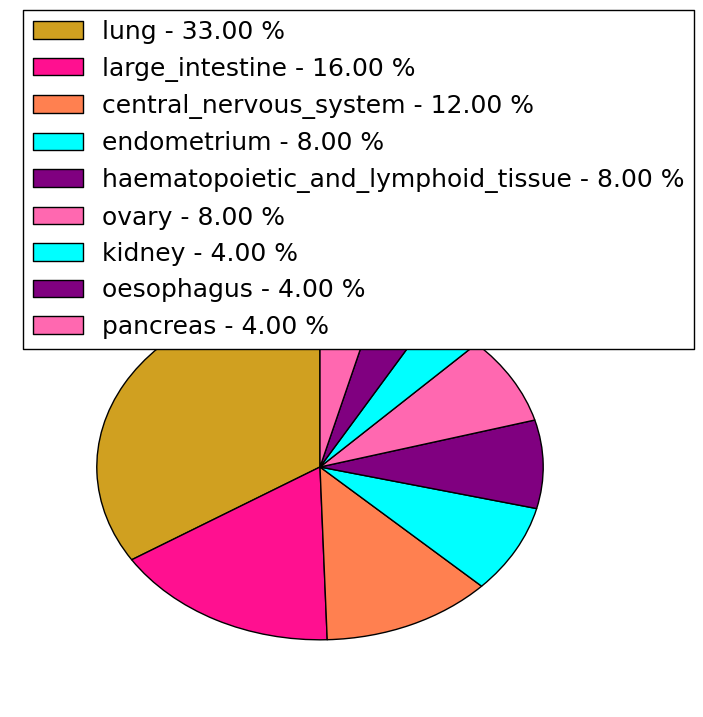
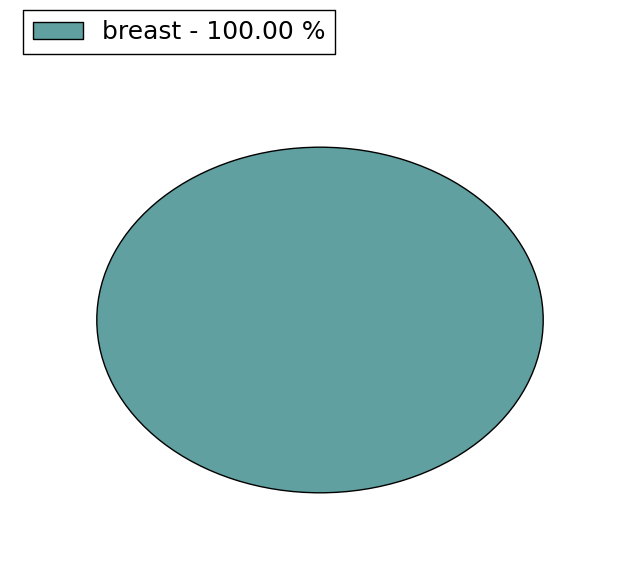
|
 |
| Point Mutation/ Tissue ID | 1 | 2 | 3 | 4 | 5 | 6 | 7 | 8 | 9 | 10 | 11 | 12 | 13 | 14 | 15 | 16 | 17 | 18 | 19 | 20 |
| # sample | 3 | 2 | 3 | 1 | 4 | 4 | 3 | 2 | 3 | |||||||||||
| # mutation | 3 | 2 | 3 | 1 | 4 | 4 | 4 | 2 | 3 | |||||||||||
| nonsynonymous SNV | 1 | 1 | 2 | 1 | 2 | 3 | 3 | 1 | 2 | |||||||||||
| synonymous SNV | 2 | 1 | 1 | 2 | 1 | 1 | 1 | 1 |
| cf) Tissue ID; Tissue type (1; BLCA[Bladder Urothelial Carcinoma], 2; BRCA[Breast invasive carcinoma], 3; CESC[Cervical squamous cell carcinoma and endocervical adenocarcinoma], 4; COAD[Colon adenocarcinoma], 5; GBM[Glioblastoma multiforme], 6; Glioma Low Grade, 7; HNSC[Head and Neck squamous cell carcinoma], 8; KICH[Kidney Chromophobe], 9; KIRC[Kidney renal clear cell carcinoma], 10; KIRP[Kidney renal papillary cell carcinoma], 11; LAML[Acute Myeloid Leukemia], 12; LUAD[Lung adenocarcinoma], 13; LUSC[Lung squamous cell carcinoma], 14; OV[Ovarian serous cystadenocarcinoma ], 15; PAAD[Pancreatic adenocarcinoma], 16; PRAD[Prostate adenocarcinoma], 17; SKCM[Skin Cutaneous Melanoma], 18:STAD[Stomach adenocarcinoma], 19:THCA[Thyroid carcinoma], 20:UCEC[Uterine Corpus Endometrial Carcinoma]) |
| Top |
| * We represented just top 10 SNVs. When you move the cursor on each content, you can see more deailed mutation information on the Tooltip. Those are primary_site, primary_histology, mutation(aa), pubmedID. |
| Genomic Position | Mutation(aa) | Unique sampleID count |
| chr14:105394092 | p.I247I | 1 |
| chr14:105397140 | p.T453T | 1 |
| chr14:105398445 | p.H252H | 1 |
| chr14:105394151 | p.V473M | 1 |
| chr14:105397201 | p.T260I | 1 |
| chr14:105398476 | p.Q280Q | 1 |
| chr14:105395177 | p.R288P | 1 |
| chr14:105397224 | p.P291T | 1 |
| chr14:105399118 | p.T301I | 1 |
| chr14:105395231 | p.P58L | 1 |
| * Copy number data were extracted from TCGA using R package TCGA-Assembler. The URLs of all public data files on TCGA DCC data server were gathered on Jan-05-2015. Function ProcessCNAData in TCGA-Assembler package was used to obtain gene-level copy number value which is calculated as the average copy number of the genomic region of a gene. |
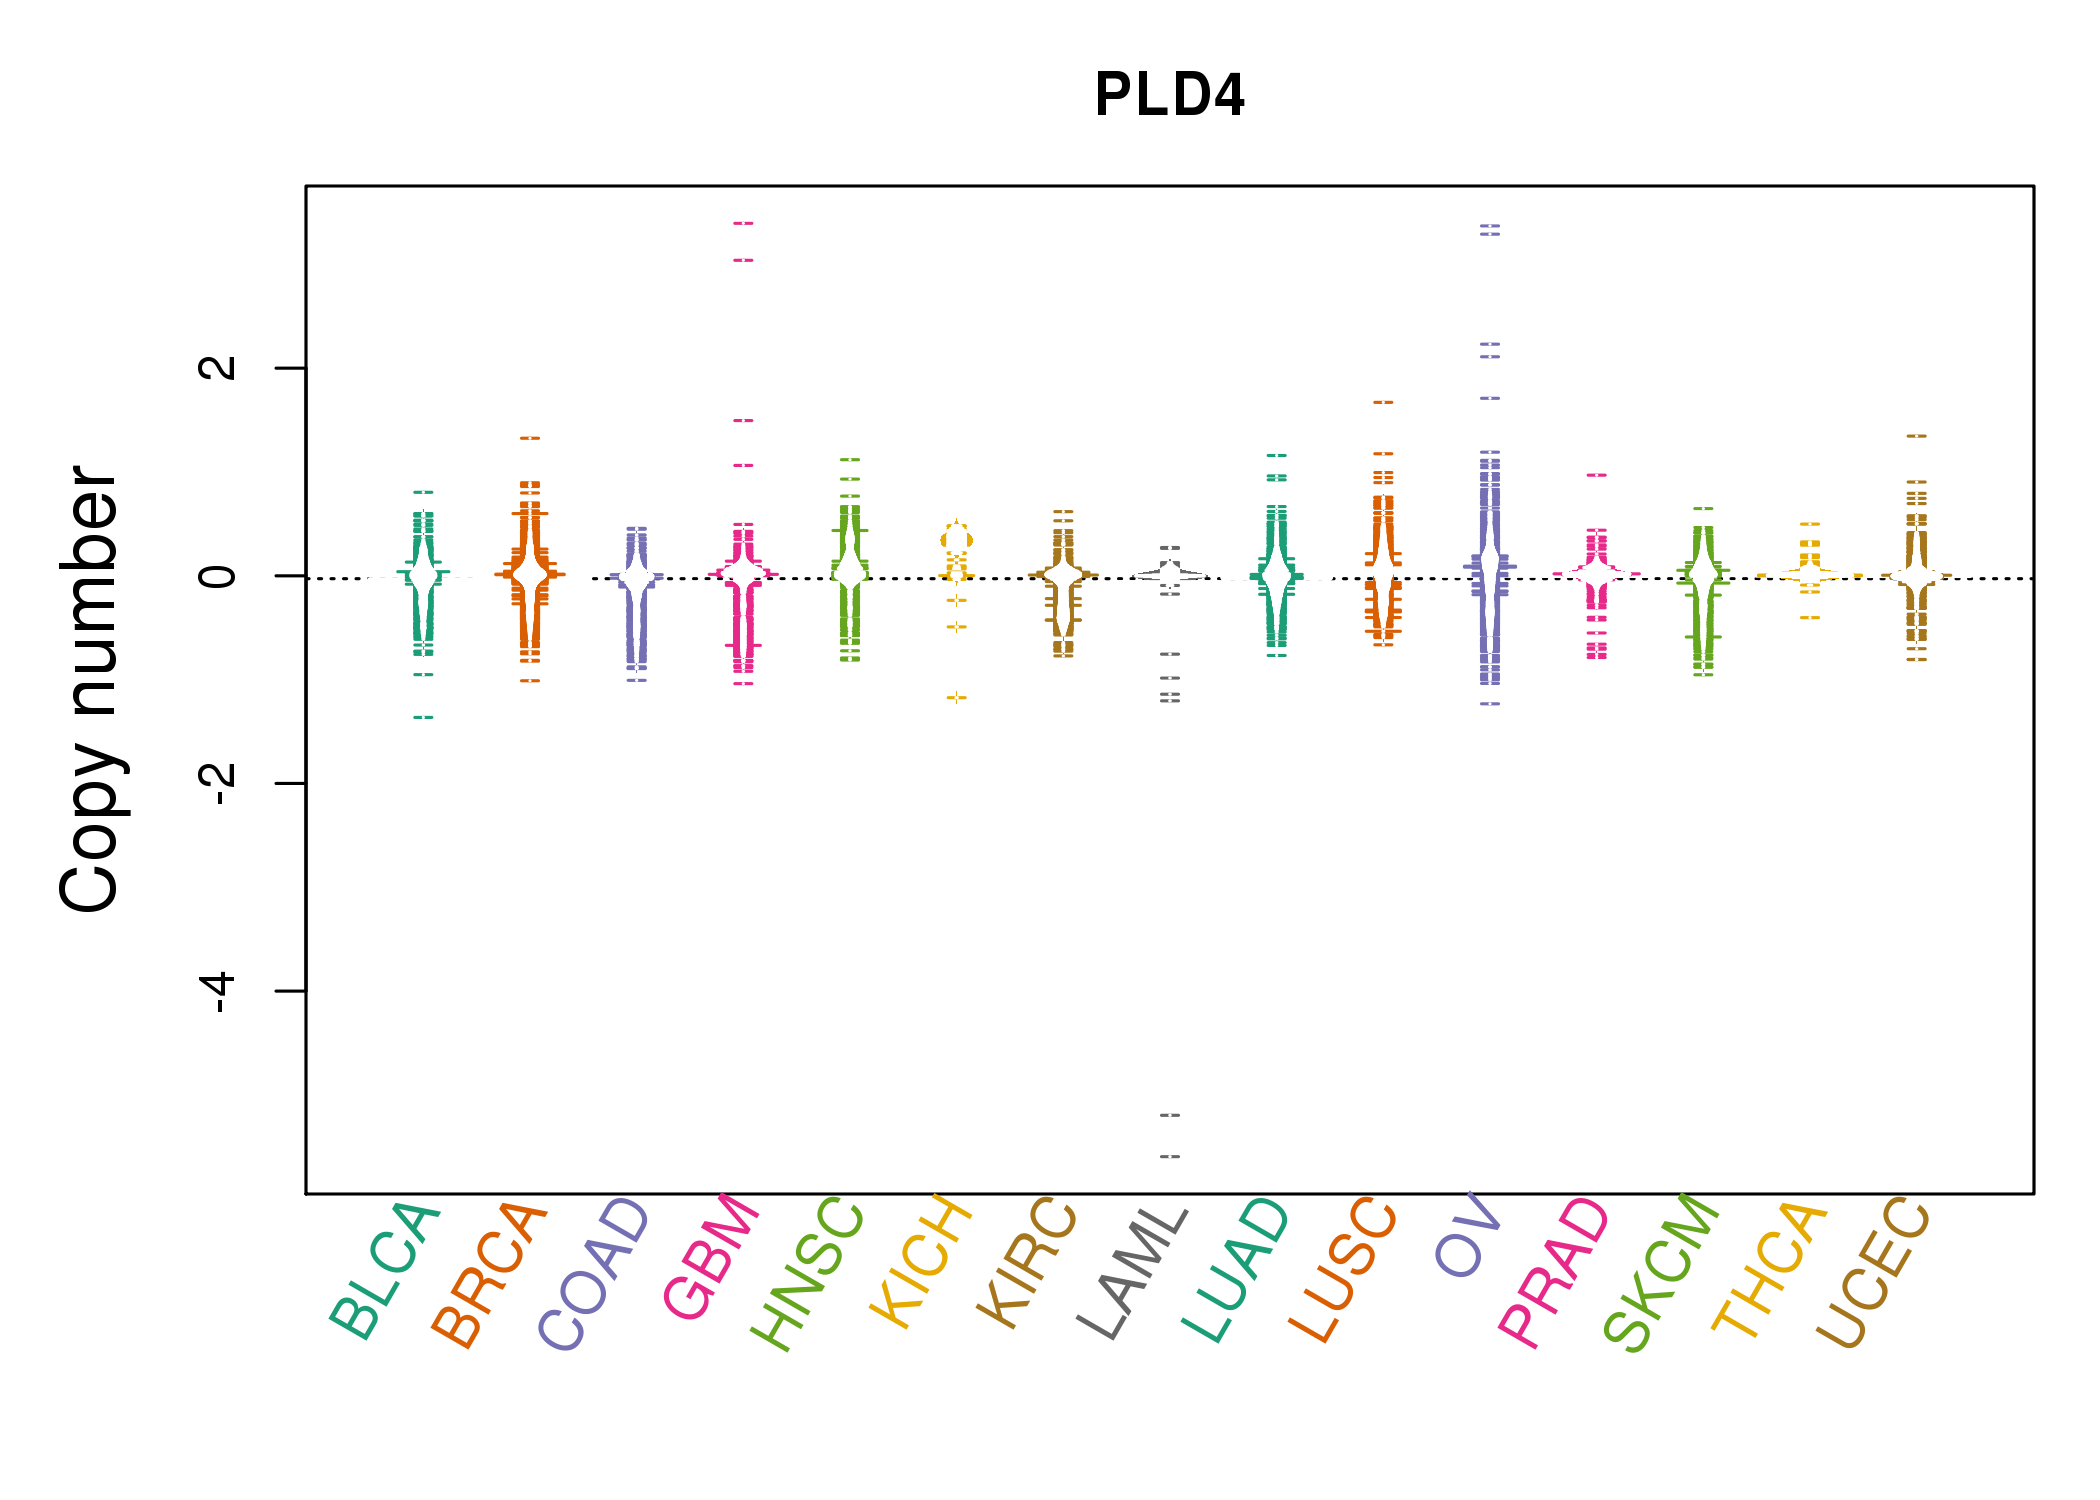 |
| cf) Tissue ID[Tissue type]: BLCA[Bladder Urothelial Carcinoma], BRCA[Breast invasive carcinoma], CESC[Cervical squamous cell carcinoma and endocervical adenocarcinoma], COAD[Colon adenocarcinoma], GBM[Glioblastoma multiforme], Glioma Low Grade, HNSC[Head and Neck squamous cell carcinoma], KICH[Kidney Chromophobe], KIRC[Kidney renal clear cell carcinoma], KIRP[Kidney renal papillary cell carcinoma], LAML[Acute Myeloid Leukemia], LUAD[Lung adenocarcinoma], LUSC[Lung squamous cell carcinoma], OV[Ovarian serous cystadenocarcinoma ], PAAD[Pancreatic adenocarcinoma], PRAD[Prostate adenocarcinoma], SKCM[Skin Cutaneous Melanoma], STAD[Stomach adenocarcinoma], THCA[Thyroid carcinoma], UCEC[Uterine Corpus Endometrial Carcinoma] |
| Top |
| Gene Expression for PLD4 |
| * CCLE gene expression data were extracted from CCLE_Expression_Entrez_2012-10-18.res: Gene-centric RMA-normalized mRNA expression data. |
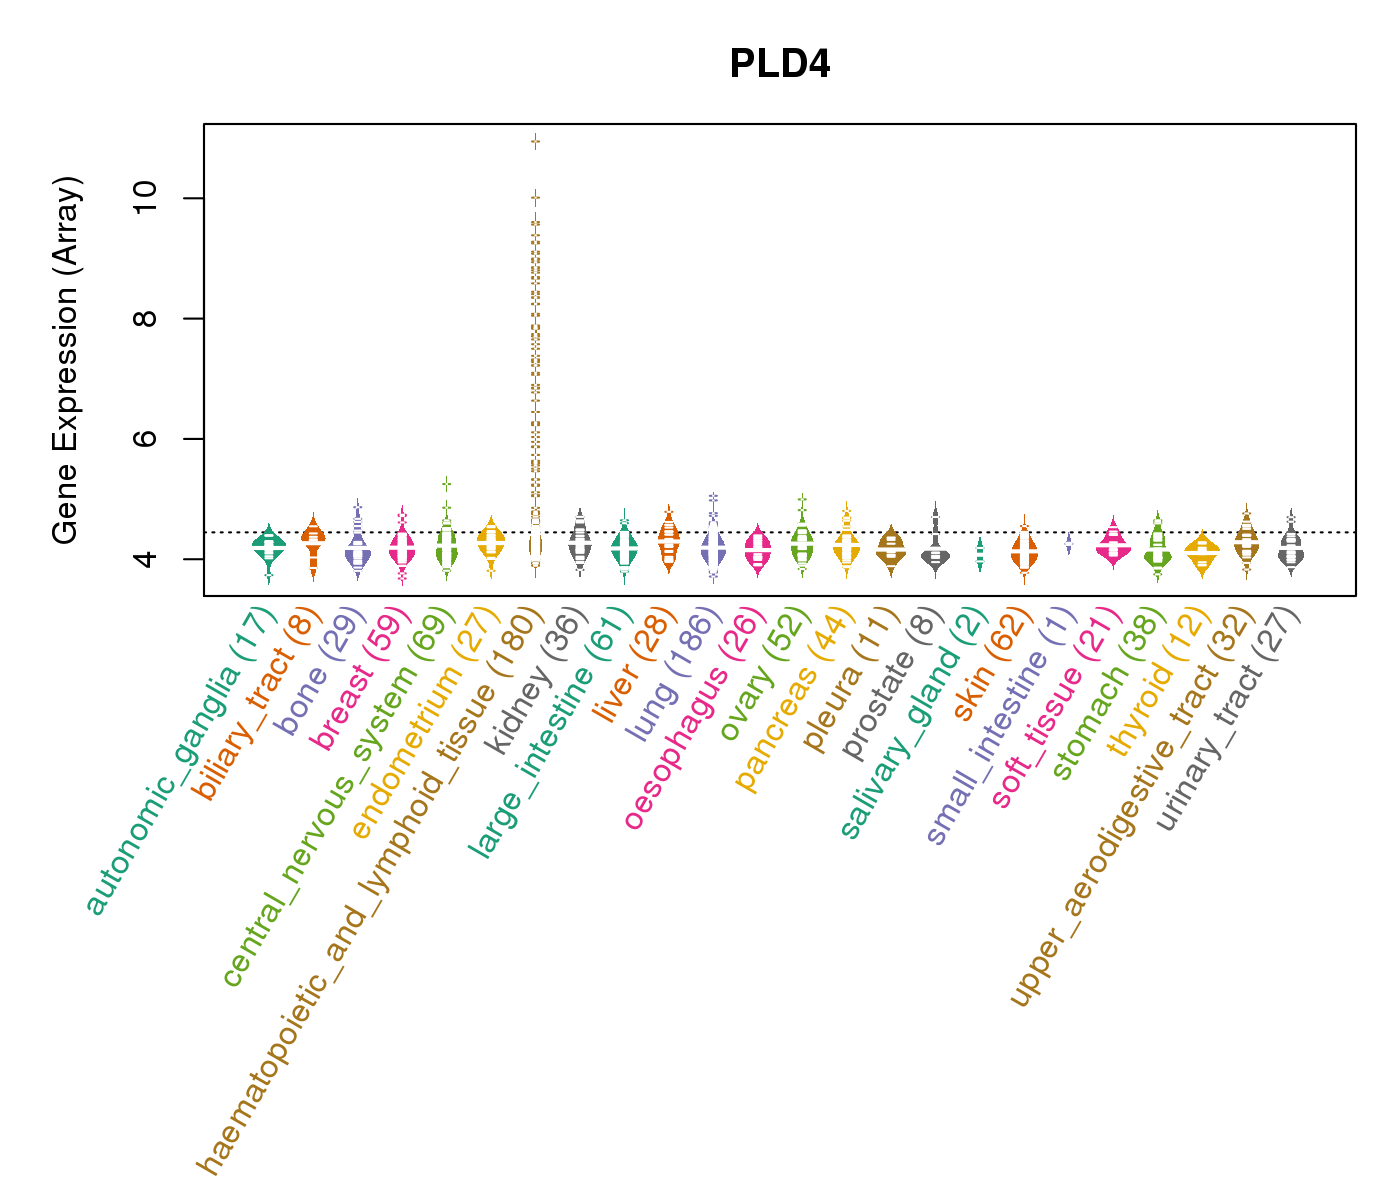 |
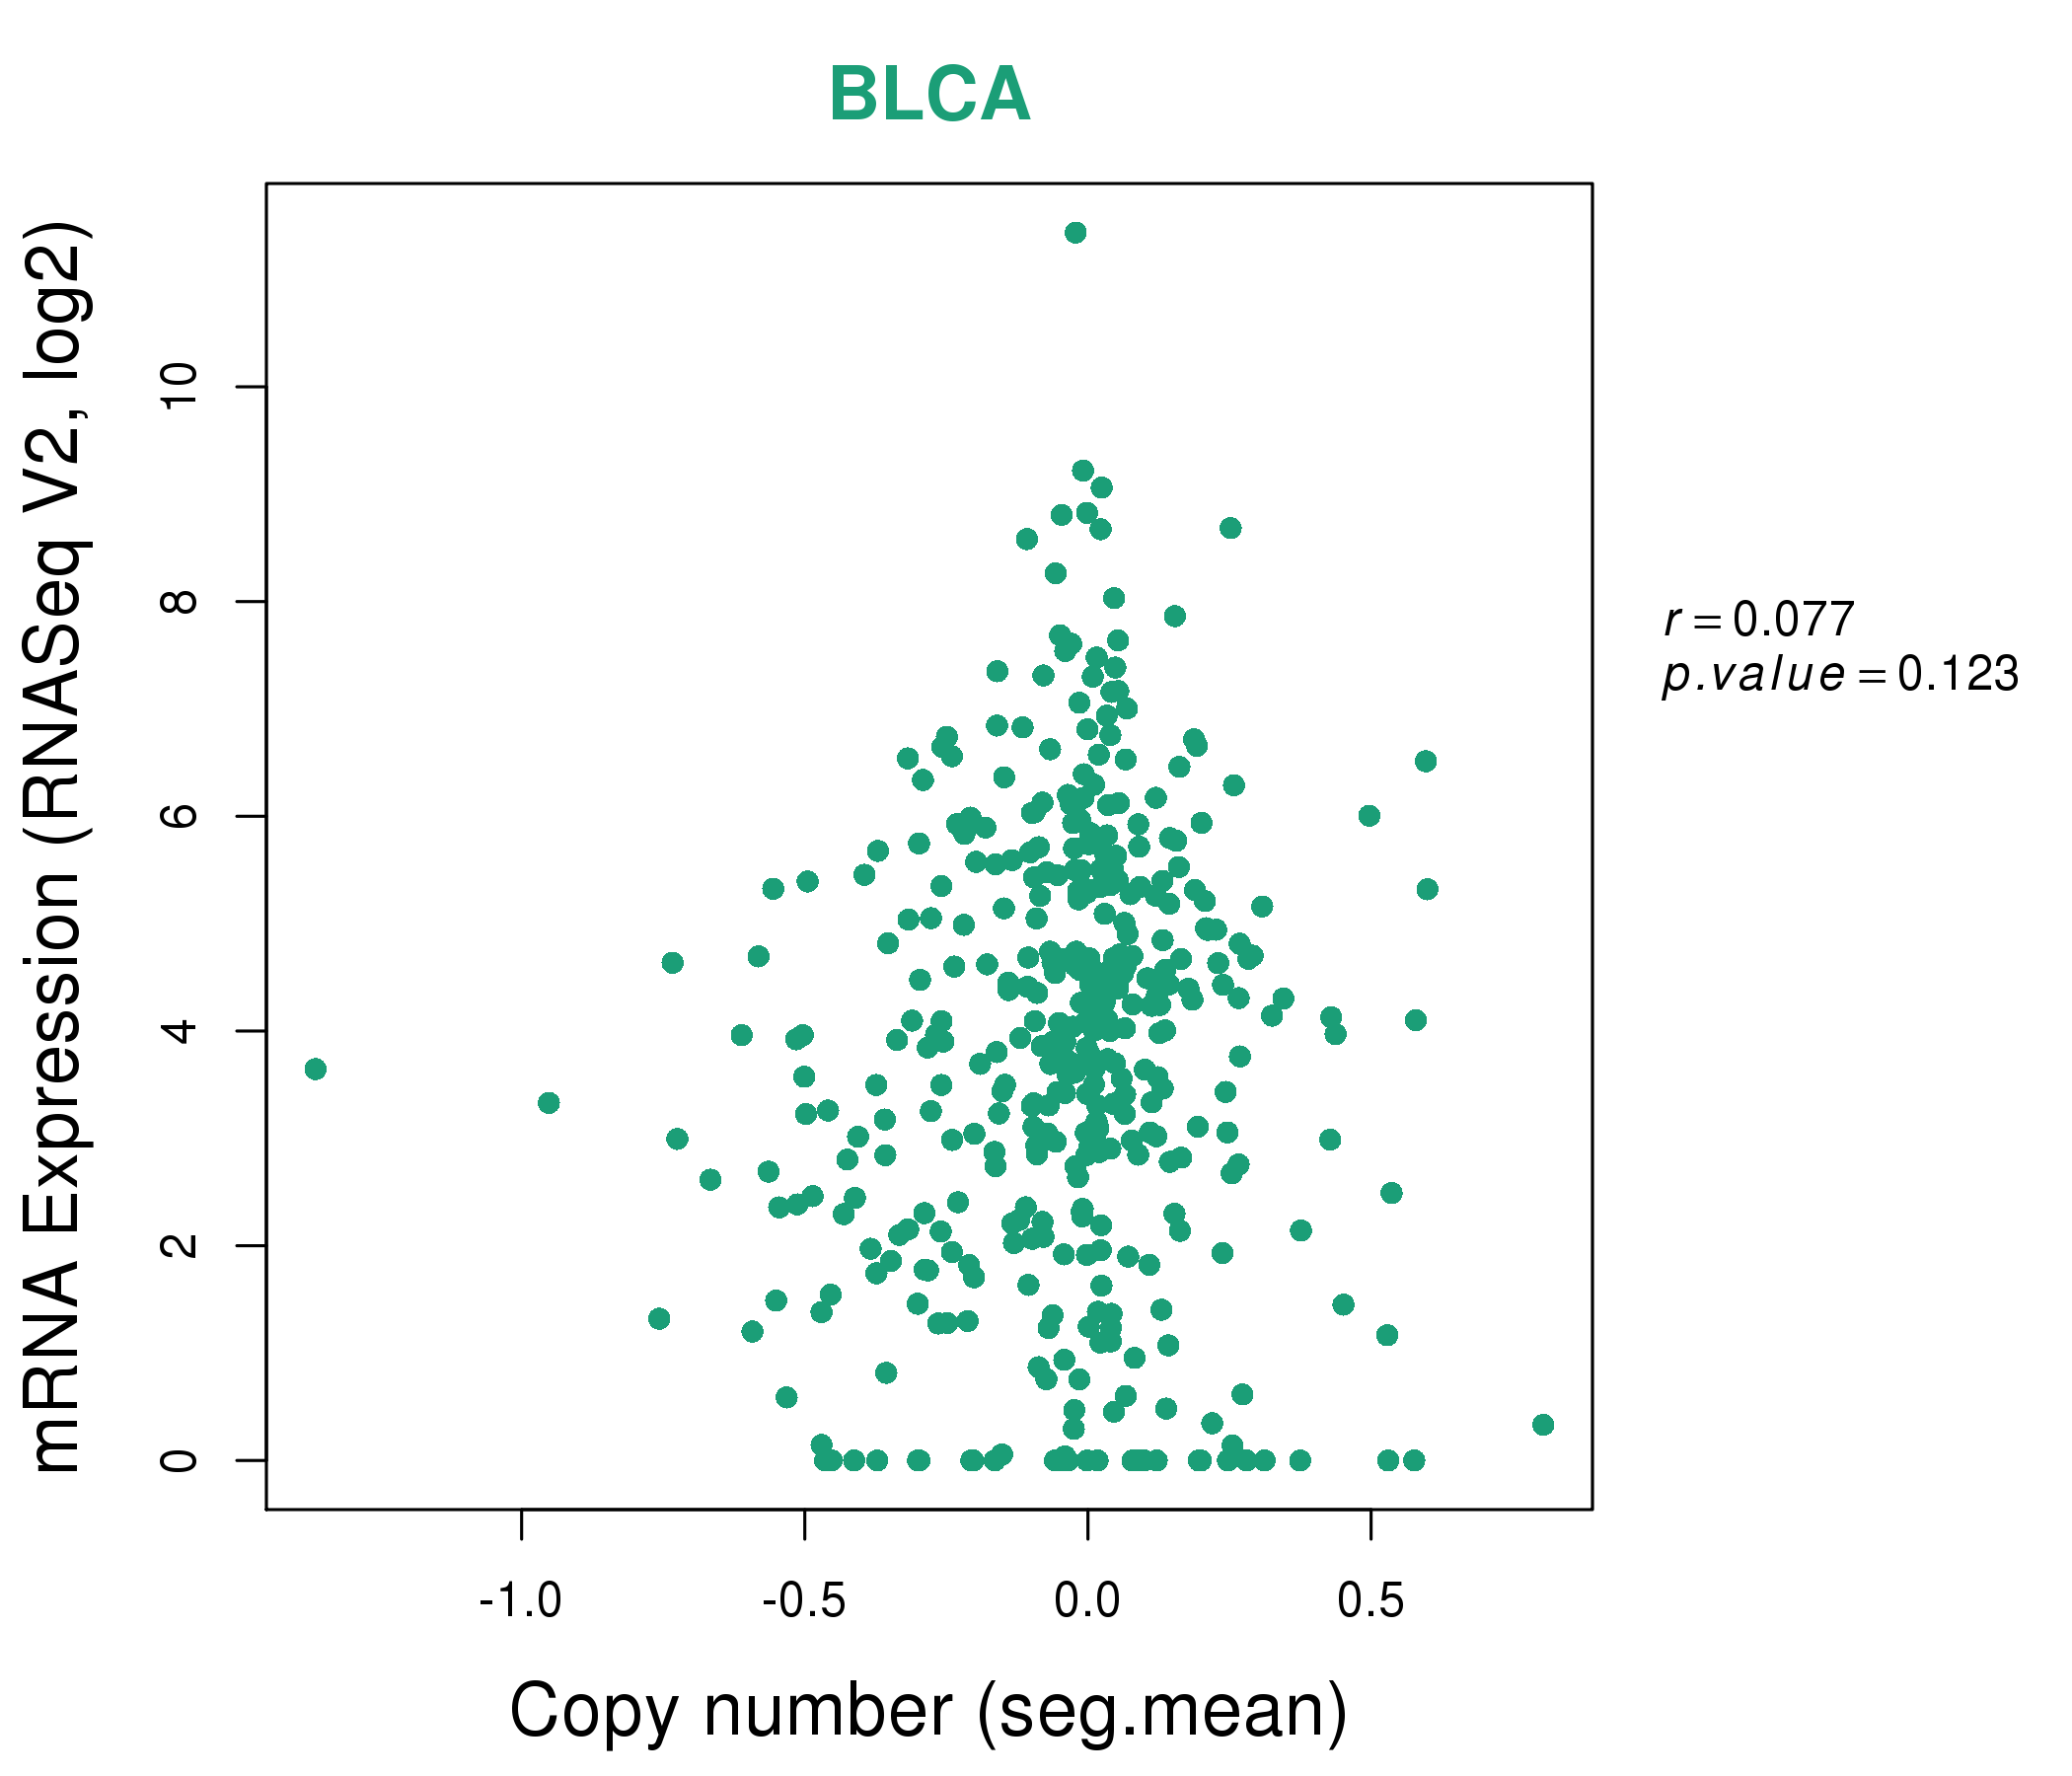
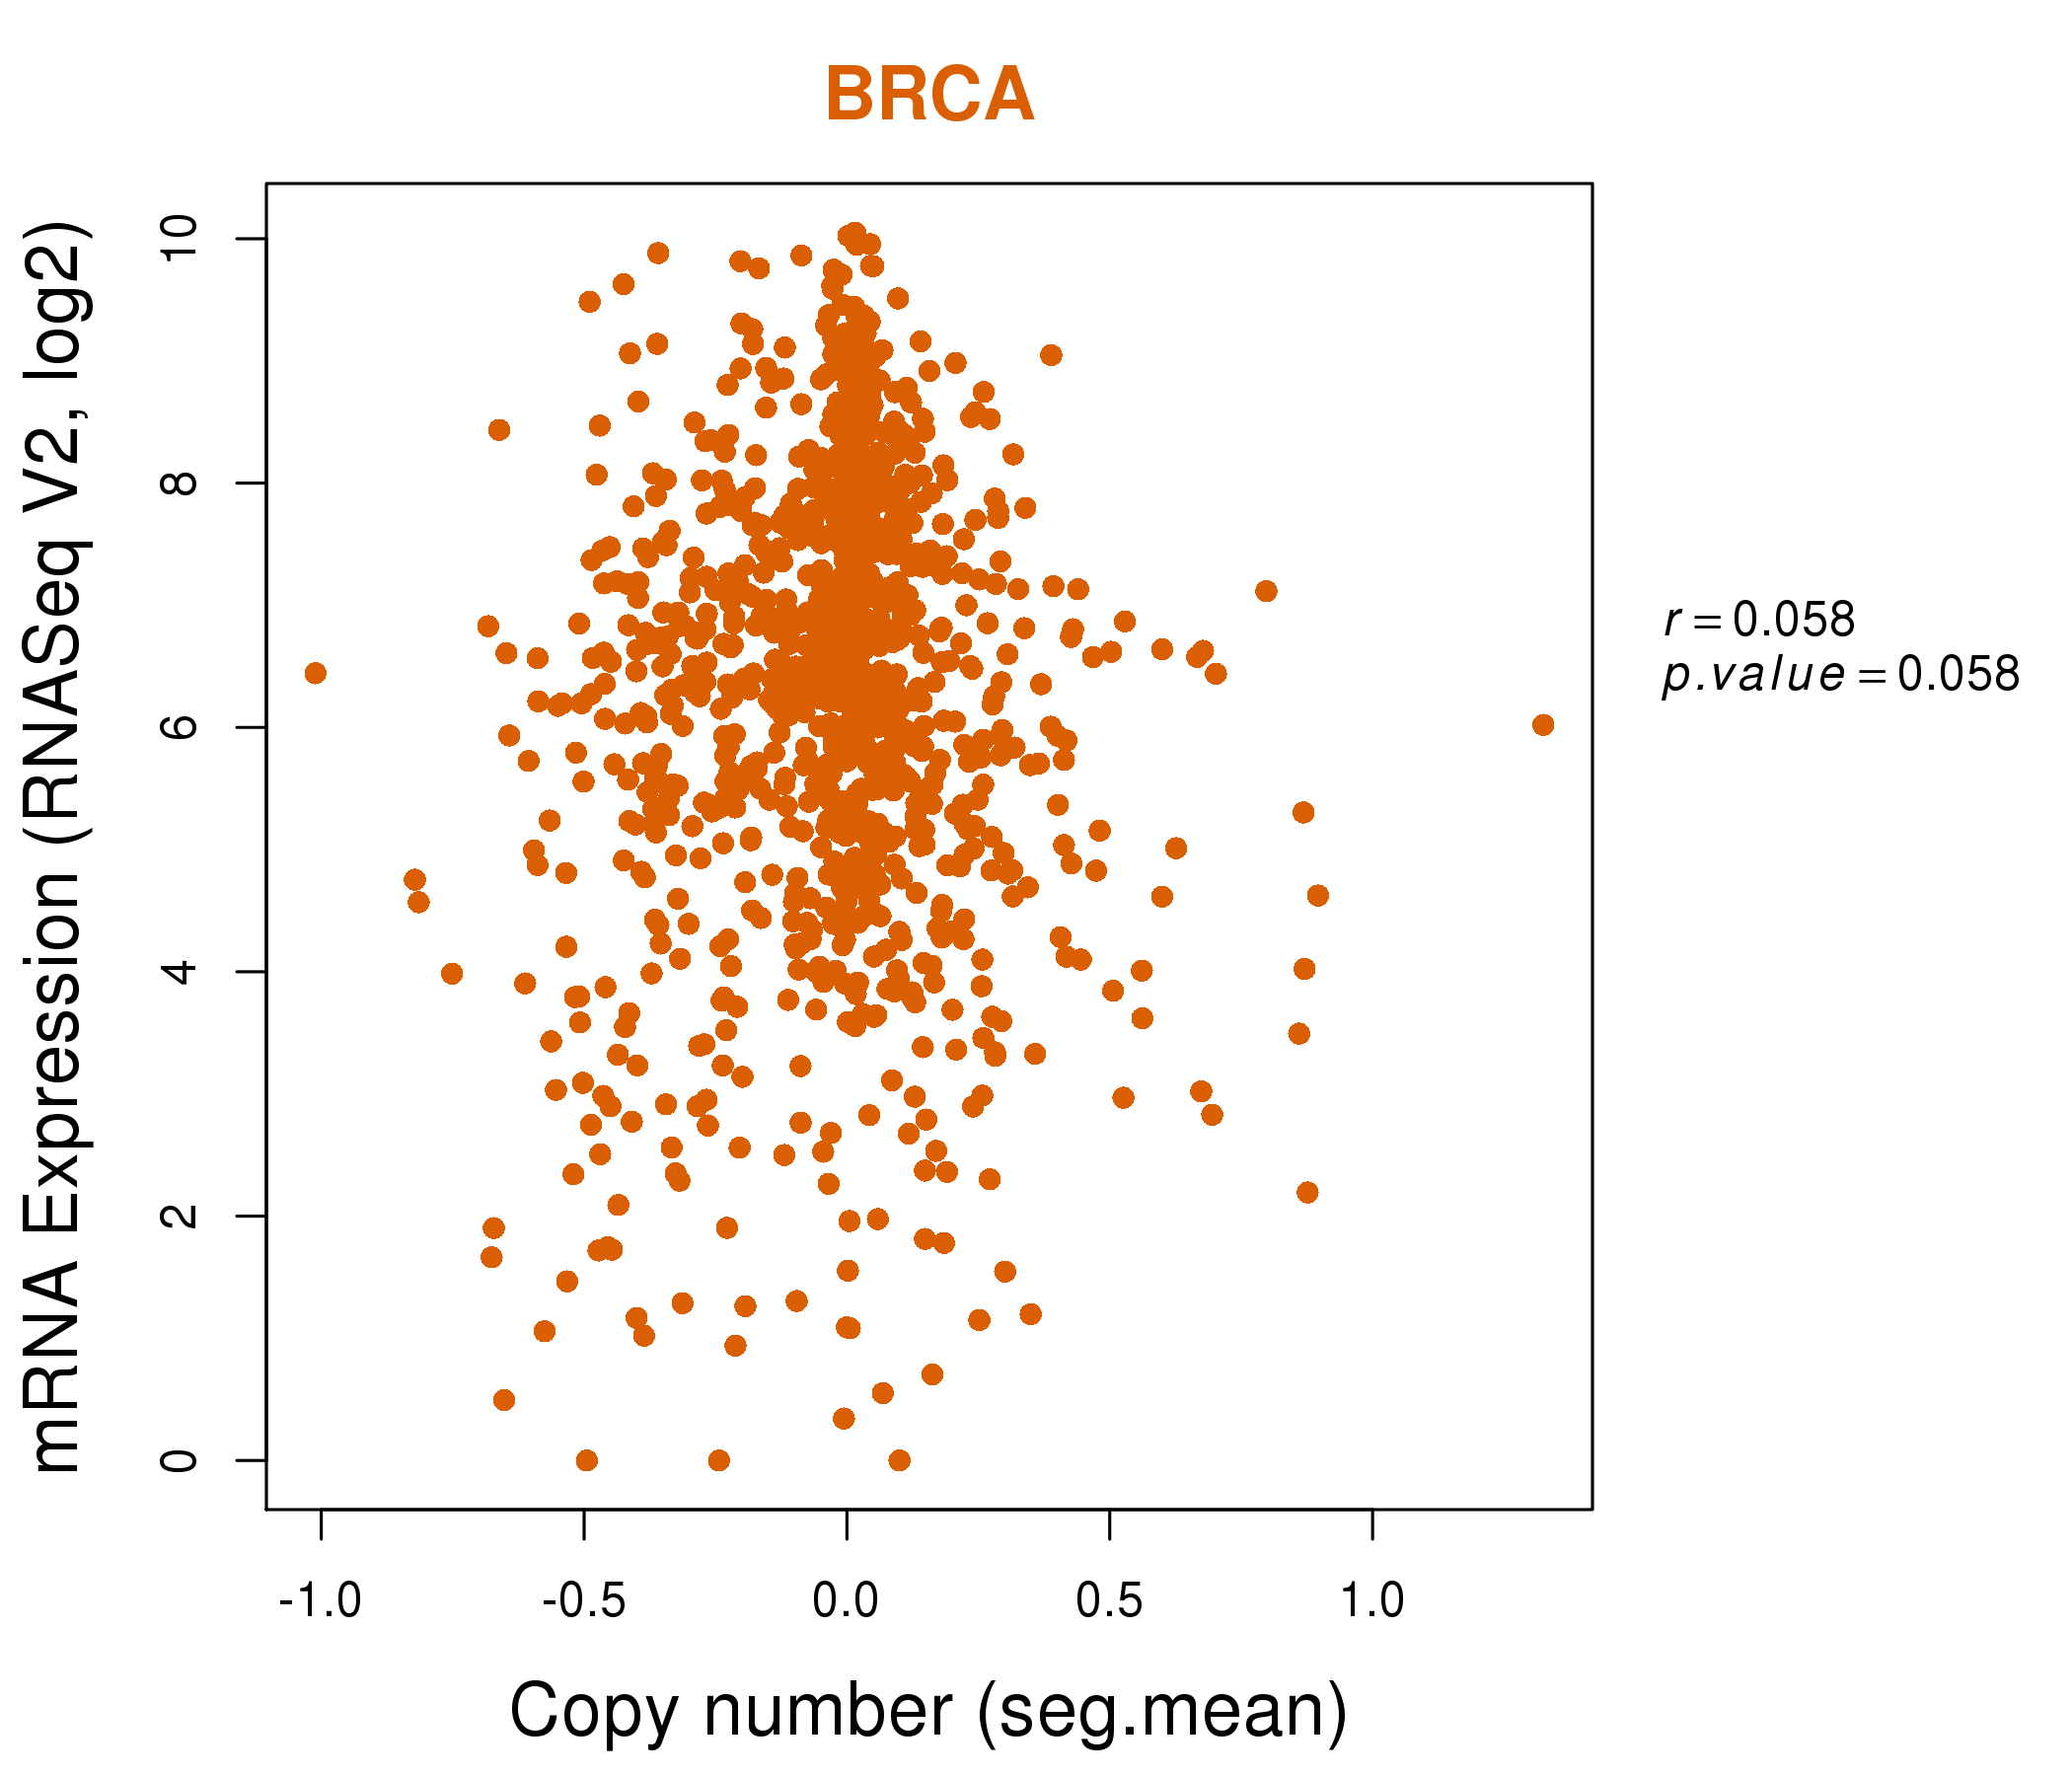
| * Normalized gene expression data of RNASeqV2 was extracted from TCGA using R package TCGA-Assembler. The URLs of all public data files on TCGA DCC data server were gathered at Jan-05-2015. Only eight cancer types have enough normal control samples for differential expression analysis. (t test, adjusted p<0.05 (using Benjamini-Hochberg FDR)) |
 |
| Top |
| * This plots show the correlation between CNV and gene expression. |
: Open all plots for all cancer types
 |
|
 |
|

| Top |
| Gene-Gene Network Information |
| * Co-Expression network figures were drawn using R package igraph. Only the top 20 genes with the highest correlations were shown. Red circle: input gene, orange circle: cell metabolism gene, sky circle: other gene |
: Open all plots for all cancer types
 |
|
| ABI3,CCDC88B,EBI3,GAPT,GIMAP1,HLA-DPB1,HMHA1, PALD1,LAT2,LY86,LYL1,MFNG,MYO1F,NAPSB, P2RY13,PLD4,PRAM1,RASAL3,SELPLG,SNAI3,TNFSF12 | ACTL10,CAPN1,CARD9,DEF6,GRK6,IL27RA,IL34, MICALL2,NFKBIE,PITPNM1,PLD4,PLEKHN1,RELB,RHBDF2, SEPT9,SH3BP1,SPNS3,ST14,SYTL1,TMEM102,YDJC |
 |
|
| AMICA1,ARHGAP15,DCANP1,CCR4,CD1C,CD1E,CD200R1, CLEC10A,CX3CR1,CXorf21,CYSLTR1,DOCK10,FCER1A,GAPT, LSP1,NAPSB,P2RY12,PLD4,PTGDS,SCN4B,TLR7 | SOWAHD,BTN1A1,CD207,CD27,CYFIP2,GPR114,GPR18, HLA-DPB2,HMHA1,ICAM3,LY9,P2RY10,PLD4,PTPN6, RHOH,RUNX3,SIGLEC10,SYK,TEC,TMEM156,ZNF180 |
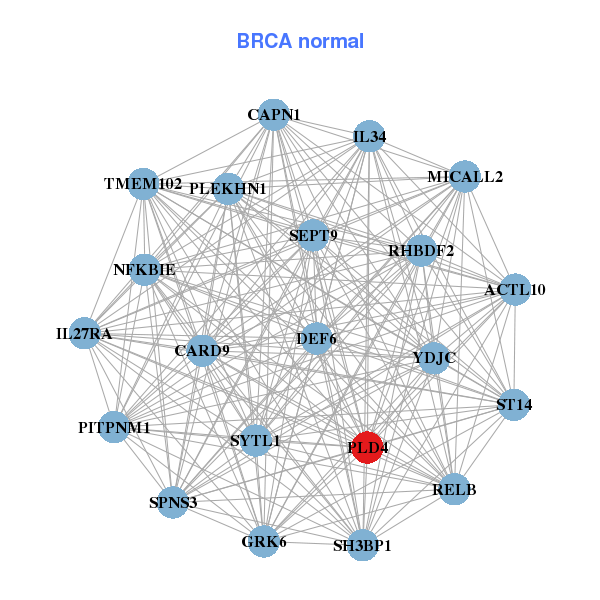
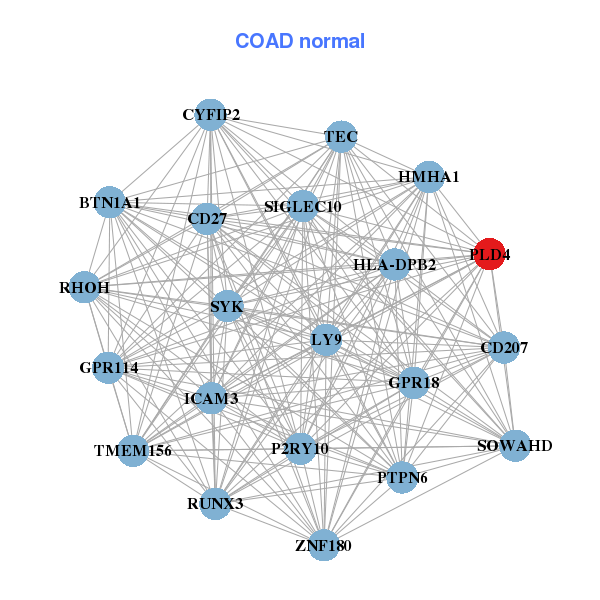
| * Co-Expression network figures were drawn using R package igraph. Only the top 20 genes with the highest correlations were shown. Red circle: input gene, orange circle: cell metabolism gene, sky circle: other gene |
: Open all plots for all cancer types
| Top |
: Open all interacting genes' information including KEGG pathway for all interacting genes from DAVID
| Top |
| Pharmacological Information for PLD4 |
| There's no related Drug. |
| Top |
| Cross referenced IDs for PLD4 |
| * We obtained these cross-references from Uniprot database. It covers 150 different DBs, 18 categories. http://www.uniprot.org/help/cross_references_section |
: Open all cross reference information
|
Copyright © 2016-Present - The Univsersity of Texas Health Science Center at Houston @ |