|
|||||||||||||||||||||||||||||||||||||||||||||||||||||||||||||||||||||||||||||||||||||||||||||||||||||||||||||||||||||||||||||||||||||||||||||||||||||||||||||||||||||||||||||||||||||||||||||||||||||||||||||||||||||||||||||||||||||||||||||||||||||||||||||||||||||||||||||||||||||||||||||||||||||||||||||||||||||||||||||||||||||||||||||||||||||||||||||||||||||||||||||||||
| |
| Phenotypic Information (metabolism pathway, cancer, disease, phenome) |
| |
| |
| Gene-Gene Network Information: Co-Expression Network, Interacting Genes & KEGG |
| |
|


| Gene Summary for ADSSL1 |
| Basic gene info. | Gene symbol | ADSSL1 |
| Gene name | adenylosuccinate synthase like 1 | |
| Synonyms | - | |
| Cytomap | UCSC genome browser: 14q32.33 | |
| Genomic location | chr14 :105196227-105213647 | |
| Type of gene | protein-coding | |
| RefGenes | NM_152328.3, NM_199165.1, | |
| Ensembl id | ENSG00000185100 | |
| Description | AMPSase 1IMP--aspartate ligase 1M-type adenylosuccinate synthetaseadSS 1adenylosuccinate synthetase isozyme 1adenylosuccinate synthetase, basic isozymeadenylosuccinate synthetase, muscle isozyme | |
| Modification date | 20141207 | |
| dbXrefs | MIM : 612498 | |
| HGNC : HGNC | ||
| Ensembl : ENSG00000185100 | ||
| HPRD : 12433 | ||
| Vega : OTTHUMG00000170818 | ||
| Protein | UniProt: go to UniProt's Cross Reference DB Table | |
| Expression | CleanEX: HS_ADSSL1 | |
| BioGPS: 122622 | ||
| Gene Expression Atlas: ENSG00000185100 | ||
| The Human Protein Atlas: ENSG00000185100 | ||
| Pathway | NCI Pathway Interaction Database: ADSSL1 | |
| KEGG: ADSSL1 | ||
| REACTOME: ADSSL1 | ||
| ConsensusPathDB | ||
| Pathway Commons: ADSSL1 | ||
| Metabolism | MetaCyc: ADSSL1 | |
| HUMANCyc: ADSSL1 | ||
| Regulation | Ensembl's Regulation: ENSG00000185100 | |
| miRBase: chr14 :105,196,227-105,213,647 | ||
| TargetScan: NM_152328 | ||
| cisRED: ENSG00000185100 | ||
| Context | iHOP: ADSSL1 | |
| cancer metabolism search in PubMed: ADSSL1 | ||
| UCL Cancer Institute: ADSSL1 | ||
| Assigned class in ccmGDB | C | |
| Top |
| Phenotypic Information for ADSSL1(metabolism pathway, cancer, disease, phenome) |
| Cancer | CGAP: ADSSL1 |
| Familial Cancer Database: ADSSL1 | |
| * This gene is included in those cancer gene databases. |
|
|
|
|
|
|
| |||||||||||||||||||||||||||||||||||||||||||||||||||||||||||||||||||||||||||||||||||||||||||||||||||||||||||||||||||||||||||||||||||||||||||||||||||||||||||||||||||||||||||||||||||||||||||||||||||||||||||||||||||||||||||||||||||||||||||||||||||||||||||||||||||||||||||||||||||||||||||||||||||||||||||||||||||||||||||||||||||||||||||||||||||||||||||||||||||||||||||
Oncogene 1 | Significant driver gene in | ||||||||||||||||||||||||||||||||||||||||||||||||||||||||||||||||||||||||||||||||||||||||||||||||||||||||||||||||||||||||||||||||||||||||||||||||||||||||||||||||||||||||||||||||||||||||||||||||||||||||||||||||||||||||||||||||||||||||||||||||||||||||||||||||||||||||||||||||||||||||||||||||||||||||||||||||||||||||||||||||||||||||||||||||||||||||||||||||||||||||||||||||
| cf) number; DB name 1 Oncogene; http://nar.oxfordjournals.org/content/35/suppl_1/D721.long, 2 Tumor Suppressor gene; https://bioinfo.uth.edu/TSGene/, 3 Cancer Gene Census; http://www.nature.com/nrc/journal/v4/n3/abs/nrc1299.html, 4 CancerGenes; http://nar.oxfordjournals.org/content/35/suppl_1/D721.long, 5 Network of Cancer Gene; http://ncg.kcl.ac.uk/index.php, 1Therapeutic Vulnerabilities in Cancer; http://cbio.mskcc.org/cancergenomics/statius/ |
| KEGG_PURINE_METABOLISM KEGG_ALANINE_ASPARTATE_AND_GLUTAMATE_METABOLISM REACTOME_METABOLISM_OF_NUCLEOTIDES REACTOME_PURINE_METABOLISM | |
| OMIM | |
| Orphanet | |
| Disease | KEGG Disease: ADSSL1 |
| MedGen: ADSSL1 (Human Medical Genetics with Condition) | |
| ClinVar: ADSSL1 | |
| Phenotype | MGI: ADSSL1 (International Mouse Phenotyping Consortium) |
| PhenomicDB: ADSSL1 | |
| Mutations for ADSSL1 |
| * Under tables are showing count per each tissue to give us broad intuition about tissue specific mutation patterns.You can go to the detailed page for each mutation database's web site. |
| There's no structural variation information in COSMIC data for this gene. |
| * From mRNA Sanger sequences, Chitars2.0 arranged chimeric transcripts. This table shows ADSSL1 related fusion information. |
| ID | Head Gene | Tail Gene | Accession | Gene_a | qStart_a | qEnd_a | Chromosome_a | tStart_a | tEnd_a | Gene_a | qStart_a | qEnd_a | Chromosome_a | tStart_a | tEnd_a |
| Top |
| Mutation type/ Tissue ID | brca | cns | cerv | endome | haematopo | kidn | Lintest | liver | lung | ns | ovary | pancre | prost | skin | stoma | thyro | urina | |||
| Total # sample | 1 | |||||||||||||||||||
| GAIN (# sample) | 1 | |||||||||||||||||||
| LOSS (# sample) |
| cf) Tissue ID; Tissue type (1; Breast, 2; Central_nervous_system, 3; Cervix, 4; Endometrium, 5; Haematopoietic_and_lymphoid_tissue, 6; Kidney, 7; Large_intestine, 8; Liver, 9; Lung, 10; NS, 11; Ovary, 12; Pancreas, 13; Prostate, 14; Skin, 15; Stomach, 16; Thyroid, 17; Urinary_tract) |
| Top |
|
 |
| Top |
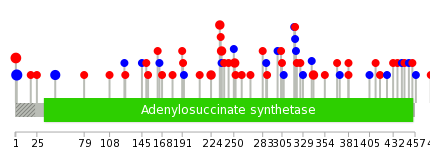
| Stat. for Non-Synonymous SNVs (# total SNVs=34) | (# total SNVs=19) |
 |  |
(# total SNVs=0) | (# total SNVs=0) |
| Top |
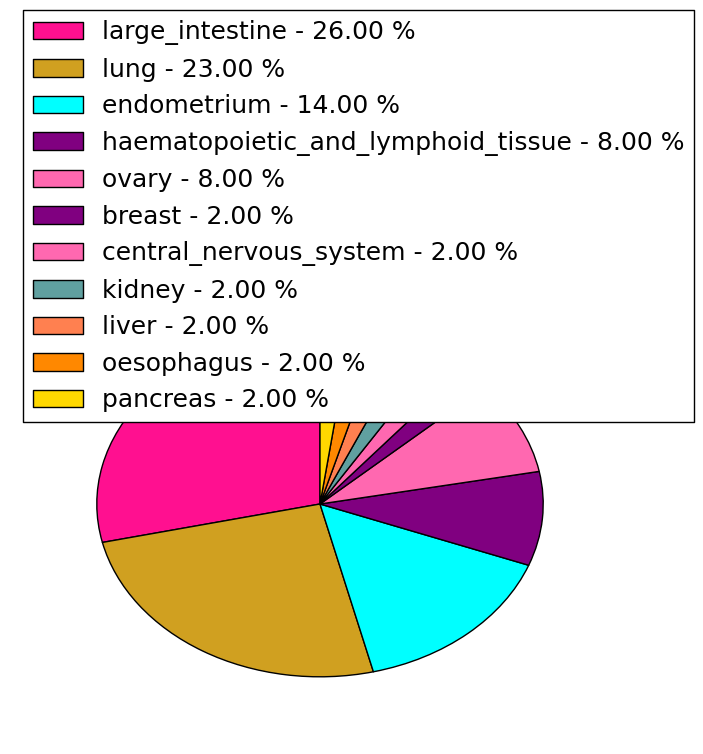
| * When you move the cursor on each content, you can see more deailed mutation information on the Tooltip. Those are primary_site,primary_histology,mutation(aa),pubmedID. |
| GRCh37 position | Mutation(aa) | Unique sampleID count |
| chr14:105196235-105196235 | p.V2V | 5 |
| chr14:105196230-105196230 | p.M1L | 4 |
| chr14:105196365-105196365 | p.L46L | 3 |
| chr14:105207213-105207213 | p.P251S | 2 |
| chr14:105207003-105207003 | p.R224H | 2 |
| chr14:105207032-105207032 | p.E234K | 2 |
| chr14:105209529-105209529 | p.? | 2 |
| chr14:105207039-105207039 | p.S236F | 2 |
| chr14:105213312-105213312 | p.S492* | 2 |
| chr14:105208283-105208283 | p.V341M | 2 |
| Top |
|
 |
| Point Mutation/ Tissue ID | 1 | 2 | 3 | 4 | 5 | 6 | 7 | 8 | 9 | 10 | 11 | 12 | 13 | 14 | 15 | 16 | 17 | 18 | 19 | 20 |
| # sample | 1 | 5 | 4 | 3 | 1 | 3 | 2 | 4 | 1 | 9 | 7 | 7 | ||||||||
| # mutation | 1 | 5 | 3 | 3 | 1 | 3 | 2 | 4 | 1 | 8 | 8 | 8 | ||||||||
| nonsynonymous SNV | 1 | 4 | 2 | 2 | 3 | 1 | 3 | 1 | 6 | 6 | 5 | |||||||||
| synonymous SNV | 1 | 1 | 1 | 1 | 1 | 1 | 2 | 2 | 3 |
| cf) Tissue ID; Tissue type (1; BLCA[Bladder Urothelial Carcinoma], 2; BRCA[Breast invasive carcinoma], 3; CESC[Cervical squamous cell carcinoma and endocervical adenocarcinoma], 4; COAD[Colon adenocarcinoma], 5; GBM[Glioblastoma multiforme], 6; Glioma Low Grade, 7; HNSC[Head and Neck squamous cell carcinoma], 8; KICH[Kidney Chromophobe], 9; KIRC[Kidney renal clear cell carcinoma], 10; KIRP[Kidney renal papillary cell carcinoma], 11; LAML[Acute Myeloid Leukemia], 12; LUAD[Lung adenocarcinoma], 13; LUSC[Lung squamous cell carcinoma], 14; OV[Ovarian serous cystadenocarcinoma ], 15; PAAD[Pancreatic adenocarcinoma], 16; PRAD[Prostate adenocarcinoma], 17; SKCM[Skin Cutaneous Melanoma], 18:STAD[Stomach adenocarcinoma], 19:THCA[Thyroid carcinoma], 20:UCEC[Uterine Corpus Endometrial Carcinoma]) |
| Top |
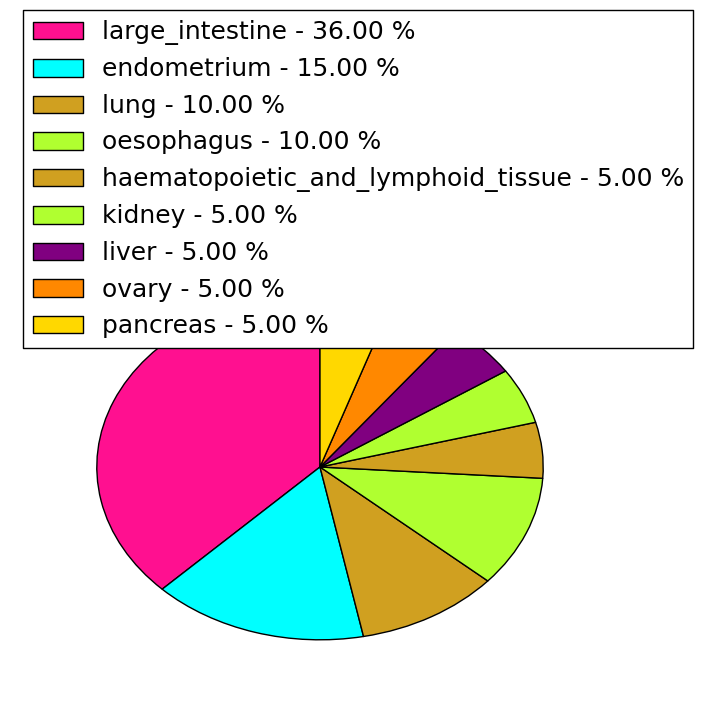
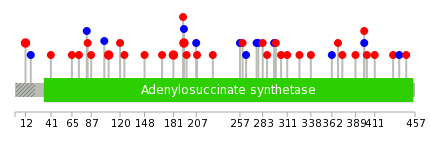
| * We represented just top 10 SNVs. When you move the cursor on each content, you can see more deailed mutation information on the Tooltip. Those are primary_site, primary_histology, mutation(aa), pubmedID. |
| Genomic Position | Mutation(aa) | Unique sampleID count |
| chr14:105204736 | p.R181H,ADSSL1 | 2 |
| chr14:105190641 | p.P12S | 2 |
| chr14:105207003 | p.S193F,ADSSL1 | 2 |
| chr14:105207039 | p.P107S,ADSSL1 | 2 |
| chr14:105207179 | p.F432S,ADSSL1 | 1 |
| chr14:105208279 | p.E125K,ADSSL1 | 1 |
| chr14:105204723 | p.G283C,ADSSL1 | 1 |
| chr14:105212598 | p.V439V,ADSSL1 | 1 |
| chr14:105207212 | p.Q148L,ADSSL1 | 1 |
| chr14:105208283 | p.P288R,ADSSL1 | 1 |
| * Copy number data were extracted from TCGA using R package TCGA-Assembler. The URLs of all public data files on TCGA DCC data server were gathered on Jan-05-2015. Function ProcessCNAData in TCGA-Assembler package was used to obtain gene-level copy number value which is calculated as the average copy number of the genomic region of a gene. |
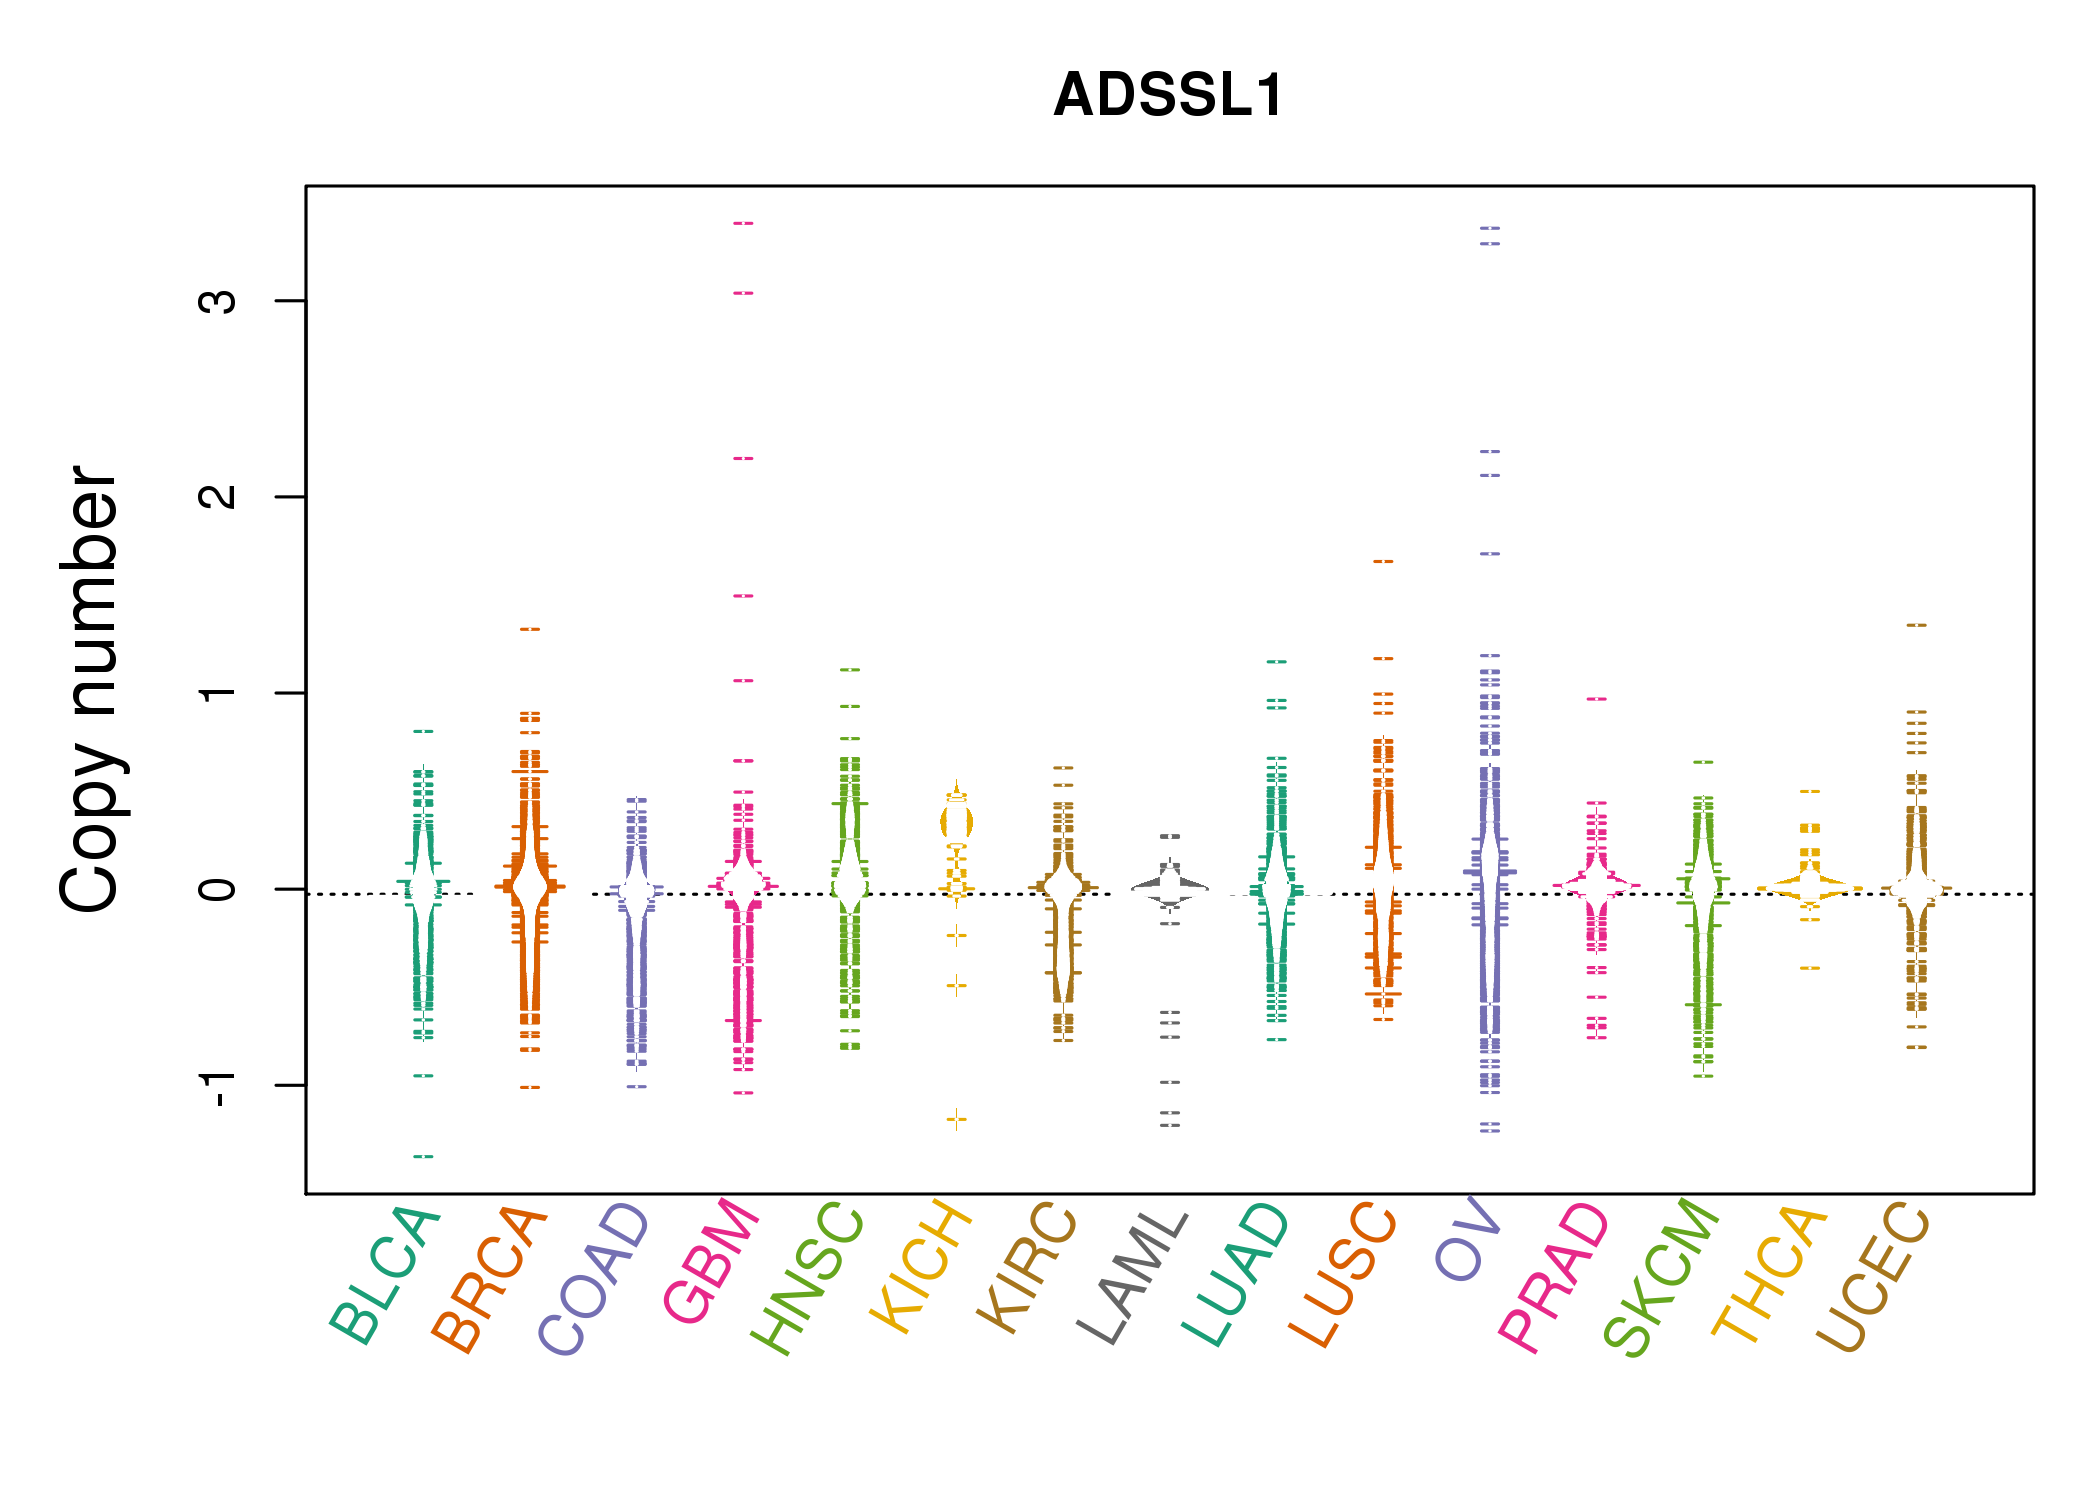 |
| cf) Tissue ID[Tissue type]: BLCA[Bladder Urothelial Carcinoma], BRCA[Breast invasive carcinoma], CESC[Cervical squamous cell carcinoma and endocervical adenocarcinoma], COAD[Colon adenocarcinoma], GBM[Glioblastoma multiforme], Glioma Low Grade, HNSC[Head and Neck squamous cell carcinoma], KICH[Kidney Chromophobe], KIRC[Kidney renal clear cell carcinoma], KIRP[Kidney renal papillary cell carcinoma], LAML[Acute Myeloid Leukemia], LUAD[Lung adenocarcinoma], LUSC[Lung squamous cell carcinoma], OV[Ovarian serous cystadenocarcinoma ], PAAD[Pancreatic adenocarcinoma], PRAD[Prostate adenocarcinoma], SKCM[Skin Cutaneous Melanoma], STAD[Stomach adenocarcinoma], THCA[Thyroid carcinoma], UCEC[Uterine Corpus Endometrial Carcinoma] |
| Top |
| Gene Expression for ADSSL1 |
| * CCLE gene expression data were extracted from CCLE_Expression_Entrez_2012-10-18.res: Gene-centric RMA-normalized mRNA expression data. |
 |
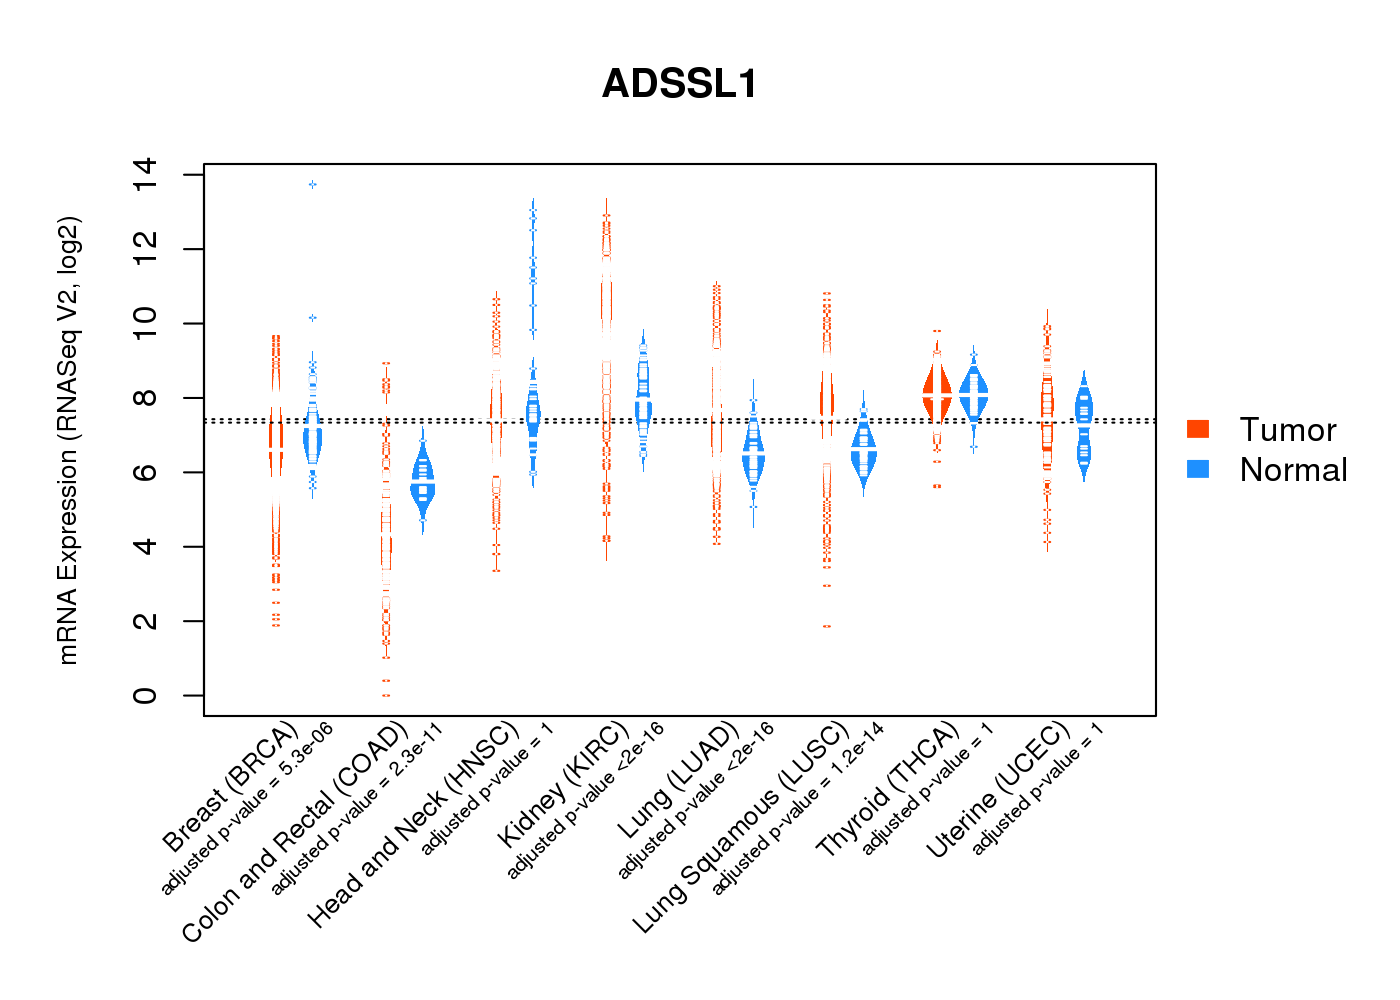
| * Normalized gene expression data of RNASeqV2 was extracted from TCGA using R package TCGA-Assembler. The URLs of all public data files on TCGA DCC data server were gathered at Jan-05-2015. Only eight cancer types have enough normal control samples for differential expression analysis. (t test, adjusted p<0.05 (using Benjamini-Hochberg FDR)) |
 |
| Top |
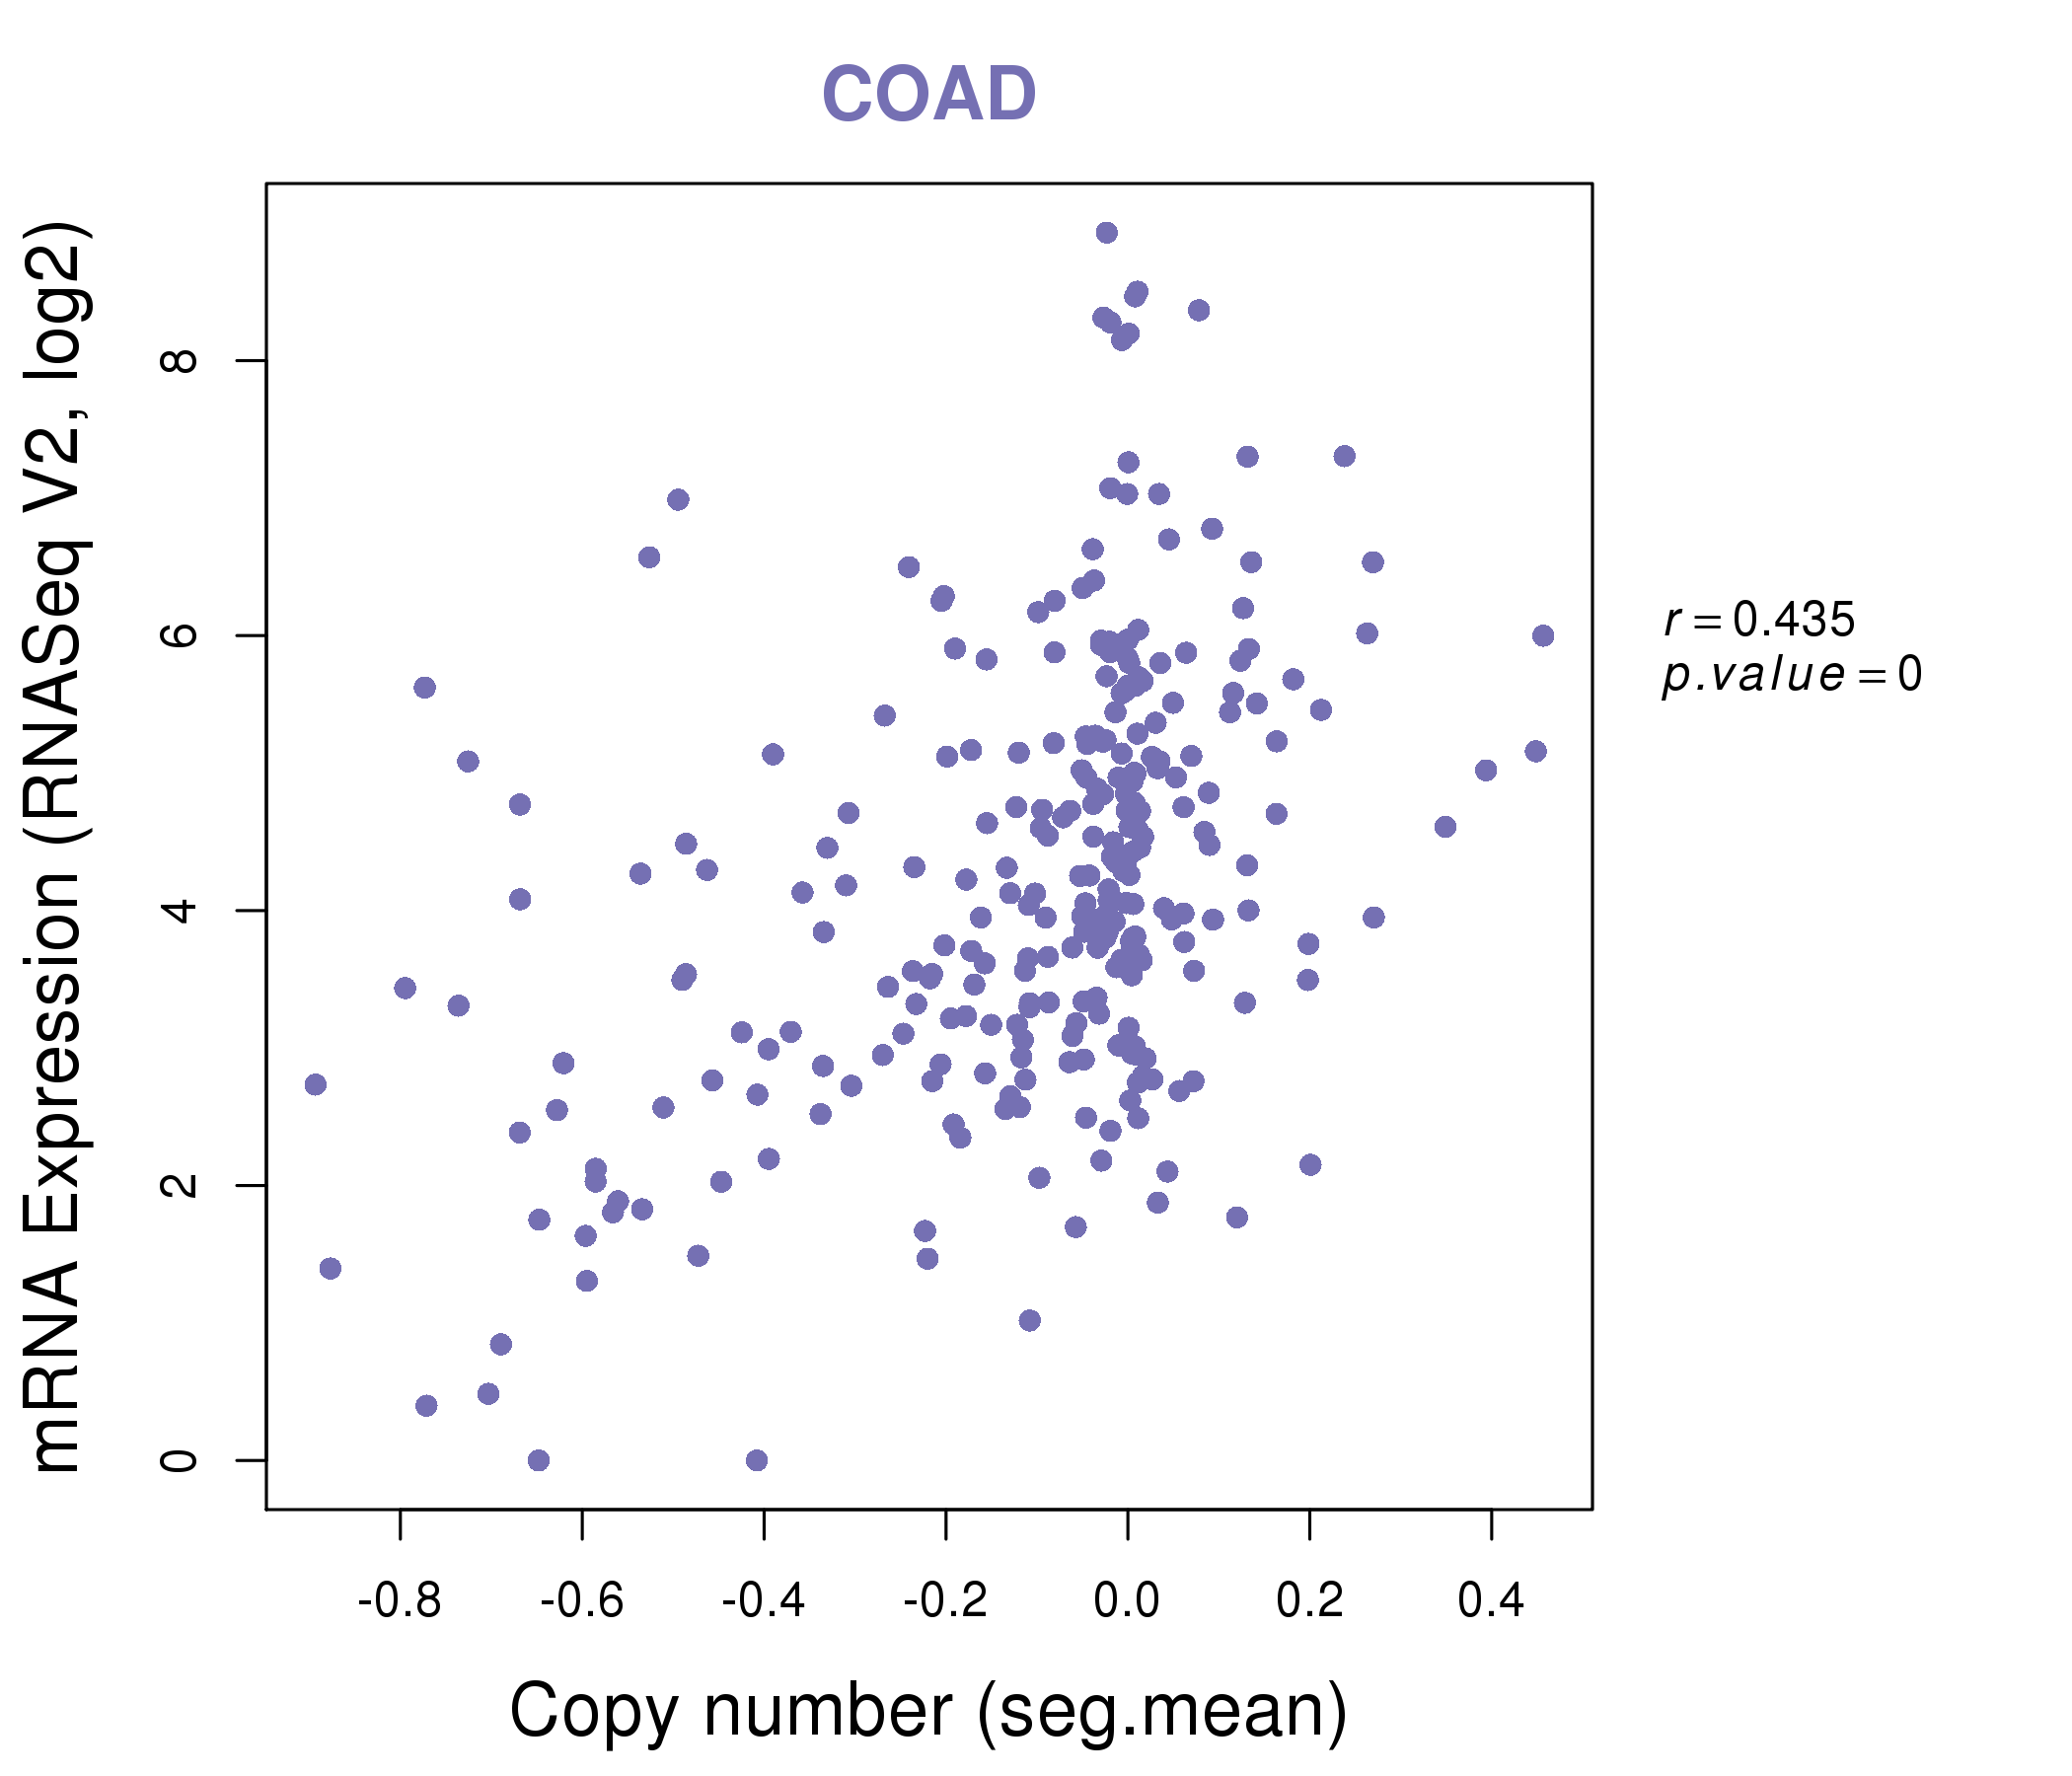
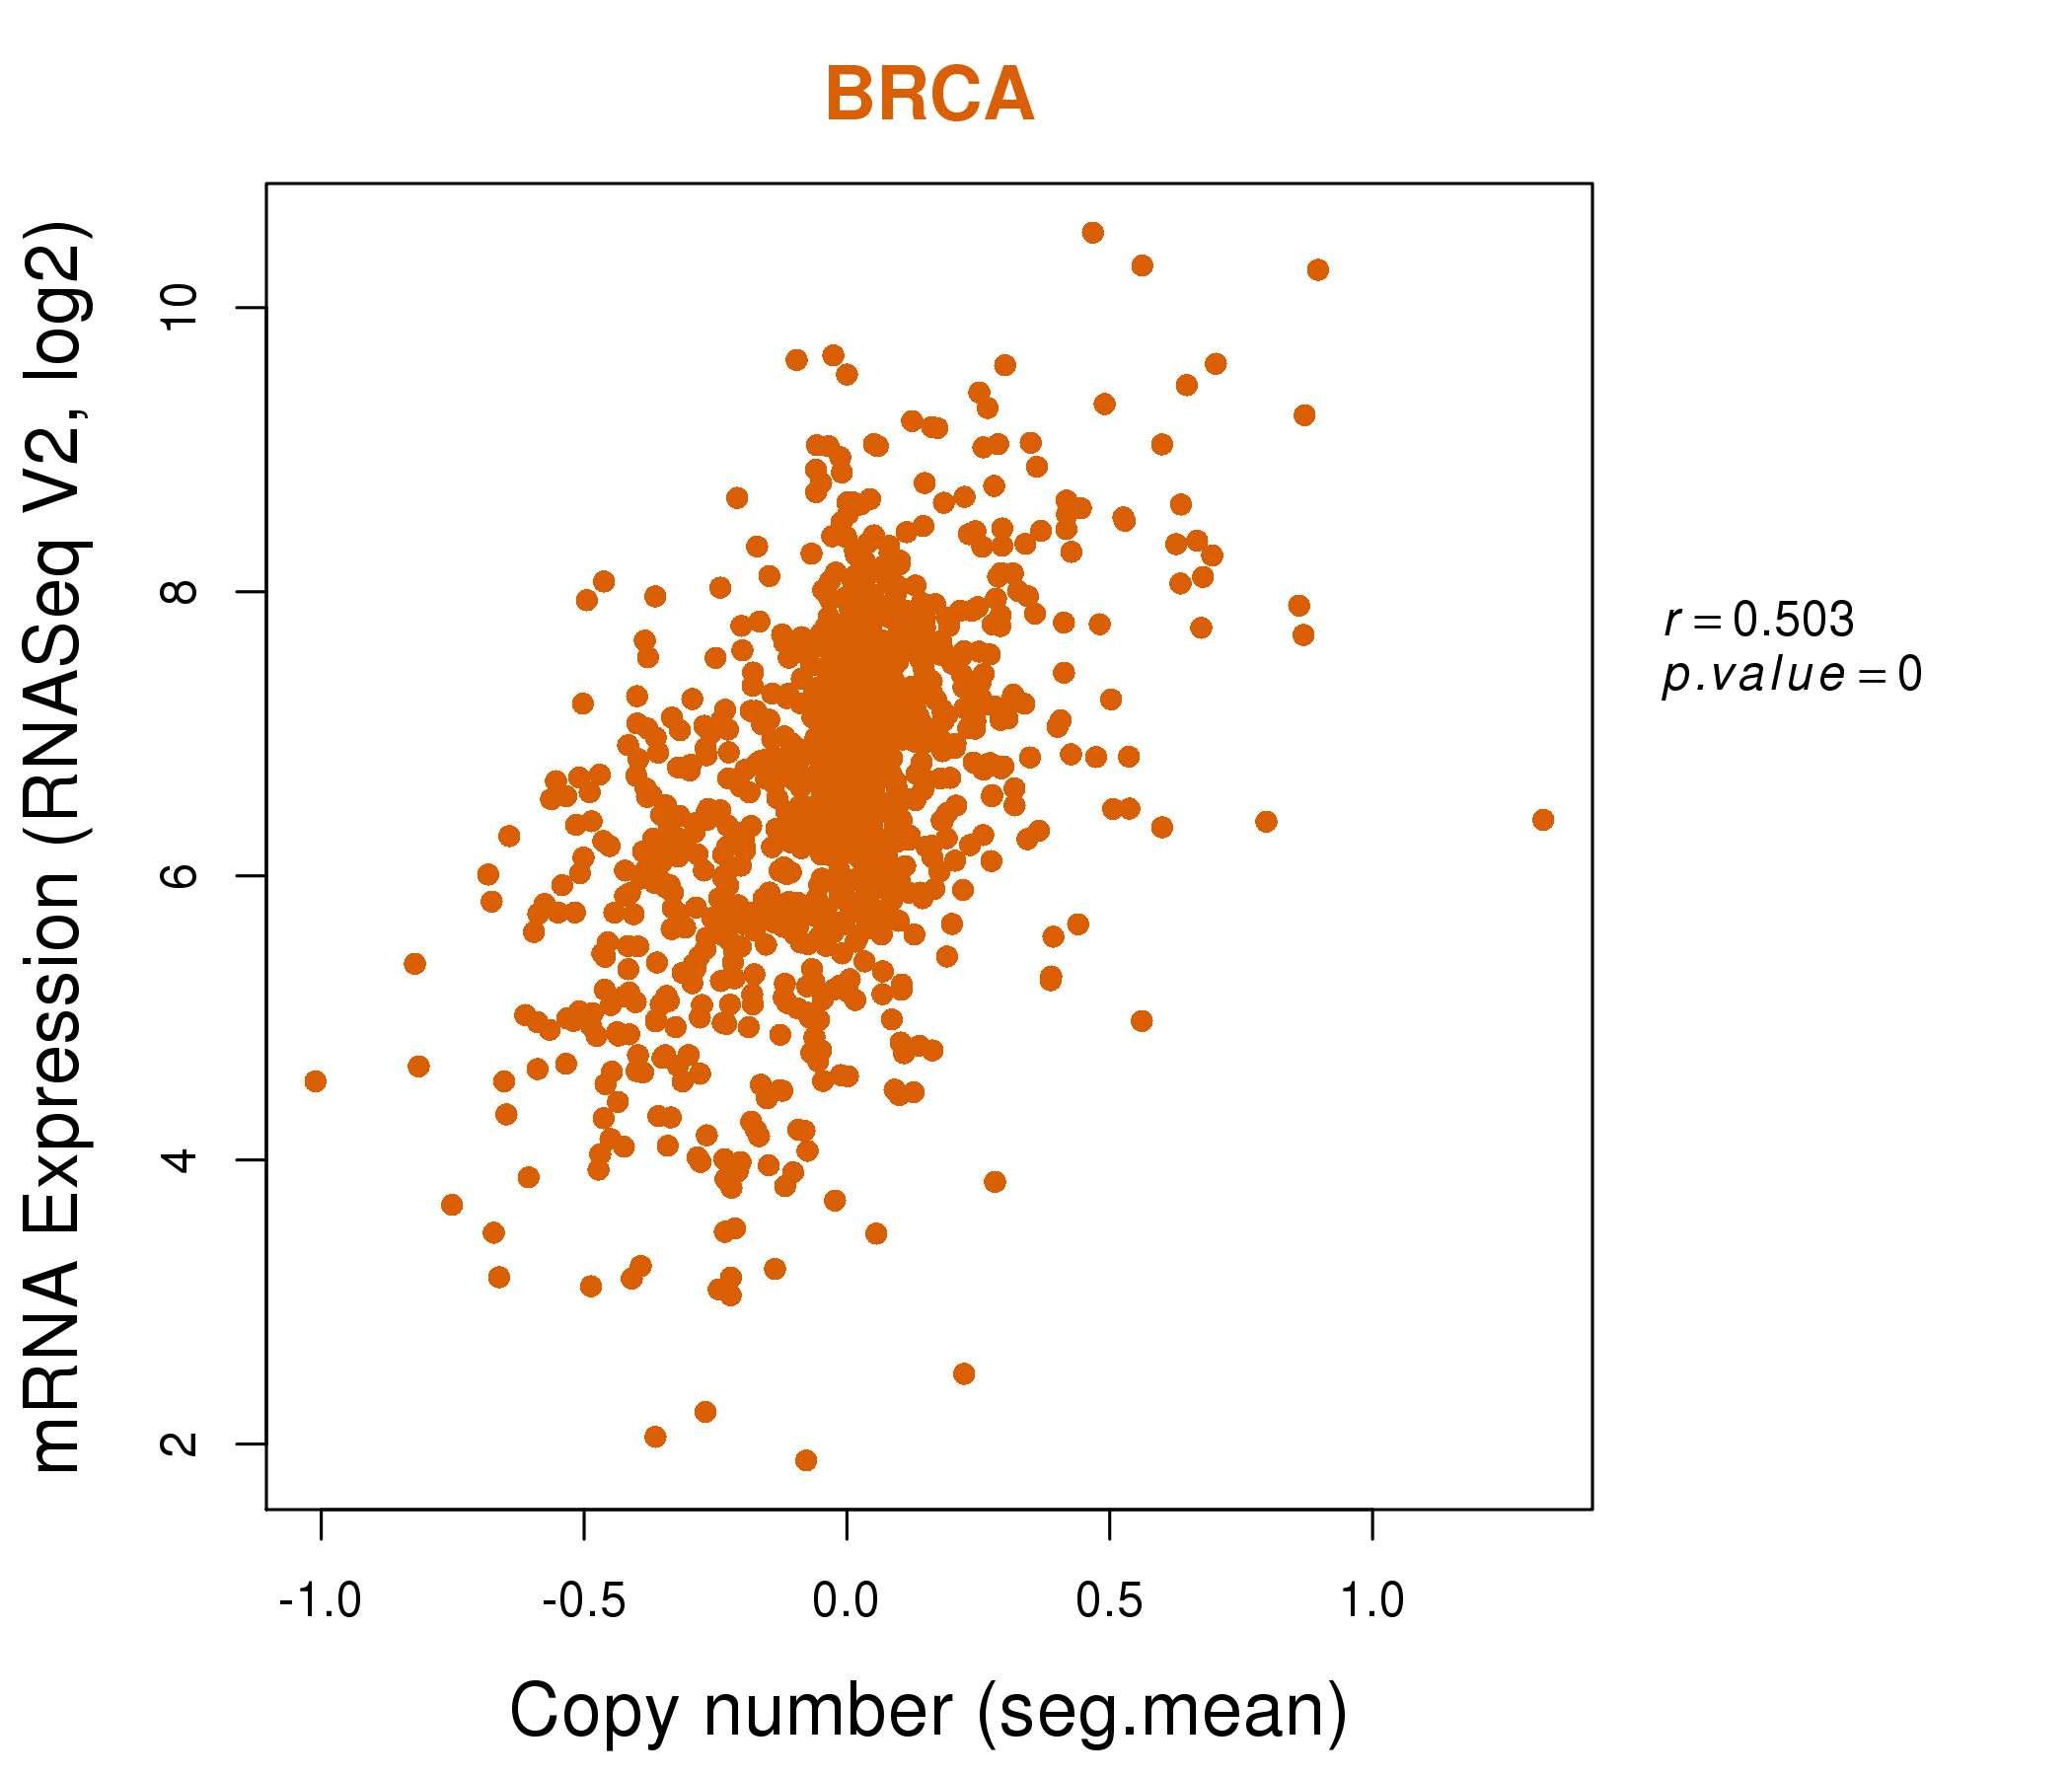
| * This plots show the correlation between CNV and gene expression. |
: Open all plots for all cancer types
 |
|
 |
|

| Top |
| Gene-Gene Network Information |
| * Co-Expression network figures were drawn using R package igraph. Only the top 20 genes with the highest correlations were shown. Red circle: input gene, orange circle: cell metabolism gene, sky circle: other gene |
: Open all plots for all cancer types
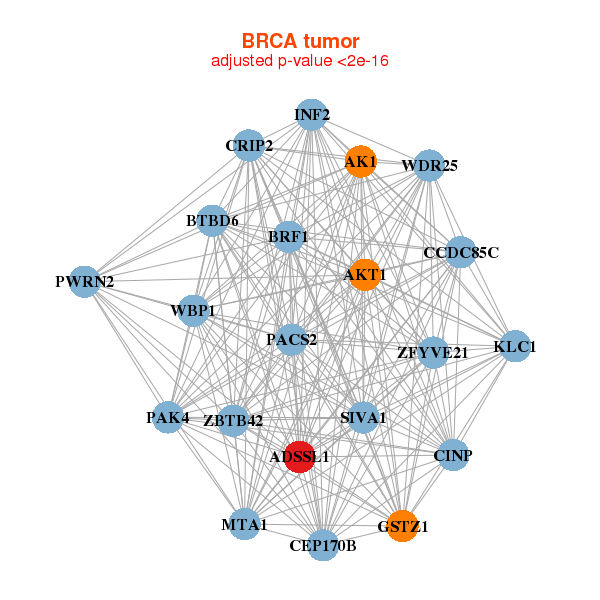 |
| ||||
| ADSSL1,AK1,AKT1,BRF1,BTBD6,CCDC85C,CINP, CRIP2,GSTZ1,INF2,CEP170B,KLC1,MTA1,PACS2, PAK4,PWRN2,SIVA1,WBP1,WDR25,ZBTB42,ZFYVE21 | ADSSL1,MLIP,C8orf22,CA3,CKMT2,CORO6,ENAM, FBXO40,HRC,KLHL33,MYH1,MYOM1,PDE4DIP,PGAM2, PYGM,SLC25A34,SLC25A4,SYPL2,TMEM52,TNNT3,TRIM7 | ||||
 |
| ||||
| ADSSL1,ALPPL2,BEX1,MRGPRG-AS1,LAMP5,C3orf35,FAM218A, CMAHP,CNTFR,FGF3,KCP,LOC100131551,MAEL,MAGED4, NTF4,OOSP2,SACS,SCN2A,SPANXN2,SUMO1P1,TM9SF1 | AATK,ABCA4,ADSSL1,AGAP11,ALDH3B1,ALS2,AQP3, B3GALT2,MB21D2,MLXIPL,MPP6,PLLP,PNLIPRP2,RHBDL1, RNF141,SIRPA,SLC6A6,TEKT3,UNC93A,UPK3A,VNN1 |

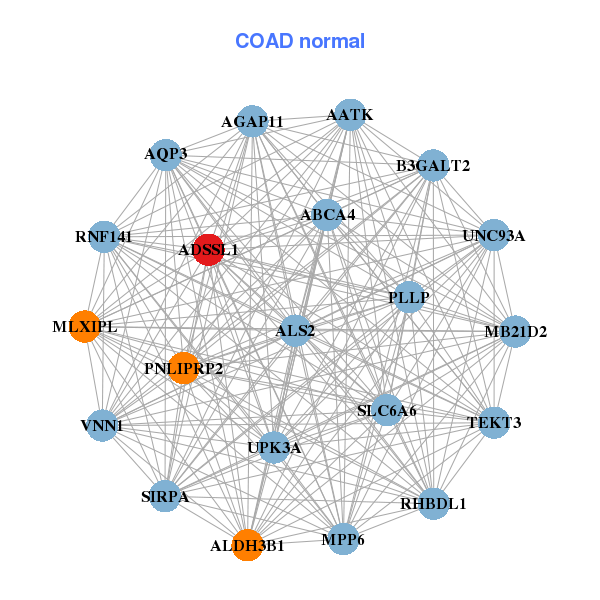
| * Co-Expression network figures were drawn using R package igraph. Only the top 20 genes with the highest correlations were shown. Red circle: input gene, orange circle: cell metabolism gene, sky circle: other gene |
: Open all plots for all cancer types
| Top |
: Open all interacting genes' information including KEGG pathway for all interacting genes from DAVID
| Top |
| Pharmacological Information for ADSSL1 |
| DB Category | DB Name | DB's ID and Url link |
| * Gene Centered Interaction Network. |
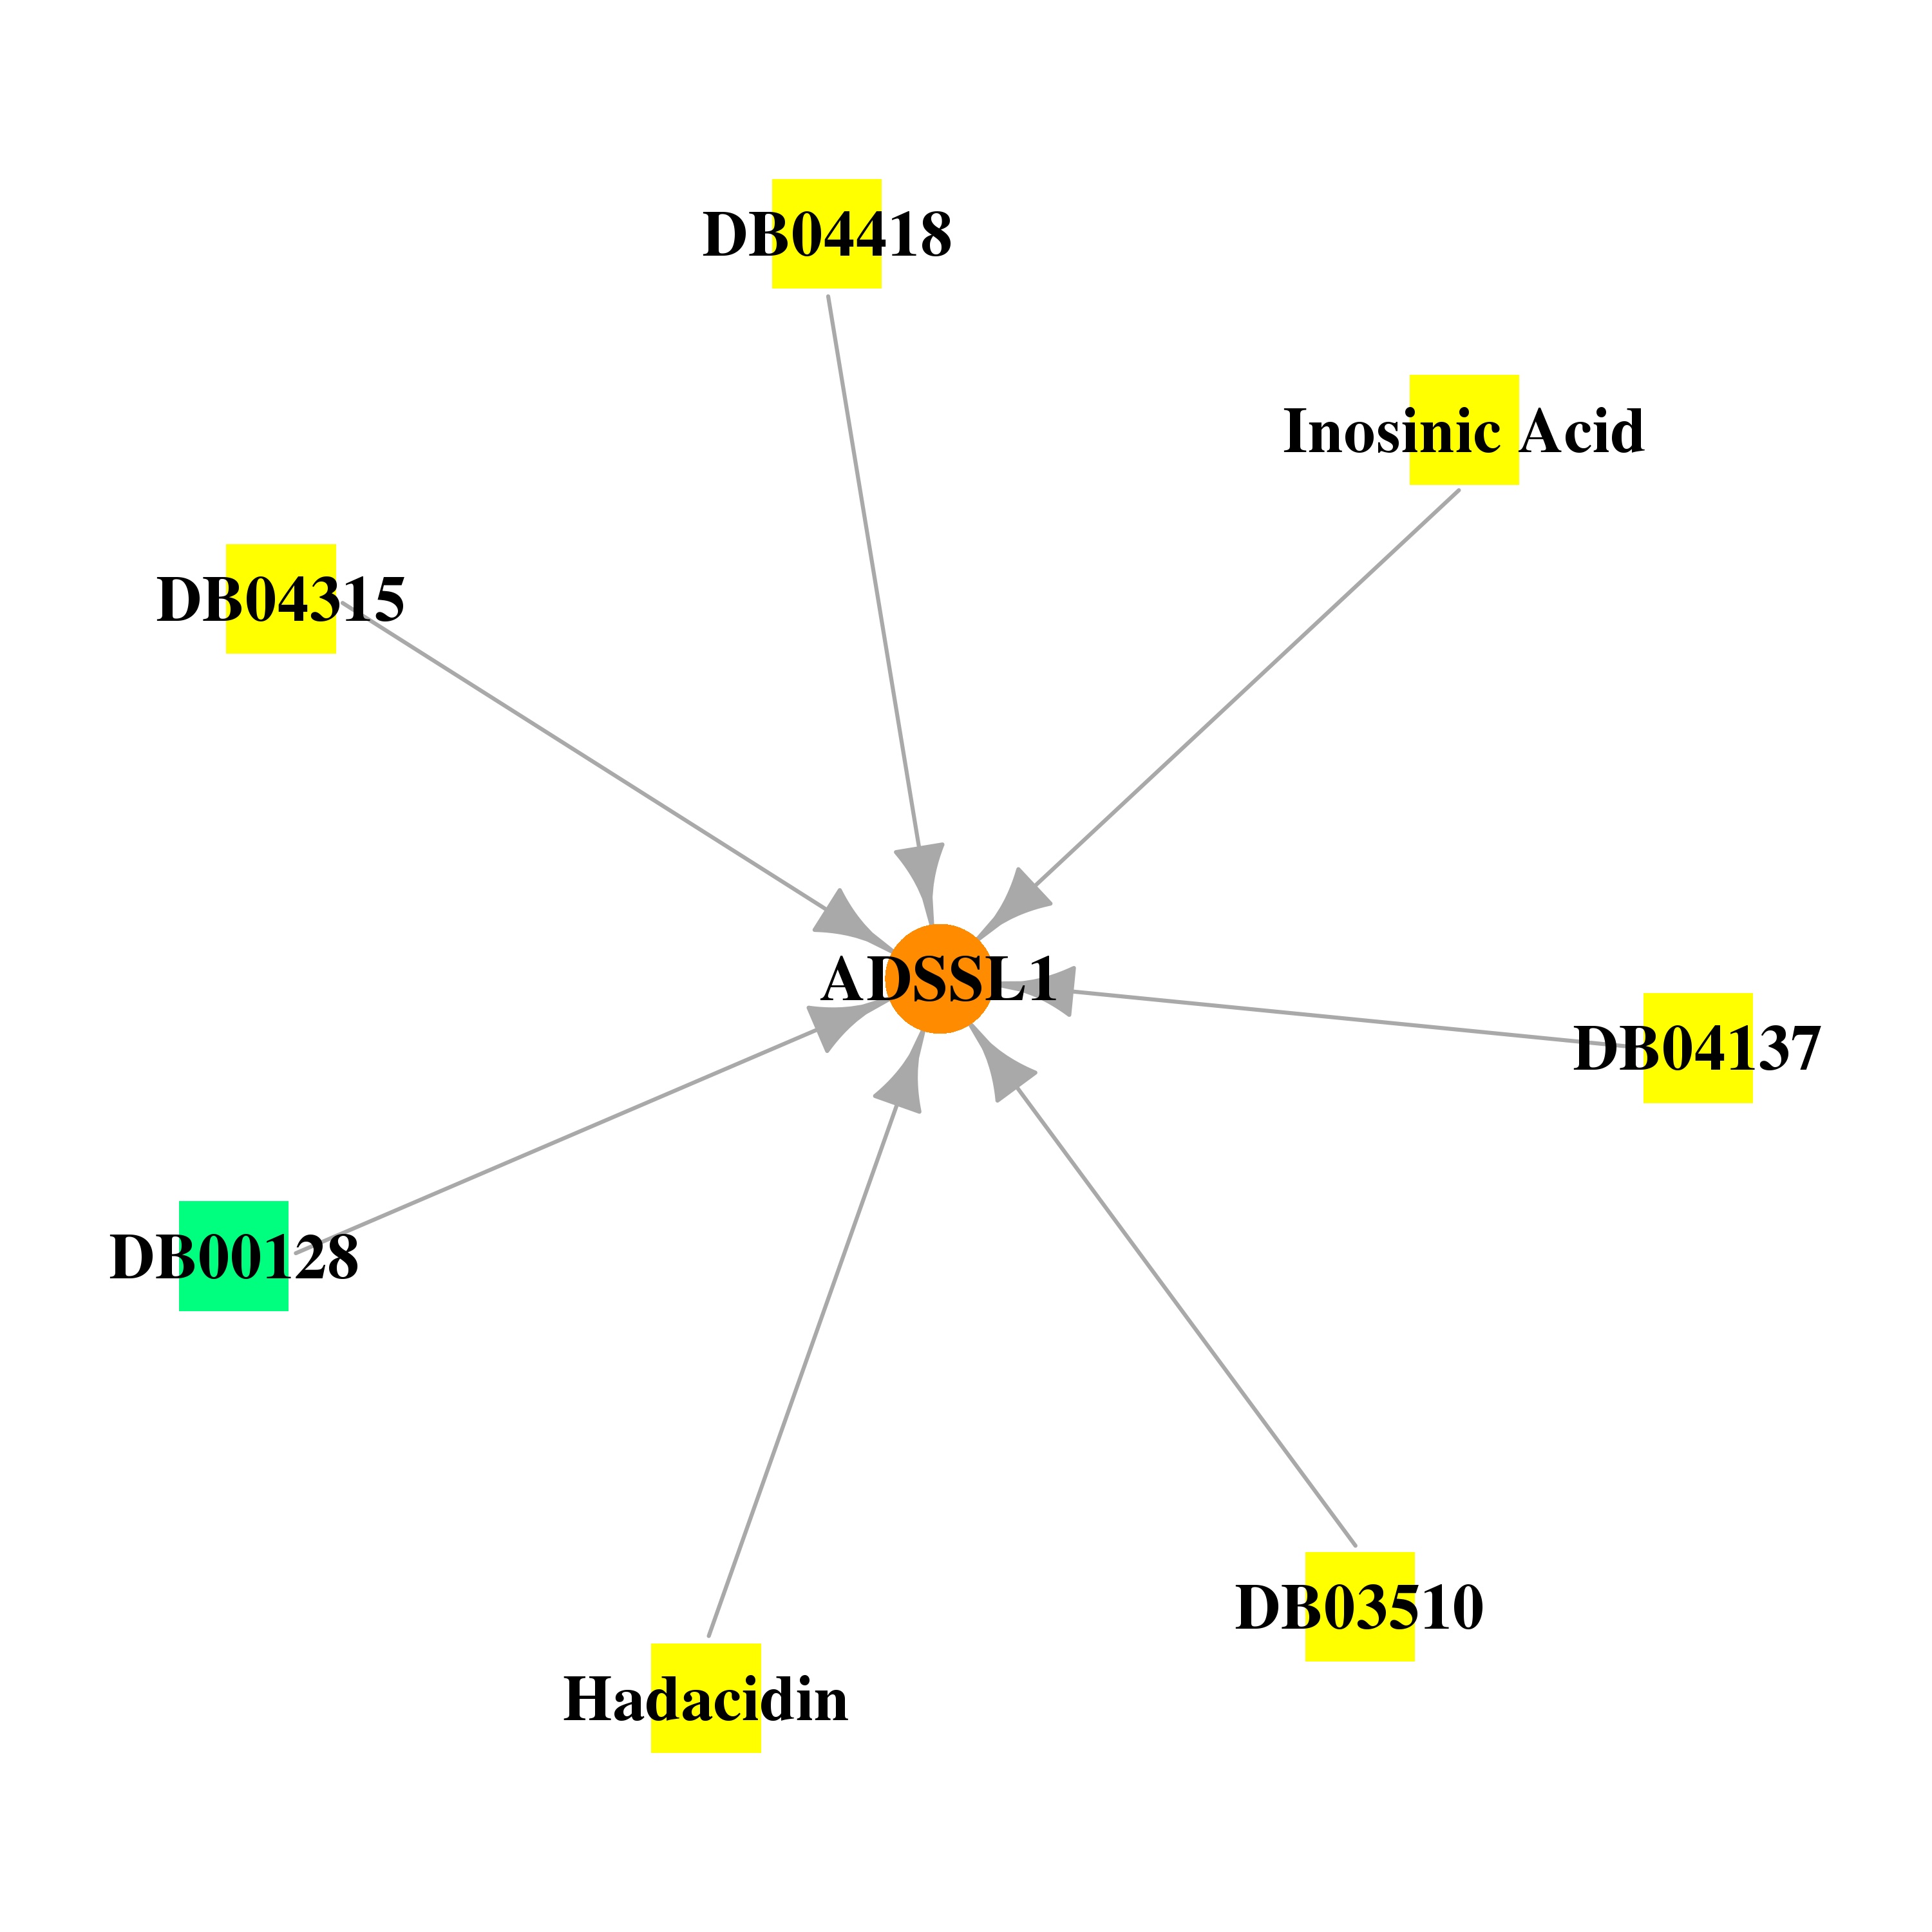 |
| * Drug Centered Interaction Network. |
| DrugBank ID | Target Name | Drug Groups | Generic Name | Drug Centered Network | Drug Structure |
| DB00128 | adenylosuccinate synthase like 1 | approved; nutraceutical | L-Aspartic Acid | 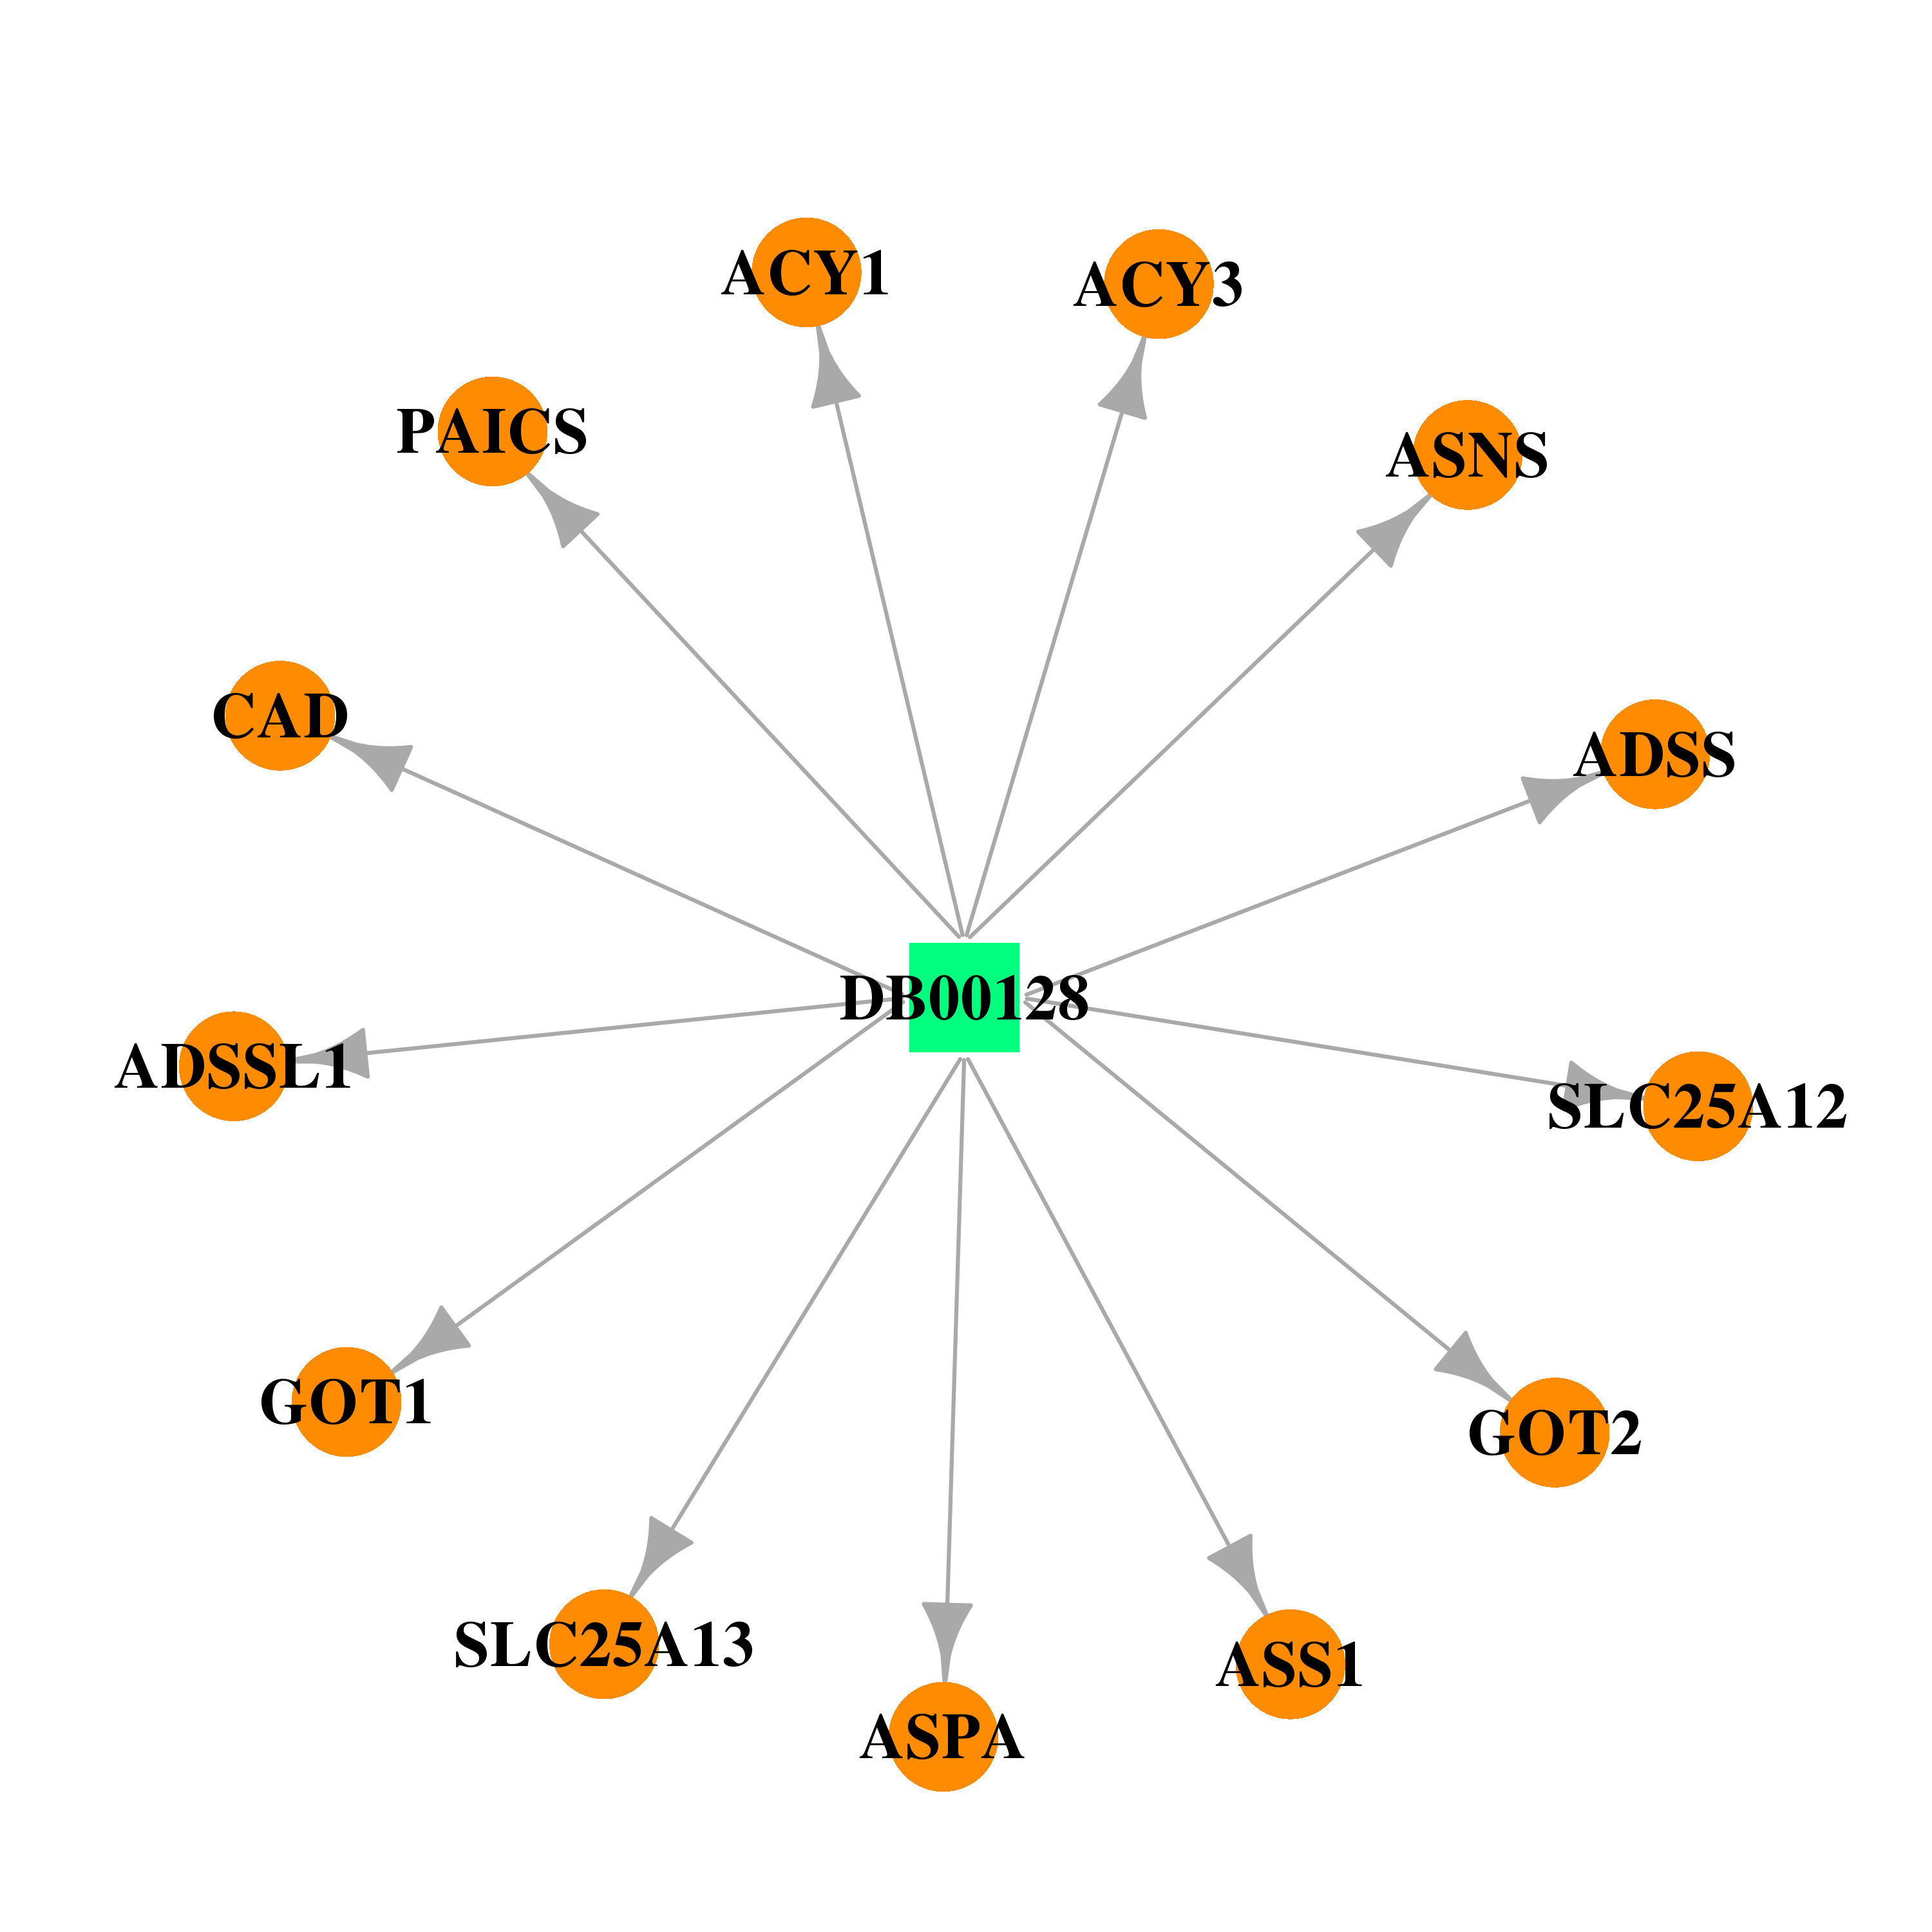 | 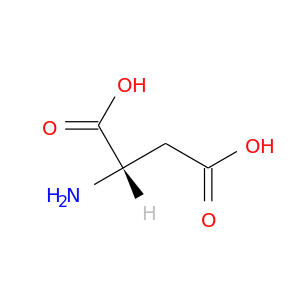 |
| DB02109 | adenylosuccinate synthase like 1 | experimental | Hadacidin | 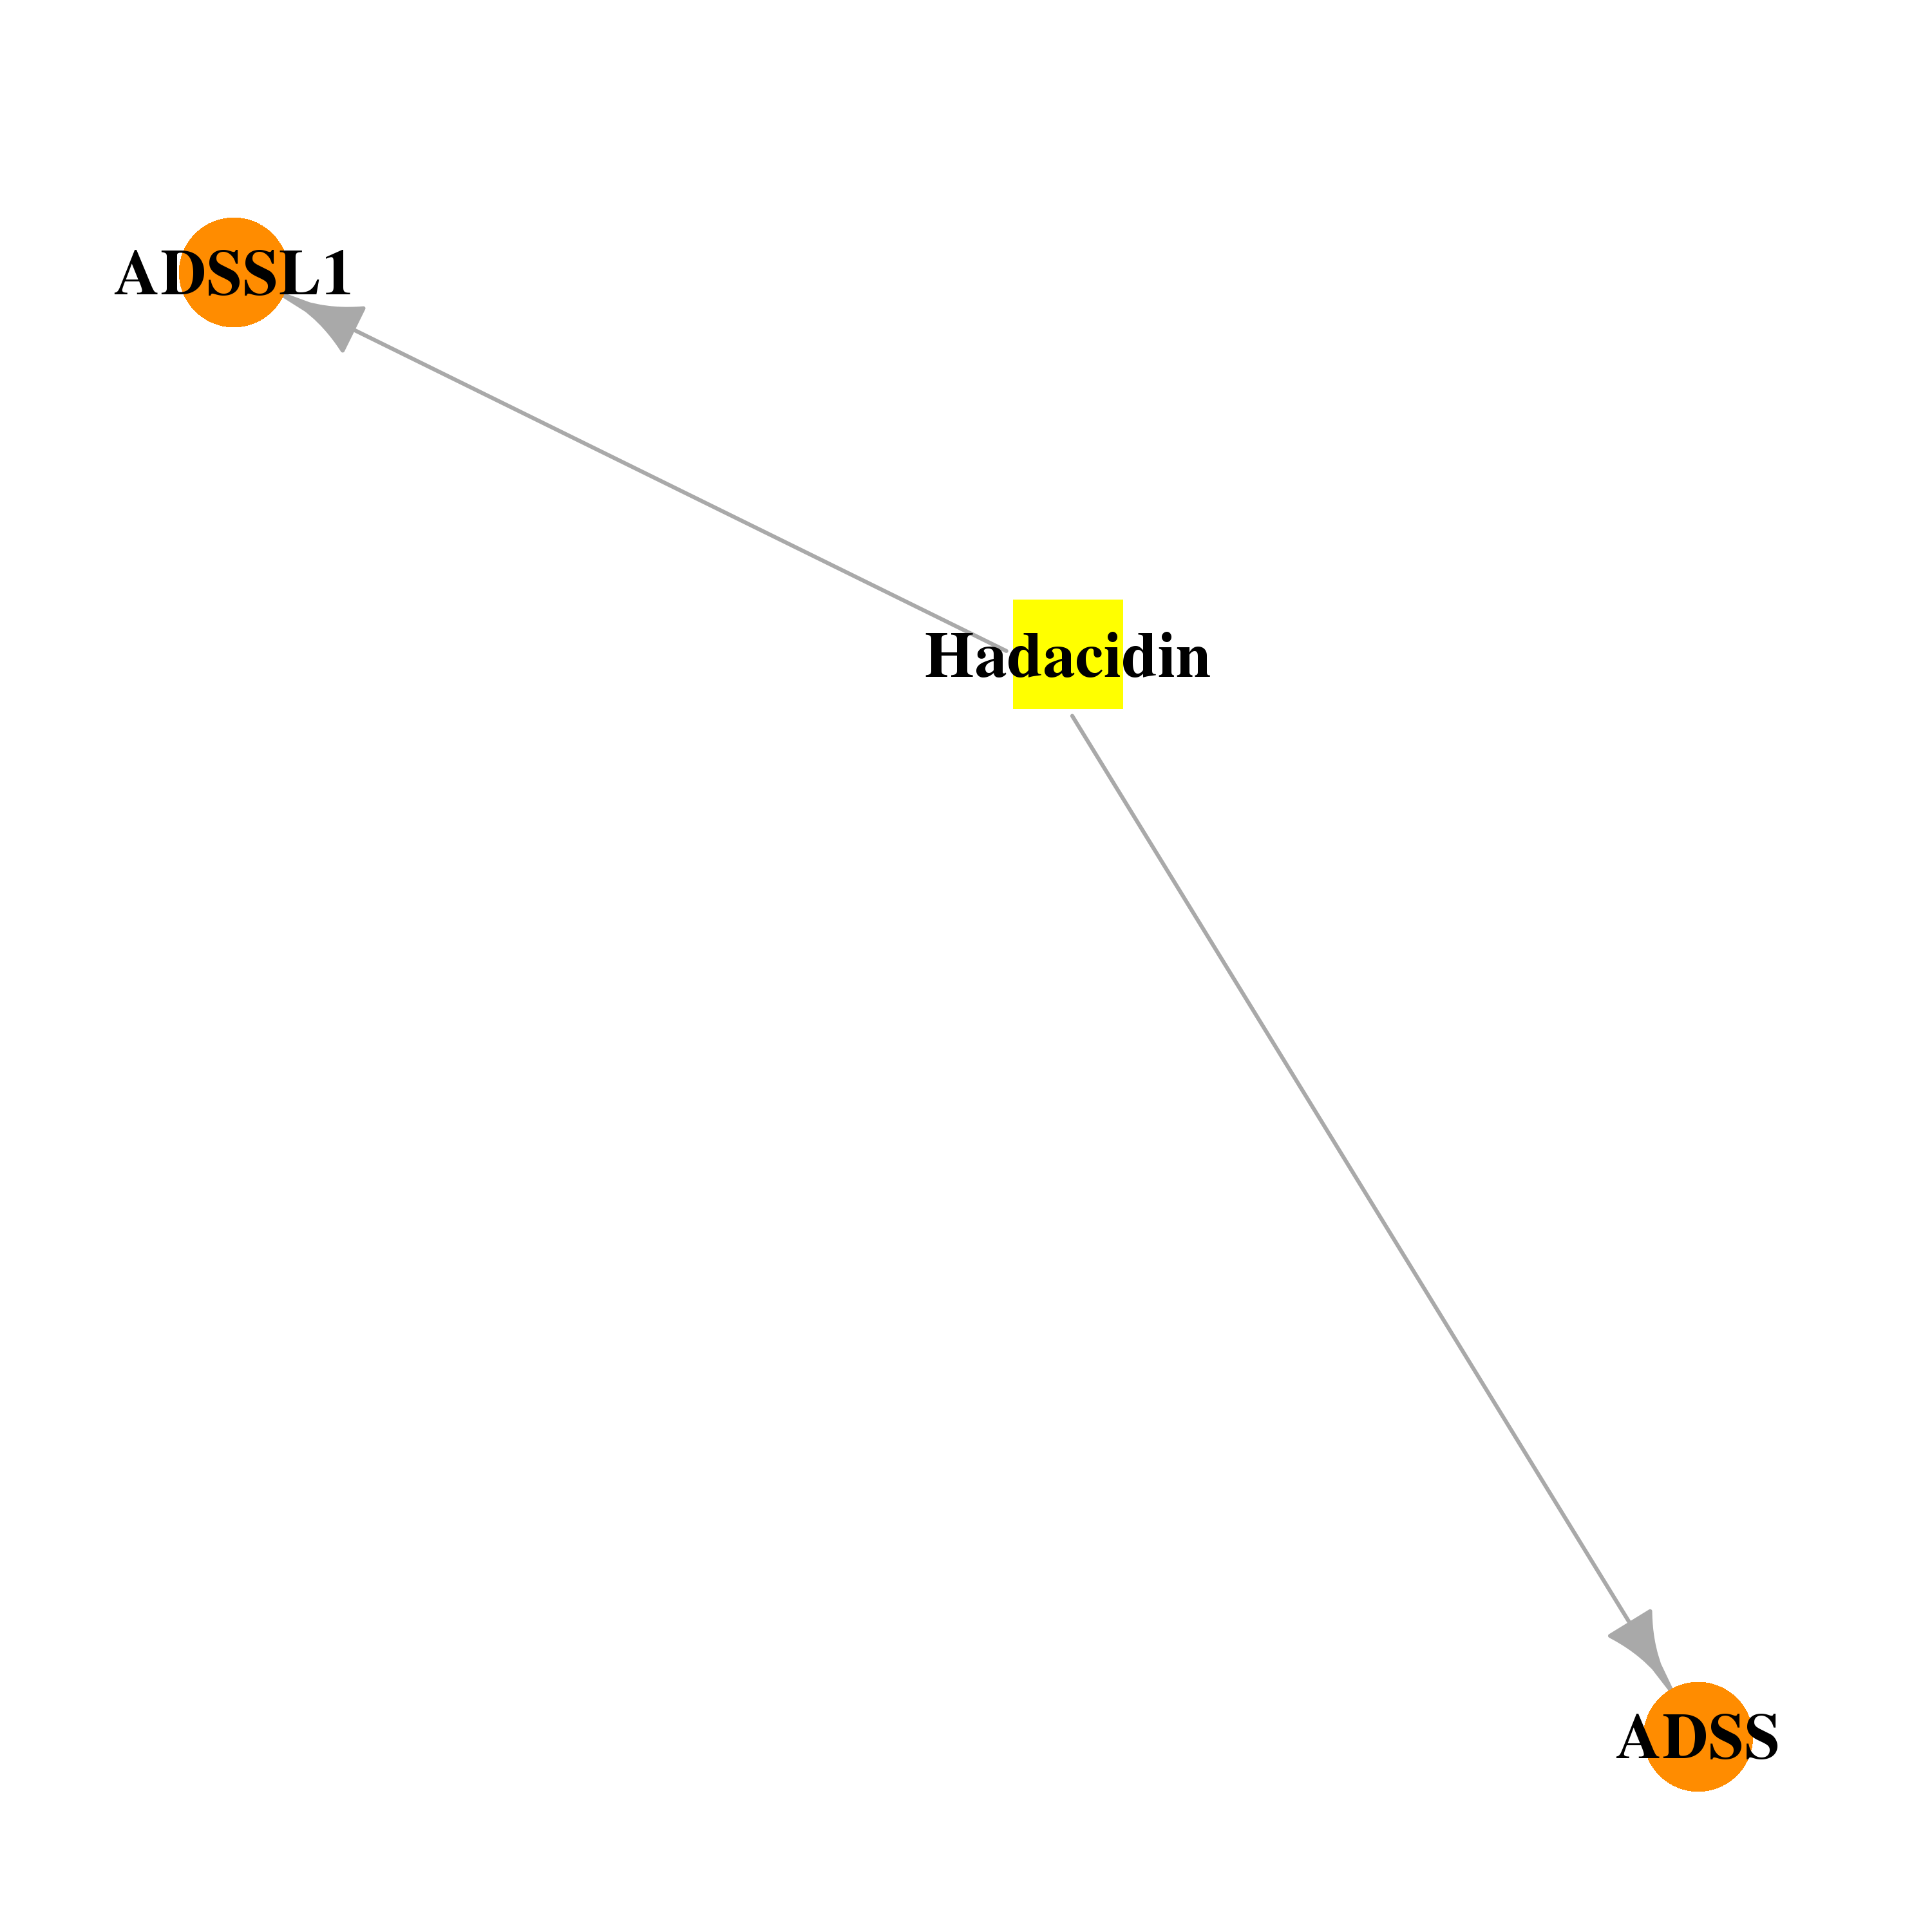 | 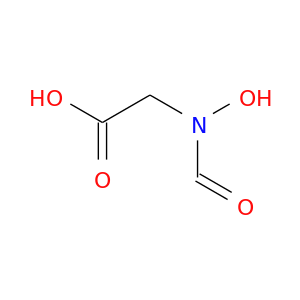 |
| DB03510 | adenylosuccinate synthase like 1 | experimental | 6-O-Phosphoryl Inosine Monophosphate |  |  |
| DB04137 | adenylosuccinate synthase like 1 | experimental | Guanosine-5'-Triphosphate | 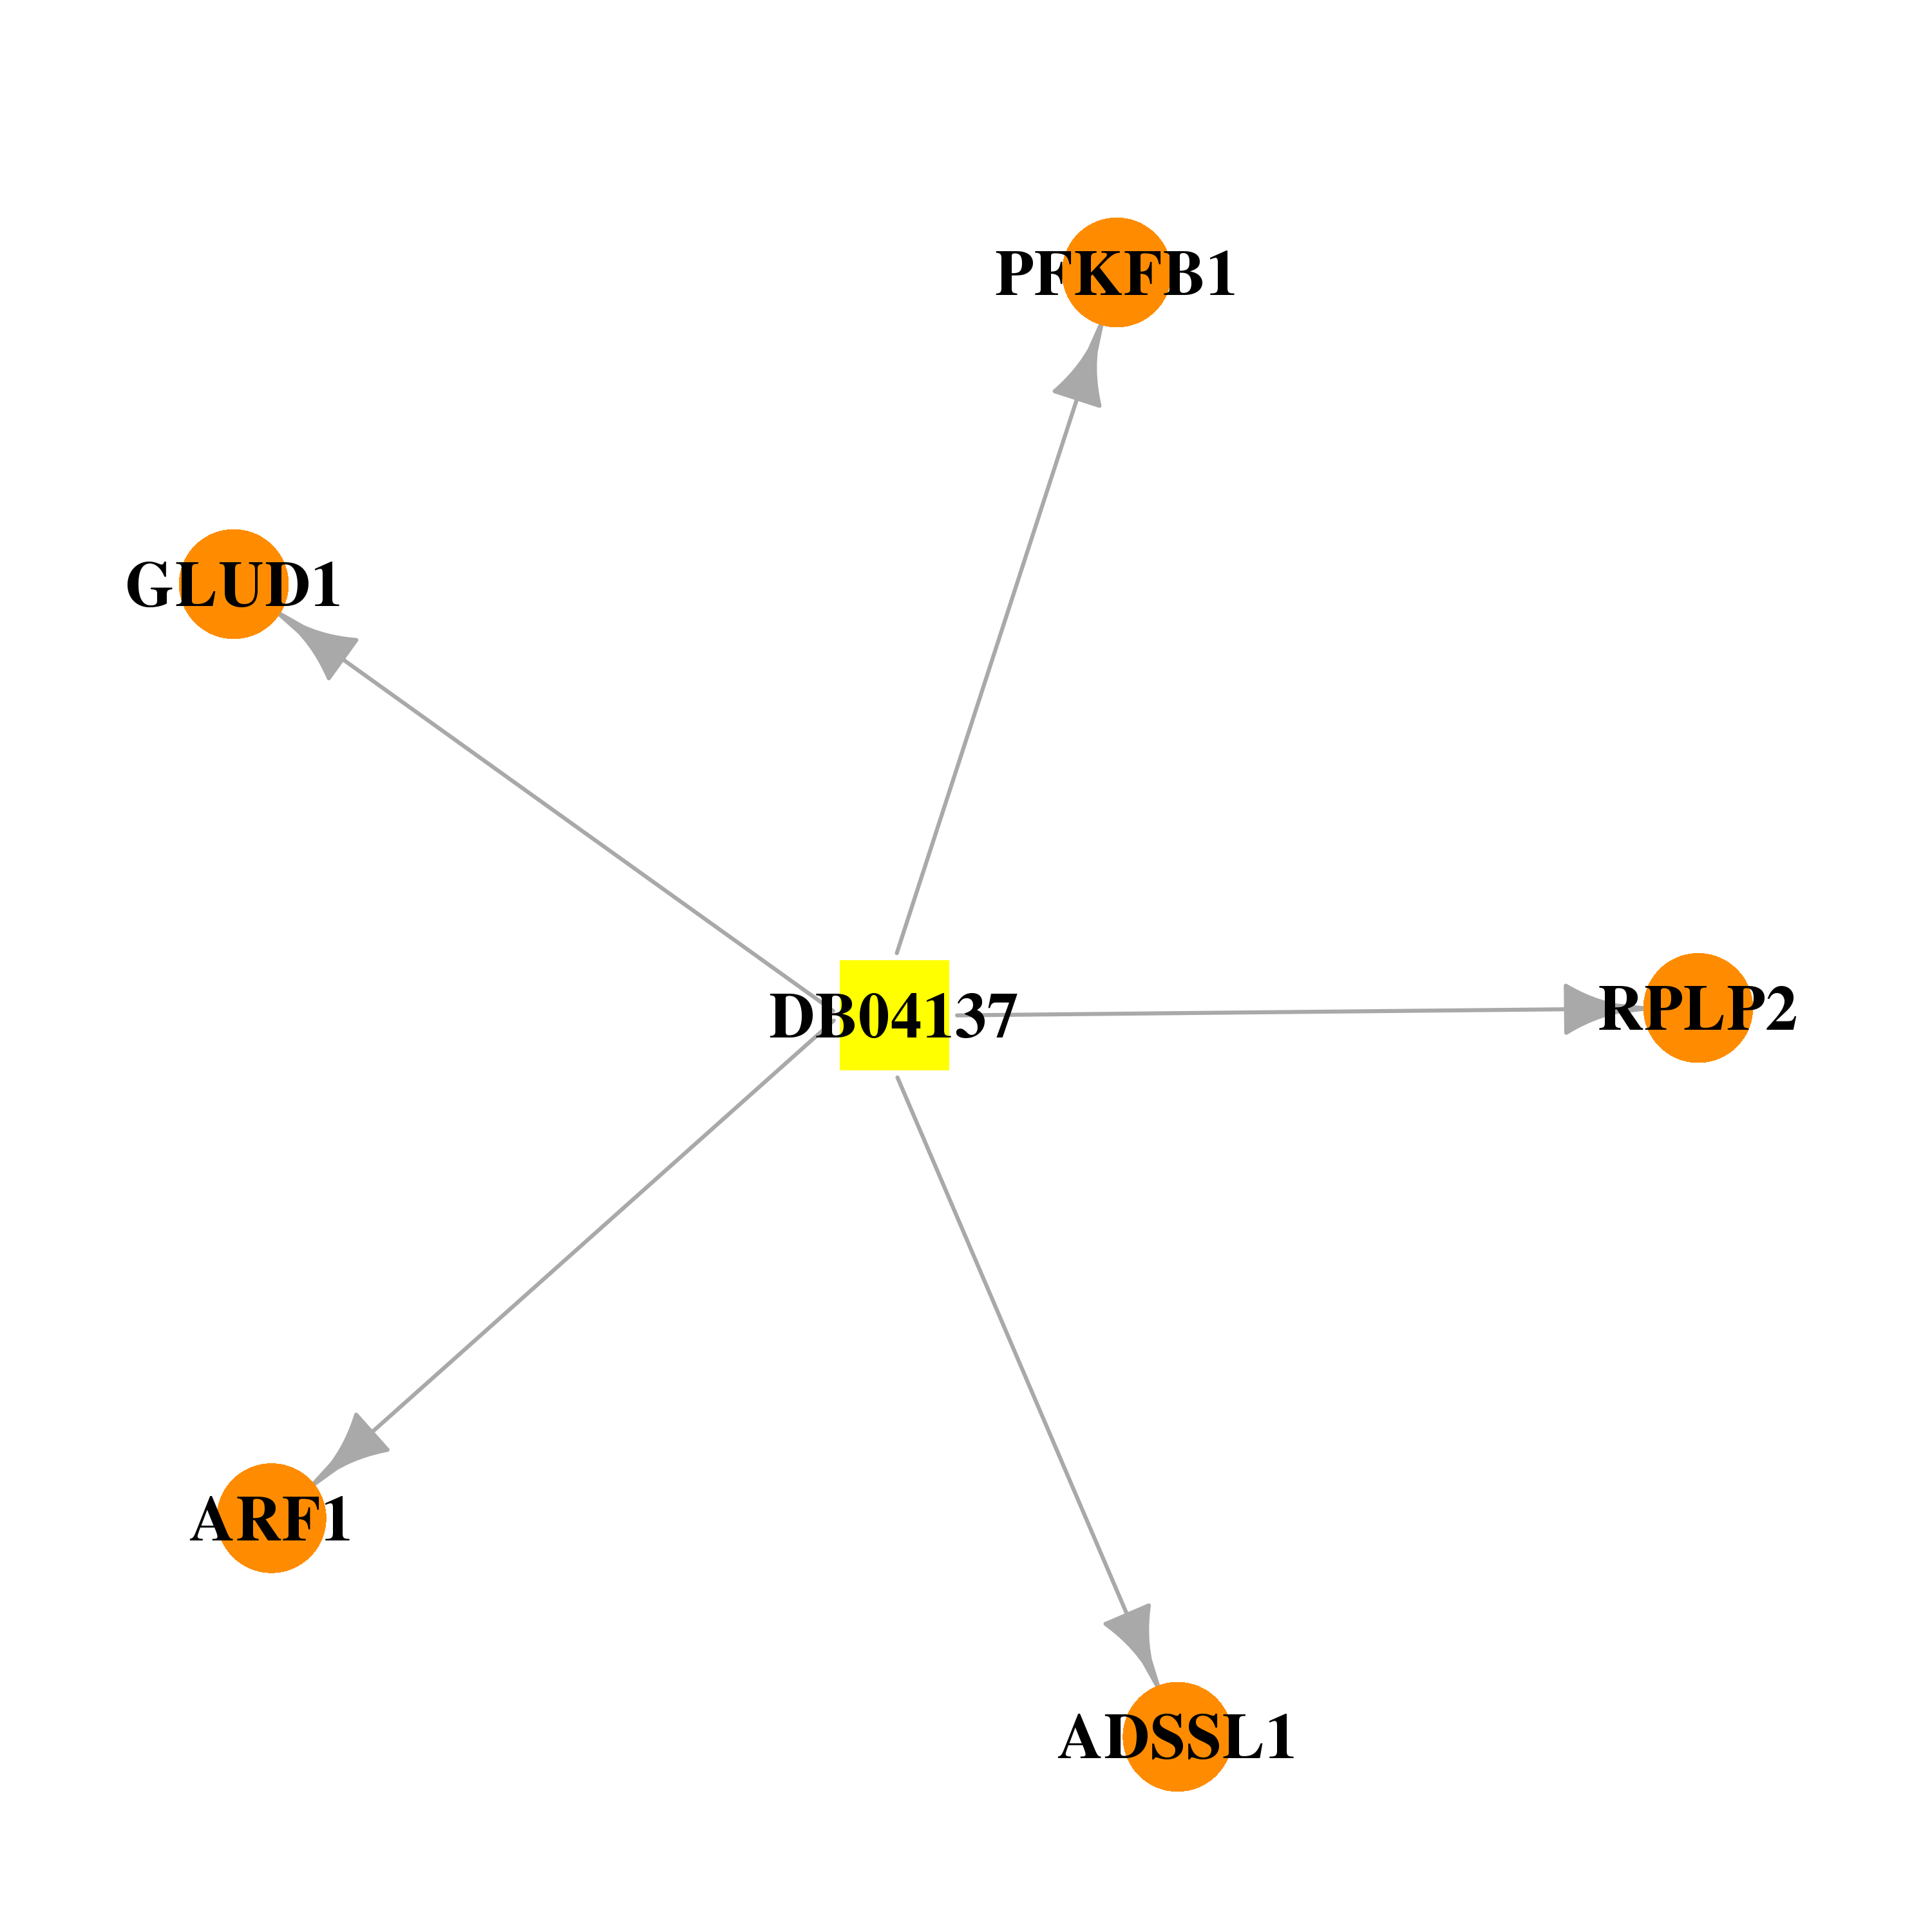 |  |
| DB04315 | adenylosuccinate synthase like 1 | experimental | Guanosine-5'-Diphosphate |  |  |
| DB04418 | adenylosuccinate synthase like 1 | experimental | Adenylosuccinic Acid |  |  |
| DB04566 | adenylosuccinate synthase like 1 | experimental | Inosinic Acid | 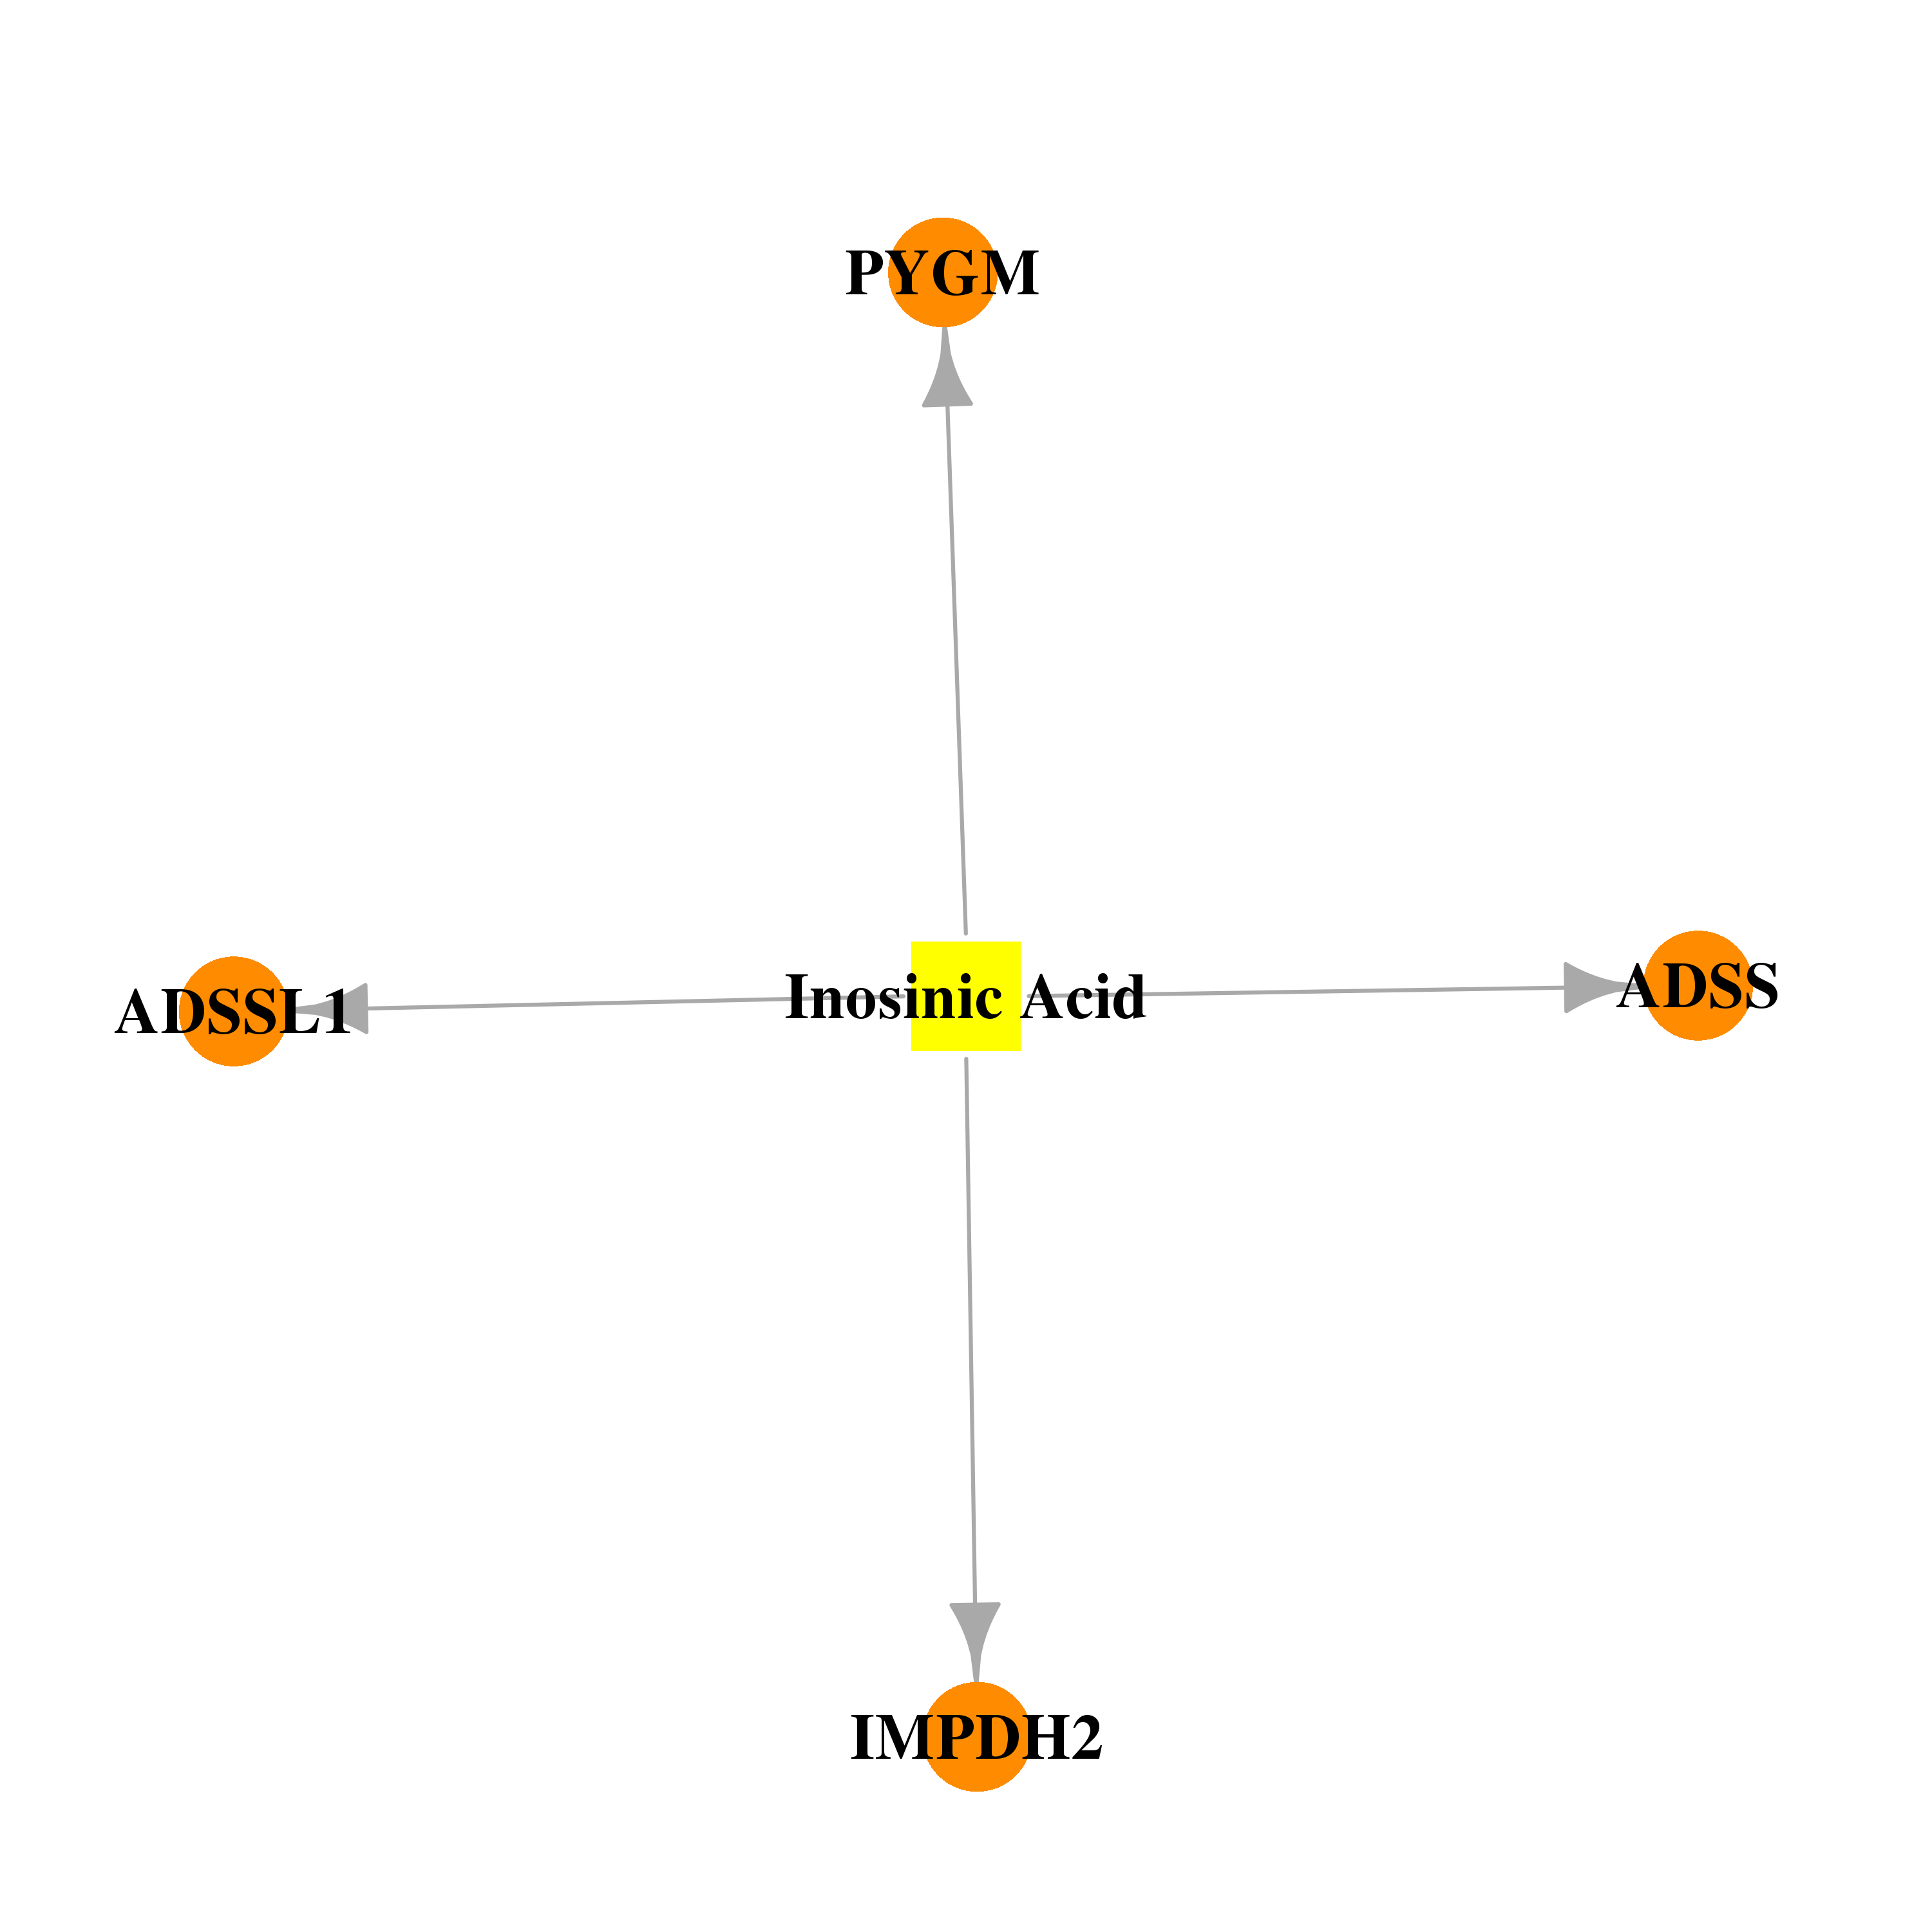 |  |
| Top |
| Cross referenced IDs for ADSSL1 |
| * We obtained these cross-references from Uniprot database. It covers 150 different DBs, 18 categories. http://www.uniprot.org/help/cross_references_section |
: Open all cross reference information
|
Copyright © 2016-Present - The Univsersity of Texas Health Science Center at Houston @ |