|
||||||||||||||||||||||||||||||||||||||||||||||||||||||||||||||||||||||||||||||||||||||||||||||||||||||||||||||||||||||||||||||||||||||||||||||||||||||||||||||||||||||||||||||||||||||||||||||||||||||||||||||||||||||||||||||||||||||||||||||||||||||||||||||||||||||||||||||||||||||||||||||||||||||||||||||||||||||||||
| |
| Phenotypic Information (metabolism pathway, cancer, disease, phenome) |
| |
| |
| Gene-Gene Network Information: Co-Expression Network, Interacting Genes & KEGG |
| |
|


| Gene Summary for PLIN2 |
| Basic gene info. | Gene symbol | PLIN2 |
| Gene name | perilipin 2 | |
| Synonyms | ADFP|ADRP | |
| Cytomap | UCSC genome browser: 9p22.1 | |
| Genomic location | chr9 :19115758-19127604 | |
| Type of gene | protein-coding | |
| RefGenes | NM_001122.3, NR_038064.1, | |
| Ensembl id | ENSG00000147872 | |
| Description | adipophilinadipose differentiation-related proteinperilipin-2 | |
| Modification date | 20141207 | |
| dbXrefs | MIM : 103195 | |
| HGNC : HGNC | ||
| Ensembl : ENSG00000147872 | ||
| HPRD : 00057 | ||
| Vega : OTTHUMG00000019624 | ||
| Protein | UniProt: go to UniProt's Cross Reference DB Table | |
| Expression | CleanEX: HS_PLIN2 | |
| BioGPS: 123 | ||
| Gene Expression Atlas: ENSG00000147872 | ||
| The Human Protein Atlas: ENSG00000147872 | ||
| Pathway | NCI Pathway Interaction Database: PLIN2 | |
| KEGG: PLIN2 | ||
| REACTOME: PLIN2 | ||
| ConsensusPathDB | ||
| Pathway Commons: PLIN2 | ||
| Metabolism | MetaCyc: PLIN2 | |
| HUMANCyc: PLIN2 | ||
| Regulation | Ensembl's Regulation: ENSG00000147872 | |
| miRBase: chr9 :19,115,758-19,127,604 | ||
| TargetScan: NM_001122 | ||
| cisRED: ENSG00000147872 | ||
| Context | iHOP: PLIN2 | |
| cancer metabolism search in PubMed: PLIN2 | ||
| UCL Cancer Institute: PLIN2 | ||
| Assigned class in ccmGDB | C | |
| Top |
| Phenotypic Information for PLIN2(metabolism pathway, cancer, disease, phenome) |
| Cancer | CGAP: PLIN2 |
| Familial Cancer Database: PLIN2 | |
| * This gene is included in those cancer gene databases. |
|
|
|
|
|
| . | ||||||||||||||||||||||||||||||||||||||||||||||||||||||||||||||||||||||||||||||||||||||||||||||||||||||||||||||||||||||||||||||||||||||||||||||||||||||||||||||||||||||||||||||||||||||||||||||||||||||||||||||||||||||||||||||||||||||||||||||||||||||||||||||||||||||||||||||||||||||||||||||||||||||||||||||||||||
Oncogene 1 | Significant driver gene in | |||||||||||||||||||||||||||||||||||||||||||||||||||||||||||||||||||||||||||||||||||||||||||||||||||||||||||||||||||||||||||||||||||||||||||||||||||||||||||||||||||||||||||||||||||||||||||||||||||||||||||||||||||||||||||||||||||||||||||||||||||||||||||||||||||||||||||||||||||||||||||||||||||||||||||||||||||||||||
| cf) number; DB name 1 Oncogene; http://nar.oxfordjournals.org/content/35/suppl_1/D721.long, 2 Tumor Suppressor gene; https://bioinfo.uth.edu/TSGene/, 3 Cancer Gene Census; http://www.nature.com/nrc/journal/v4/n3/abs/nrc1299.html, 4 CancerGenes; http://nar.oxfordjournals.org/content/35/suppl_1/D721.long, 5 Network of Cancer Gene; http://ncg.kcl.ac.uk/index.php, 1Therapeutic Vulnerabilities in Cancer; http://cbio.mskcc.org/cancergenomics/statius/ |
| REACTOME_METABOLISM_OF_LIPIDS_AND_LIPOPROTEINS | |
| OMIM | |
| Orphanet | |
| Disease | KEGG Disease: PLIN2 |
| MedGen: PLIN2 (Human Medical Genetics with Condition) | |
| ClinVar: PLIN2 | |
| Phenotype | MGI: PLIN2 (International Mouse Phenotyping Consortium) |
| PhenomicDB: PLIN2 | |
| Mutations for PLIN2 |
| * Under tables are showing count per each tissue to give us broad intuition about tissue specific mutation patterns.You can go to the detailed page for each mutation database's web site. |
| - Statistics for Tissue and Mutation type | Top |
 |
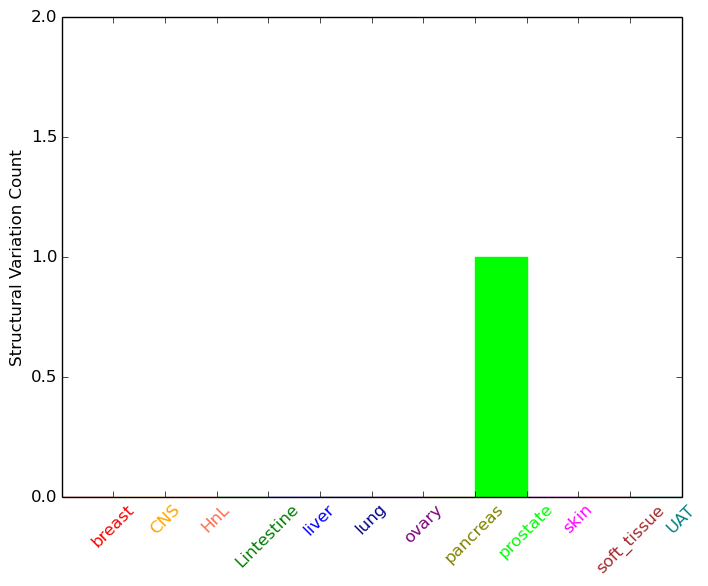
| - For Inter-chromosomal Variations |
| * Inter-chromosomal variantions includes 'interchromosomal amplicon to amplicon', 'interchromosomal amplicon to non-amplified dna', 'interchromosomal insertion', 'Interchromosomal unknown type'. |
 |
| - For Intra-chromosomal Variations |
| * Intra-chromosomal variantions includes 'intrachromosomal amplicon to amplicon', 'intrachromosomal amplicon to non-amplified dna', 'intrachromosomal deletion', 'intrachromosomal fold-back inversion', 'intrachromosomal inversion', 'intrachromosomal tandem duplication', 'Intrachromosomal unknown type', 'intrachromosomal with inverted orientation', 'intrachromosomal with non-inverted orientation'. |
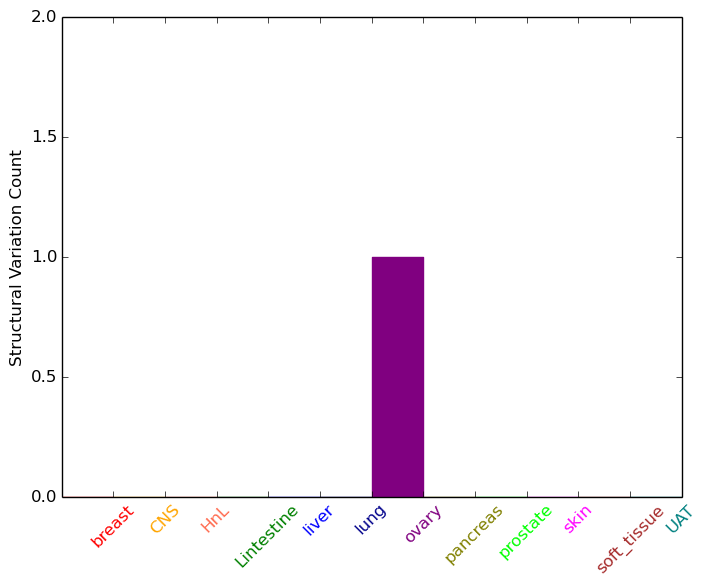 |
| Sample | Symbol_a | Chr_a | Start_a | End_a | Symbol_b | Chr_b | Start_b | End_b |
| ovary | PLIN2 | chr9 | 19122945 | 19122965 | PLIN2 | chr9 | 19123023 | 19123043 |
| prostate | PLIN2 | chr9 | 19122956 | 19122956 | PDPR | chr16 | 70176108 | 70176108 |
| cf) Tissue number; Tissue name (1;Breast, 2;Central_nervous_system, 3;Haematopoietic_and_lymphoid_tissue, 4;Large_intestine, 5;Liver, 6;Lung, 7;Ovary, 8;Pancreas, 9;Prostate, 10;Skin, 11;Soft_tissue, 12;Upper_aerodigestive_tract) |
| * From mRNA Sanger sequences, Chitars2.0 arranged chimeric transcripts. This table shows PLIN2 related fusion information. |
| ID | Head Gene | Tail Gene | Accession | Gene_a | qStart_a | qEnd_a | Chromosome_a | tStart_a | tEnd_a | Gene_a | qStart_a | qEnd_a | Chromosome_a | tStart_a | tEnd_a |
| BG314910 | SQSTM1 | 1 | 250 | 5 | 179252166 | 179260220 | PLIN2 | 246 | 626 | 9 | 19121071 | 19126403 | |
| BG314836 | GSTO1 | 6 | 183 | 10 | 106014951 | 106019431 | PLIN2 | 175 | 556 | 9 | 19115888 | 19116268 | |
| Top |
| Mutation type/ Tissue ID | brca | cns | cerv | endome | haematopo | kidn | Lintest | liver | lung | ns | ovary | pancre | prost | skin | stoma | thyro | urina | |||
| Total # sample | 1 | |||||||||||||||||||
| GAIN (# sample) | 1 | |||||||||||||||||||
| LOSS (# sample) |
| cf) Tissue ID; Tissue type (1; Breast, 2; Central_nervous_system, 3; Cervix, 4; Endometrium, 5; Haematopoietic_and_lymphoid_tissue, 6; Kidney, 7; Large_intestine, 8; Liver, 9; Lung, 10; NS, 11; Ovary, 12; Pancreas, 13; Prostate, 14; Skin, 15; Stomach, 16; Thyroid, 17; Urinary_tract) |
| Top |
|
 |
| Top |
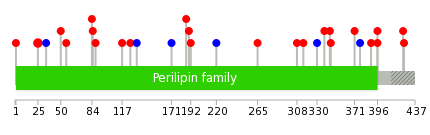
| Stat. for Non-Synonymous SNVs (# total SNVs=41) | (# total SNVs=8) |
 |  |
(# total SNVs=0) | (# total SNVs=0) |
| Top |
| * When you move the cursor on each content, you can see more deailed mutation information on the Tooltip. Those are primary_site,primary_histology,mutation(aa),pubmedID. |
| GRCh37 position | Mutation(aa) | Unique sampleID count |
| chr9:19126246-19126246 | p.S31L | 3 |
| chr9:19126124-19126124 | p.L72V | 2 |
| chr9:19126181-19126181 | p.G53S | 2 |
| chr9:19119764-19119764 | p.G221* | 2 |
| chr9:19116373-19116373 | p.T396K | 2 |
| chr9:19126223-19126223 | p.Q39* | 2 |
| chr9:19126236-19126236 | p.L34L | 2 |
| chr9:19126264-19126264 | p.T25M | 2 |
| chr9:19116286-19116286 | p.S425N | 1 |
| chr9:19121074-19121074 | p.T133T | 1 |
| Top |
|
 |
| Point Mutation/ Tissue ID | 1 | 2 | 3 | 4 | 5 | 6 | 7 | 8 | 9 | 10 | 11 | 12 | 13 | 14 | 15 | 16 | 17 | 18 | 19 | 20 |
| # sample | 2 | 5 | 2 | 1 | 2 | 3 | 2 | 2 | 1 | 3 | 6 | |||||||||
| # mutation | 2 | 5 | 2 | 1 | 2 | 3 | 2 | 2 | 1 | 3 | 6 | |||||||||
| nonsynonymous SNV | 2 | 4 | 2 | 1 | 2 | 3 | 2 | 1 | 3 | 4 | ||||||||||
| synonymous SNV | 1 | 2 | 2 |
| cf) Tissue ID; Tissue type (1; BLCA[Bladder Urothelial Carcinoma], 2; BRCA[Breast invasive carcinoma], 3; CESC[Cervical squamous cell carcinoma and endocervical adenocarcinoma], 4; COAD[Colon adenocarcinoma], 5; GBM[Glioblastoma multiforme], 6; Glioma Low Grade, 7; HNSC[Head and Neck squamous cell carcinoma], 8; KICH[Kidney Chromophobe], 9; KIRC[Kidney renal clear cell carcinoma], 10; KIRP[Kidney renal papillary cell carcinoma], 11; LAML[Acute Myeloid Leukemia], 12; LUAD[Lung adenocarcinoma], 13; LUSC[Lung squamous cell carcinoma], 14; OV[Ovarian serous cystadenocarcinoma ], 15; PAAD[Pancreatic adenocarcinoma], 16; PRAD[Prostate adenocarcinoma], 17; SKCM[Skin Cutaneous Melanoma], 18:STAD[Stomach adenocarcinoma], 19:THCA[Thyroid carcinoma], 20:UCEC[Uterine Corpus Endometrial Carcinoma]) |
| Top |
| * We represented just top 10 SNVs. When you move the cursor on each content, you can see more deailed mutation information on the Tooltip. Those are primary_site, primary_histology, mutation(aa), pubmedID. |
| Genomic Position | Mutation(aa) | Unique sampleID count |
| chr9:19126264 | p.T25M | 2 |
| chr9:19116373 | p.K424N | 1 |
| chr9:19118436 | p.V187L | 1 |
| chr9:19123621 | p.T396K | 1 |
| chr9:19116374 | p.L171L | 1 |
| chr9:19119765 | p.T396A | 1 |
| chr9:19126171 | p.T133T | 1 |
| chr9:19116393 | p.M389I | 1 |
| chr9:19120899 | p.A126T | 1 |
| chr9:19126190 | p.Q377Q | 1 |
| * Copy number data were extracted from TCGA using R package TCGA-Assembler. The URLs of all public data files on TCGA DCC data server were gathered on Jan-05-2015. Function ProcessCNAData in TCGA-Assembler package was used to obtain gene-level copy number value which is calculated as the average copy number of the genomic region of a gene. |
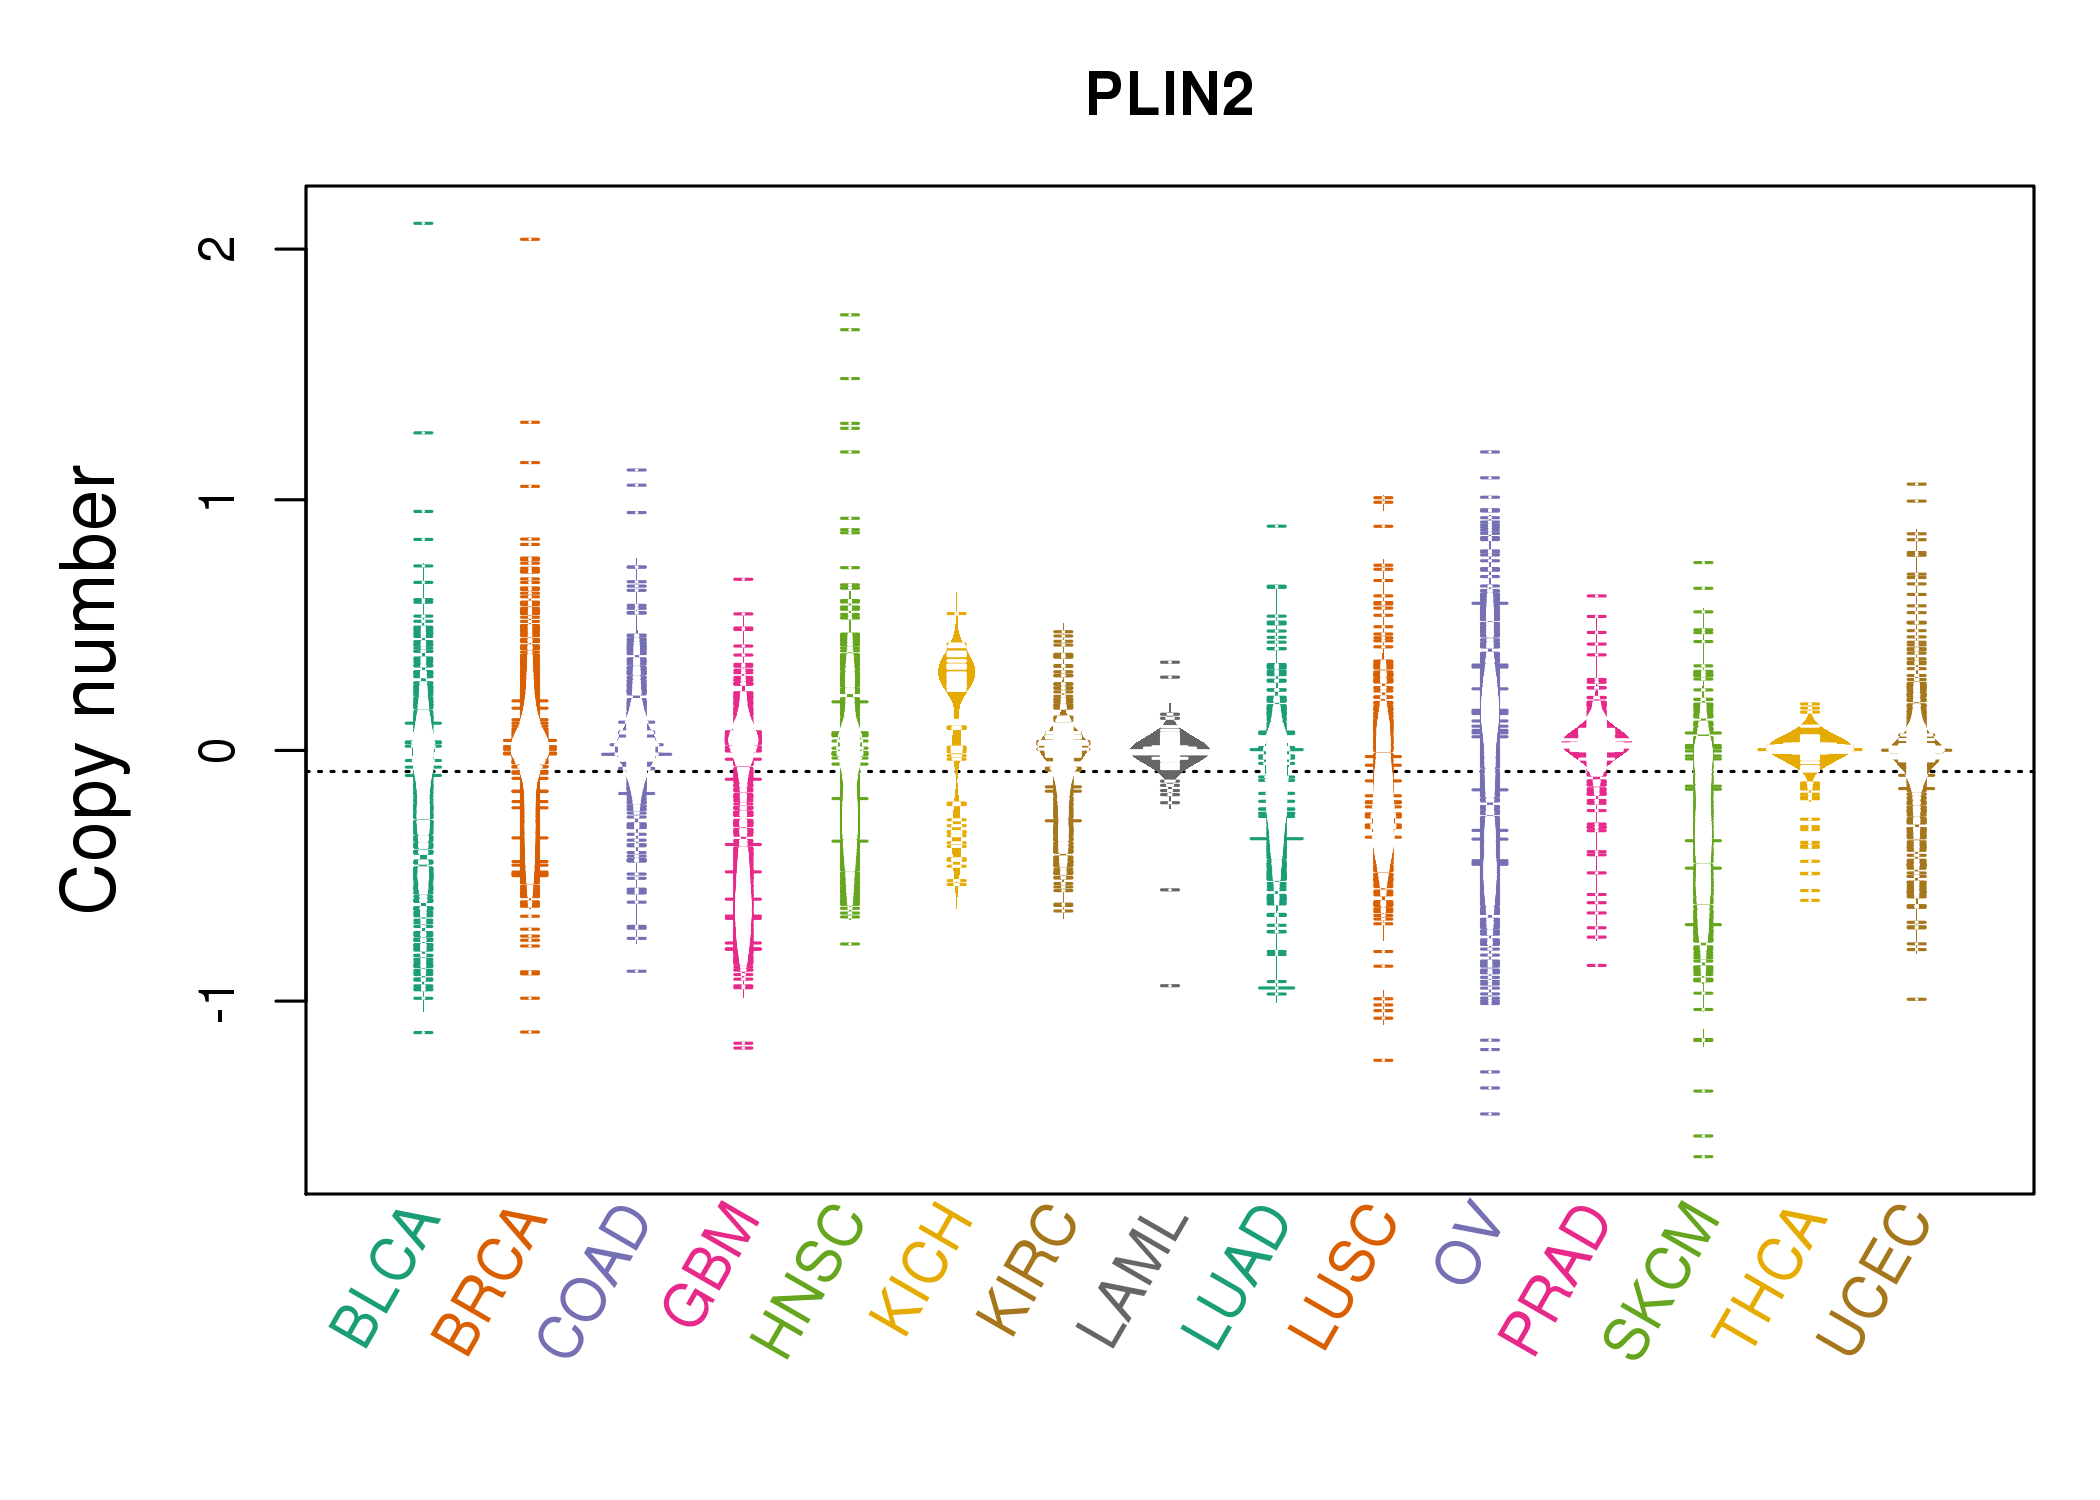 |
| cf) Tissue ID[Tissue type]: BLCA[Bladder Urothelial Carcinoma], BRCA[Breast invasive carcinoma], CESC[Cervical squamous cell carcinoma and endocervical adenocarcinoma], COAD[Colon adenocarcinoma], GBM[Glioblastoma multiforme], Glioma Low Grade, HNSC[Head and Neck squamous cell carcinoma], KICH[Kidney Chromophobe], KIRC[Kidney renal clear cell carcinoma], KIRP[Kidney renal papillary cell carcinoma], LAML[Acute Myeloid Leukemia], LUAD[Lung adenocarcinoma], LUSC[Lung squamous cell carcinoma], OV[Ovarian serous cystadenocarcinoma ], PAAD[Pancreatic adenocarcinoma], PRAD[Prostate adenocarcinoma], SKCM[Skin Cutaneous Melanoma], STAD[Stomach adenocarcinoma], THCA[Thyroid carcinoma], UCEC[Uterine Corpus Endometrial Carcinoma] |
| Top |
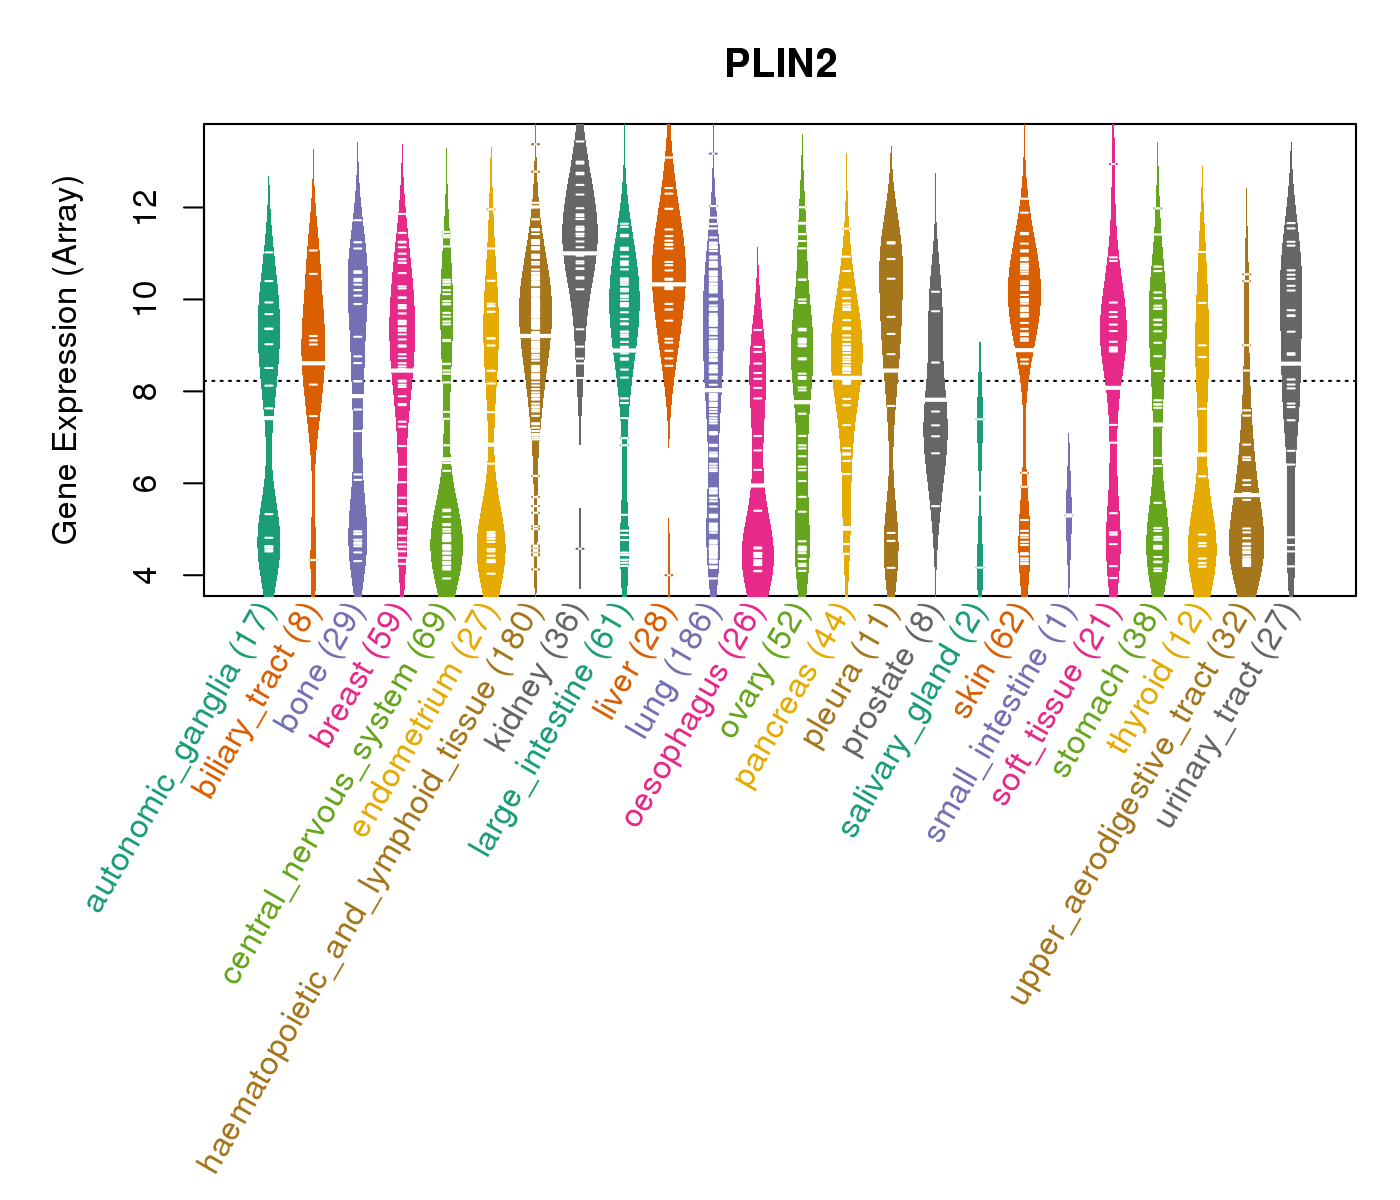
| Gene Expression for PLIN2 |
| * CCLE gene expression data were extracted from CCLE_Expression_Entrez_2012-10-18.res: Gene-centric RMA-normalized mRNA expression data. |
 |
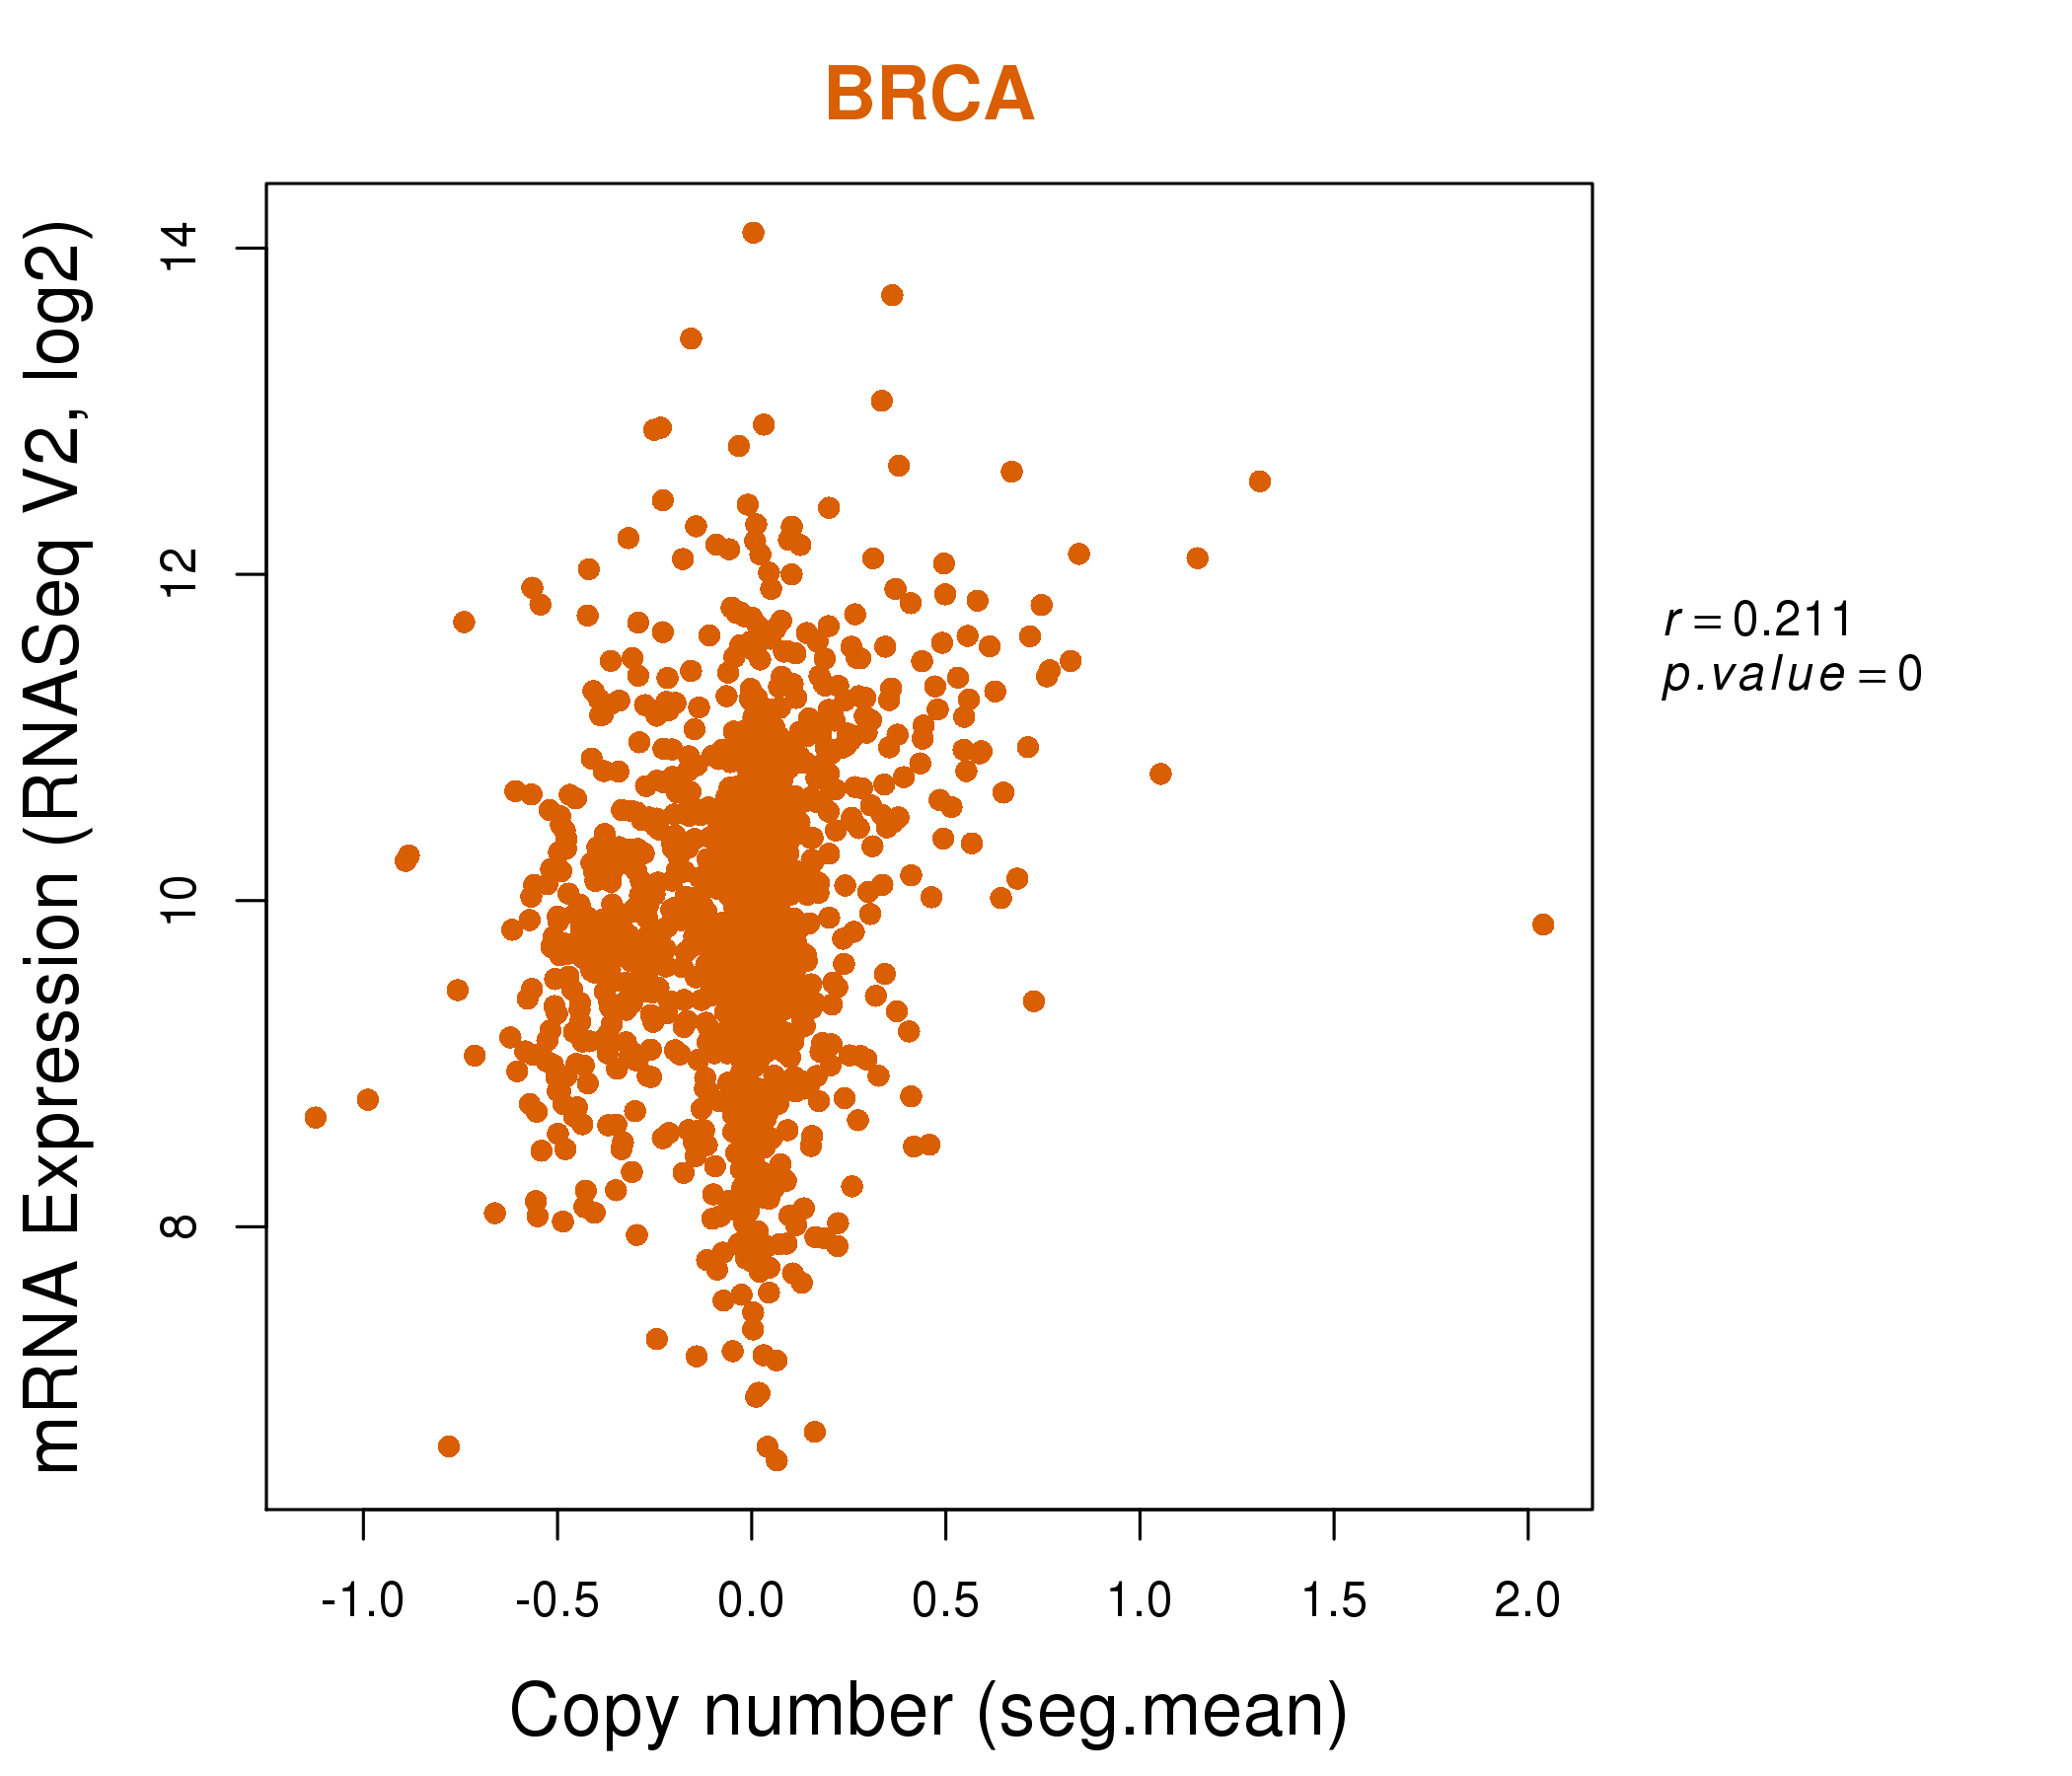
| * Normalized gene expression data of RNASeqV2 was extracted from TCGA using R package TCGA-Assembler. The URLs of all public data files on TCGA DCC data server were gathered at Jan-05-2015. Only eight cancer types have enough normal control samples for differential expression analysis. (t test, adjusted p<0.05 (using Benjamini-Hochberg FDR)) |
 |
| Top |
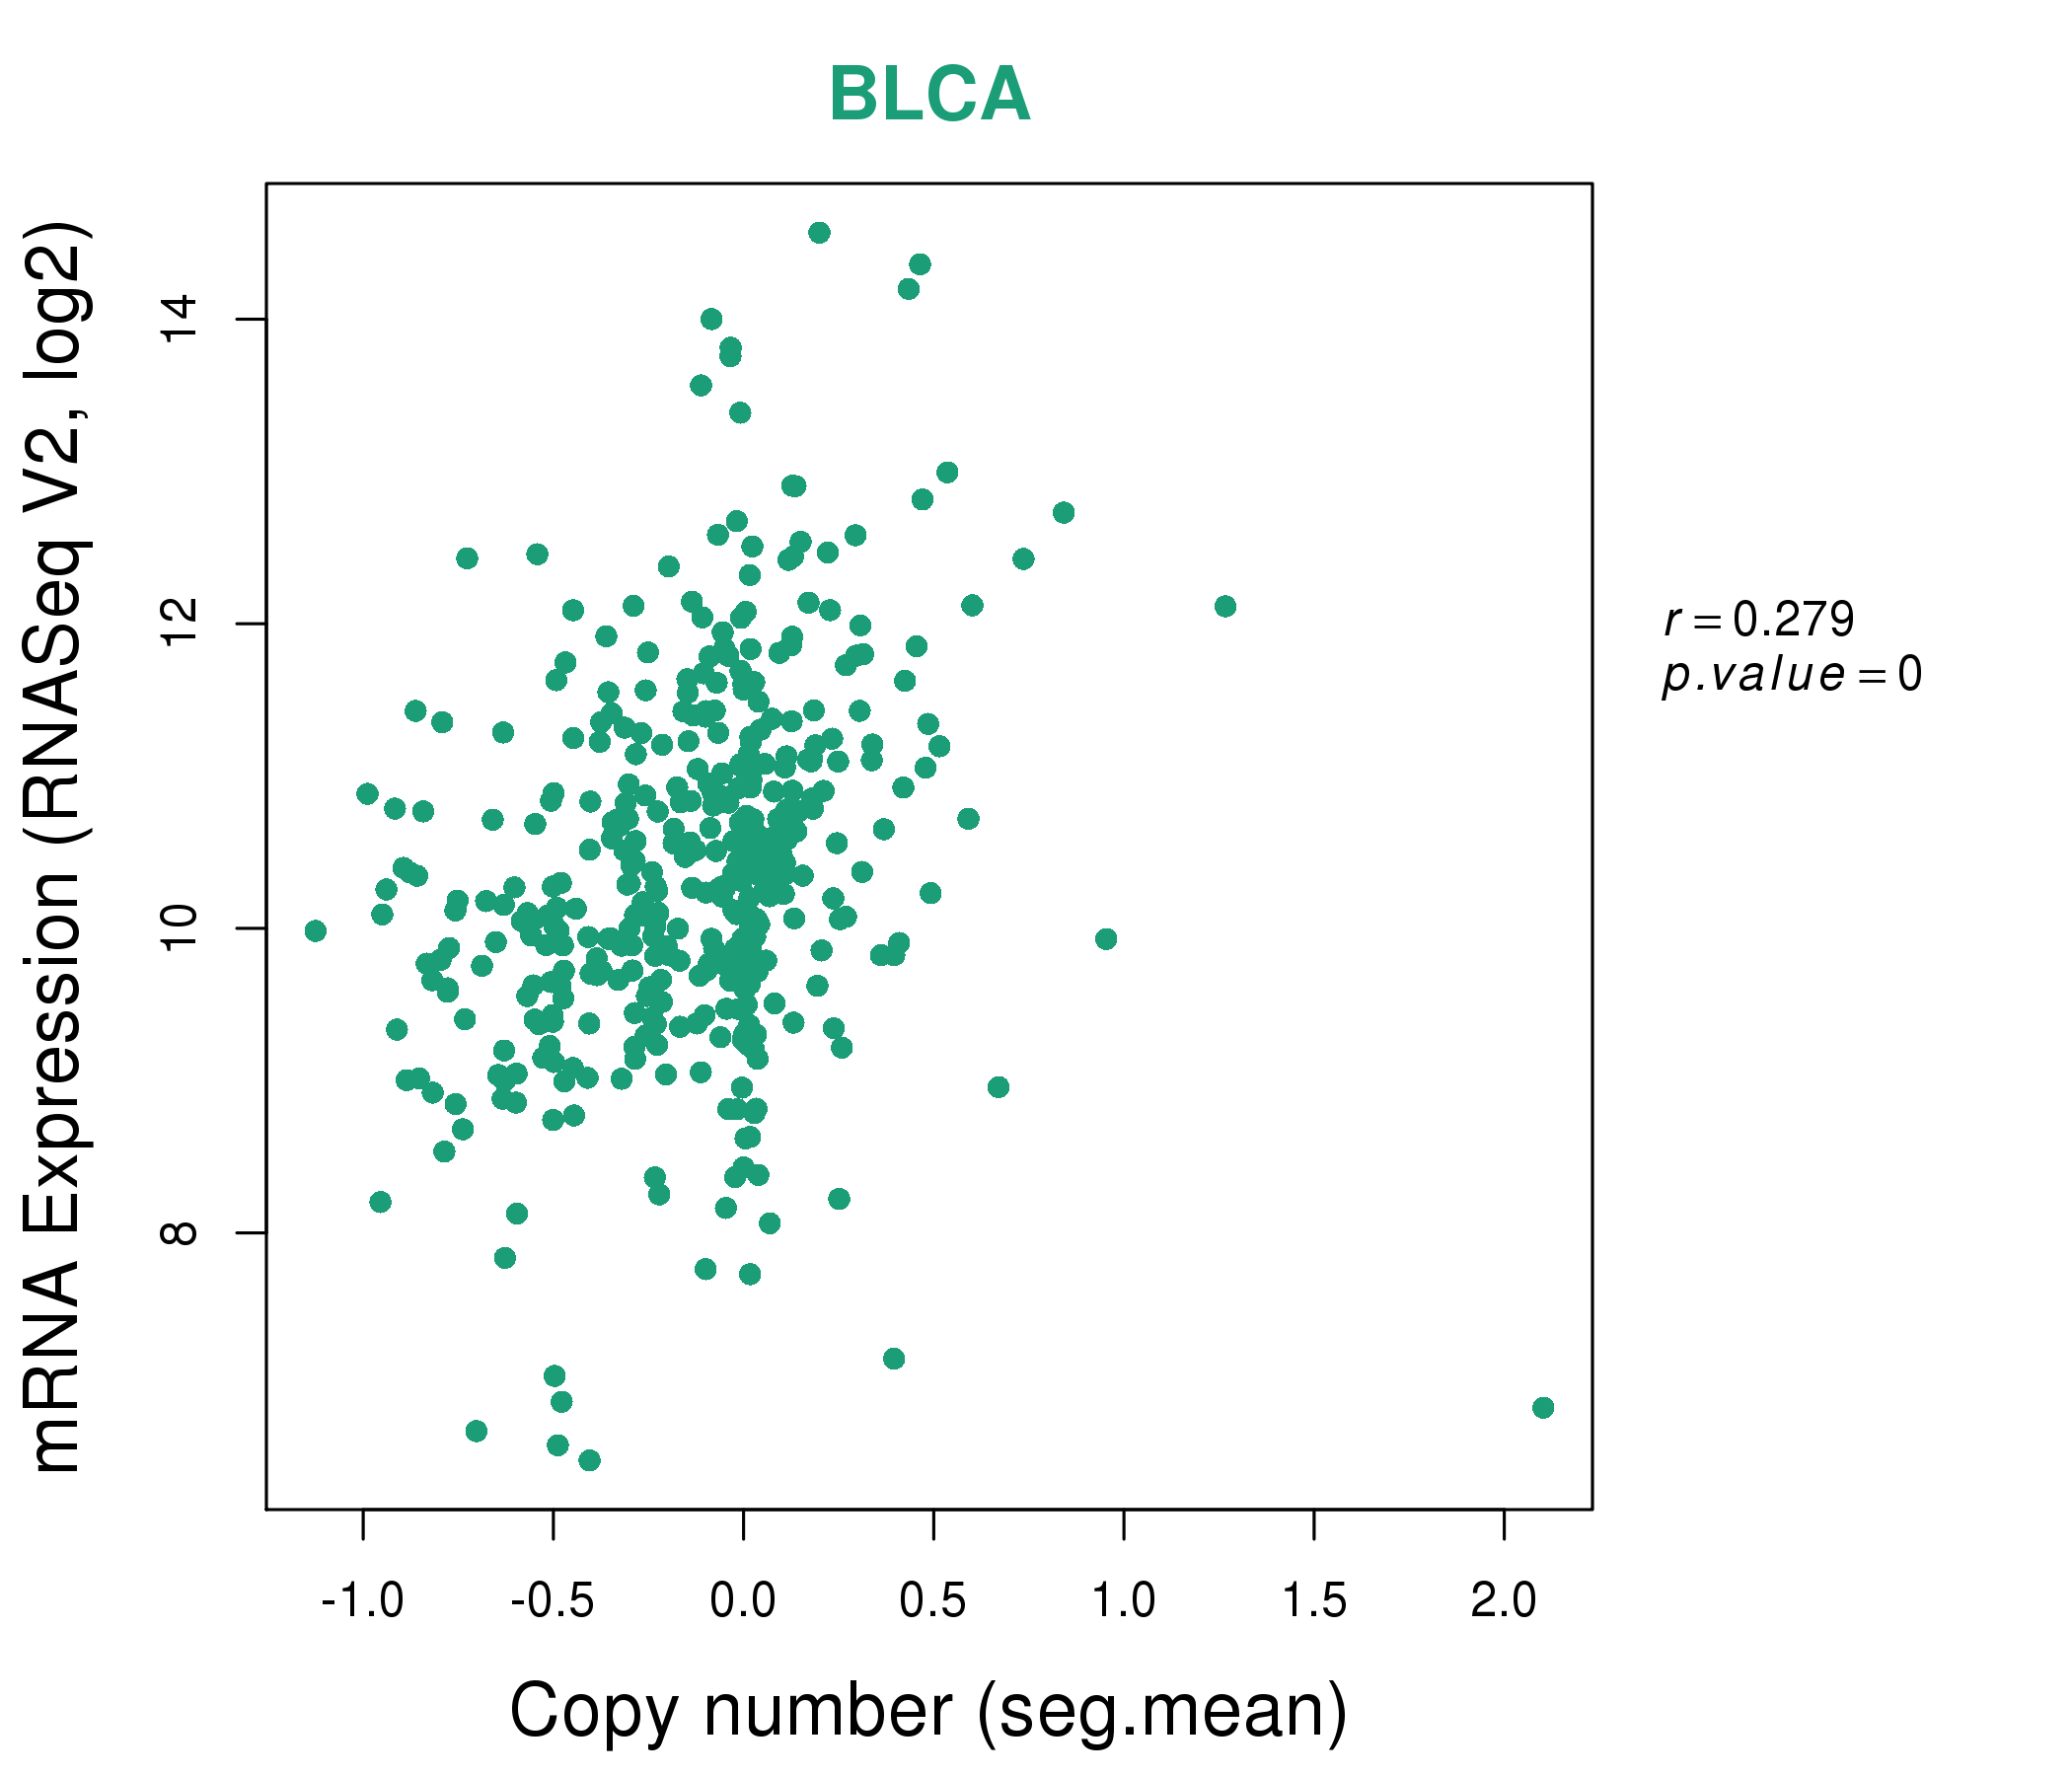
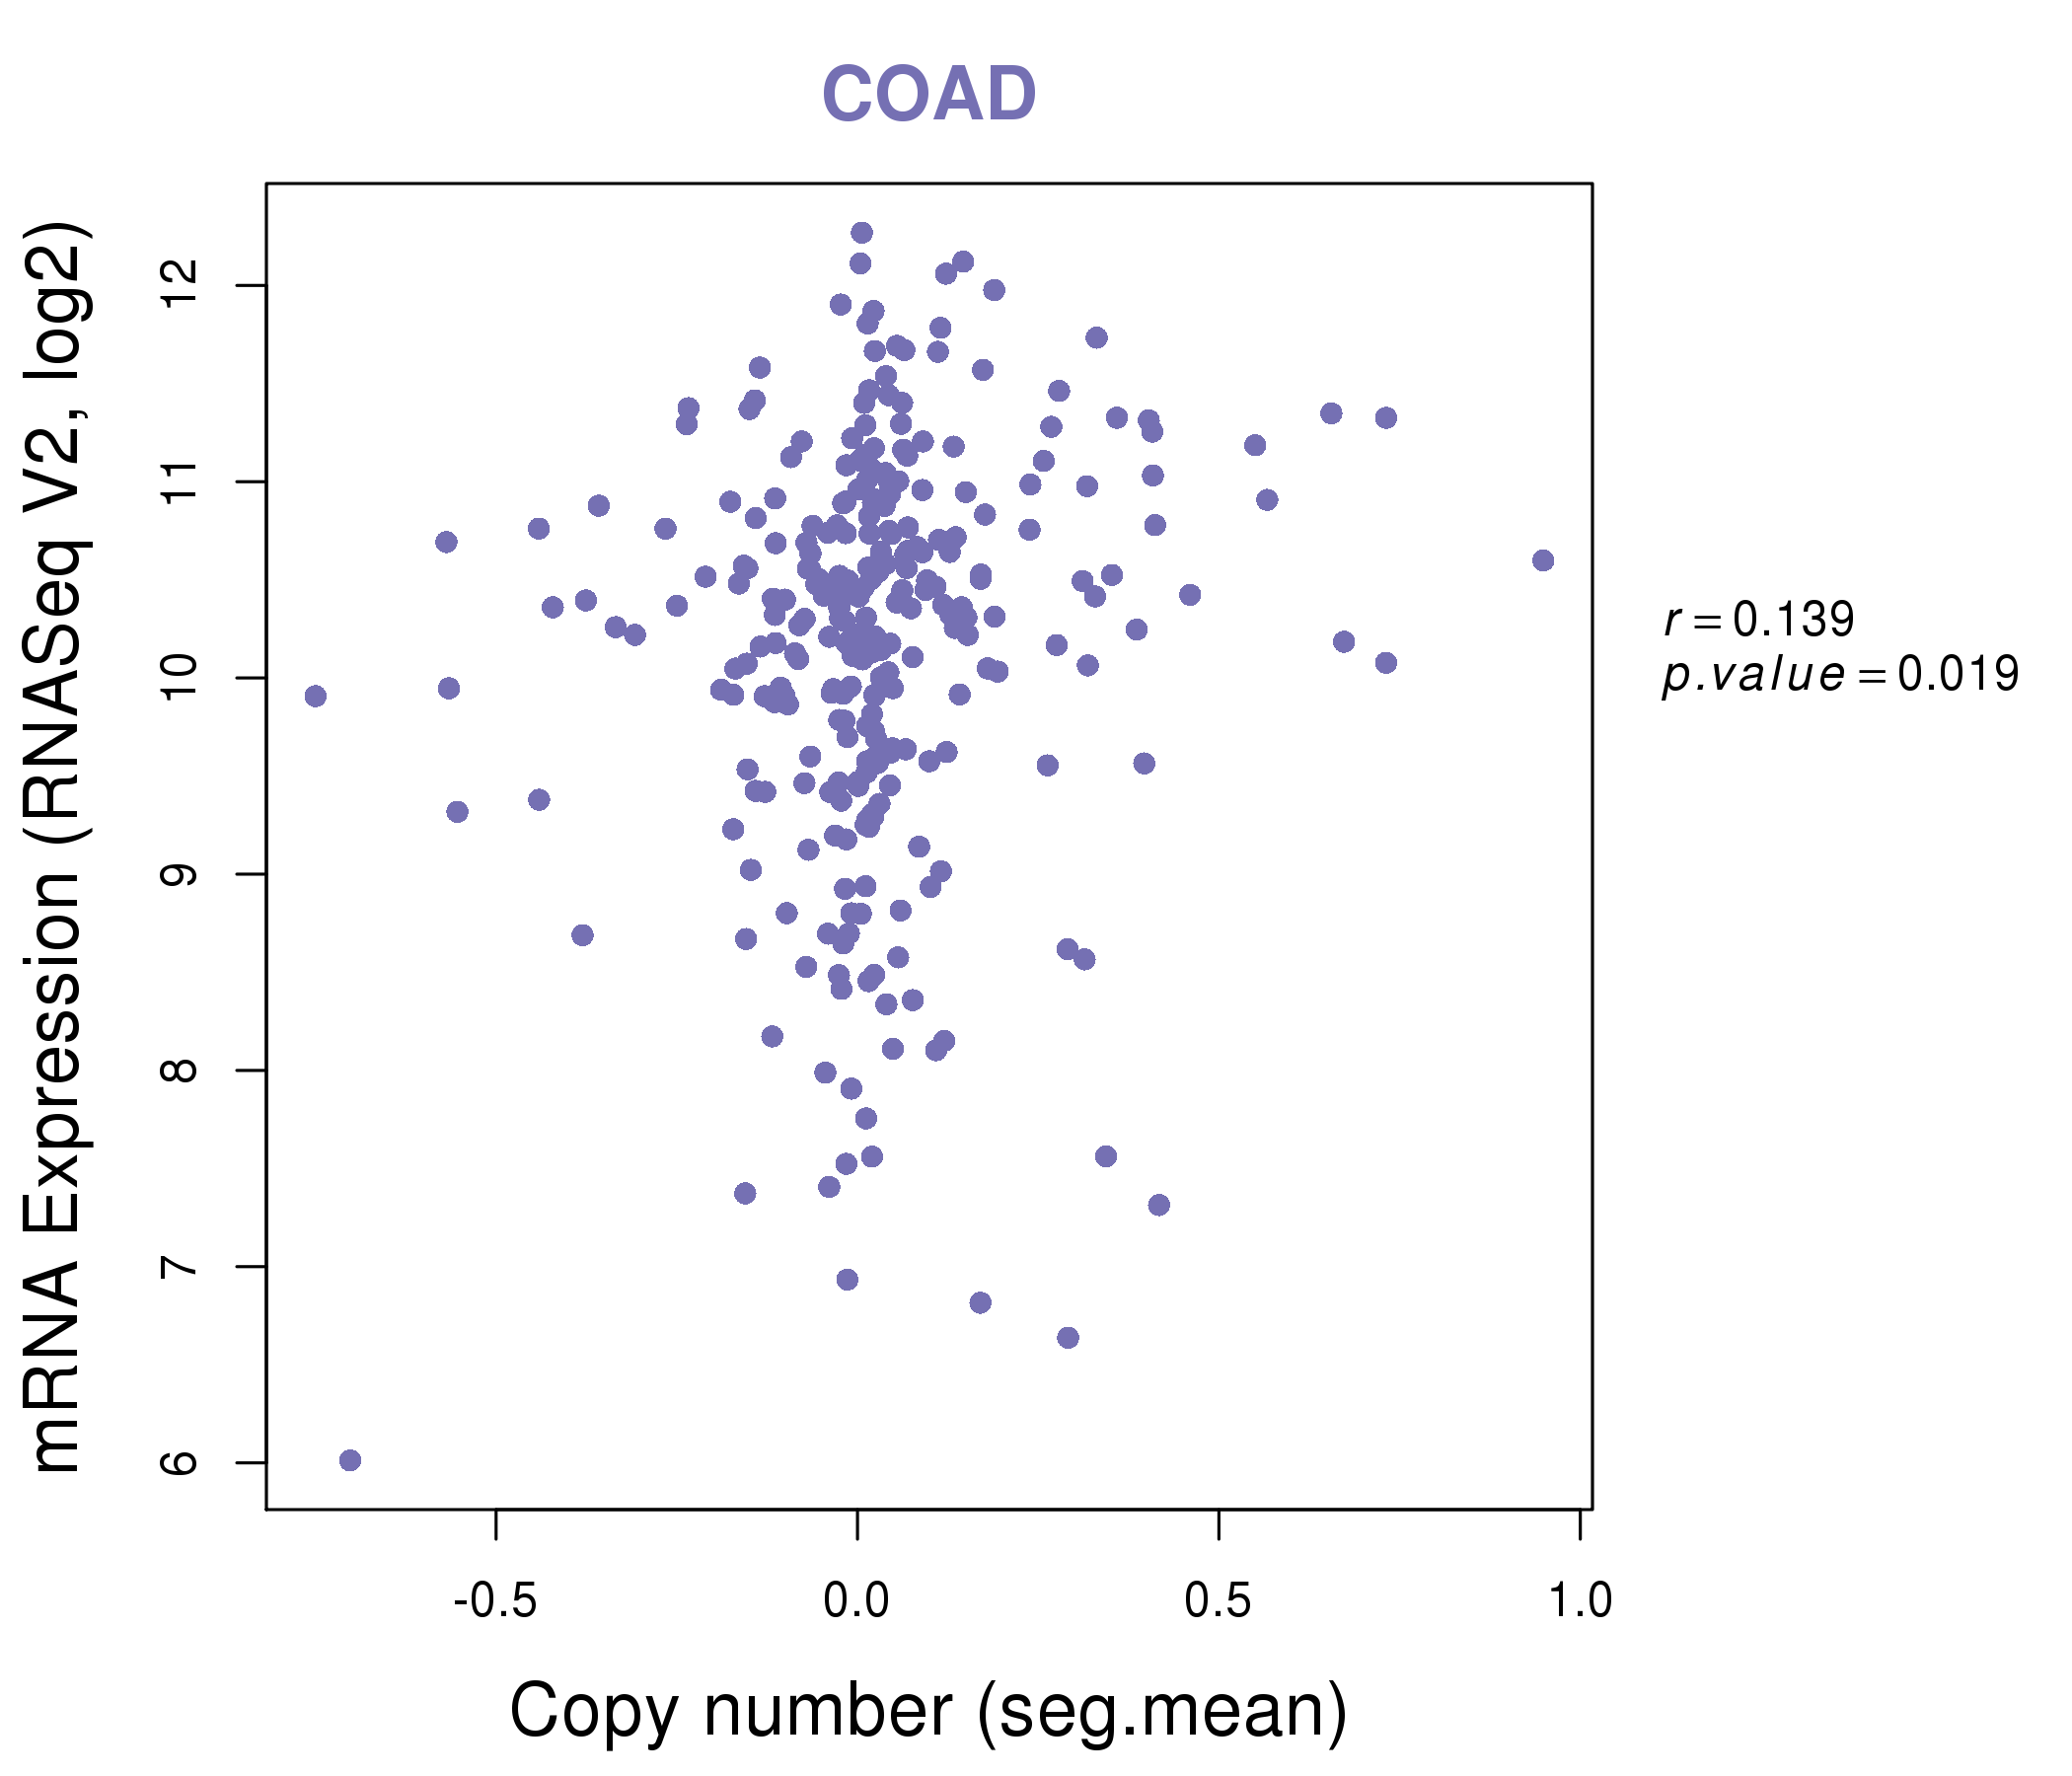
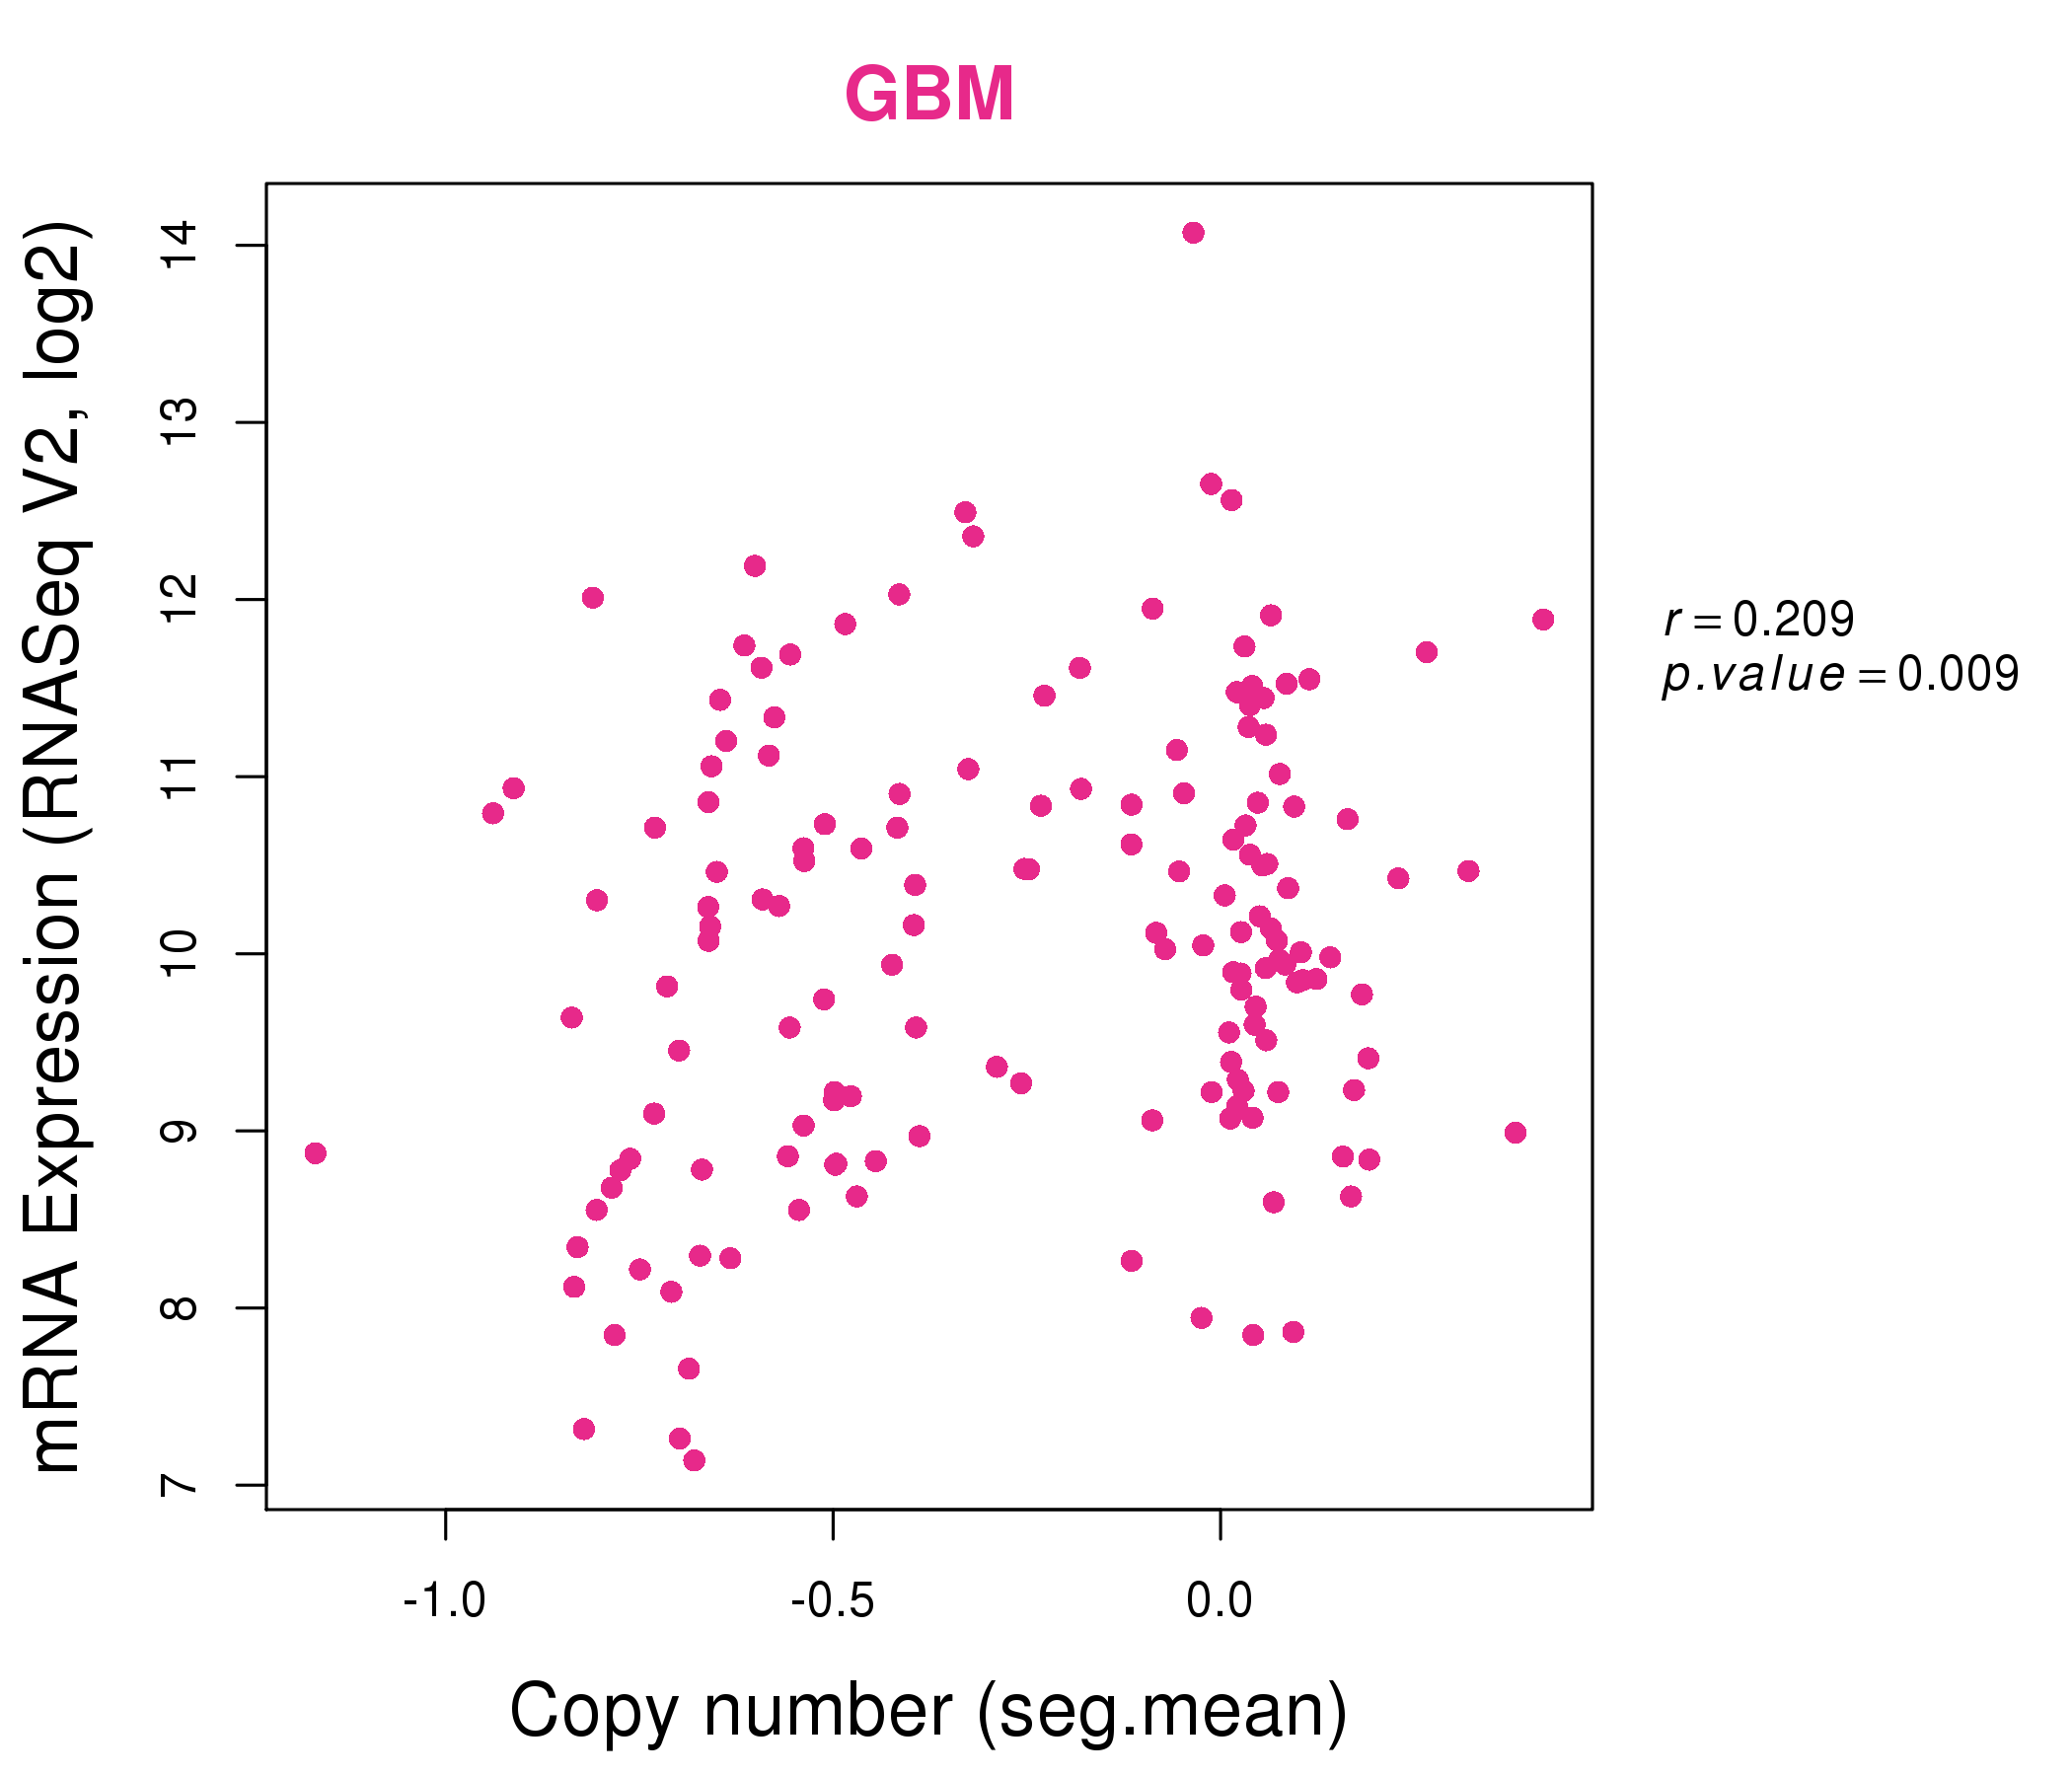
| * This plots show the correlation between CNV and gene expression. |
: Open all plots for all cancer types
 |
|
 |
|
| Top |
| Gene-Gene Network Information |
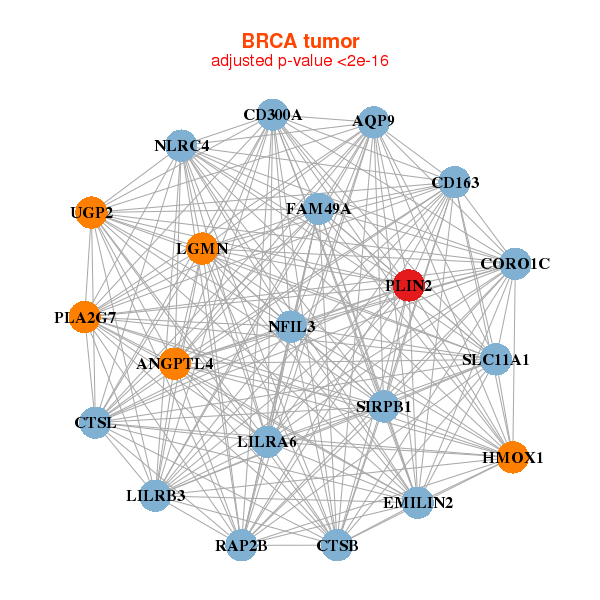
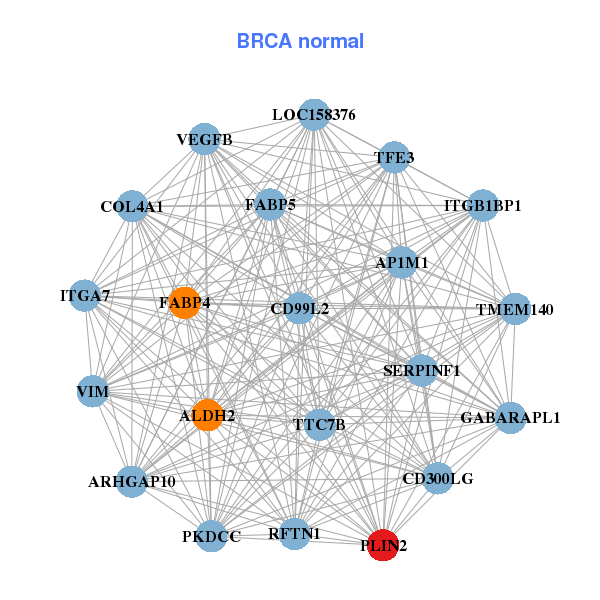
| * Co-Expression network figures were drawn using R package igraph. Only the top 20 genes with the highest correlations were shown. Red circle: input gene, orange circle: cell metabolism gene, sky circle: other gene |
: Open all plots for all cancer types
 |
|
| ANGPTL4,AQP9,CD163,CD300A,CORO1C,CTSB,CTSL, EMILIN2,FAM49A,HMOX1,LGMN,LILRA6,LILRB3,NFIL3, NLRC4,PLA2G7,PLIN2,RAP2B,SIRPB1,SLC11A1,UGP2 | ALDH2,AP1M1,ARHGAP10,CD300LG,CD99L2,COL4A1,FABP4, FABP5,GABARAPL1,ITGA7,ITGB1BP1,LOC158376,PKDCC,PLIN2, RFTN1,SERPINF1,TFE3,TMEM140,TTC7B,VEGFB,VIM |
 |
|
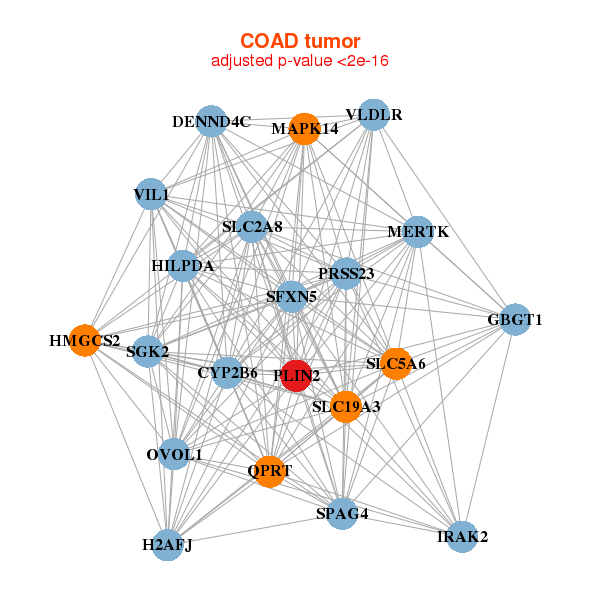
| HILPDA,CYP2B6,DENND4C,GBGT1,H2AFJ,HMGCS2,IRAK2, MAPK14,MERTK,OVOL1,PLIN2,PRSS23,QPRT,SFXN5, SGK2,SLC19A3,SLC2A8,SLC5A6,SPAG4,VIL1,VLDLR | APOBEC1,ADIRF,CHN2,DHRS7,FLVCR1,GBA3,MEP1B, MARC2,MS4A8,NELL2,NR1H4,OTC,PEPD,PGRMC2, PLIN2,PTGR1,SLC17A8,SLC23A1,SPAM1,AGMO,UGT1A5 |
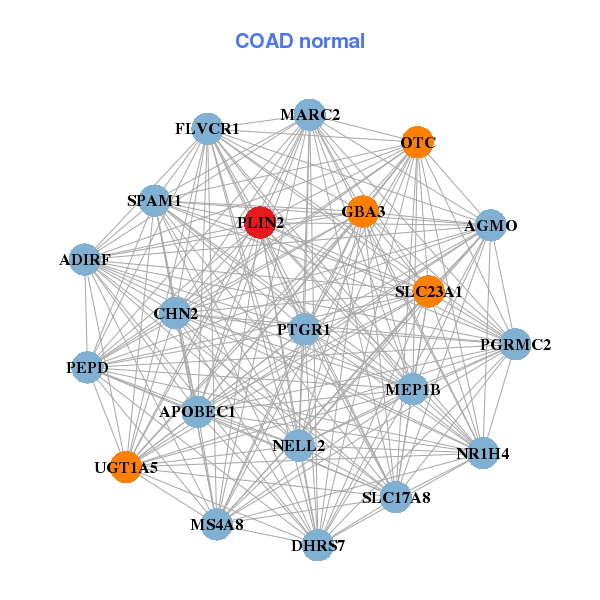
| * Co-Expression network figures were drawn using R package igraph. Only the top 20 genes with the highest correlations were shown. Red circle: input gene, orange circle: cell metabolism gene, sky circle: other gene |
: Open all plots for all cancer types
| Top |
: Open all interacting genes' information including KEGG pathway for all interacting genes from DAVID
| Top |
| Pharmacological Information for PLIN2 |
| There's no related Drug. |
| Top |
| Cross referenced IDs for PLIN2 |
| * We obtained these cross-references from Uniprot database. It covers 150 different DBs, 18 categories. http://www.uniprot.org/help/cross_references_section |
: Open all cross reference information
|
Copyright © 2016-Present - The Univsersity of Texas Health Science Center at Houston @ |