|
||||||||||||||||||||||||||||||||||||||||||||||||||||||||||||||||||||||||||||||||||||||||||||||||||||||||||||||||||||||||||||||||||||||||||||||||||||||||||||||||||||||||||||||||||||||||||||||||||||||||||||||||||||||||||||||||||||||||||||||||||||||||||||||||||||||||||||||||||||||||||||||||||||||||||||||||||||||||||
| |
| Phenotypic Information (metabolism pathway, cancer, disease, phenome) |
| |
| |
| Gene-Gene Network Information: Co-Expression Network, Interacting Genes & KEGG |
| |
|


| Gene Summary for ACSM2A |
| Basic gene info. | Gene symbol | ACSM2A |
| Gene name | acyl-CoA synthetase medium-chain family member 2A | |
| Synonyms | A-923A4.1|ACSM2 | |
| Cytomap | UCSC genome browser: 16p12.3 | |
| Genomic location | chr16 :20462858-20498991 | |
| Type of gene | protein-coding | |
| RefGenes | NM_001010845.2, | |
| Ensembl id | ENSG00000183747 | |
| Description | Homolog of rat kidney-specific (KS)acyl-CoA synthetase medium-chain family member 2acyl-coenzyme A synthetase ACSM2A, mitochondrialbutyrate--CoA ligase 2Abutyryl-coenzyme A synthetase 2Amiddle-chain acyl-CoA synthetase 2A | |
| Modification date | 20141211 | |
| dbXrefs | MIM : 614358 | |
| HGNC : HGNC | ||
| Ensembl : ENSG00000183747 | ||
| HPRD : 17292 | ||
| Vega : OTTHUMG00000177401 | ||
| Protein | UniProt: go to UniProt's Cross Reference DB Table | |
| Expression | CleanEX: HS_ACSM2A | |
| BioGPS: 123876 | ||
| Gene Expression Atlas: ENSG00000183747 | ||
| The Human Protein Atlas: ENSG00000183747 | ||
| Pathway | NCI Pathway Interaction Database: ACSM2A | |
| KEGG: ACSM2A | ||
| REACTOME: ACSM2A | ||
| ConsensusPathDB | ||
| Pathway Commons: ACSM2A | ||
| Metabolism | MetaCyc: ACSM2A | |
| HUMANCyc: ACSM2A | ||
| Regulation | Ensembl's Regulation: ENSG00000183747 | |
| miRBase: chr16 :20,462,858-20,498,991 | ||
| TargetScan: NM_001010845 | ||
| cisRED: ENSG00000183747 | ||
| Context | iHOP: ACSM2A | |
| cancer metabolism search in PubMed: ACSM2A | ||
| UCL Cancer Institute: ACSM2A | ||
| Assigned class in ccmGDB | C | |
| Top |
| Phenotypic Information for ACSM2A(metabolism pathway, cancer, disease, phenome) |
| Cancer | CGAP: ACSM2A |
| Familial Cancer Database: ACSM2A | |
| * This gene is included in those cancer gene databases. |
|
|
|
|
|
| . | ||||||||||||||||||||||||||||||||||||||||||||||||||||||||||||||||||||||||||||||||||||||||||||||||||||||||||||||||||||||||||||||||||||||||||||||||||||||||||||||||||||||||||||||||||||||||||||||||||||||||||||||||||||||||||||||||||||||||||||||||||||||||||||||||||||||||||||||||||||||||||||||||||||||||||||||||||||
Oncogene 1 | Significant driver gene in | |||||||||||||||||||||||||||||||||||||||||||||||||||||||||||||||||||||||||||||||||||||||||||||||||||||||||||||||||||||||||||||||||||||||||||||||||||||||||||||||||||||||||||||||||||||||||||||||||||||||||||||||||||||||||||||||||||||||||||||||||||||||||||||||||||||||||||||||||||||||||||||||||||||||||||||||||||||||||
| cf) number; DB name 1 Oncogene; http://nar.oxfordjournals.org/content/35/suppl_1/D721.long, 2 Tumor Suppressor gene; https://bioinfo.uth.edu/TSGene/, 3 Cancer Gene Census; http://www.nature.com/nrc/journal/v4/n3/abs/nrc1299.html, 4 CancerGenes; http://nar.oxfordjournals.org/content/35/suppl_1/D721.long, 5 Network of Cancer Gene; http://ncg.kcl.ac.uk/index.php, 1Therapeutic Vulnerabilities in Cancer; http://cbio.mskcc.org/cancergenomics/statius/ |
| KEGG_BUTANOATE_METABOLISM | |
| OMIM | |
| Orphanet | |
| Disease | KEGG Disease: ACSM2A |
| MedGen: ACSM2A (Human Medical Genetics with Condition) | |
| ClinVar: ACSM2A | |
| Phenotype | MGI: ACSM2A (International Mouse Phenotyping Consortium) |
| PhenomicDB: ACSM2A | |
| Mutations for ACSM2A |
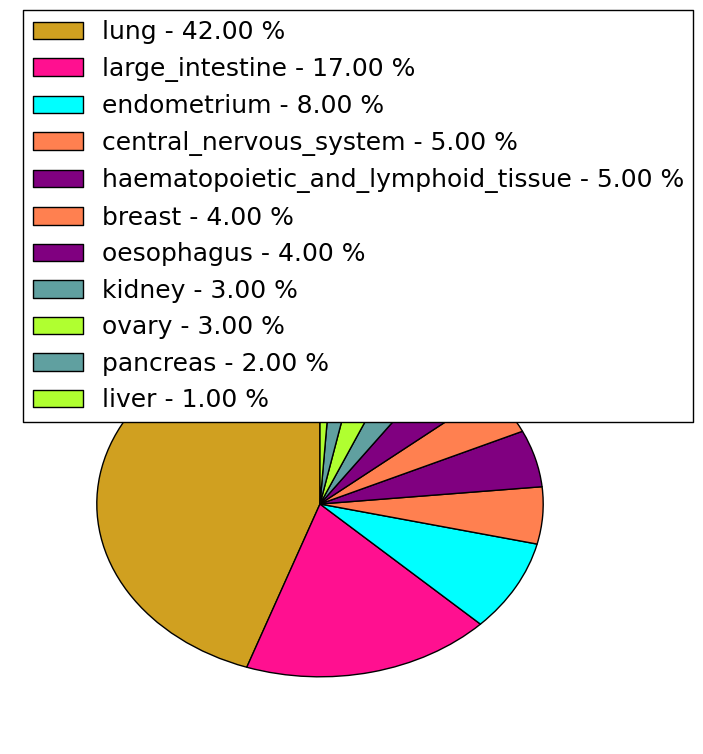
| * Under tables are showing count per each tissue to give us broad intuition about tissue specific mutation patterns.You can go to the detailed page for each mutation database's web site. |
| - Statistics for Tissue and Mutation type | Top |
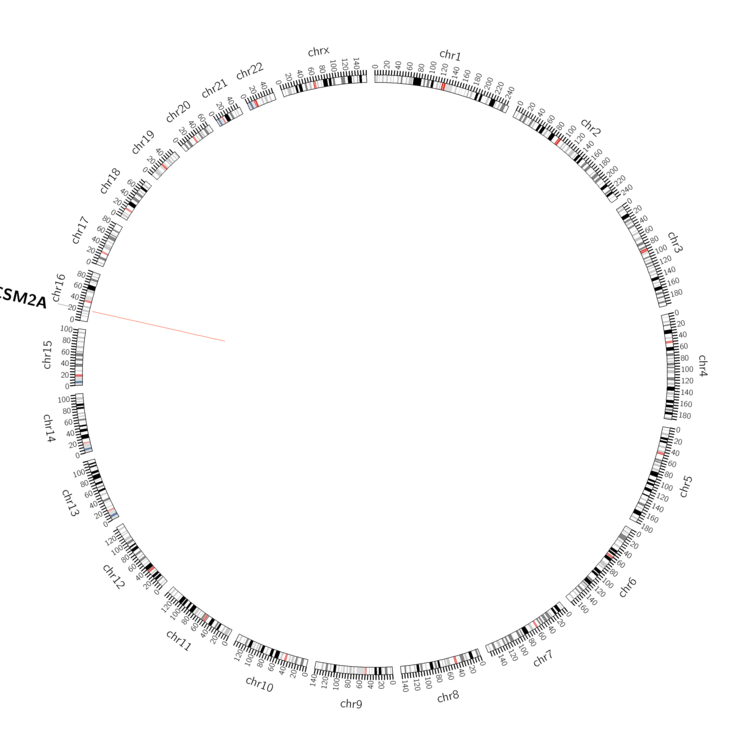 |
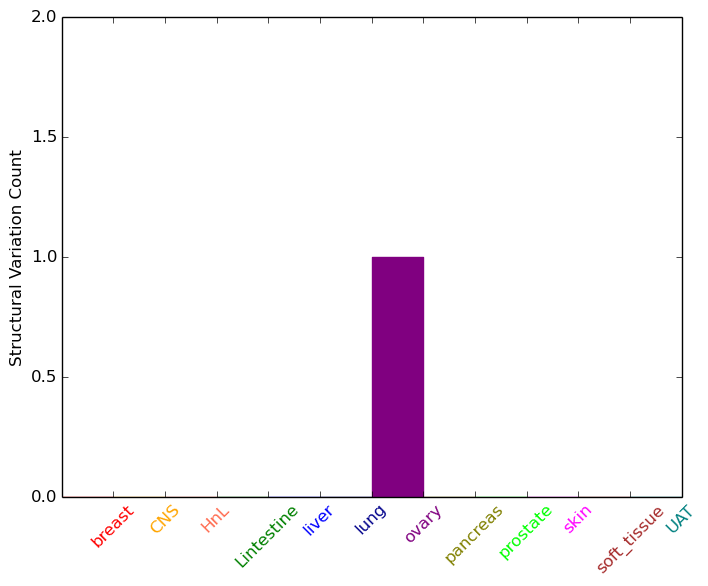
| - For Inter-chromosomal Variations |
| There's no inter-chromosomal structural variation. |
| - For Intra-chromosomal Variations |
| * Intra-chromosomal variantions includes 'intrachromosomal amplicon to amplicon', 'intrachromosomal amplicon to non-amplified dna', 'intrachromosomal deletion', 'intrachromosomal fold-back inversion', 'intrachromosomal inversion', 'intrachromosomal tandem duplication', 'Intrachromosomal unknown type', 'intrachromosomal with inverted orientation', 'intrachromosomal with non-inverted orientation'. |
 |
| Sample | Symbol_a | Chr_a | Start_a | End_a | Symbol_b | Chr_b | Start_b | End_b |
| ovary | ACSM2A | chr16 | 20471093 | 20471113 | ACSM2A | chr16 | 20473286 | 20473306 |
| cf) Tissue number; Tissue name (1;Breast, 2;Central_nervous_system, 3;Haematopoietic_and_lymphoid_tissue, 4;Large_intestine, 5;Liver, 6;Lung, 7;Ovary, 8;Pancreas, 9;Prostate, 10;Skin, 11;Soft_tissue, 12;Upper_aerodigestive_tract) |
| * From mRNA Sanger sequences, Chitars2.0 arranged chimeric transcripts. This table shows ACSM2A related fusion information. |
| ID | Head Gene | Tail Gene | Accession | Gene_a | qStart_a | qEnd_a | Chromosome_a | tStart_a | tEnd_a | Gene_a | qStart_a | qEnd_a | Chromosome_a | tStart_a | tEnd_a |
| Top |
| Mutation type/ Tissue ID | brca | cns | cerv | endome | haematopo | kidn | Lintest | liver | lung | ns | ovary | pancre | prost | skin | stoma | thyro | urina | |||
| Total # sample | 1 | |||||||||||||||||||
| GAIN (# sample) | 1 | |||||||||||||||||||
| LOSS (# sample) |
| cf) Tissue ID; Tissue type (1; Breast, 2; Central_nervous_system, 3; Cervix, 4; Endometrium, 5; Haematopoietic_and_lymphoid_tissue, 6; Kidney, 7; Large_intestine, 8; Liver, 9; Lung, 10; NS, 11; Ovary, 12; Pancreas, 13; Prostate, 14; Skin, 15; Stomach, 16; Thyroid, 17; Urinary_tract) |
| Top |
|
 |
| Top |
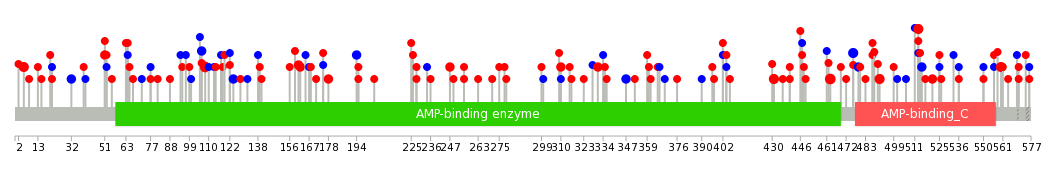
| Stat. for Non-Synonymous SNVs (# total SNVs=89) | (# total SNVs=31) |
 | 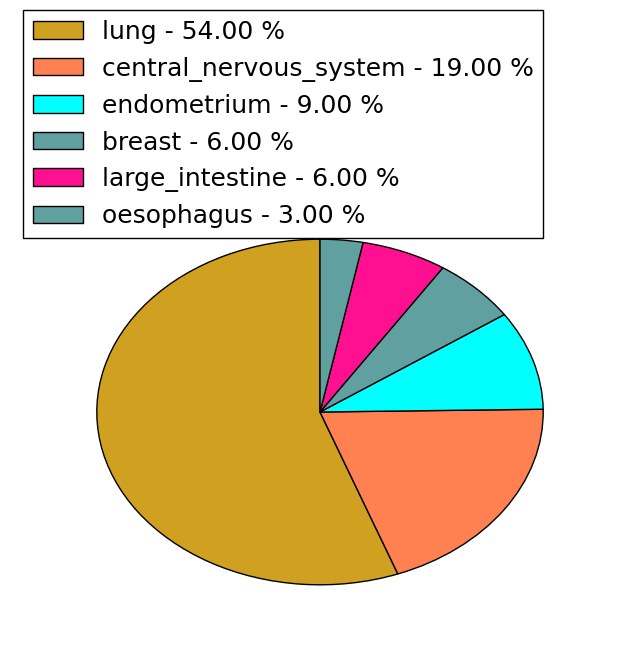 |
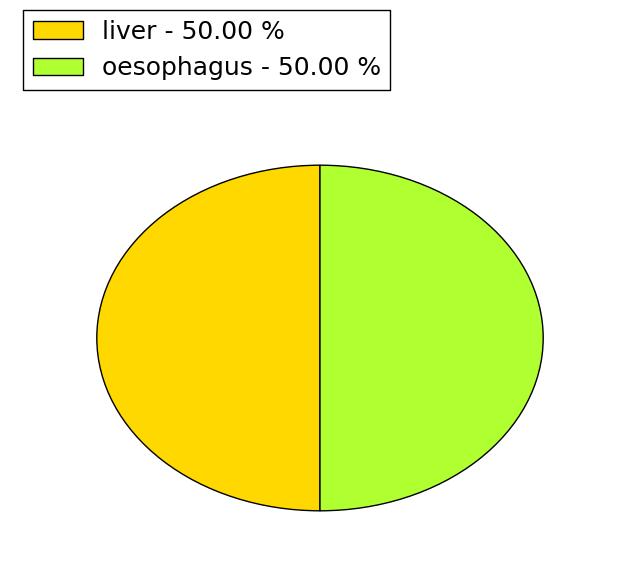
(# total SNVs=0) | (# total SNVs=2) |
 |
| Top |
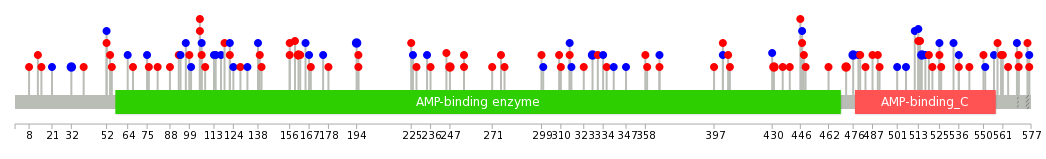
| * When you move the cursor on each content, you can see more deailed mutation information on the Tooltip. Those are primary_site,primary_histology,mutation(aa),pubmedID. |
| GRCh37 position | Mutation(aa) | Unique sampleID count |
| chr16:20476983-20476983 | p.R108C | 4 |
| chr16:20492000-20492000 | p.N463D | 4 |
| chr16:20497945-20497945 | p.R560Q | 3 |
| chr16:20471449-20471449 | p.R5* | 3 |
| chr16:20492162-20492162 | p.S476S | 3 |
| chr16:20471450-20471450 | p.R5Q | 3 |
| chr16:20494408-20494408 | p.S513L | 3 |
| chr16:20491904-20491904 | p.D431N | 3 |
| chr16:20492206-20492206 | p.T491M | 3 |
| chr16:20494431-20494431 | p.E521K | 2 |
| Top |
|
 |
| Point Mutation/ Tissue ID | 1 | 2 | 3 | 4 | 5 | 6 | 7 | 8 | 9 | 10 | 11 | 12 | 13 | 14 | 15 | 16 | 17 | 18 | 19 | 20 |
| # sample | 1 | 6 | 4 | 9 | 1 | 1 | 1 | 1 | 21 | 16 | 2 | 31 | 10 | 1 | 9 | |||||
| # mutation | 1 | 5 | 4 | 10 | 1 | 1 | 1 | 1 | 24 | 19 | 2 | 45 | 10 | 1 | 11 | |||||
| nonsynonymous SNV | 3 | 2 | 6 | 1 | 1 | 1 | 1 | 17 | 10 | 2 | 27 | 7 | 1 | 8 | ||||||
| synonymous SNV | 1 | 2 | 2 | 4 | 7 | 9 | 19 | 3 | 3 |
| cf) Tissue ID; Tissue type (1; BLCA[Bladder Urothelial Carcinoma], 2; BRCA[Breast invasive carcinoma], 3; CESC[Cervical squamous cell carcinoma and endocervical adenocarcinoma], 4; COAD[Colon adenocarcinoma], 5; GBM[Glioblastoma multiforme], 6; Glioma Low Grade, 7; HNSC[Head and Neck squamous cell carcinoma], 8; KICH[Kidney Chromophobe], 9; KIRC[Kidney renal clear cell carcinoma], 10; KIRP[Kidney renal papillary cell carcinoma], 11; LAML[Acute Myeloid Leukemia], 12; LUAD[Lung adenocarcinoma], 13; LUSC[Lung squamous cell carcinoma], 14; OV[Ovarian serous cystadenocarcinoma ], 15; PAAD[Pancreatic adenocarcinoma], 16; PRAD[Prostate adenocarcinoma], 17; SKCM[Skin Cutaneous Melanoma], 18:STAD[Stomach adenocarcinoma], 19:THCA[Thyroid carcinoma], 20:UCEC[Uterine Corpus Endometrial Carcinoma]) |
| Top |
| * We represented just top 10 SNVs. When you move the cursor on each content, you can see more deailed mutation information on the Tooltip. Those are primary_site, primary_histology, mutation(aa), pubmedID. |
| Genomic Position | Mutation(aa) | Unique sampleID count |
| chr16:20491904 | p.K525K | 2 |
| chr16:20494415 | p.F194F | 2 |
| chr16:20482538 | p.K195T | 2 |
| chr16:20482880 | p.F328F | 2 |
| chr16:20486981 | p.D431N | 2 |
| chr16:20471532 | p.S32S | 2 |
| chr16:20481027 | p.A156D | 2 |
| chr16:20494445 | p.G247D | 2 |
| chr16:20481029 | p.D161N | 2 |
| chr16:20480912 | p.D255H | 2 |
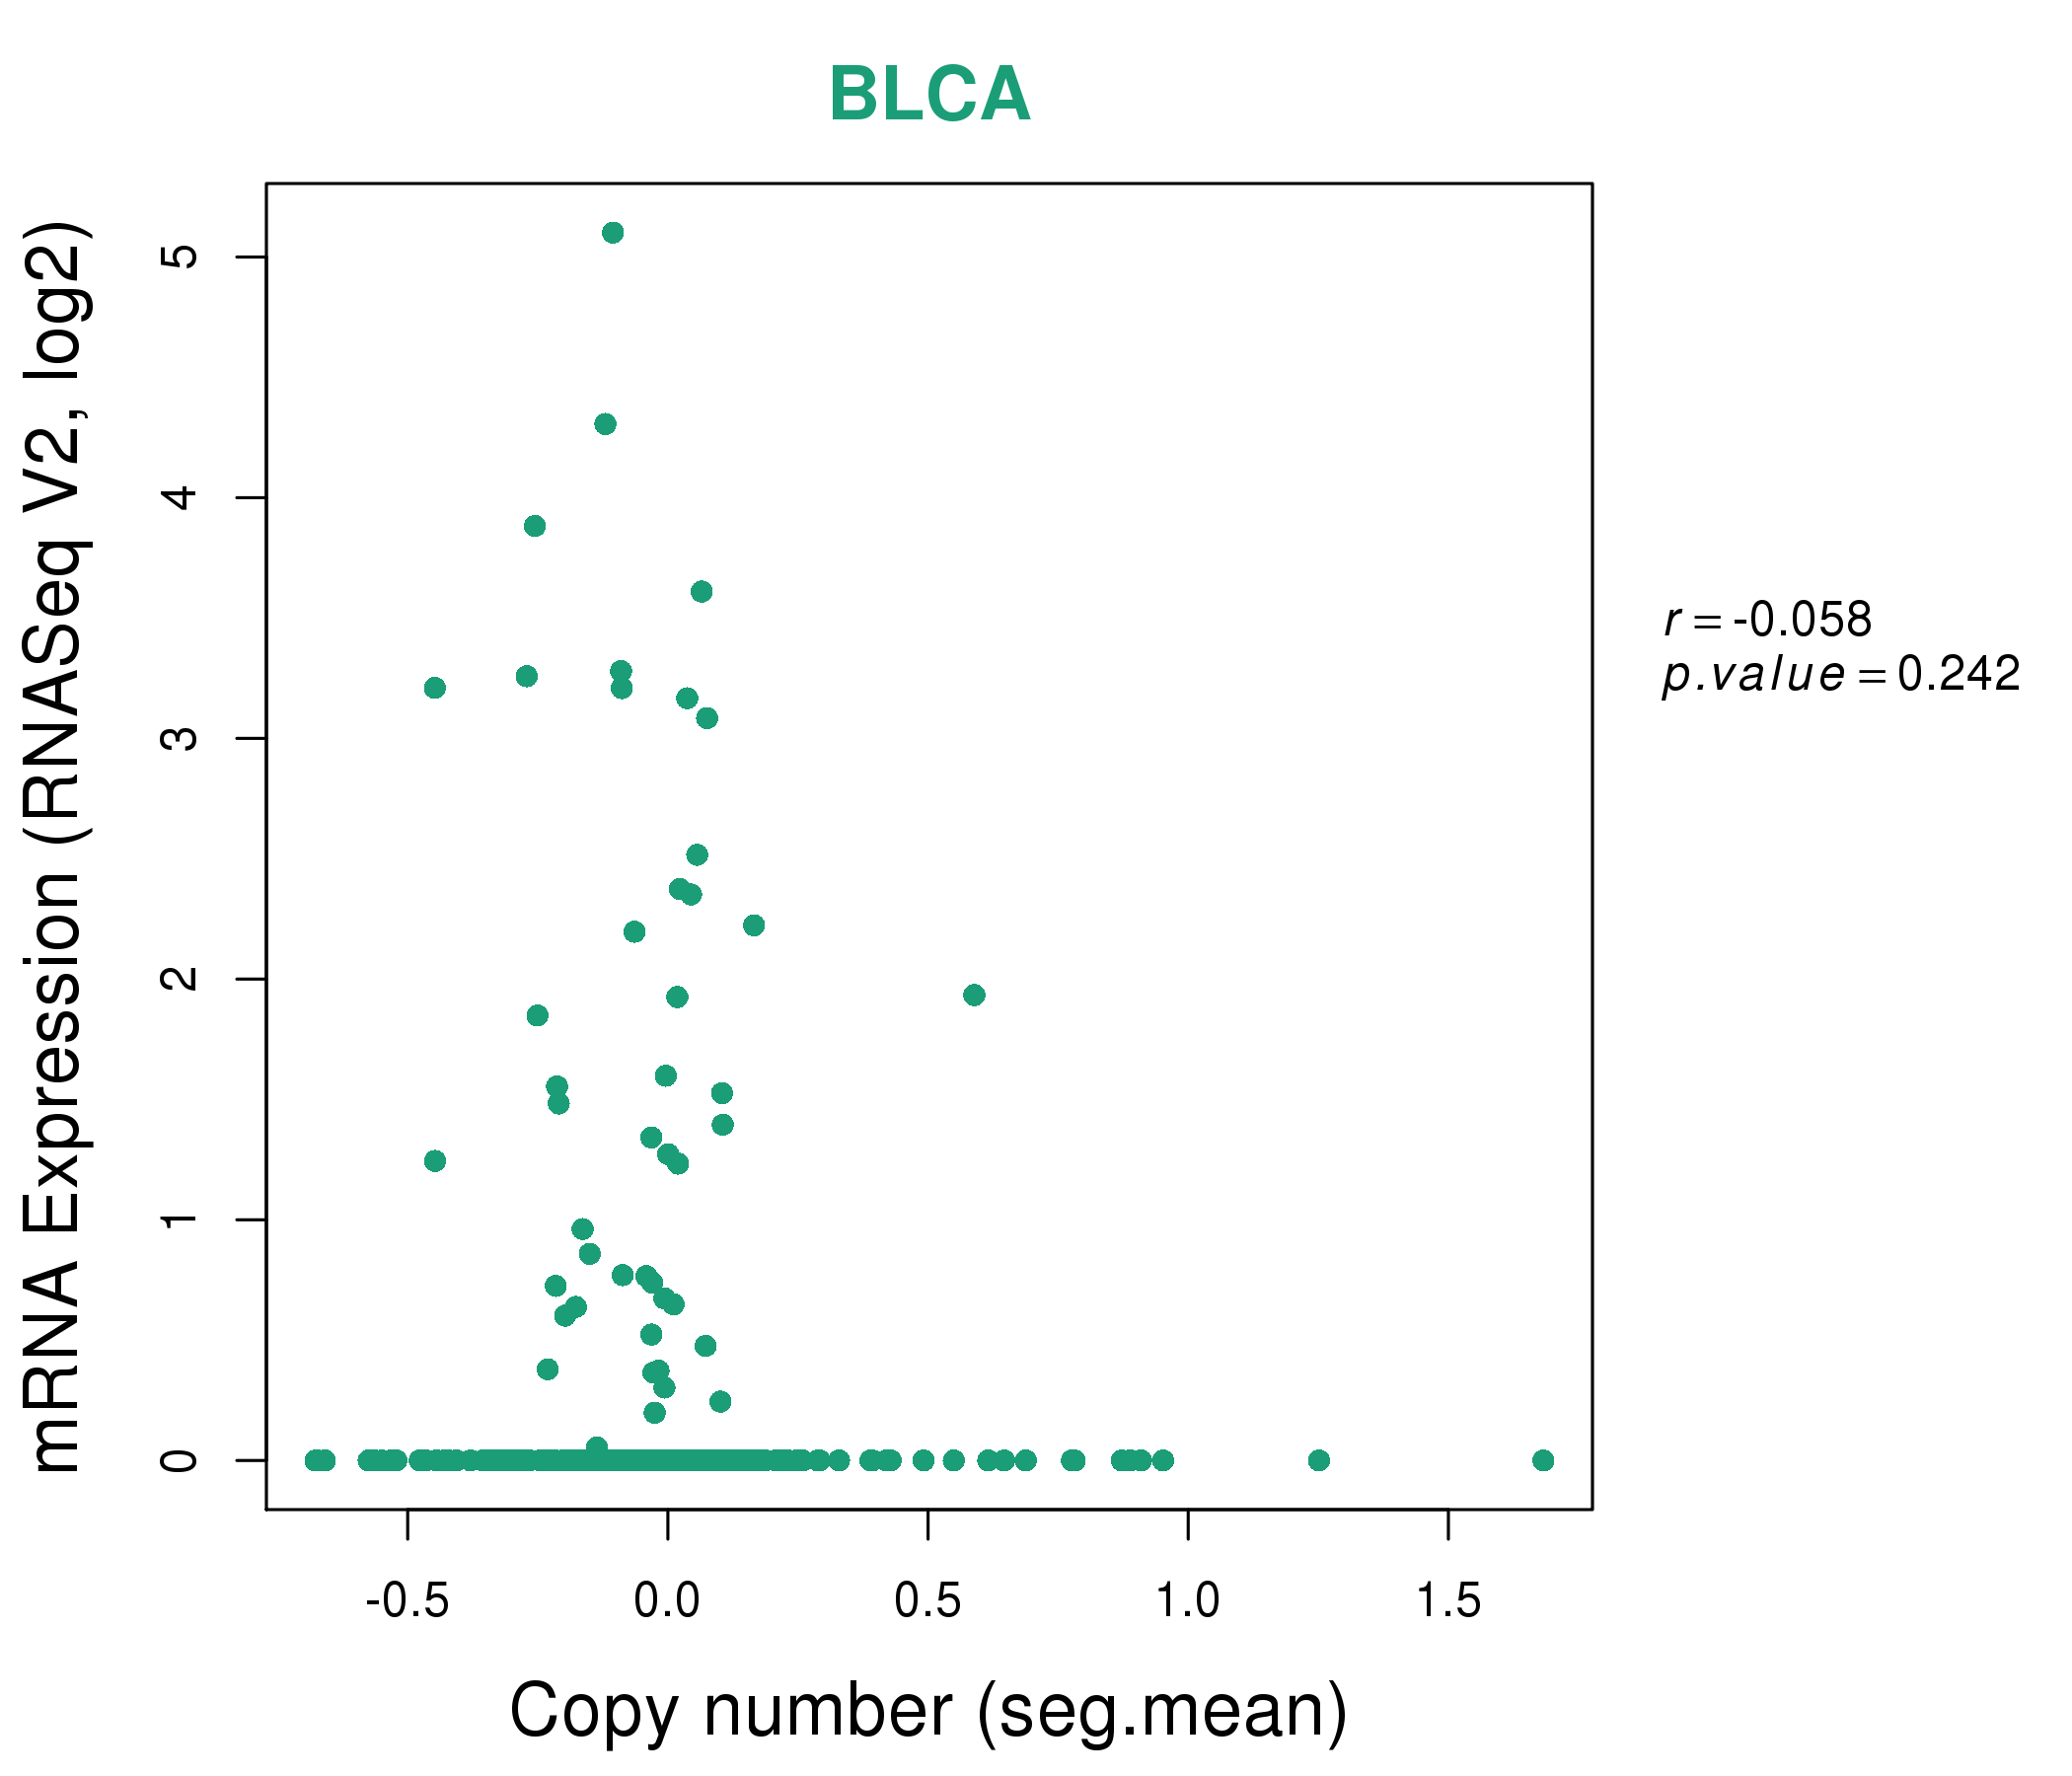
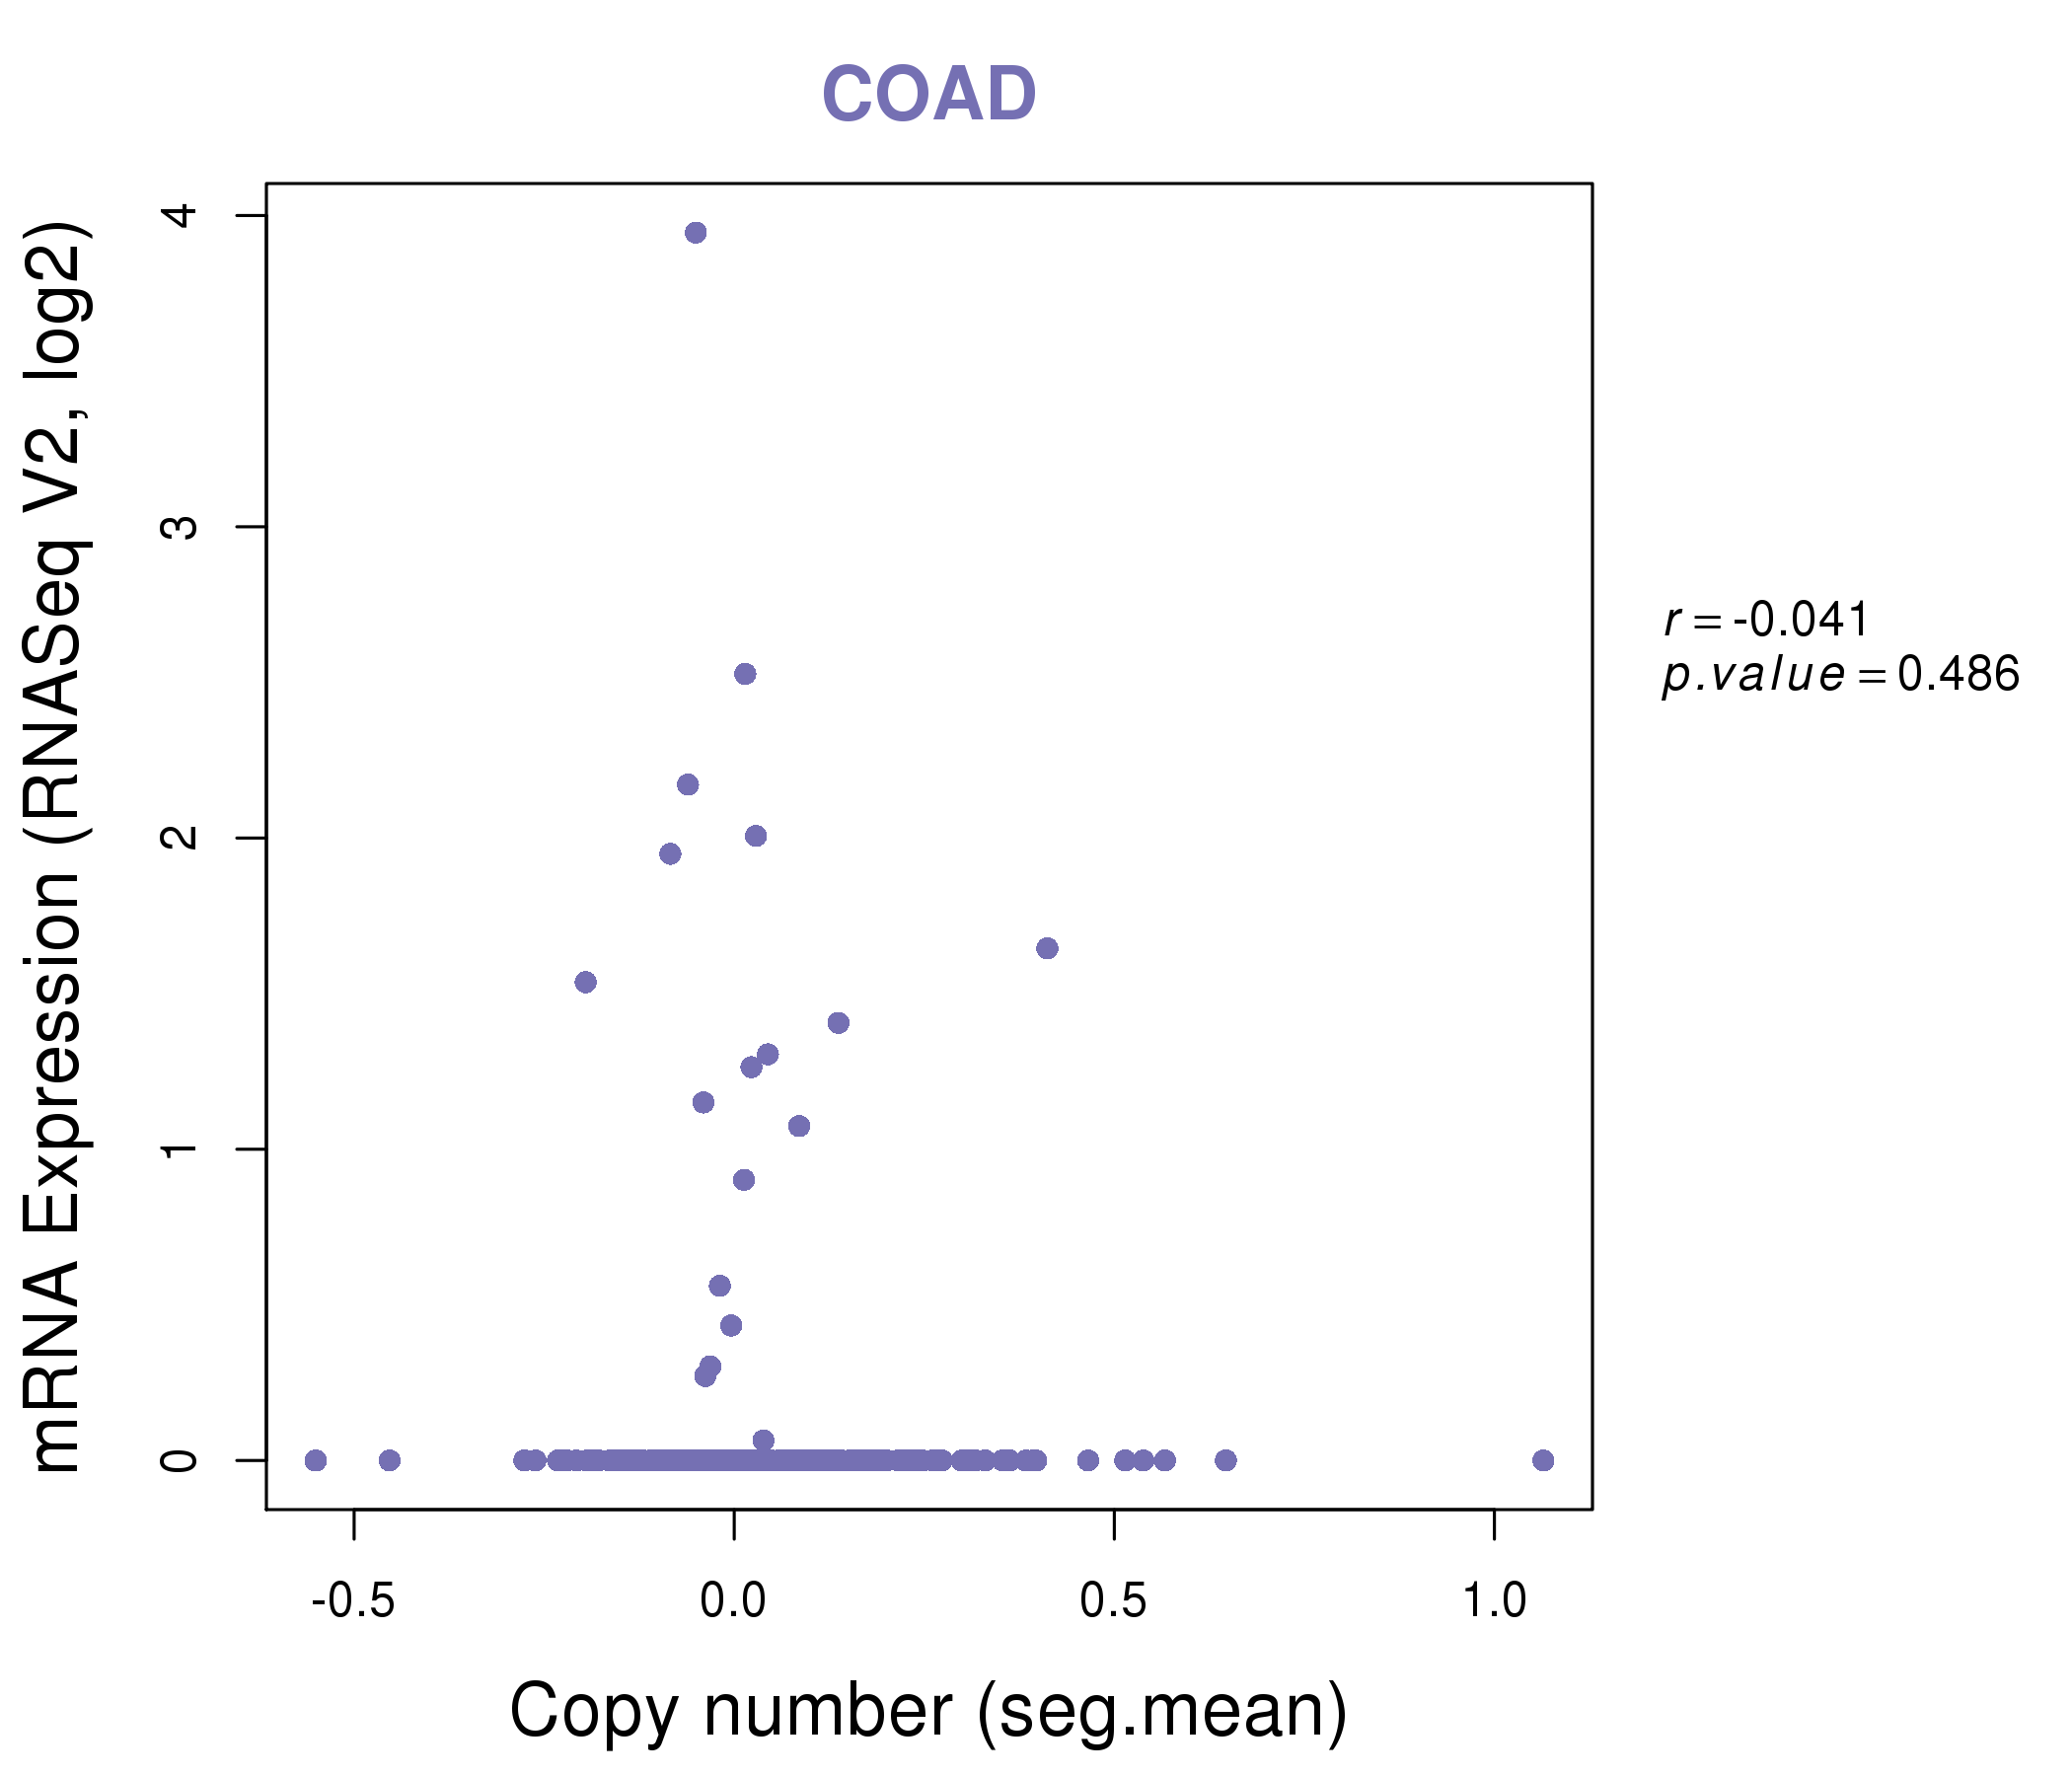
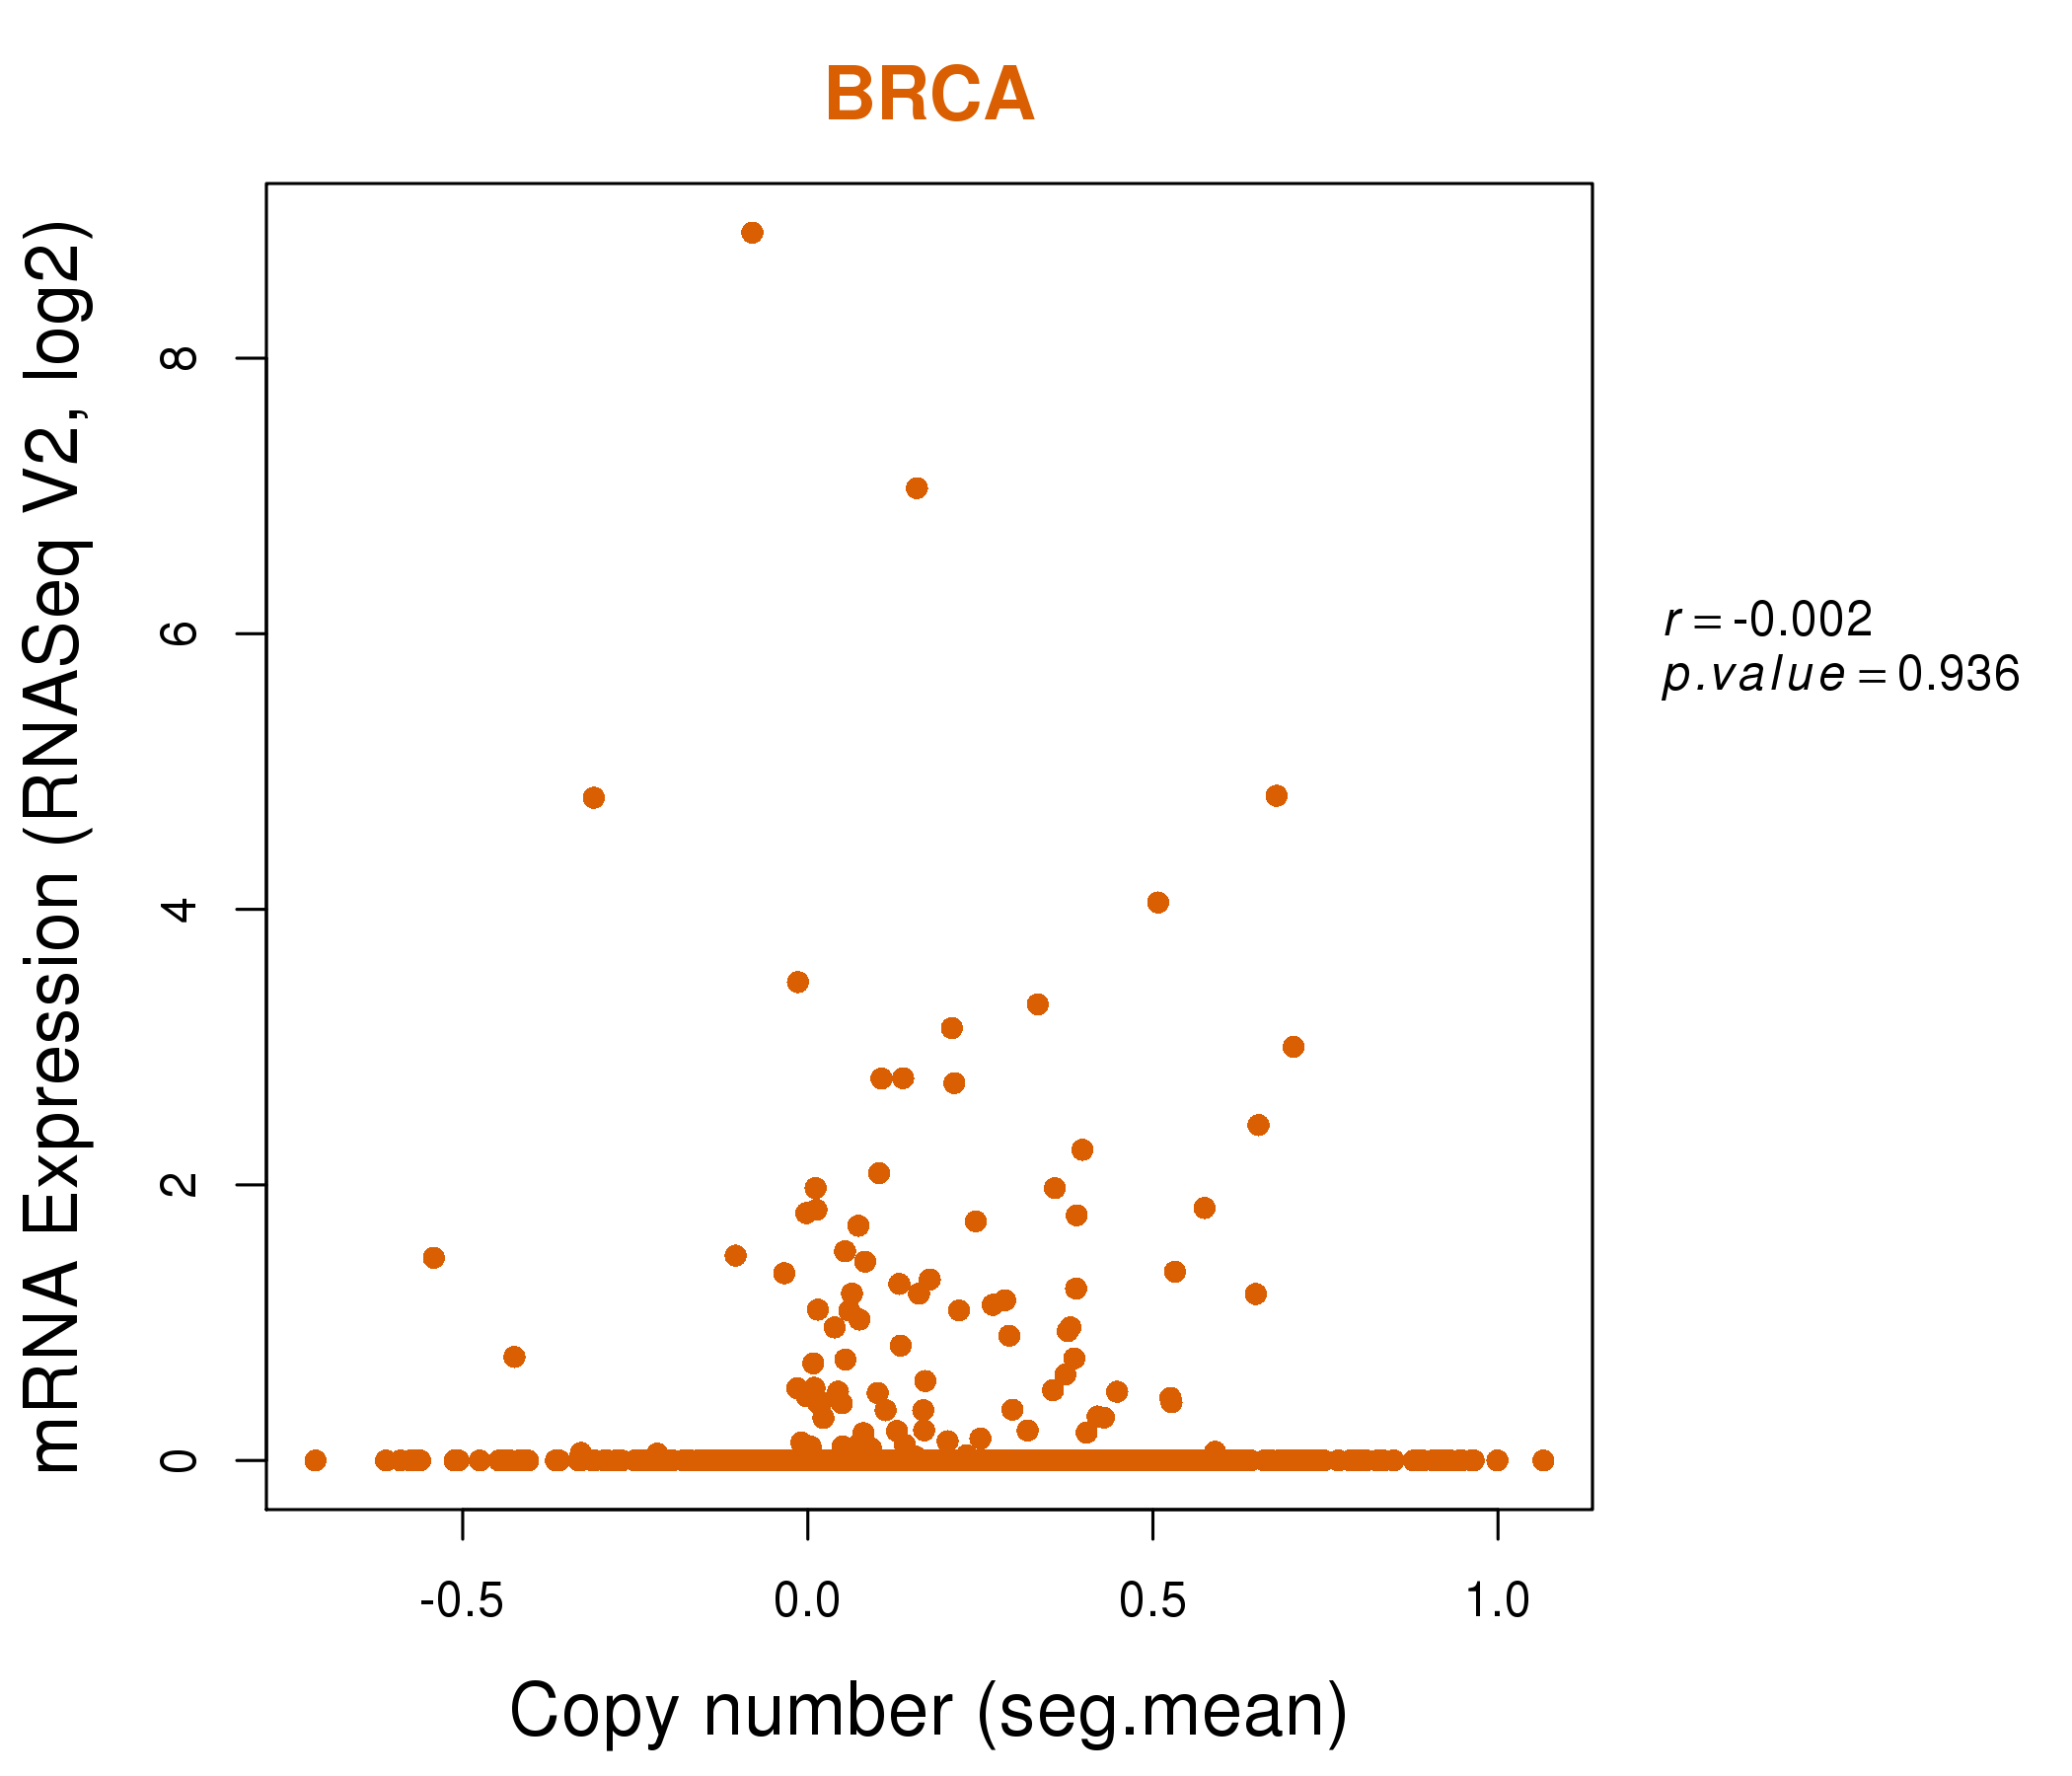
| * Copy number data were extracted from TCGA using R package TCGA-Assembler. The URLs of all public data files on TCGA DCC data server were gathered on Jan-05-2015. Function ProcessCNAData in TCGA-Assembler package was used to obtain gene-level copy number value which is calculated as the average copy number of the genomic region of a gene. |
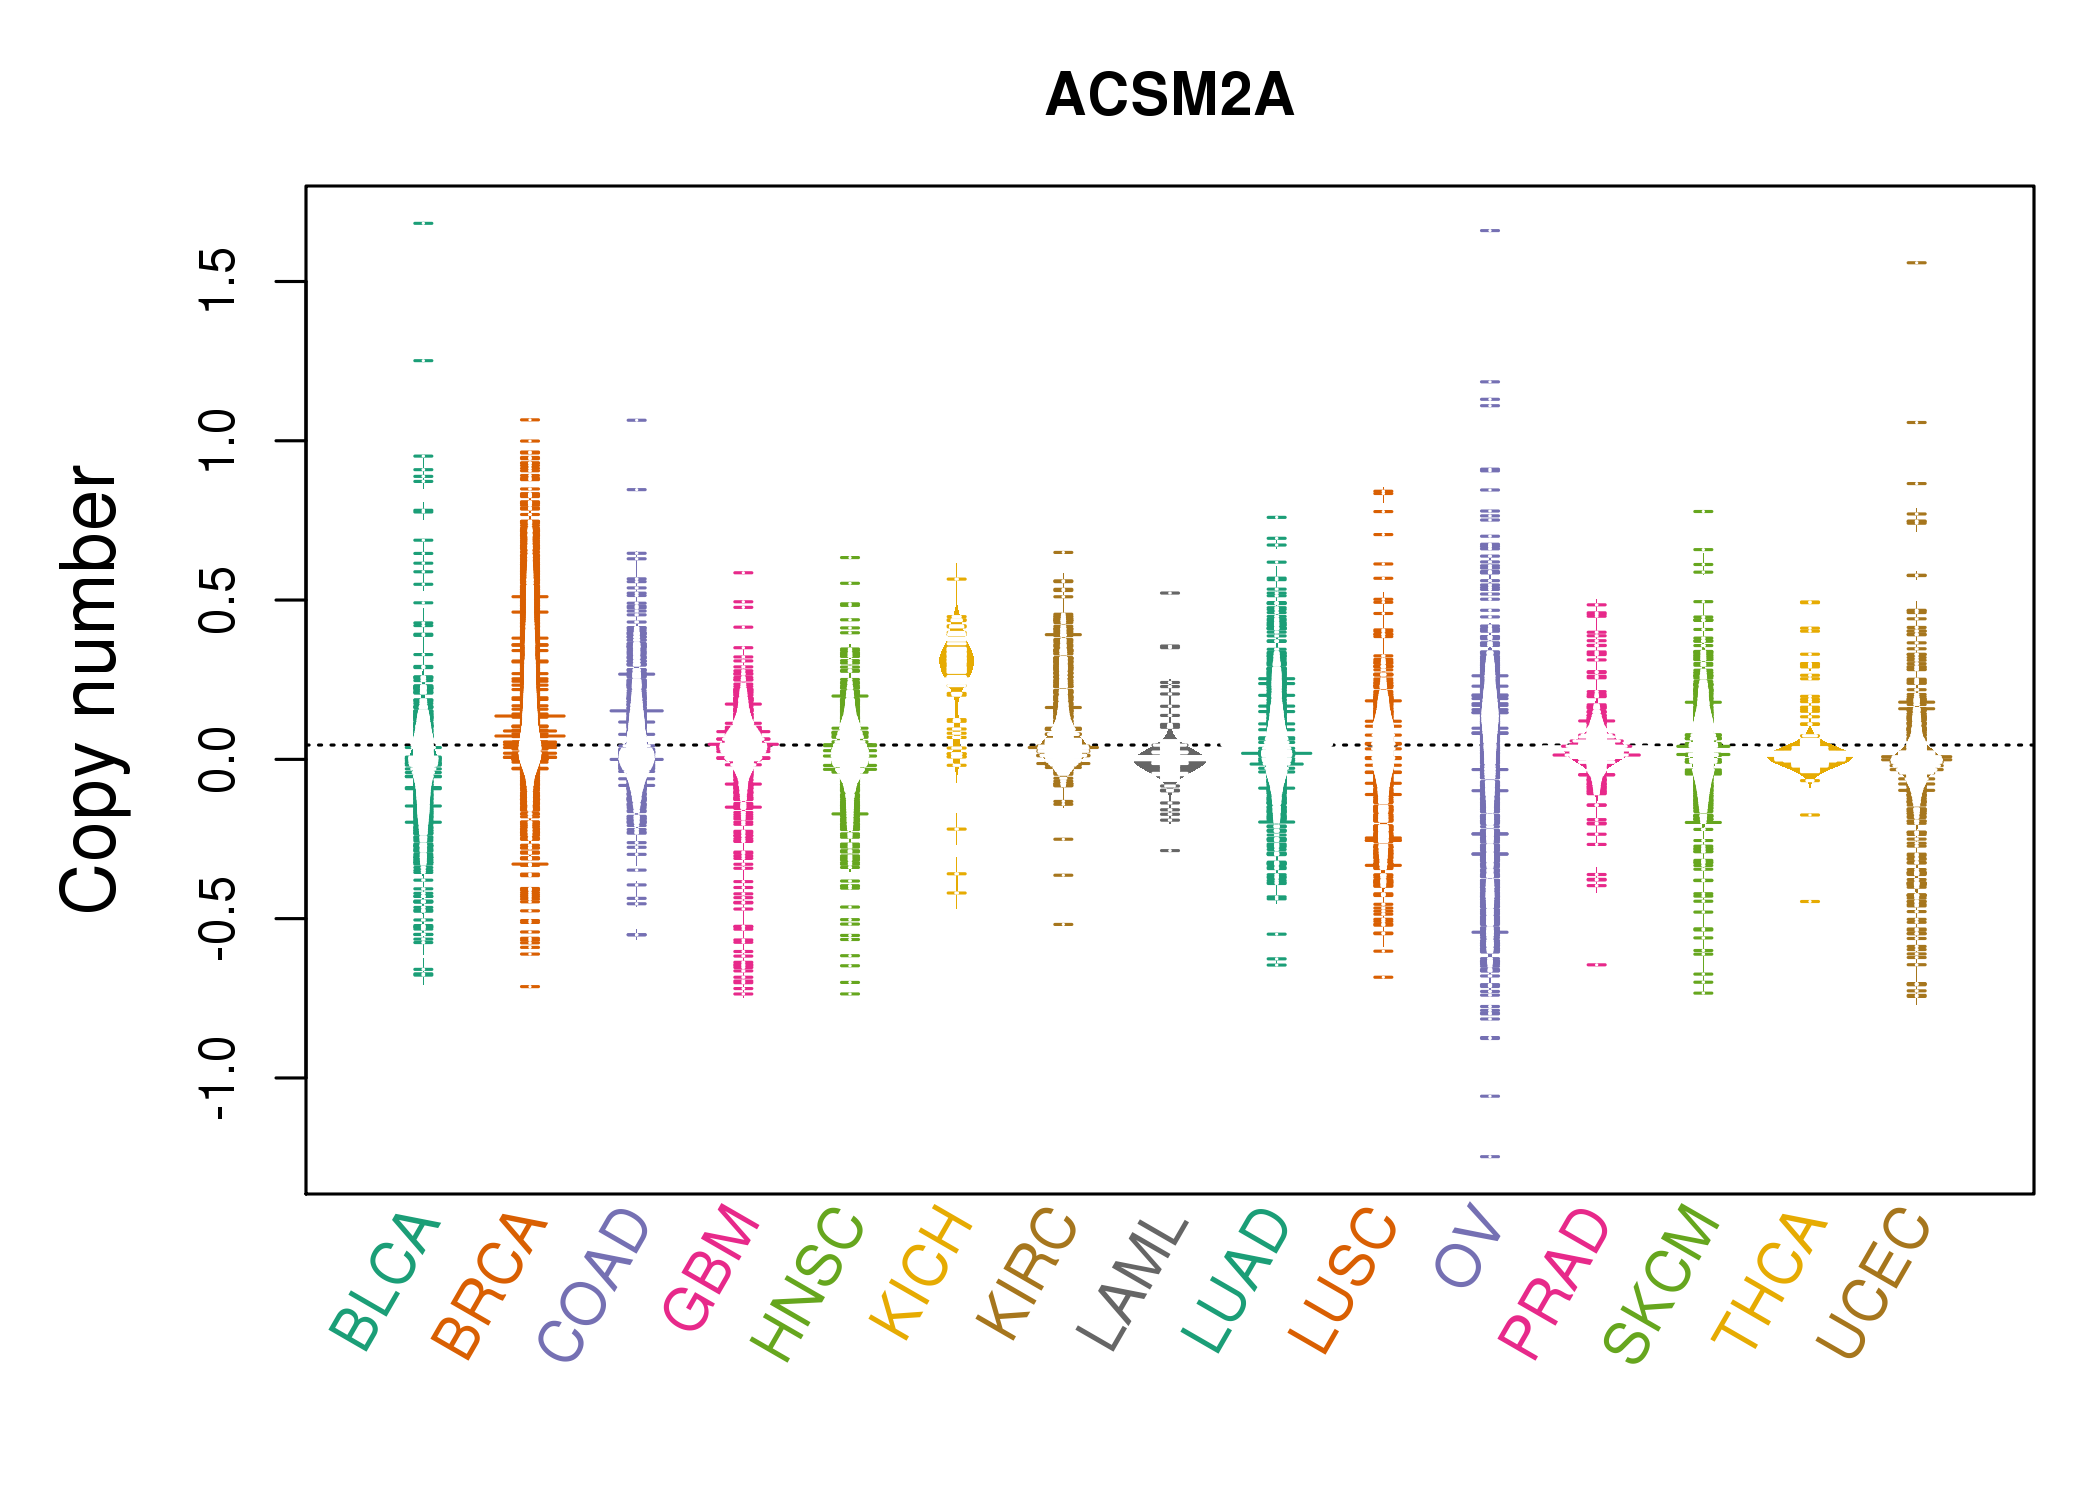 |
| cf) Tissue ID[Tissue type]: BLCA[Bladder Urothelial Carcinoma], BRCA[Breast invasive carcinoma], CESC[Cervical squamous cell carcinoma and endocervical adenocarcinoma], COAD[Colon adenocarcinoma], GBM[Glioblastoma multiforme], Glioma Low Grade, HNSC[Head and Neck squamous cell carcinoma], KICH[Kidney Chromophobe], KIRC[Kidney renal clear cell carcinoma], KIRP[Kidney renal papillary cell carcinoma], LAML[Acute Myeloid Leukemia], LUAD[Lung adenocarcinoma], LUSC[Lung squamous cell carcinoma], OV[Ovarian serous cystadenocarcinoma ], PAAD[Pancreatic adenocarcinoma], PRAD[Prostate adenocarcinoma], SKCM[Skin Cutaneous Melanoma], STAD[Stomach adenocarcinoma], THCA[Thyroid carcinoma], UCEC[Uterine Corpus Endometrial Carcinoma] |
| Top |
| Gene Expression for ACSM2A |
| * CCLE gene expression data were extracted from CCLE_Expression_Entrez_2012-10-18.res: Gene-centric RMA-normalized mRNA expression data. |
 |
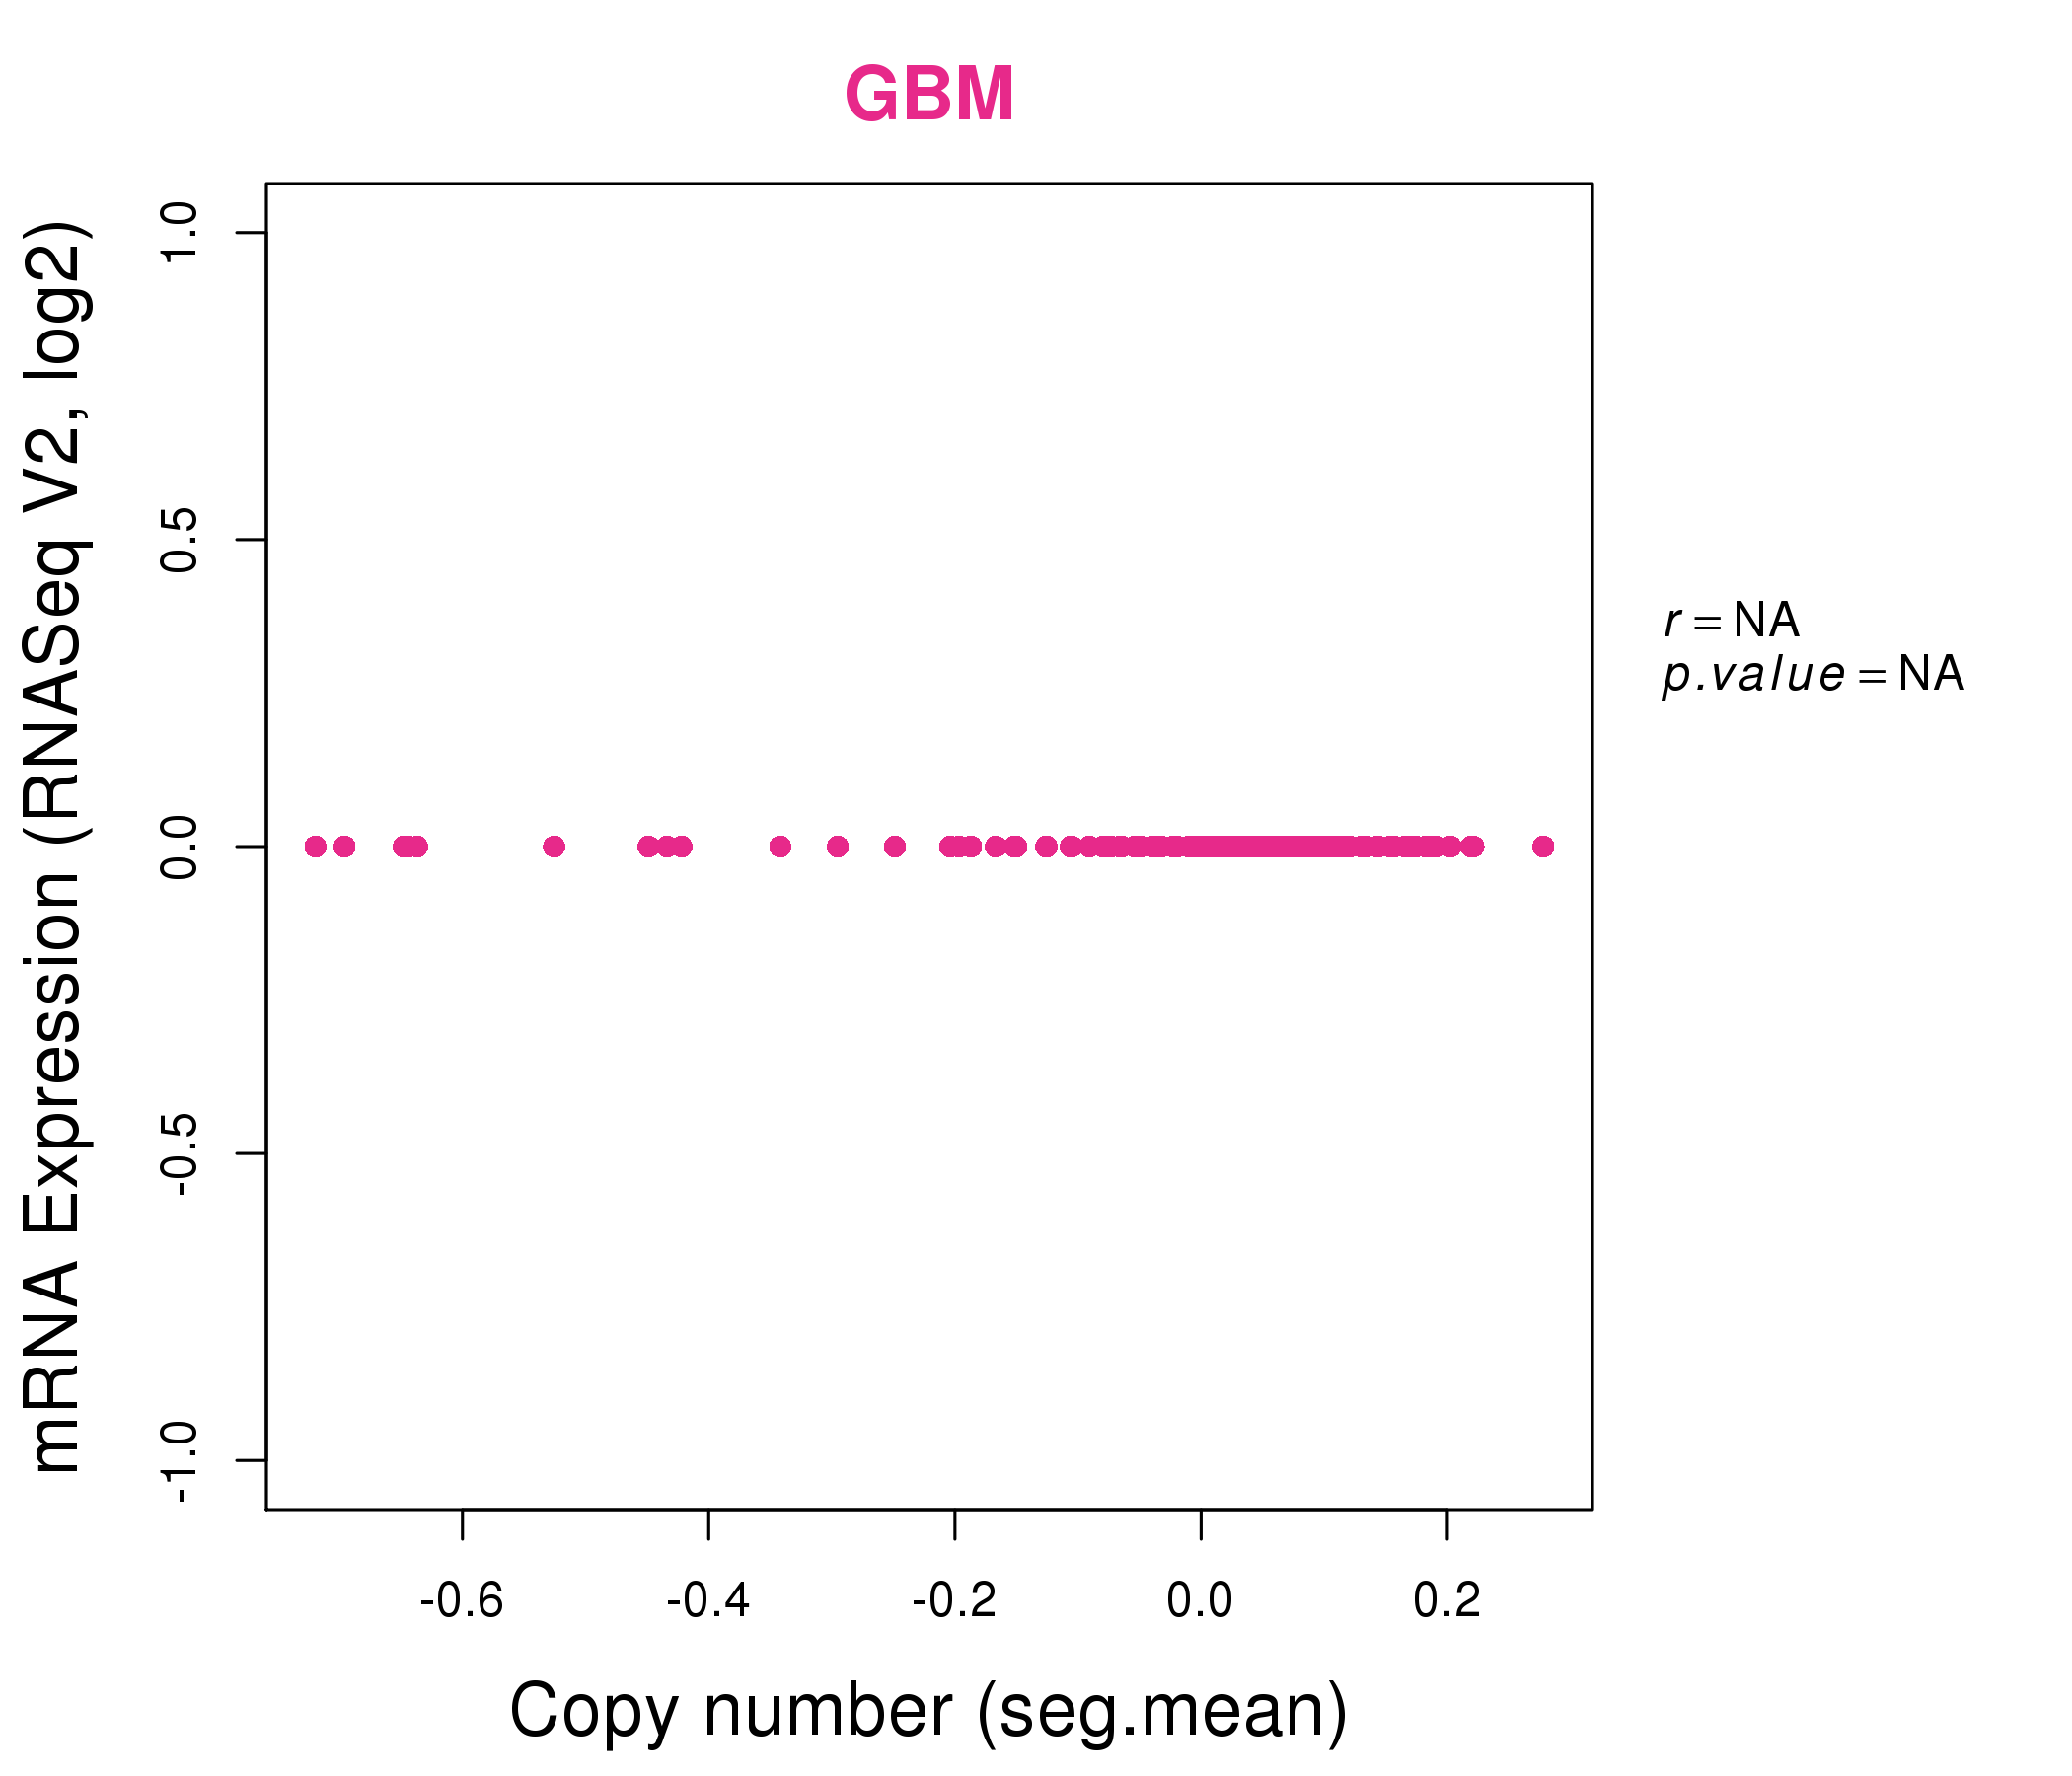
| * Normalized gene expression data of RNASeqV2 was extracted from TCGA using R package TCGA-Assembler. The URLs of all public data files on TCGA DCC data server were gathered at Jan-05-2015. Only eight cancer types have enough normal control samples for differential expression analysis. (t test, adjusted p<0.05 (using Benjamini-Hochberg FDR)) |
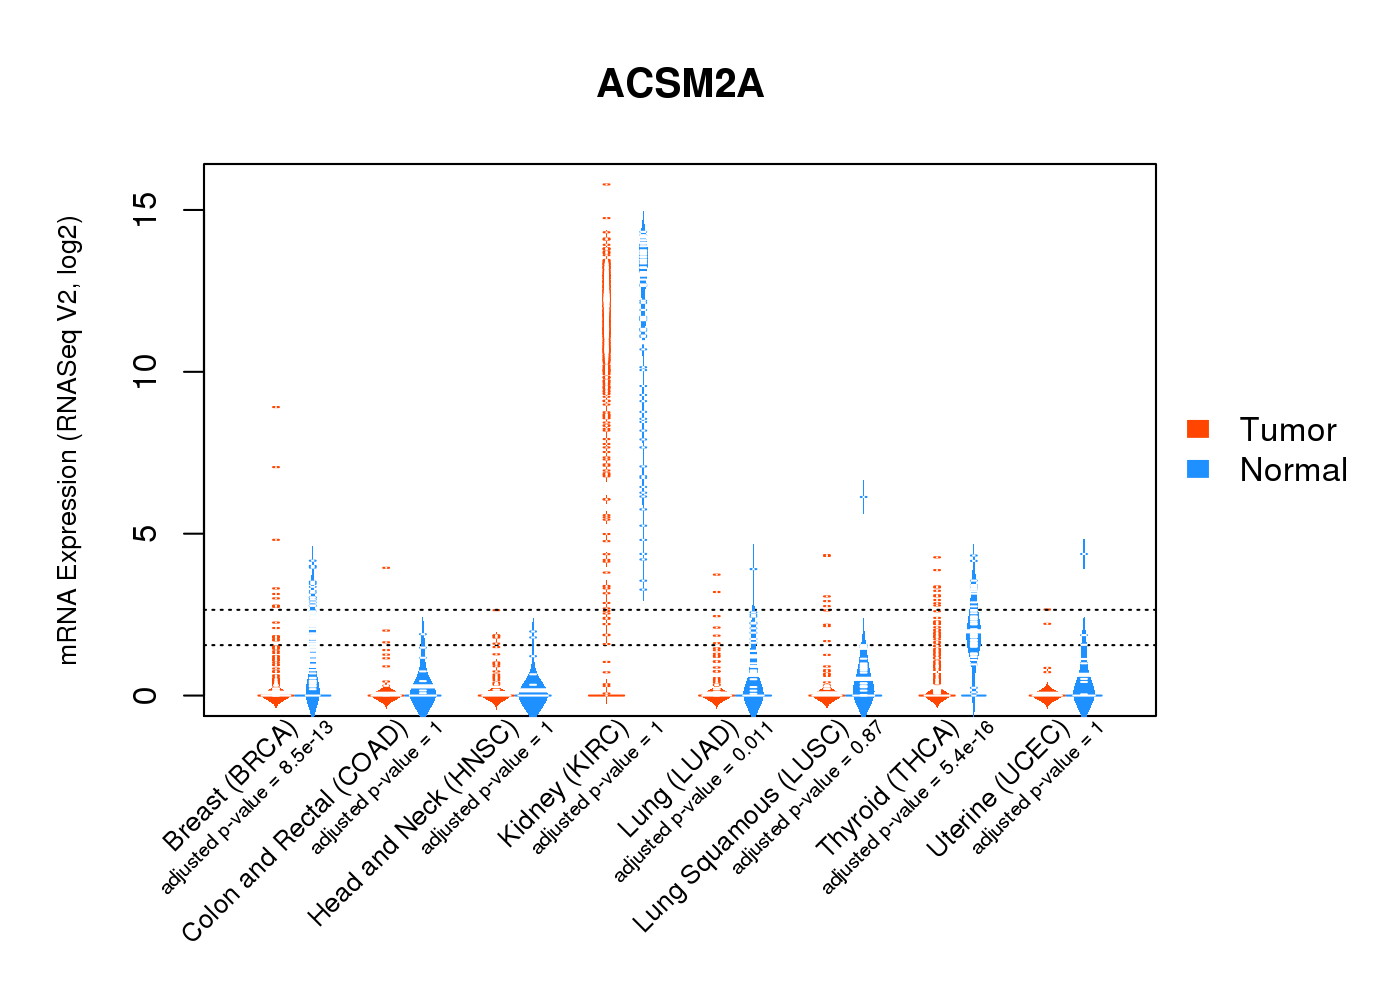 |
| Top |
| * This plots show the correlation between CNV and gene expression. |
: Open all plots for all cancer types
 |
|
 |
|
| Top |
| Gene-Gene Network Information |
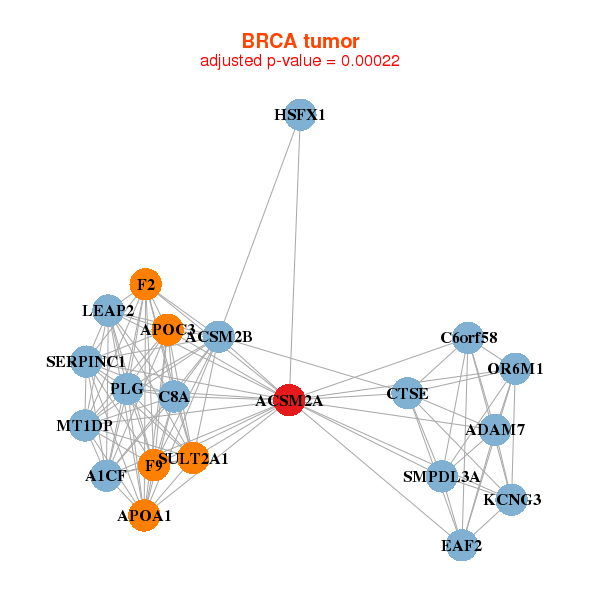
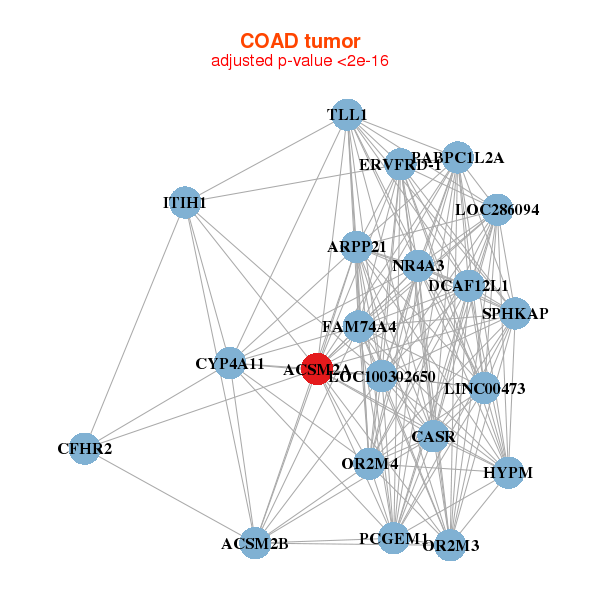
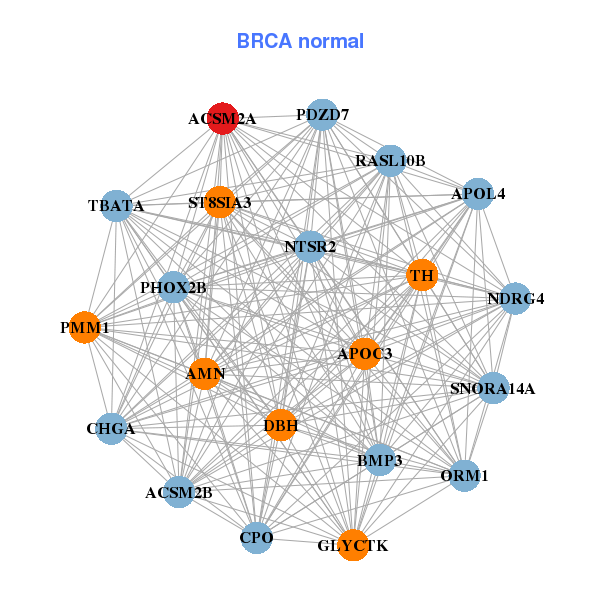
| * Co-Expression network figures were drawn using R package igraph. Only the top 20 genes with the highest correlations were shown. Red circle: input gene, orange circle: cell metabolism gene, sky circle: other gene |
: Open all plots for all cancer types
 |
|
| A1CF,ACSM2A,ACSM2B,ADAM7,APOA1,APOC3,C6orf58, C8A,CTSE,EAF2,F2,F9,HSFX1,KCNG3, LEAP2,MT1DP,OR6M1,PLG,SERPINC1,SMPDL3A,SULT2A1 | ACSM2A,ACSM2B,AMN,APOC3,APOL4,BMP3,TBATA, CHGA,CPO,DBH,GLYCTK,NDRG4,NTSR2,ORM1, PDZD7,PHOX2B,PMM1,RASL10B,SNORA14A,ST8SIA3,TH |
 |
|
| ACSM2A,ACSM2B,ARPP21,LINC00473,CASR,CFHR2,HYPM, CYP4A11,DCAF12L1,ERVFRD-1,FAM74A4,ITIH1,LOC100302650,LOC286094, NR4A3,OR2M3,OR2M4,PABPC1L2A,PCGEM1,SPHKAP,TLL1 | ACSM2A,ADAMTSL2,AMDHD1,CD109,CHST15,COL21A1,SUPT20HL2, GTF2I,HSPA2,KCNIP4,KCNK9,MAEL,NPTX1,PCDHB12, PCDHB3,PCDHB6,PDYN,PRKCA,ROR2,WNT9A,ZYX |
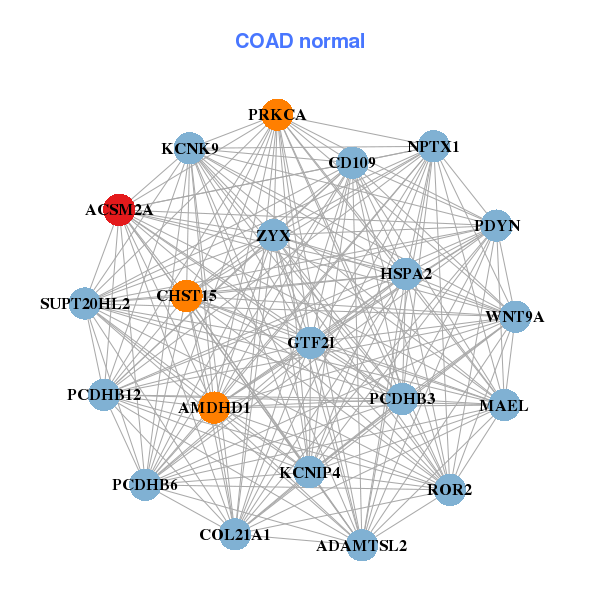
| * Co-Expression network figures were drawn using R package igraph. Only the top 20 genes with the highest correlations were shown. Red circle: input gene, orange circle: cell metabolism gene, sky circle: other gene |
: Open all plots for all cancer types
| Top |
: Open all interacting genes' information including KEGG pathway for all interacting genes from DAVID
| Top |
| Pharmacological Information for ACSM2A |
| There's no related Drug. |
| Top |
| Cross referenced IDs for ACSM2A |
| * We obtained these cross-references from Uniprot database. It covers 150 different DBs, 18 categories. http://www.uniprot.org/help/cross_references_section |
: Open all cross reference information
|
Copyright © 2016-Present - The Univsersity of Texas Health Science Center at Houston @ |