|
|||||||||||||||||||||||||||||||||||||||||||||||||||||||||||||||||||||||||||||||||||||||||||||||||||||||||||||||||||||||||||||||||||||||||||||||||||||||||||||||||||||||||||||||||||||||||||||||||||||||||||||||||||||||||||||||||||||||||||||||||||||||||||||||||||||||||||||||||||||||||||||||||||||||||||||||||||||||||||||||||||||||||||||||||||||||||||||||||||||||||||||||||||||||||||||||||||||||||||||||||||||||||||||||||||||||
| |
| Phenotypic Information (metabolism pathway, cancer, disease, phenome) |
| |
| |
| Gene-Gene Network Information: Co-Expression Network, Interacting Genes & KEGG |
| |
|


| Gene Summary for EARS2 |
| Basic gene info. | Gene symbol | EARS2 |
| Gene name | glutamyl-tRNA synthetase 2, mitochondrial | |
| Synonyms | COXPD12|MSE1 | |
| Cytomap | UCSC genome browser: 16p12.2 | |
| Genomic location | chr16 :23533333-23568696 | |
| Type of gene | protein-coding | |
| RefGenes | NM_001083614.1, NR_003501.1, | |
| Ensembl id | ENSG00000103356 | |
| Description | gluRSglutamate tRNA ligase 2, mitochondrialglutamate--tRNA ligaseglutamyl-tRNA synthetase 2, mitochondrial (putative)probable glutamate--tRNA ligase, mitochondrialprobable glutamyl-tRNA synthetase, mitochondrial | |
| Modification date | 20141207 | |
| dbXrefs | MIM : 612799 | |
| HGNC : HGNC | ||
| Ensembl : ENSG00000103356 | ||
| Vega : OTTHUMG00000177018 | ||
| Protein | UniProt: go to UniProt's Cross Reference DB Table | |
| Expression | CleanEX: HS_EARS2 | |
| BioGPS: 124454 | ||
| Gene Expression Atlas: ENSG00000103356 | ||
| The Human Protein Atlas: ENSG00000103356 | ||
| Pathway | NCI Pathway Interaction Database: EARS2 | |
| KEGG: EARS2 | ||
| REACTOME: EARS2 | ||
| ConsensusPathDB | ||
| Pathway Commons: EARS2 | ||
| Metabolism | MetaCyc: EARS2 | |
| HUMANCyc: EARS2 | ||
| Regulation | Ensembl's Regulation: ENSG00000103356 | |
| miRBase: chr16 :23,533,333-23,568,696 | ||
| TargetScan: NM_001083614 | ||
| cisRED: ENSG00000103356 | ||
| Context | iHOP: EARS2 | |
| cancer metabolism search in PubMed: EARS2 | ||
| UCL Cancer Institute: EARS2 | ||
| Assigned class in ccmGDB | C | |
| Top |
| Phenotypic Information for EARS2(metabolism pathway, cancer, disease, phenome) |
| Cancer | CGAP: EARS2 |
| Familial Cancer Database: EARS2 | |
| * This gene is included in those cancer gene databases. |
|
|
|
|
|
|
| |||||||||||||||||||||||||||||||||||||||||||||||||||||||||||||||||||||||||||||||||||||||||||||||||||||||||||||||||||||||||||||||||||||||||||||||||||||||||||||||||||||||||||||||||||||||||||||||||||||||||||||||||||||||||||||||||||||||||||||||||||||||||||||||||||||||||||||||||||||||||||||||||||||||||||||||||||||||||||||||||||||||||||||||||||||||||||||||||||||||||||||||||||||||||||||||||||||||||||||||||||||||||||||||||
Oncogene 1 | Significant driver gene in | ||||||||||||||||||||||||||||||||||||||||||||||||||||||||||||||||||||||||||||||||||||||||||||||||||||||||||||||||||||||||||||||||||||||||||||||||||||||||||||||||||||||||||||||||||||||||||||||||||||||||||||||||||||||||||||||||||||||||||||||||||||||||||||||||||||||||||||||||||||||||||||||||||||||||||||||||||||||||||||||||||||||||||||||||||||||||||||||||||||||||||||||||||||||||||||||||||||||||||||||||||||||||||||||||||||||
| cf) number; DB name 1 Oncogene; http://nar.oxfordjournals.org/content/35/suppl_1/D721.long, 2 Tumor Suppressor gene; https://bioinfo.uth.edu/TSGene/, 3 Cancer Gene Census; http://www.nature.com/nrc/journal/v4/n3/abs/nrc1299.html, 4 CancerGenes; http://nar.oxfordjournals.org/content/35/suppl_1/D721.long, 5 Network of Cancer Gene; http://ncg.kcl.ac.uk/index.php, 1Therapeutic Vulnerabilities in Cancer; http://cbio.mskcc.org/cancergenomics/statius/ |
| KEGG_PORPHYRIN_AND_CHLOROPHYLL_METABOLISM | |
| OMIM | |
| Orphanet | |
| Disease | KEGG Disease: EARS2 |
| MedGen: EARS2 (Human Medical Genetics with Condition) | |
| ClinVar: EARS2 | |
| Phenotype | MGI: EARS2 (International Mouse Phenotyping Consortium) |
| PhenomicDB: EARS2 | |
| Mutations for EARS2 |
| * Under tables are showing count per each tissue to give us broad intuition about tissue specific mutation patterns.You can go to the detailed page for each mutation database's web site. |
| There's no structural variation information in COSMIC data for this gene. |
| * From mRNA Sanger sequences, Chitars2.0 arranged chimeric transcripts. This table shows EARS2 related fusion information. |
| ID | Head Gene | Tail Gene | Accession | Gene_a | qStart_a | qEnd_a | Chromosome_a | tStart_a | tEnd_a | Gene_a | qStart_a | qEnd_a | Chromosome_a | tStart_a | tEnd_a |
| AW605160 | HMGB2 | 8 | 465 | 4 | 174253196 | 174254307 | EARS2 | 453 | 561 | 16 | 23535431 | 23535539 | |
| Top |
| Mutation type/ Tissue ID | brca | cns | cerv | endome | haematopo | kidn | Lintest | liver | lung | ns | ovary | pancre | prost | skin | stoma | thyro | urina | |||
| Total # sample | 1 | |||||||||||||||||||
| GAIN (# sample) | ||||||||||||||||||||
| LOSS (# sample) | 1 |
| cf) Tissue ID; Tissue type (1; Breast, 2; Central_nervous_system, 3; Cervix, 4; Endometrium, 5; Haematopoietic_and_lymphoid_tissue, 6; Kidney, 7; Large_intestine, 8; Liver, 9; Lung, 10; NS, 11; Ovary, 12; Pancreas, 13; Prostate, 14; Skin, 15; Stomach, 16; Thyroid, 17; Urinary_tract) |
| Top |
|
 |
| Top |
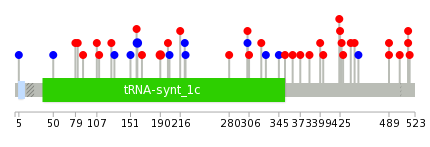
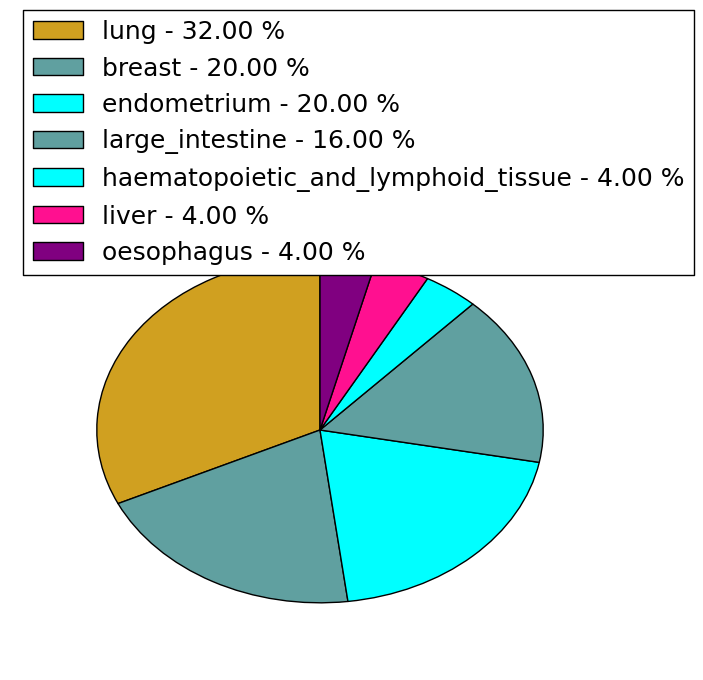
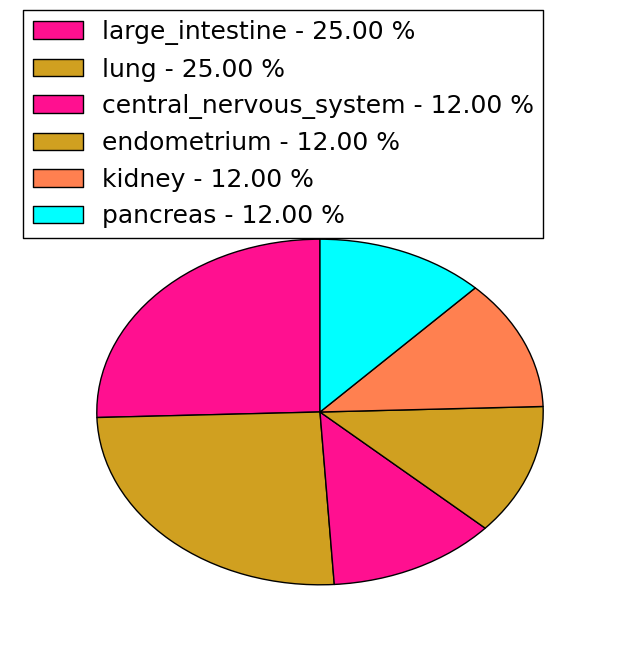
| Stat. for Non-Synonymous SNVs (# total SNVs=25) | (# total SNVs=8) |
 |  |
(# total SNVs=0) | (# total SNVs=0) |
| Top |
| * When you move the cursor on each content, you can see more deailed mutation information on the Tooltip. Those are primary_site,primary_histology,mutation(aa),pubmedID. |
| GRCh37 position | Mutation(aa) | Unique sampleID count |
| chr16:23555840-23555840 | p.T160T | 2 |
| chr16:23546599-23546599 | p.R190C | 2 |
| chr16:23535724-23535724 | p.R514W | 1 |
| chr16:23555830-23555830 | p.? | 1 |
| chr16:23563530-23563530 | p.D79H | 1 |
| chr16:23540905-23540905 | p.L424M | 1 |
| chr16:23546255-23546255 | p.P304P | 1 |
| chr16:23535757-23535757 | p.E503Q | 1 |
| chr16:23563572-23563572 | p.K65* | 1 |
| chr16:23541078-23541078 | p.L403P | 1 |
| Top |
|
 |
| Point Mutation/ Tissue ID | 1 | 2 | 3 | 4 | 5 | 6 | 7 | 8 | 9 | 10 | 11 | 12 | 13 | 14 | 15 | 16 | 17 | 18 | 19 | 20 |
| # sample | 1 | 3 | 3 | 2 | 1 | 1 | 4 | 3 | 1 | 6 | 5 | |||||||||
| # mutation | 1 | 3 | 3 | 2 | 1 | 1 | 4 | 3 | 1 | 6 | 6 | |||||||||
| nonsynonymous SNV | 1 | 3 | 2 | 1 | 3 | 3 | 3 | 5 | ||||||||||||
| synonymous SNV | 1 | 1 | 1 | 1 | 1 | 1 | 3 | 1 |
| cf) Tissue ID; Tissue type (1; BLCA[Bladder Urothelial Carcinoma], 2; BRCA[Breast invasive carcinoma], 3; CESC[Cervical squamous cell carcinoma and endocervical adenocarcinoma], 4; COAD[Colon adenocarcinoma], 5; GBM[Glioblastoma multiforme], 6; Glioma Low Grade, 7; HNSC[Head and Neck squamous cell carcinoma], 8; KICH[Kidney Chromophobe], 9; KIRC[Kidney renal clear cell carcinoma], 10; KIRP[Kidney renal papillary cell carcinoma], 11; LAML[Acute Myeloid Leukemia], 12; LUAD[Lung adenocarcinoma], 13; LUSC[Lung squamous cell carcinoma], 14; OV[Ovarian serous cystadenocarcinoma ], 15; PAAD[Pancreatic adenocarcinoma], 16; PRAD[Prostate adenocarcinoma], 17; SKCM[Skin Cutaneous Melanoma], 18:STAD[Stomach adenocarcinoma], 19:THCA[Thyroid carcinoma], 20:UCEC[Uterine Corpus Endometrial Carcinoma]) |
| Top |
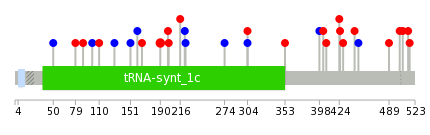
| * We represented just top 10 SNVs. When you move the cursor on each content, you can see more deailed mutation information on the Tooltip. Those are primary_site, primary_histology, mutation(aa), pubmedID. |
| Genomic Position | Mutation(aa) | Unique sampleID count |
| chr16:23546599 | p.R190C | 2 |
| chr16:23535745 | p.R489W | 1 |
| chr16:23543988 | p.L201M | 1 |
| chr16:23555840 | p.V449V | 1 |
| chr16:23535757 | p.D200N | 1 |
| chr16:23546255 | p.V444A | 1 |
| chr16:23555867 | p.A429V | 1 |
| chr16:23536588 | p.R166W | 1 |
| chr16:23546257 | p.W425C | 1 |
| chr16:23555930 | p.T160T | 1 |
| * Copy number data were extracted from TCGA using R package TCGA-Assembler. The URLs of all public data files on TCGA DCC data server were gathered on Jan-05-2015. Function ProcessCNAData in TCGA-Assembler package was used to obtain gene-level copy number value which is calculated as the average copy number of the genomic region of a gene. |
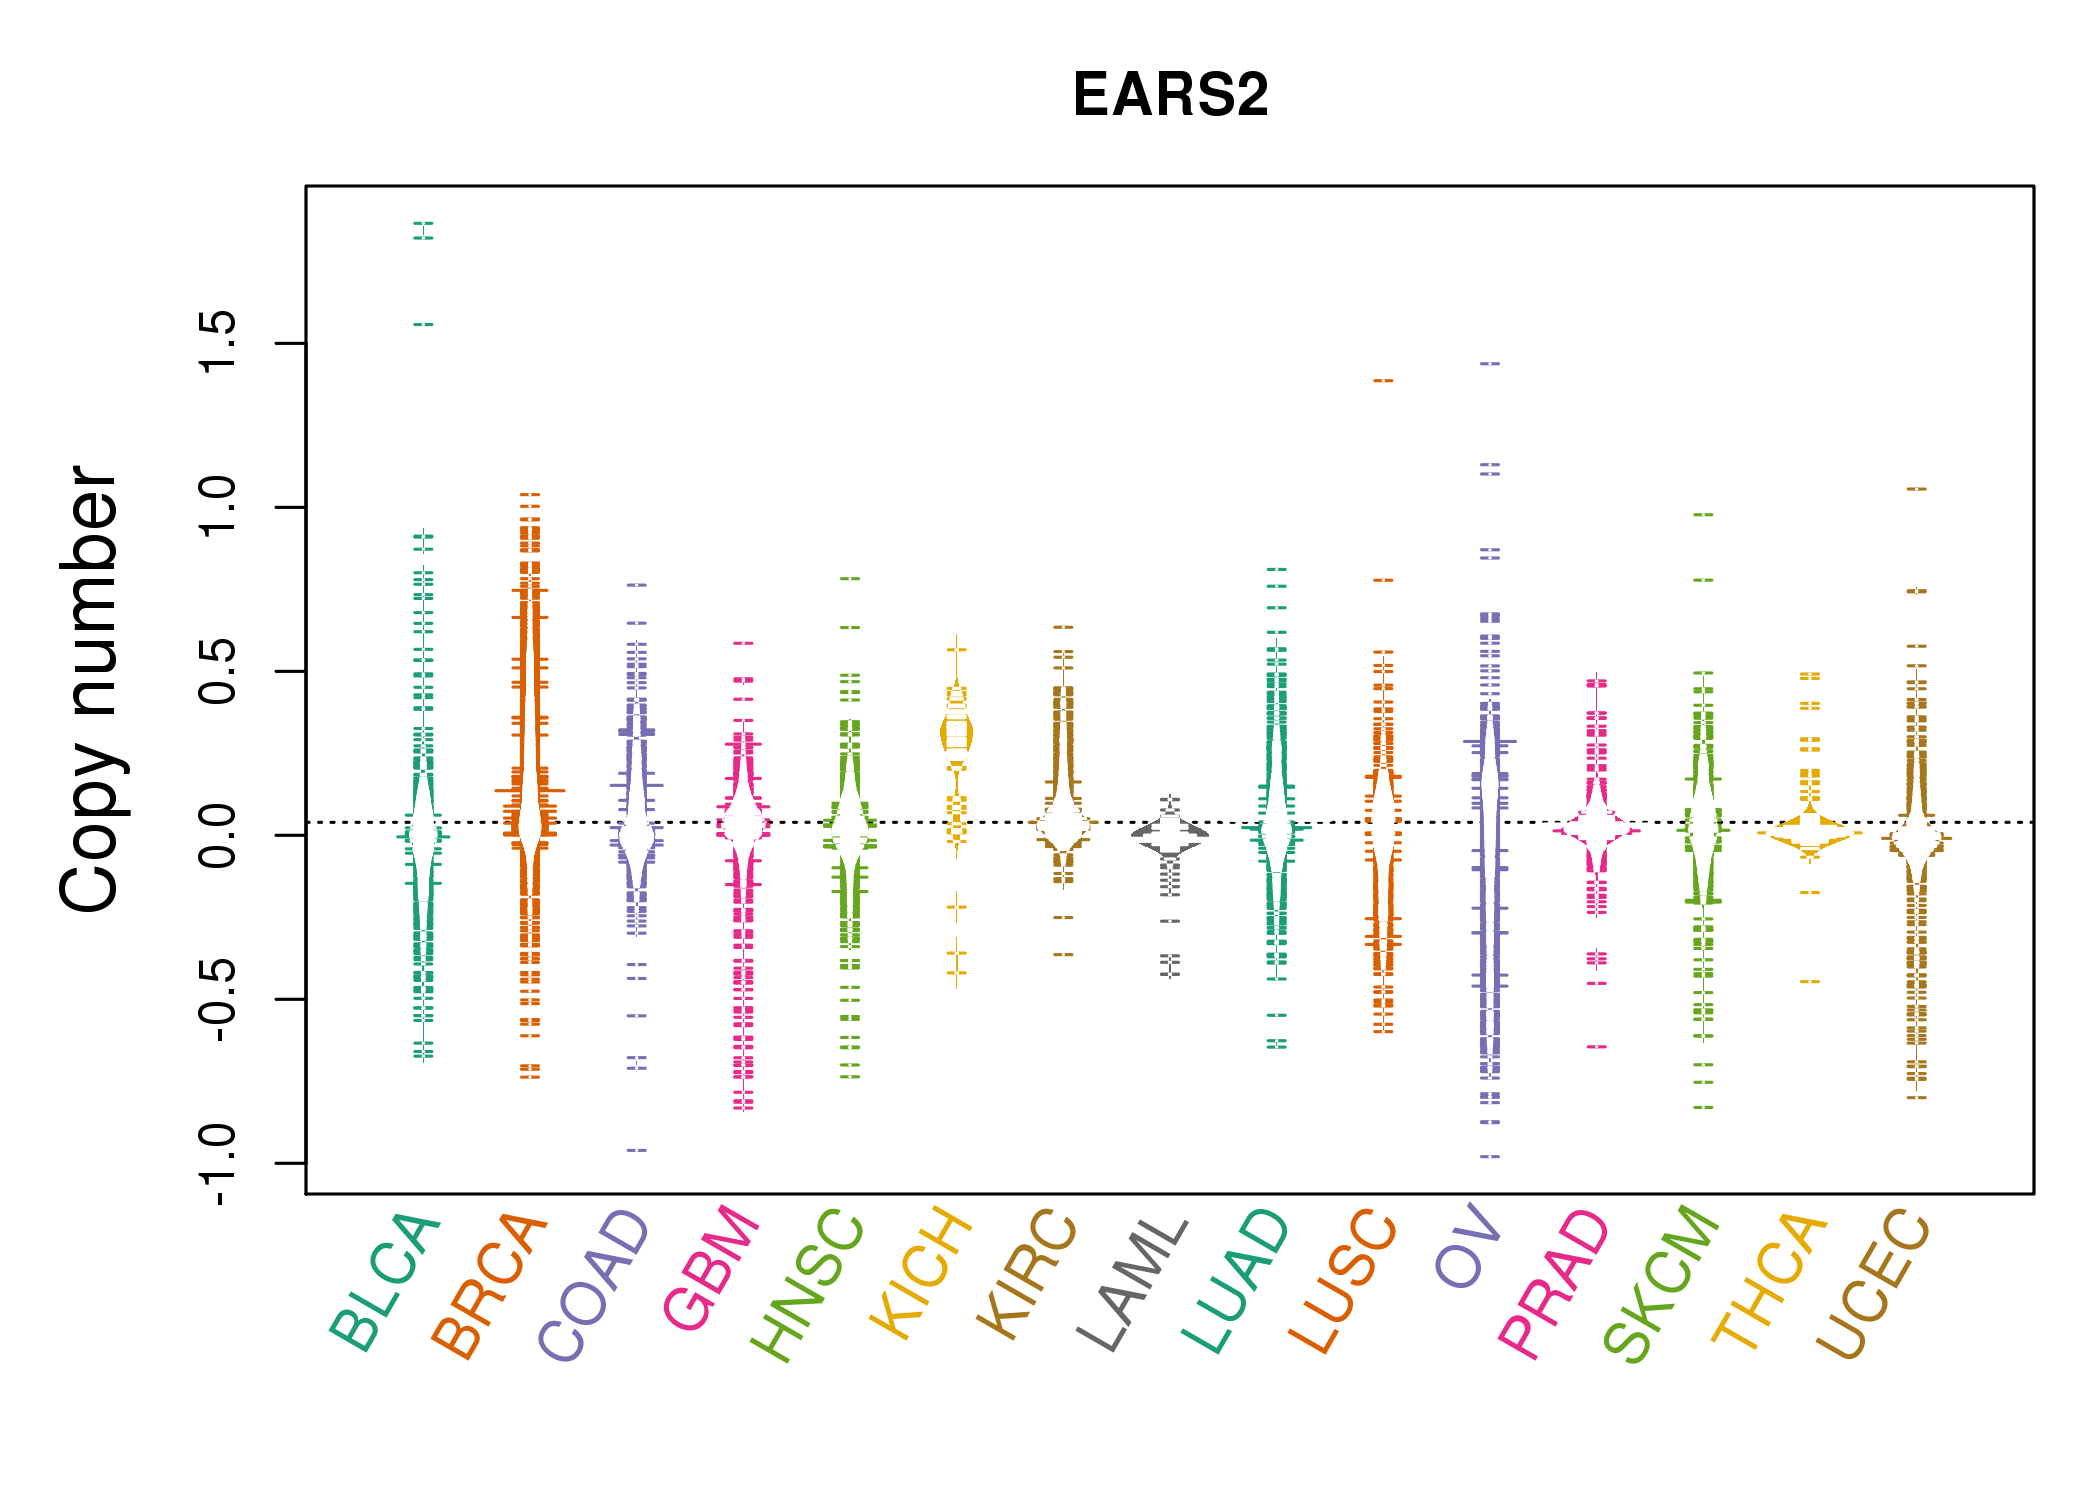 |
| cf) Tissue ID[Tissue type]: BLCA[Bladder Urothelial Carcinoma], BRCA[Breast invasive carcinoma], CESC[Cervical squamous cell carcinoma and endocervical adenocarcinoma], COAD[Colon adenocarcinoma], GBM[Glioblastoma multiforme], Glioma Low Grade, HNSC[Head and Neck squamous cell carcinoma], KICH[Kidney Chromophobe], KIRC[Kidney renal clear cell carcinoma], KIRP[Kidney renal papillary cell carcinoma], LAML[Acute Myeloid Leukemia], LUAD[Lung adenocarcinoma], LUSC[Lung squamous cell carcinoma], OV[Ovarian serous cystadenocarcinoma ], PAAD[Pancreatic adenocarcinoma], PRAD[Prostate adenocarcinoma], SKCM[Skin Cutaneous Melanoma], STAD[Stomach adenocarcinoma], THCA[Thyroid carcinoma], UCEC[Uterine Corpus Endometrial Carcinoma] |
| Top |
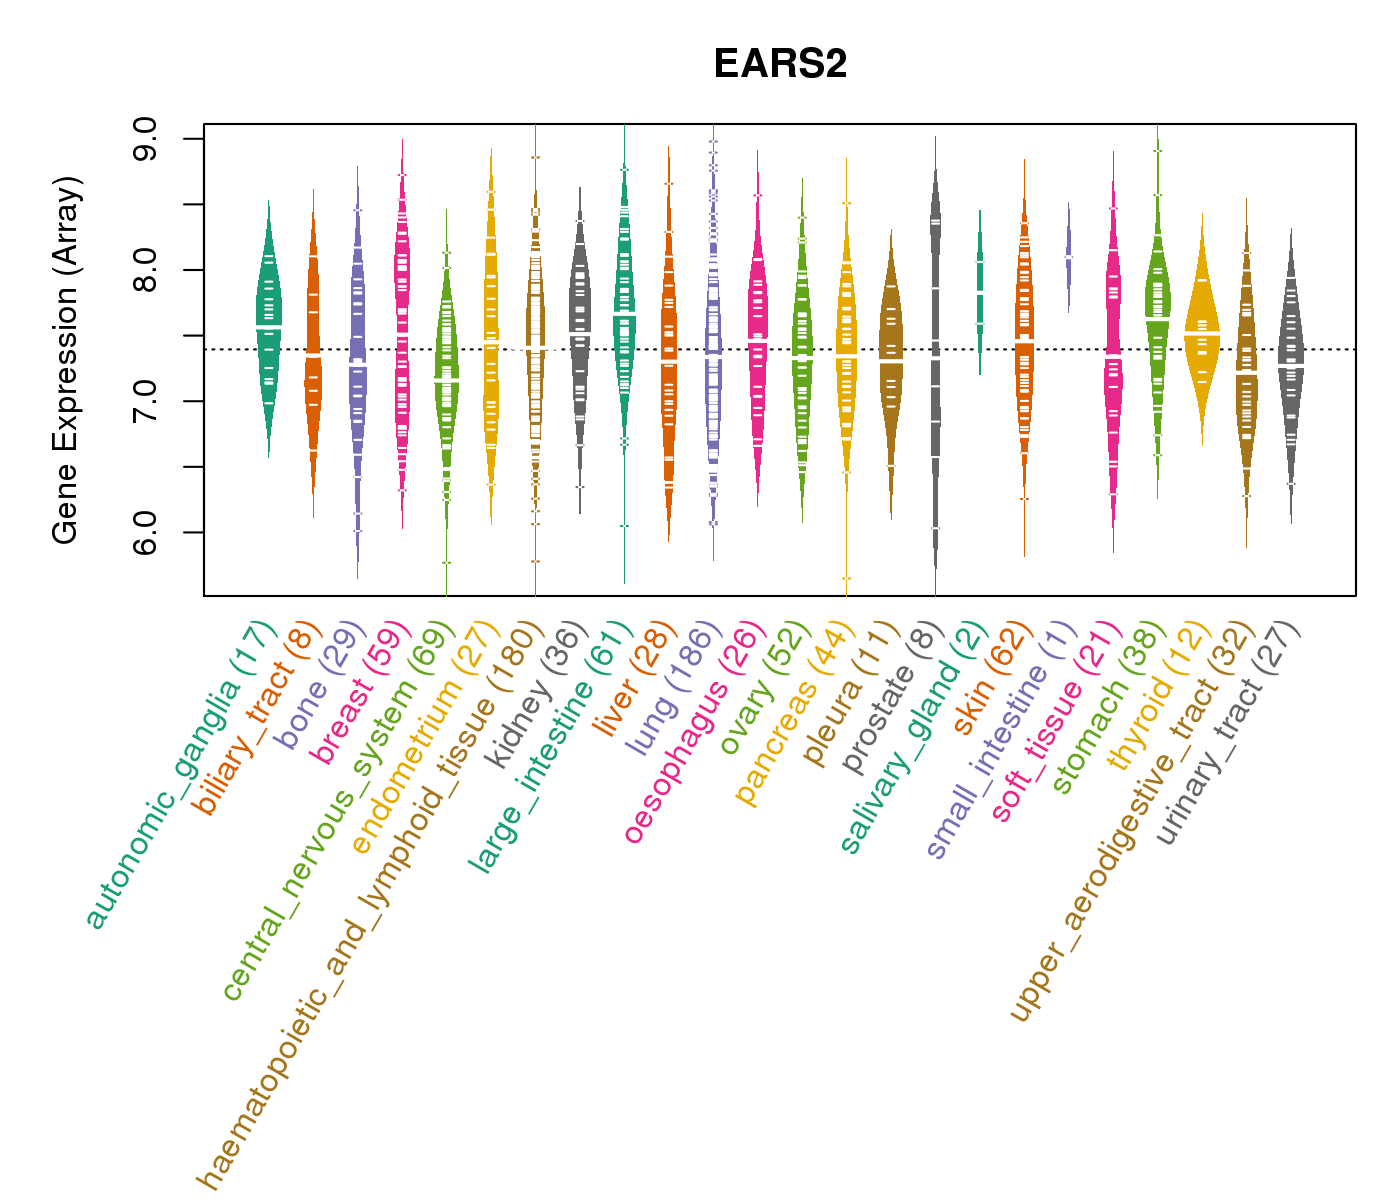
| Gene Expression for EARS2 |
| * CCLE gene expression data were extracted from CCLE_Expression_Entrez_2012-10-18.res: Gene-centric RMA-normalized mRNA expression data. |
 |
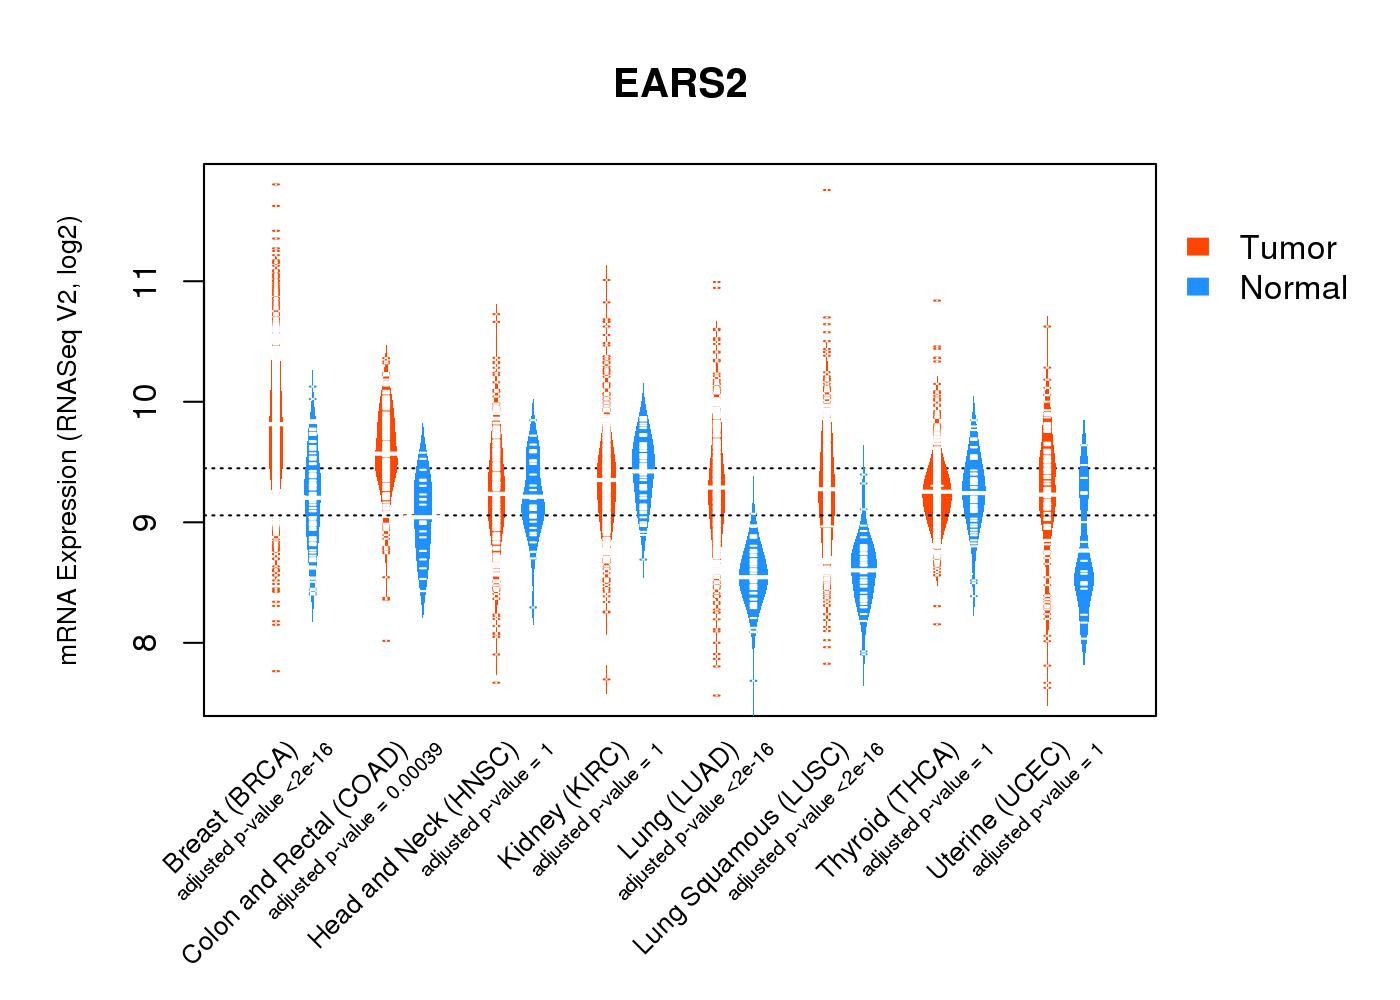
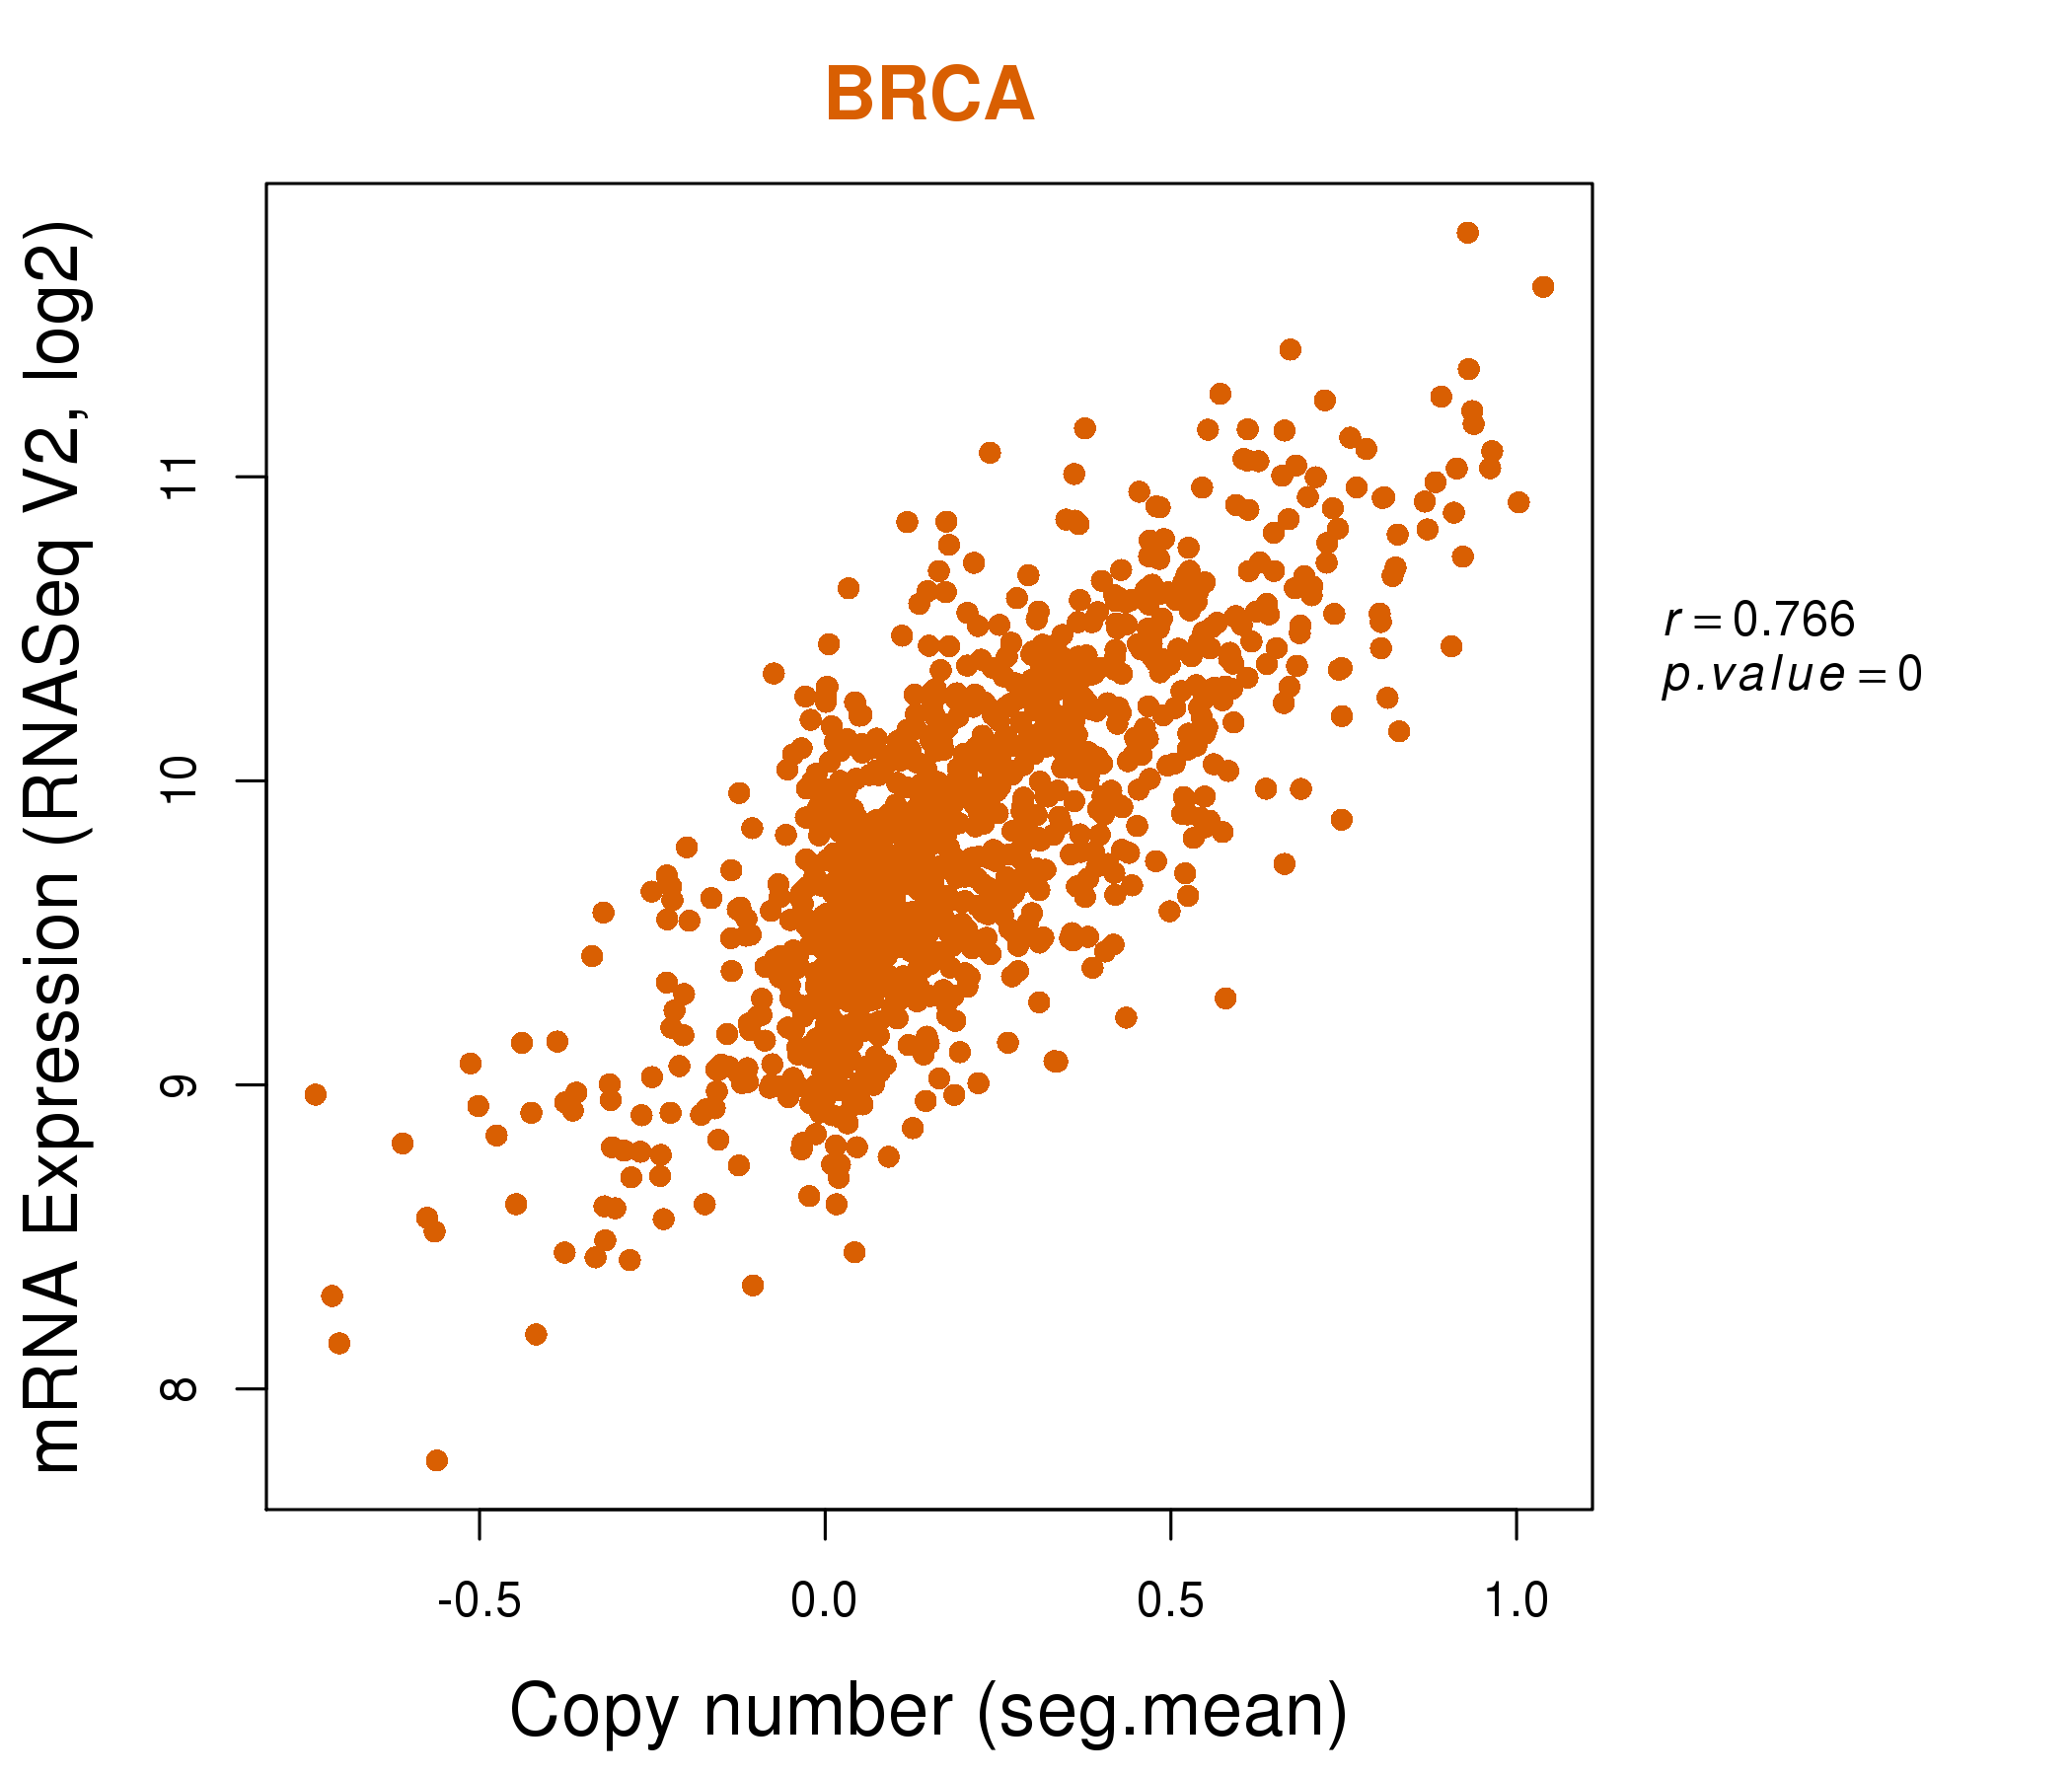
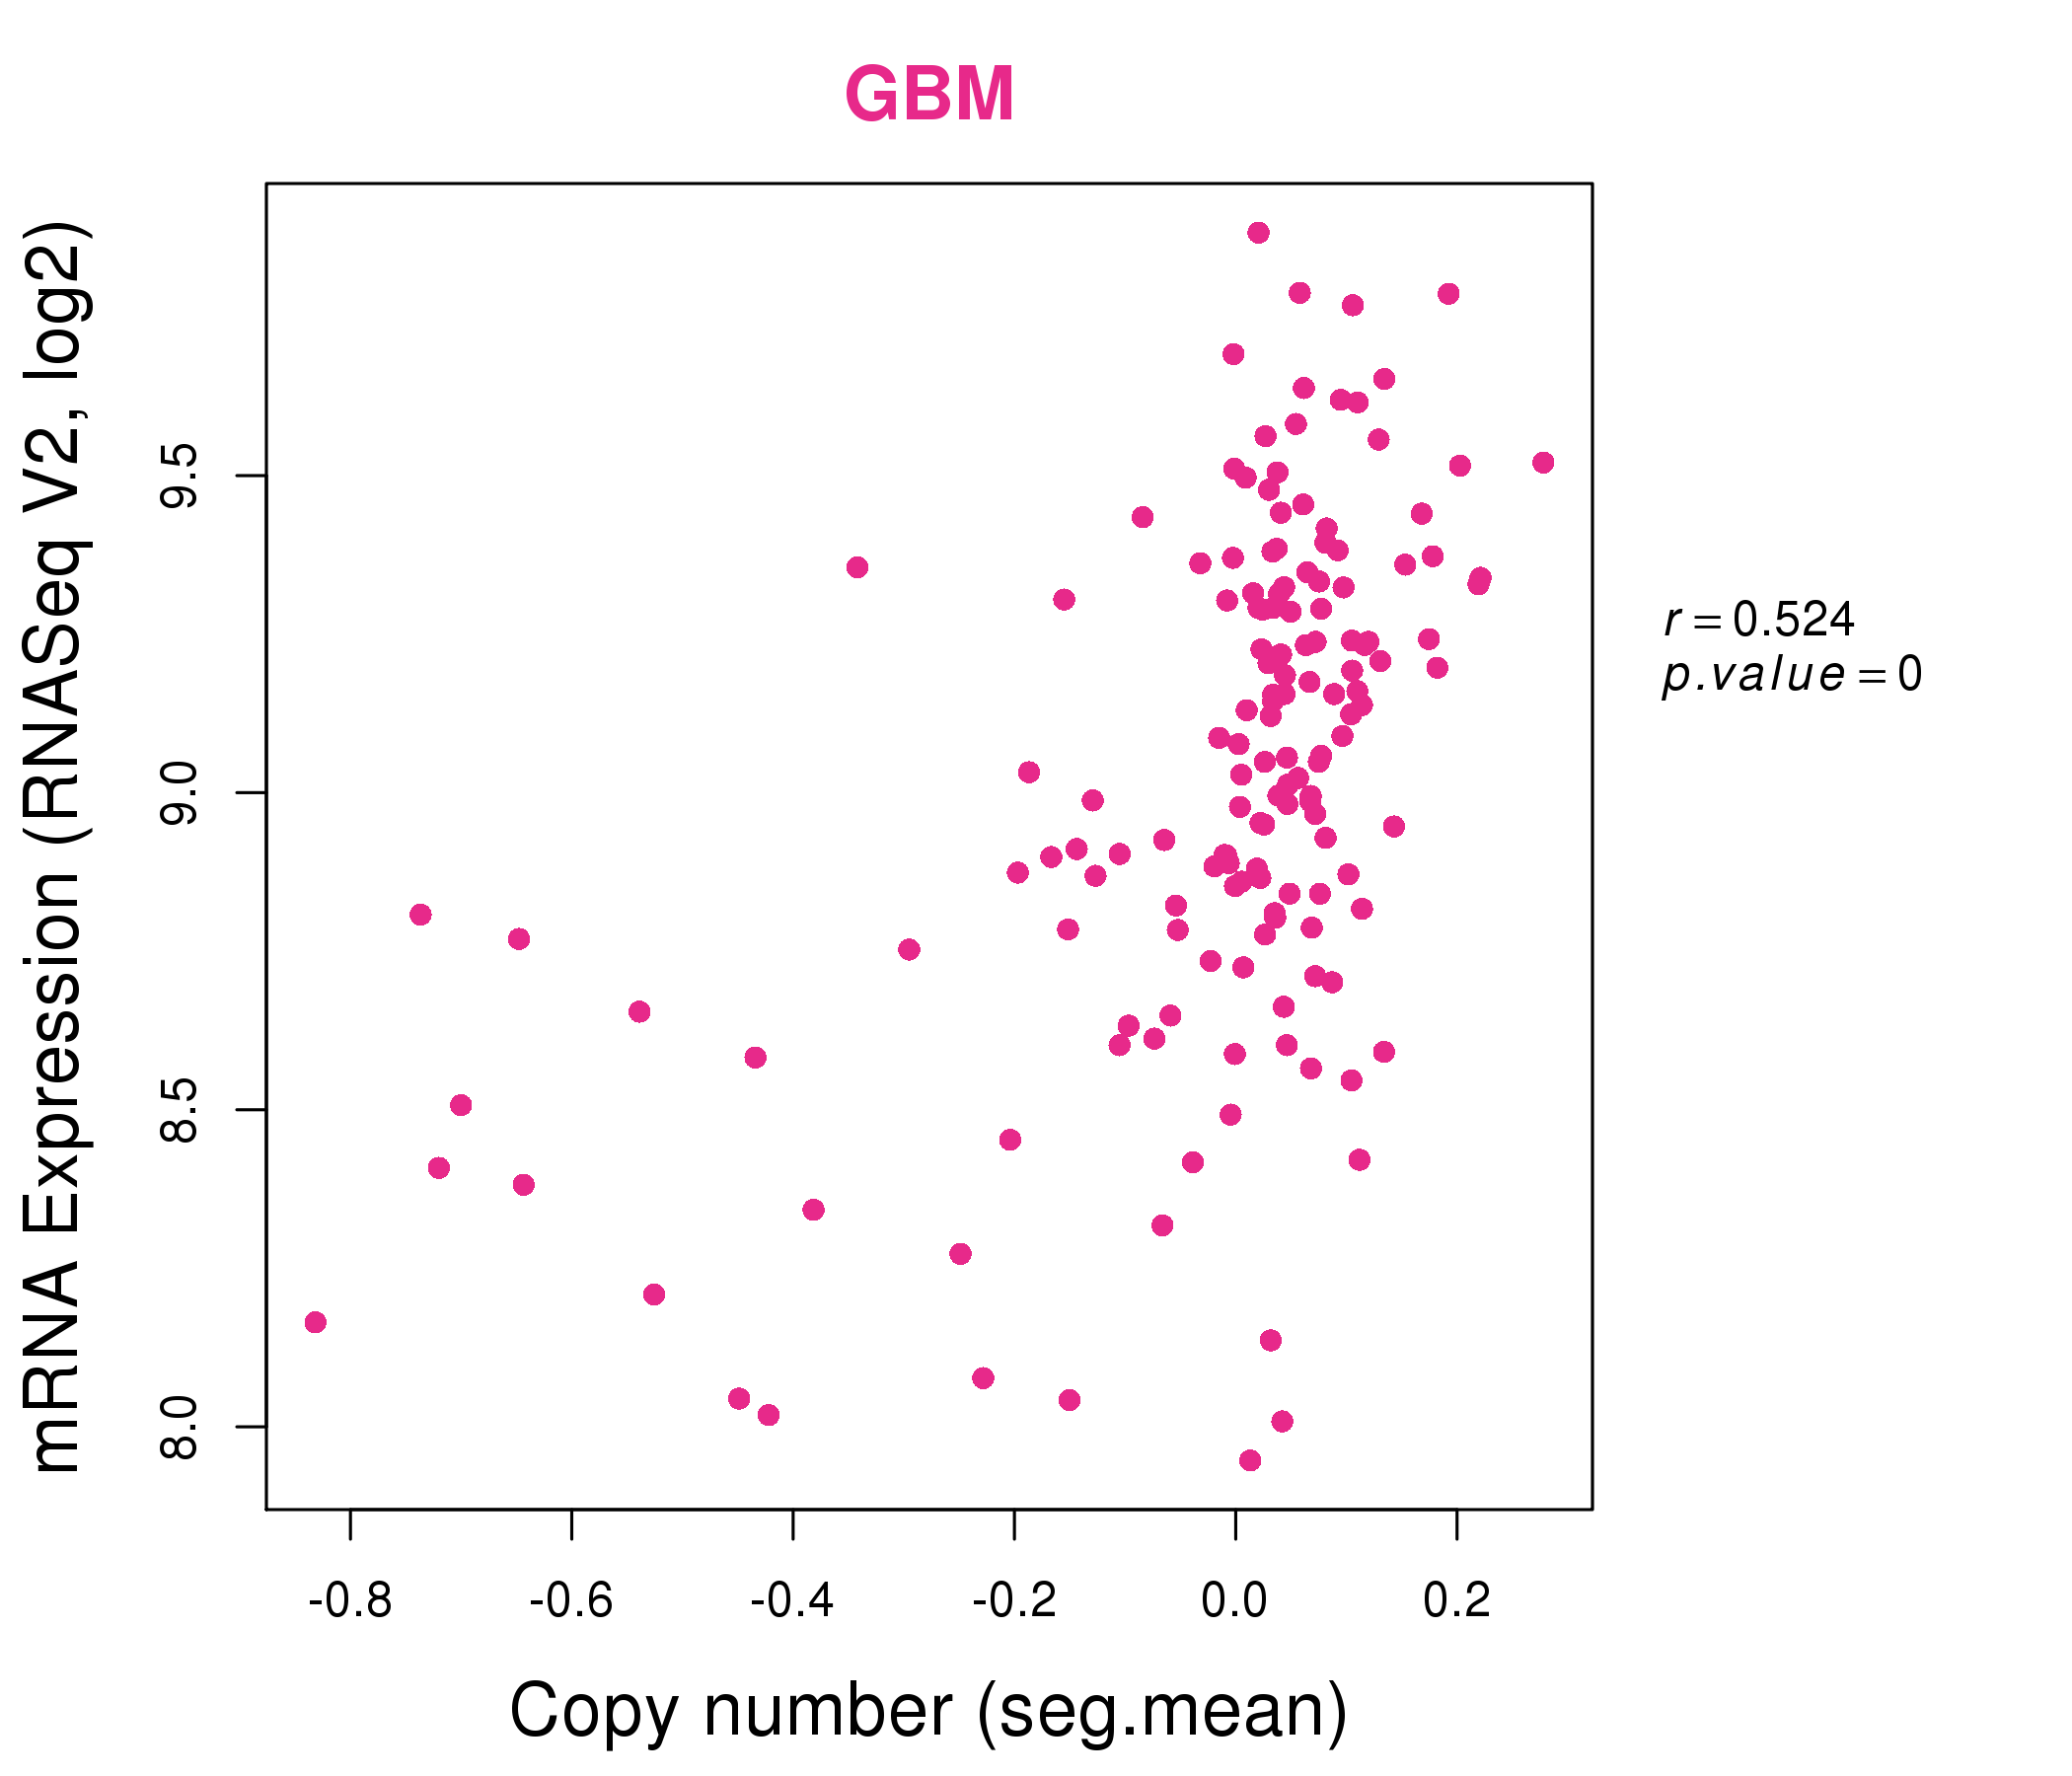
| * Normalized gene expression data of RNASeqV2 was extracted from TCGA using R package TCGA-Assembler. The URLs of all public data files on TCGA DCC data server were gathered at Jan-05-2015. Only eight cancer types have enough normal control samples for differential expression analysis. (t test, adjusted p<0.05 (using Benjamini-Hochberg FDR)) |
 |
| Top |
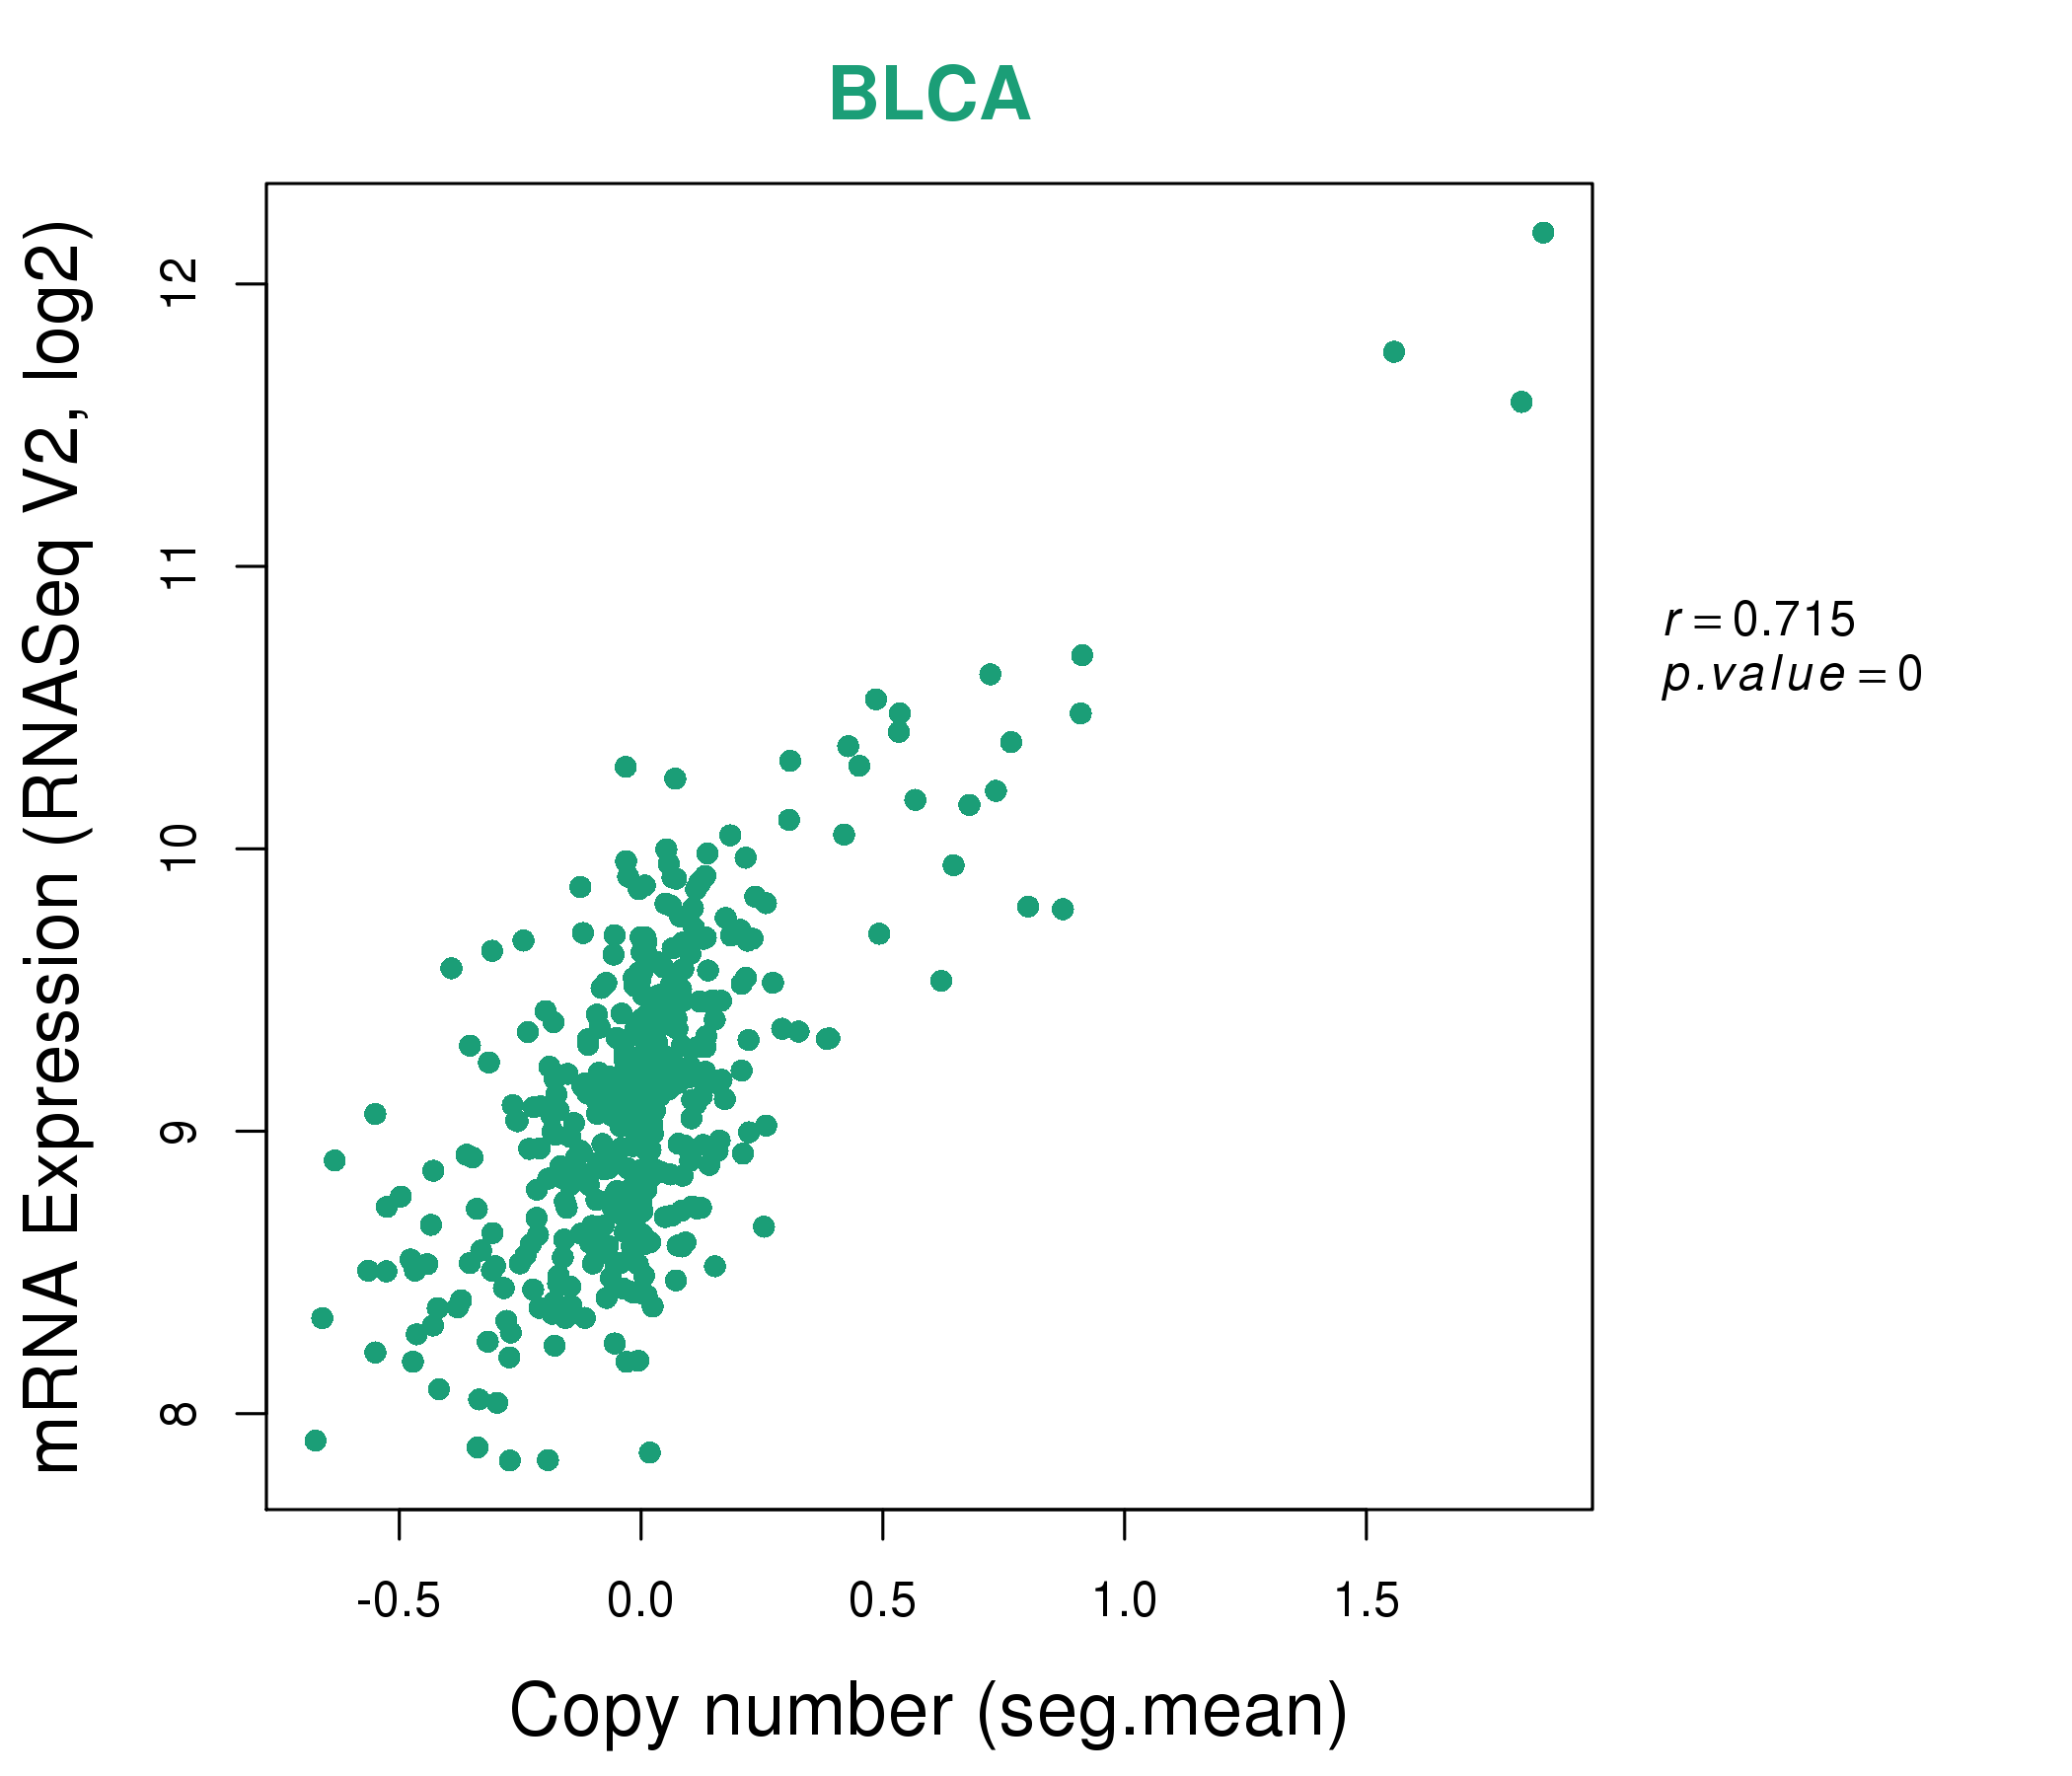
| * This plots show the correlation between CNV and gene expression. |
: Open all plots for all cancer types
 |
|
 |
|
| Top |
| Gene-Gene Network Information |
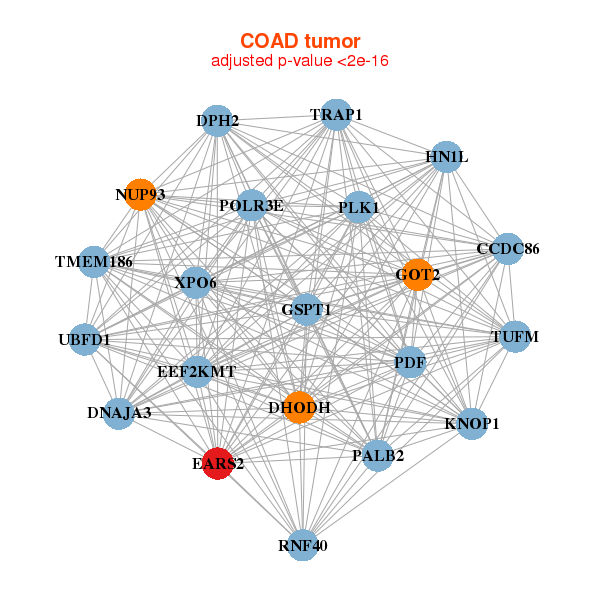
| * Co-Expression network figures were drawn using R package igraph. Only the top 20 genes with the highest correlations were shown. Red circle: input gene, orange circle: cell metabolism gene, sky circle: other gene |
: Open all plots for all cancer types
 |
| ||||
| ALG1,FOPNL,KNOP1,COG7,COQ7,DNAJA3,EARS2, ERI2,GLYR1,GSPT1,HN1L,PARN,POLR3E,RRN3, THUMPD1,UBFD1,USP7,ZKSCAN2,ZNF174,ZNF263,ZSCAN32 | BEND3,C10orf2,COBL,DAG1,DKC1,EARS2,GLB1L2, IPO4,KIAA1324,LARS,LIG3,MANEAL,MCM4,PAICS, PDCD11,PLCH1,PLEKHH1,POLR1B,SLC12A8,UCK2,WWC1 | ||||
 |
| ||||
| KNOP1,CCDC86,DHODH,DNAJA3,DPH2,EARS2,EEF2KMT, GOT2,GSPT1,HN1L,NUP93,PALB2,PDF,PLK1, POLR3E,RNF40,TMEM186,TRAP1,TUFM,UBFD1,XPO6 | ABCE1,ACAD9,DDX10,DDX56,DHODH,DKC1,EARS2, FARSB,KIAA0020,NOP14,PAICS,PPIF,PRMT5,PRPF4, PUS1,PUS7,RRP9,SRFBP1,UTP14A,WDR3,WDR77 |
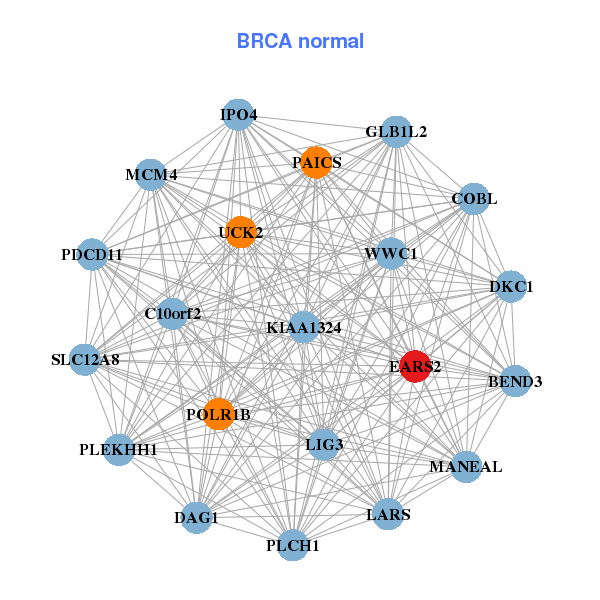

| * Co-Expression network figures were drawn using R package igraph. Only the top 20 genes with the highest correlations were shown. Red circle: input gene, orange circle: cell metabolism gene, sky circle: other gene |
: Open all plots for all cancer types
| Top |
: Open all interacting genes' information including KEGG pathway for all interacting genes from DAVID
| Top |
| Pharmacological Information for EARS2 |
| DB Category | DB Name | DB's ID and Url link |
| * Gene Centered Interaction Network. |
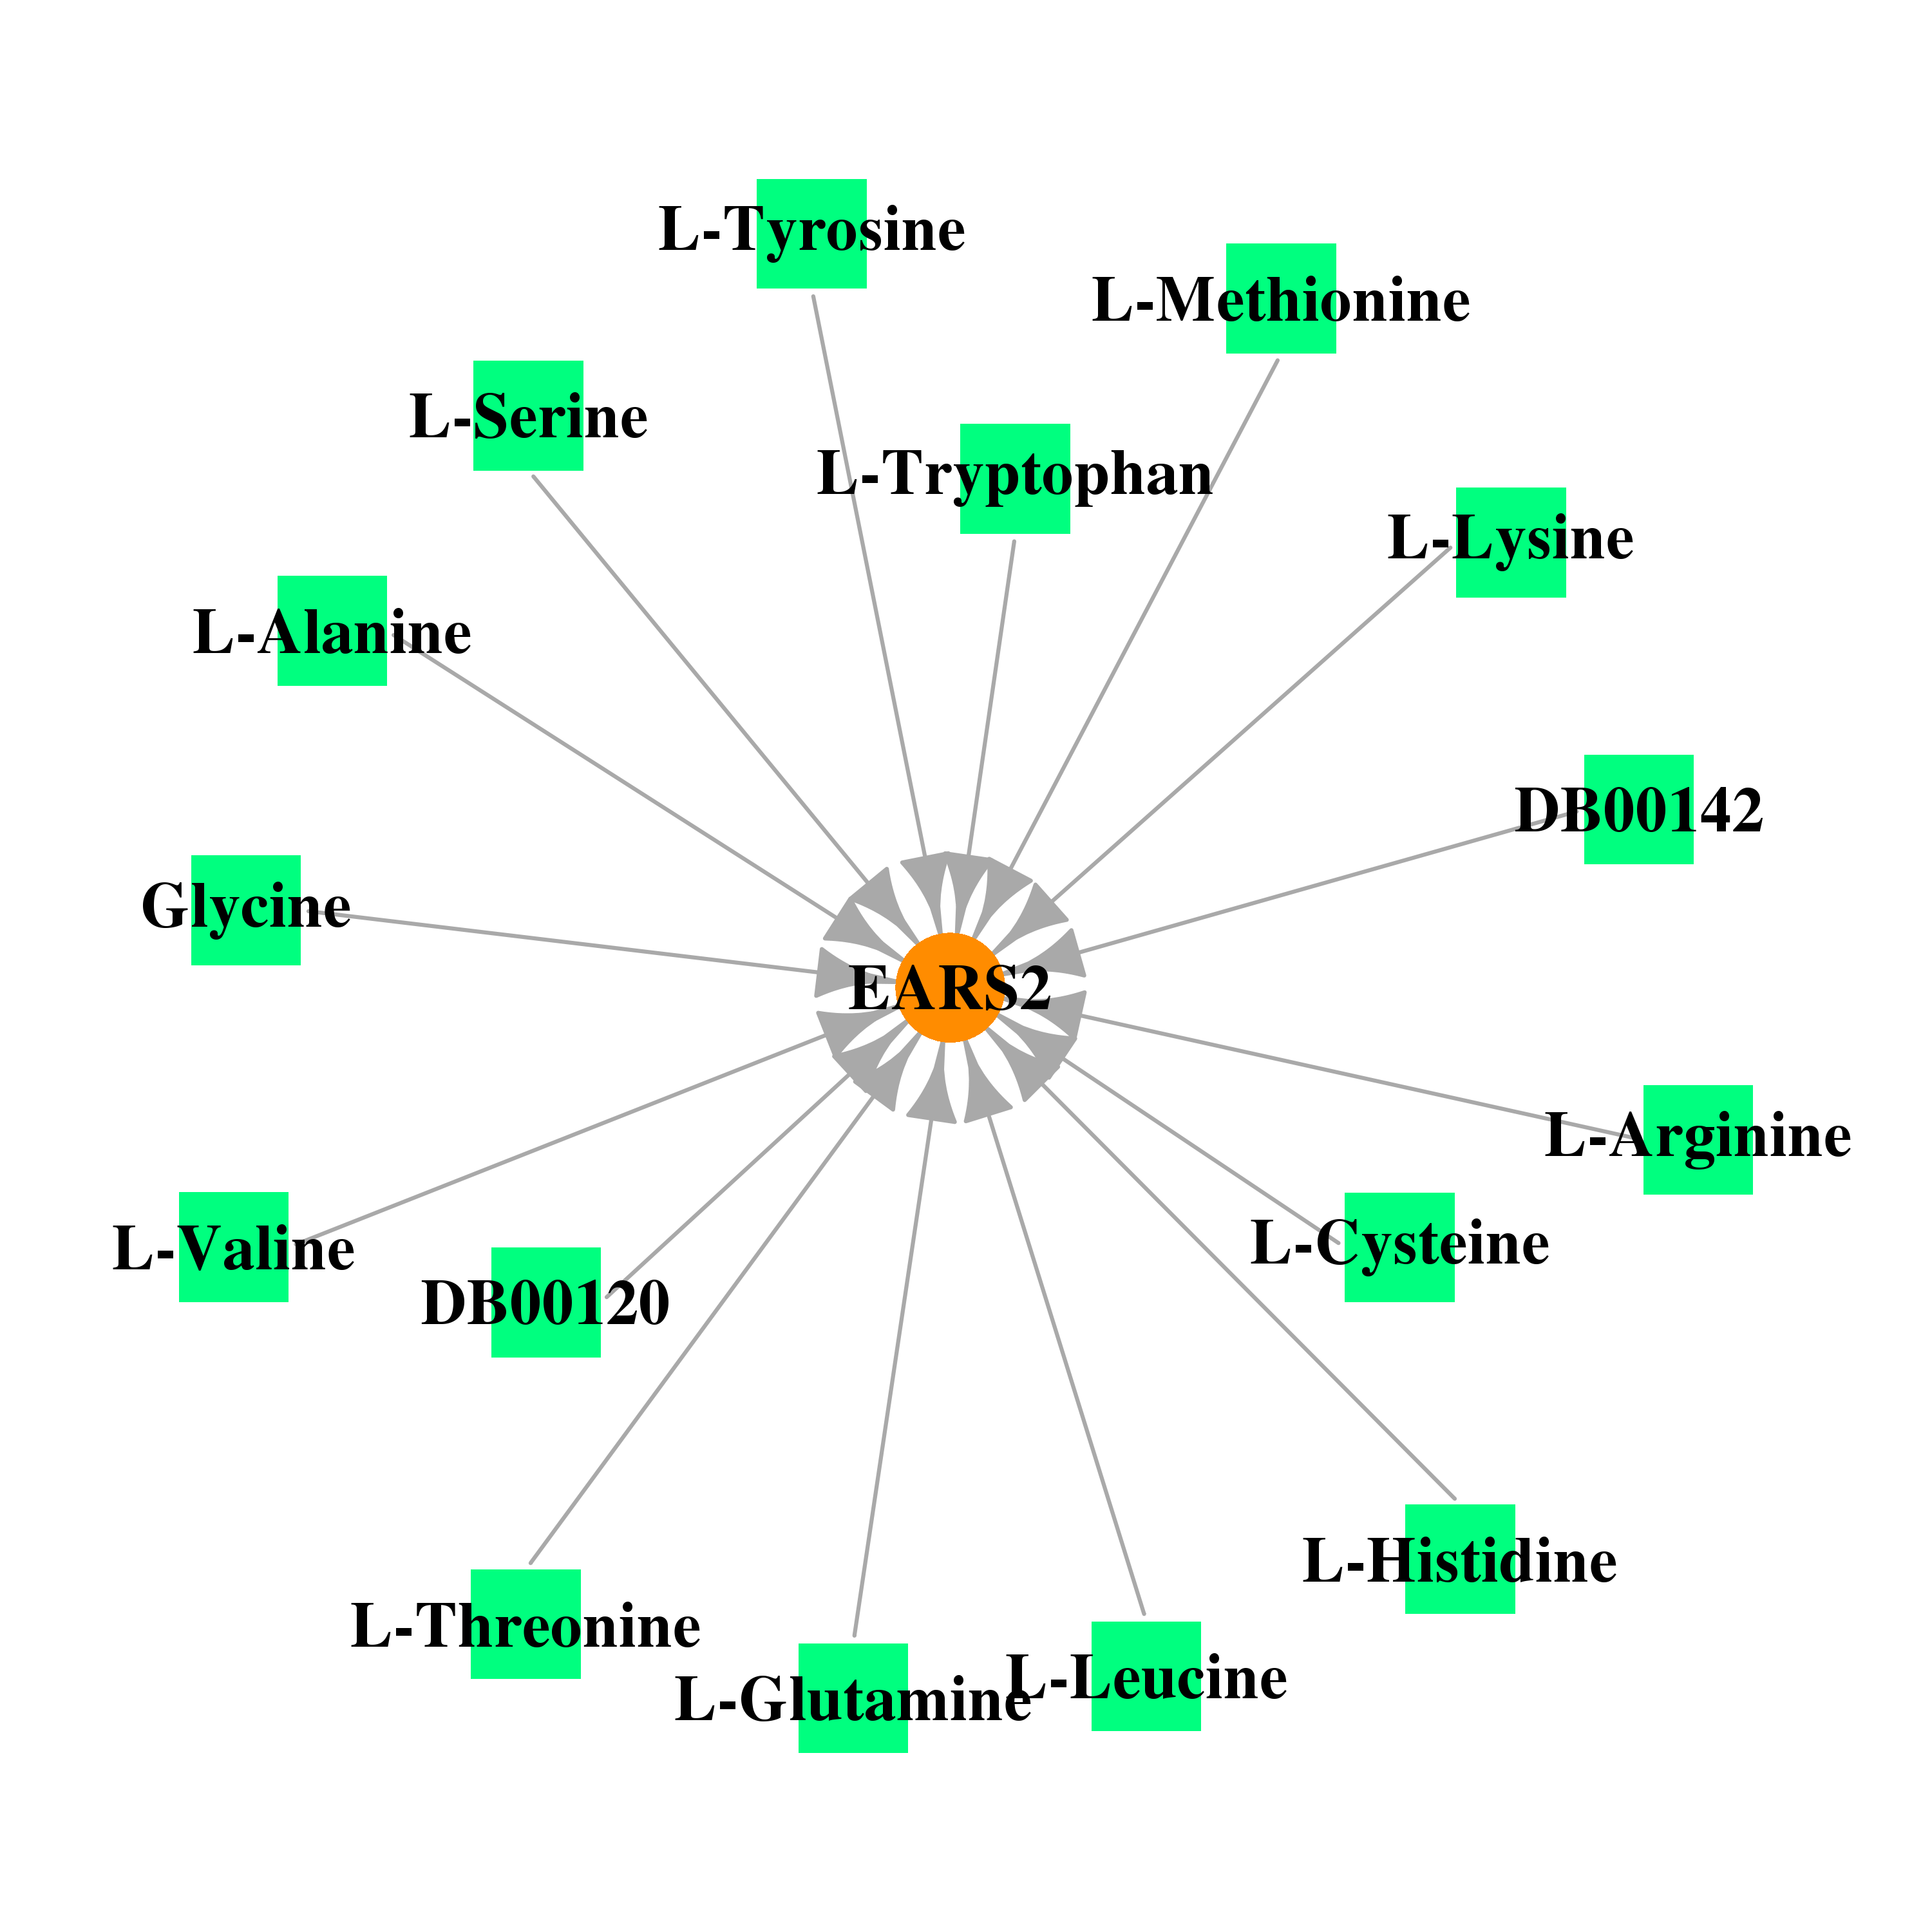 |
| * Drug Centered Interaction Network. |
| DrugBank ID | Target Name | Drug Groups | Generic Name | Drug Centered Network | Drug Structure |
| DB00142 | glutamyl-tRNA synthetase 2, mitochondrial | approved; nutraceutical | L-Glutamic Acid | 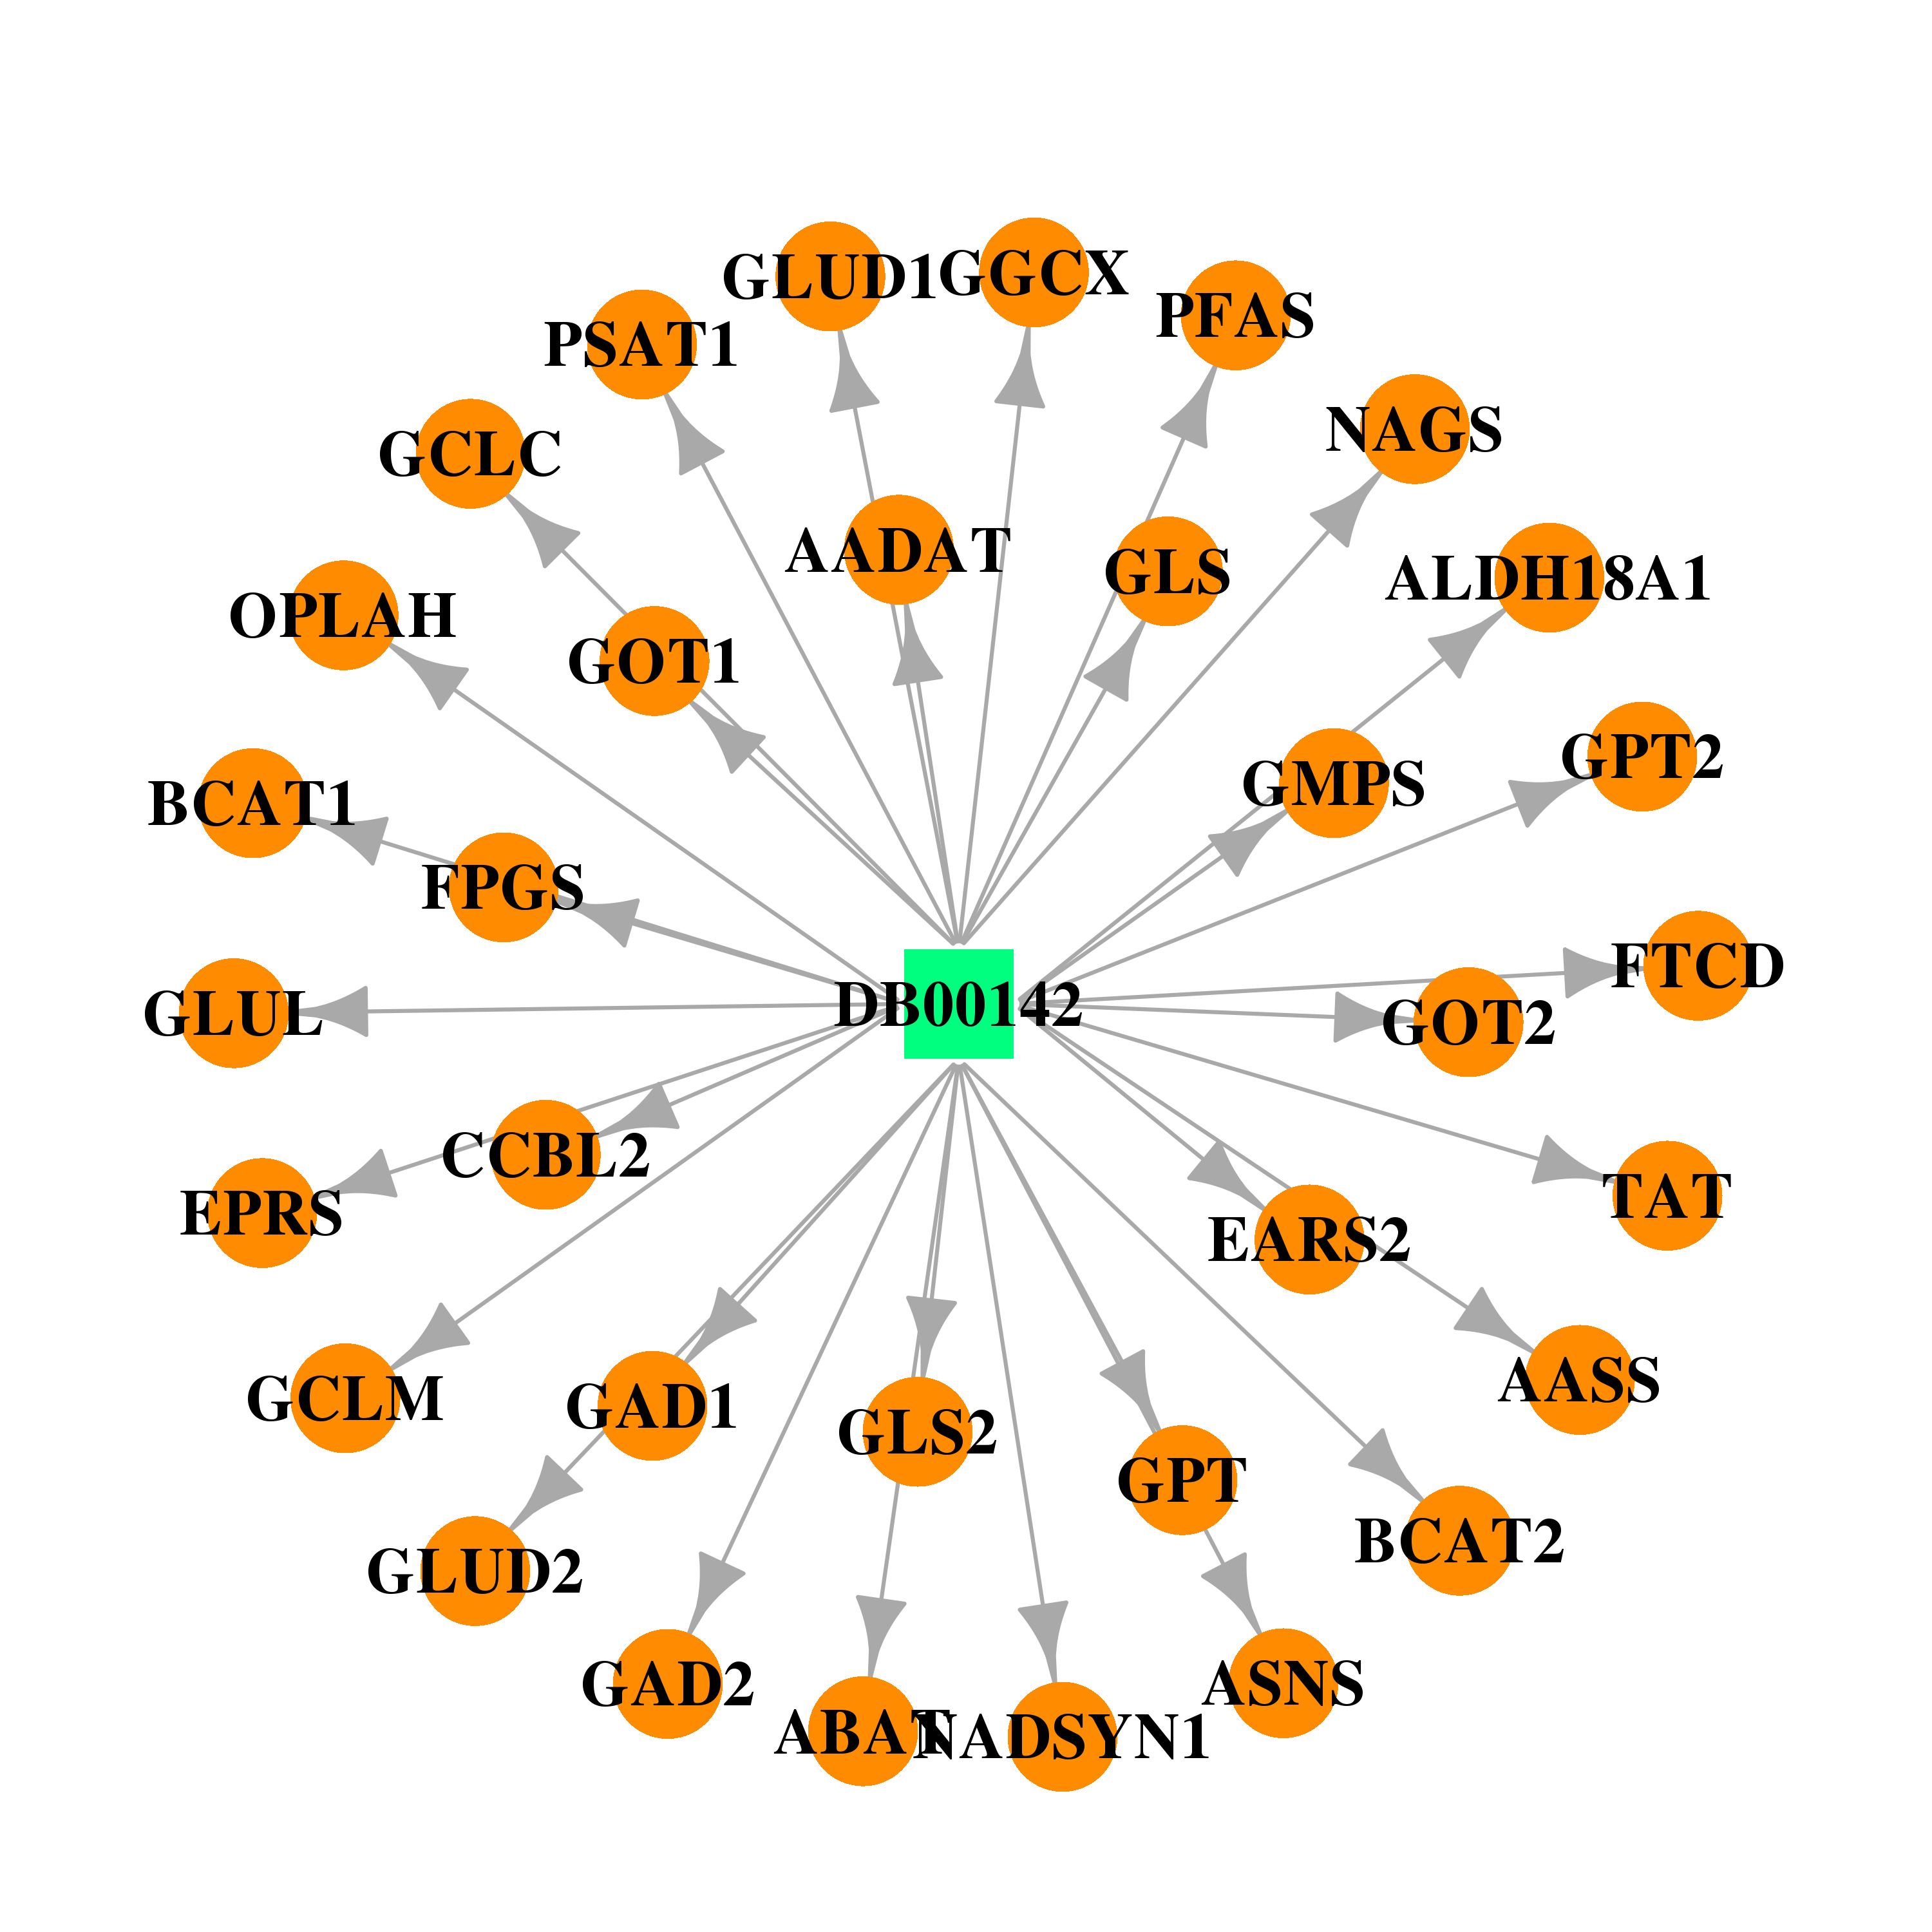 | 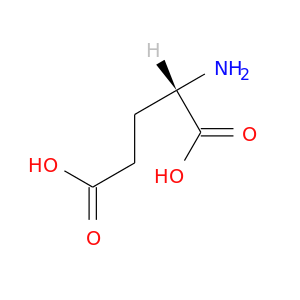 |
| DB00145 | glutamyl-tRNA synthetase 2, mitochondrial | approved; nutraceutical | Glycine |  |  |
| DB00160 | glutamyl-tRNA synthetase 2, mitochondrial | approved; nutraceutical | L-Alanine |  | 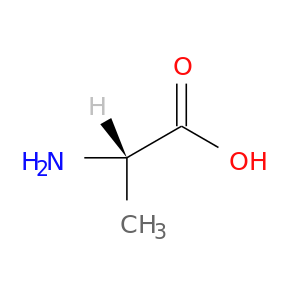 |
| DB00125 | glutamyl-tRNA synthetase 2, mitochondrial | approved; nutraceutical | L-Arginine |  |  |
| DB00151 | glutamyl-tRNA synthetase 2, mitochondrial | approved; nutraceutical | L-Cysteine | 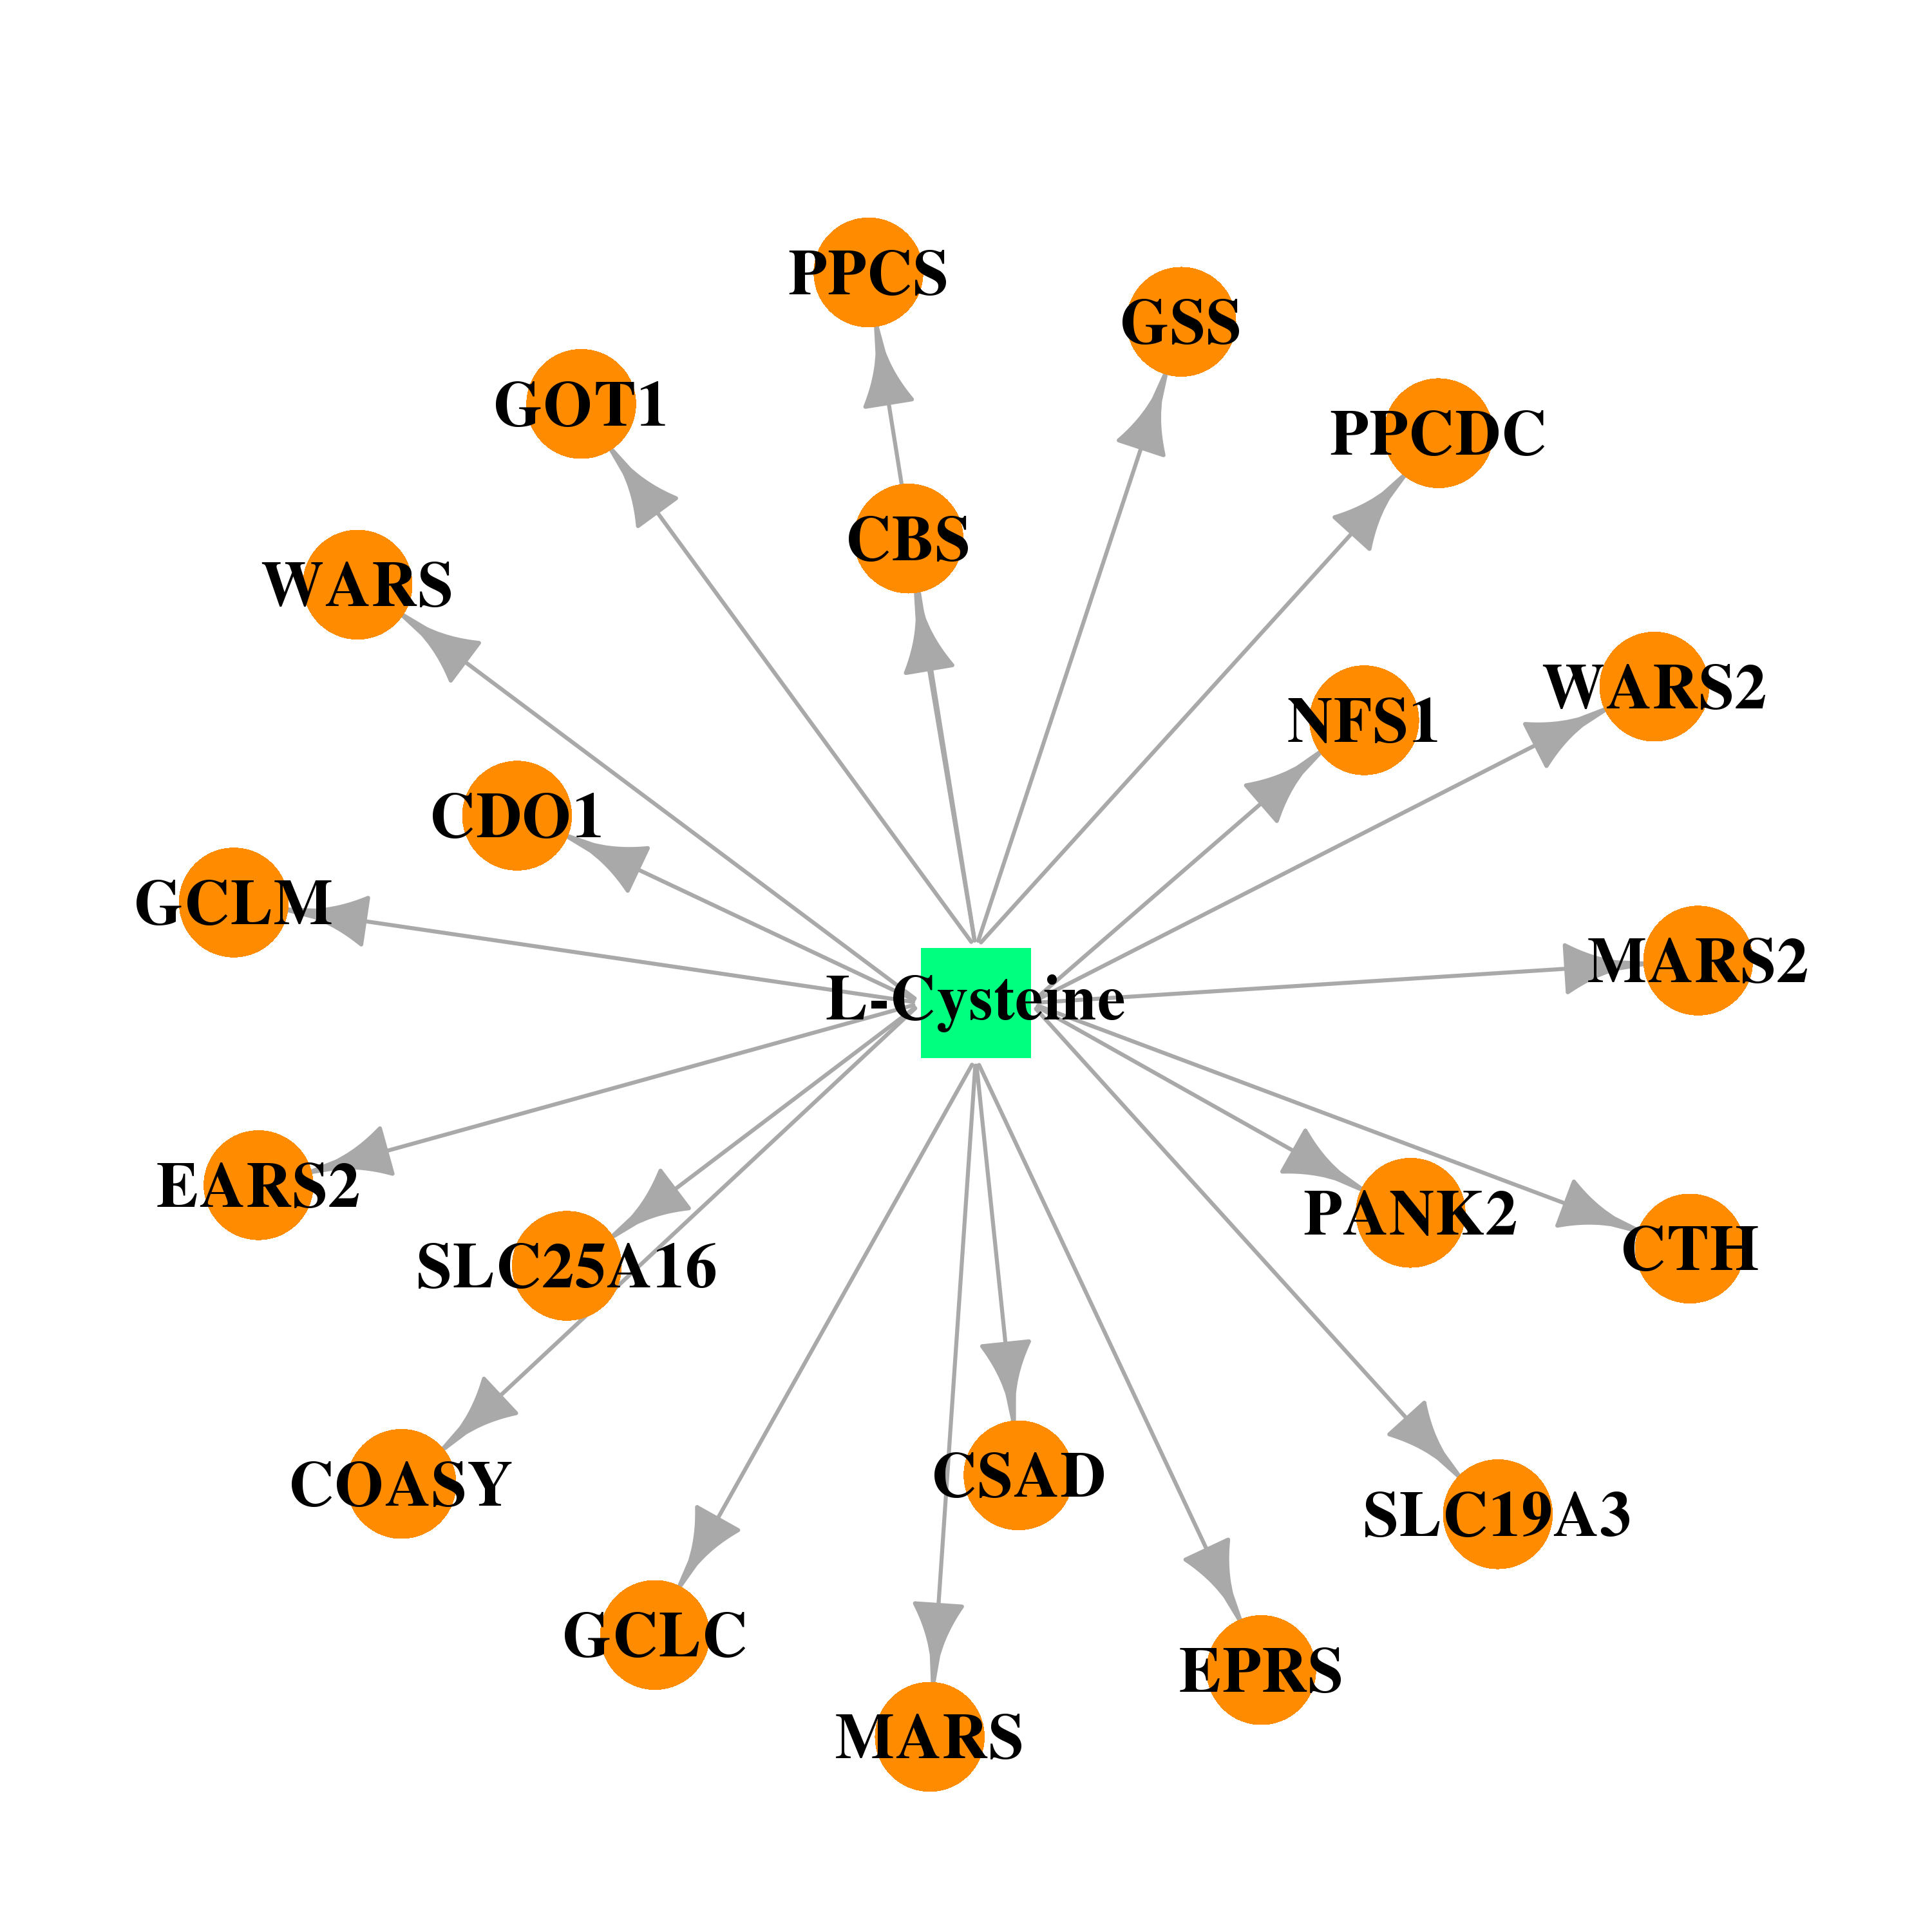 | 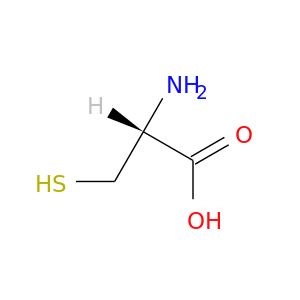 |
| DB00130 | glutamyl-tRNA synthetase 2, mitochondrial | approved; nutraceutical; investigational | L-Glutamine |  |  |
| DB00117 | glutamyl-tRNA synthetase 2, mitochondrial | approved; nutraceutical | L-Histidine | 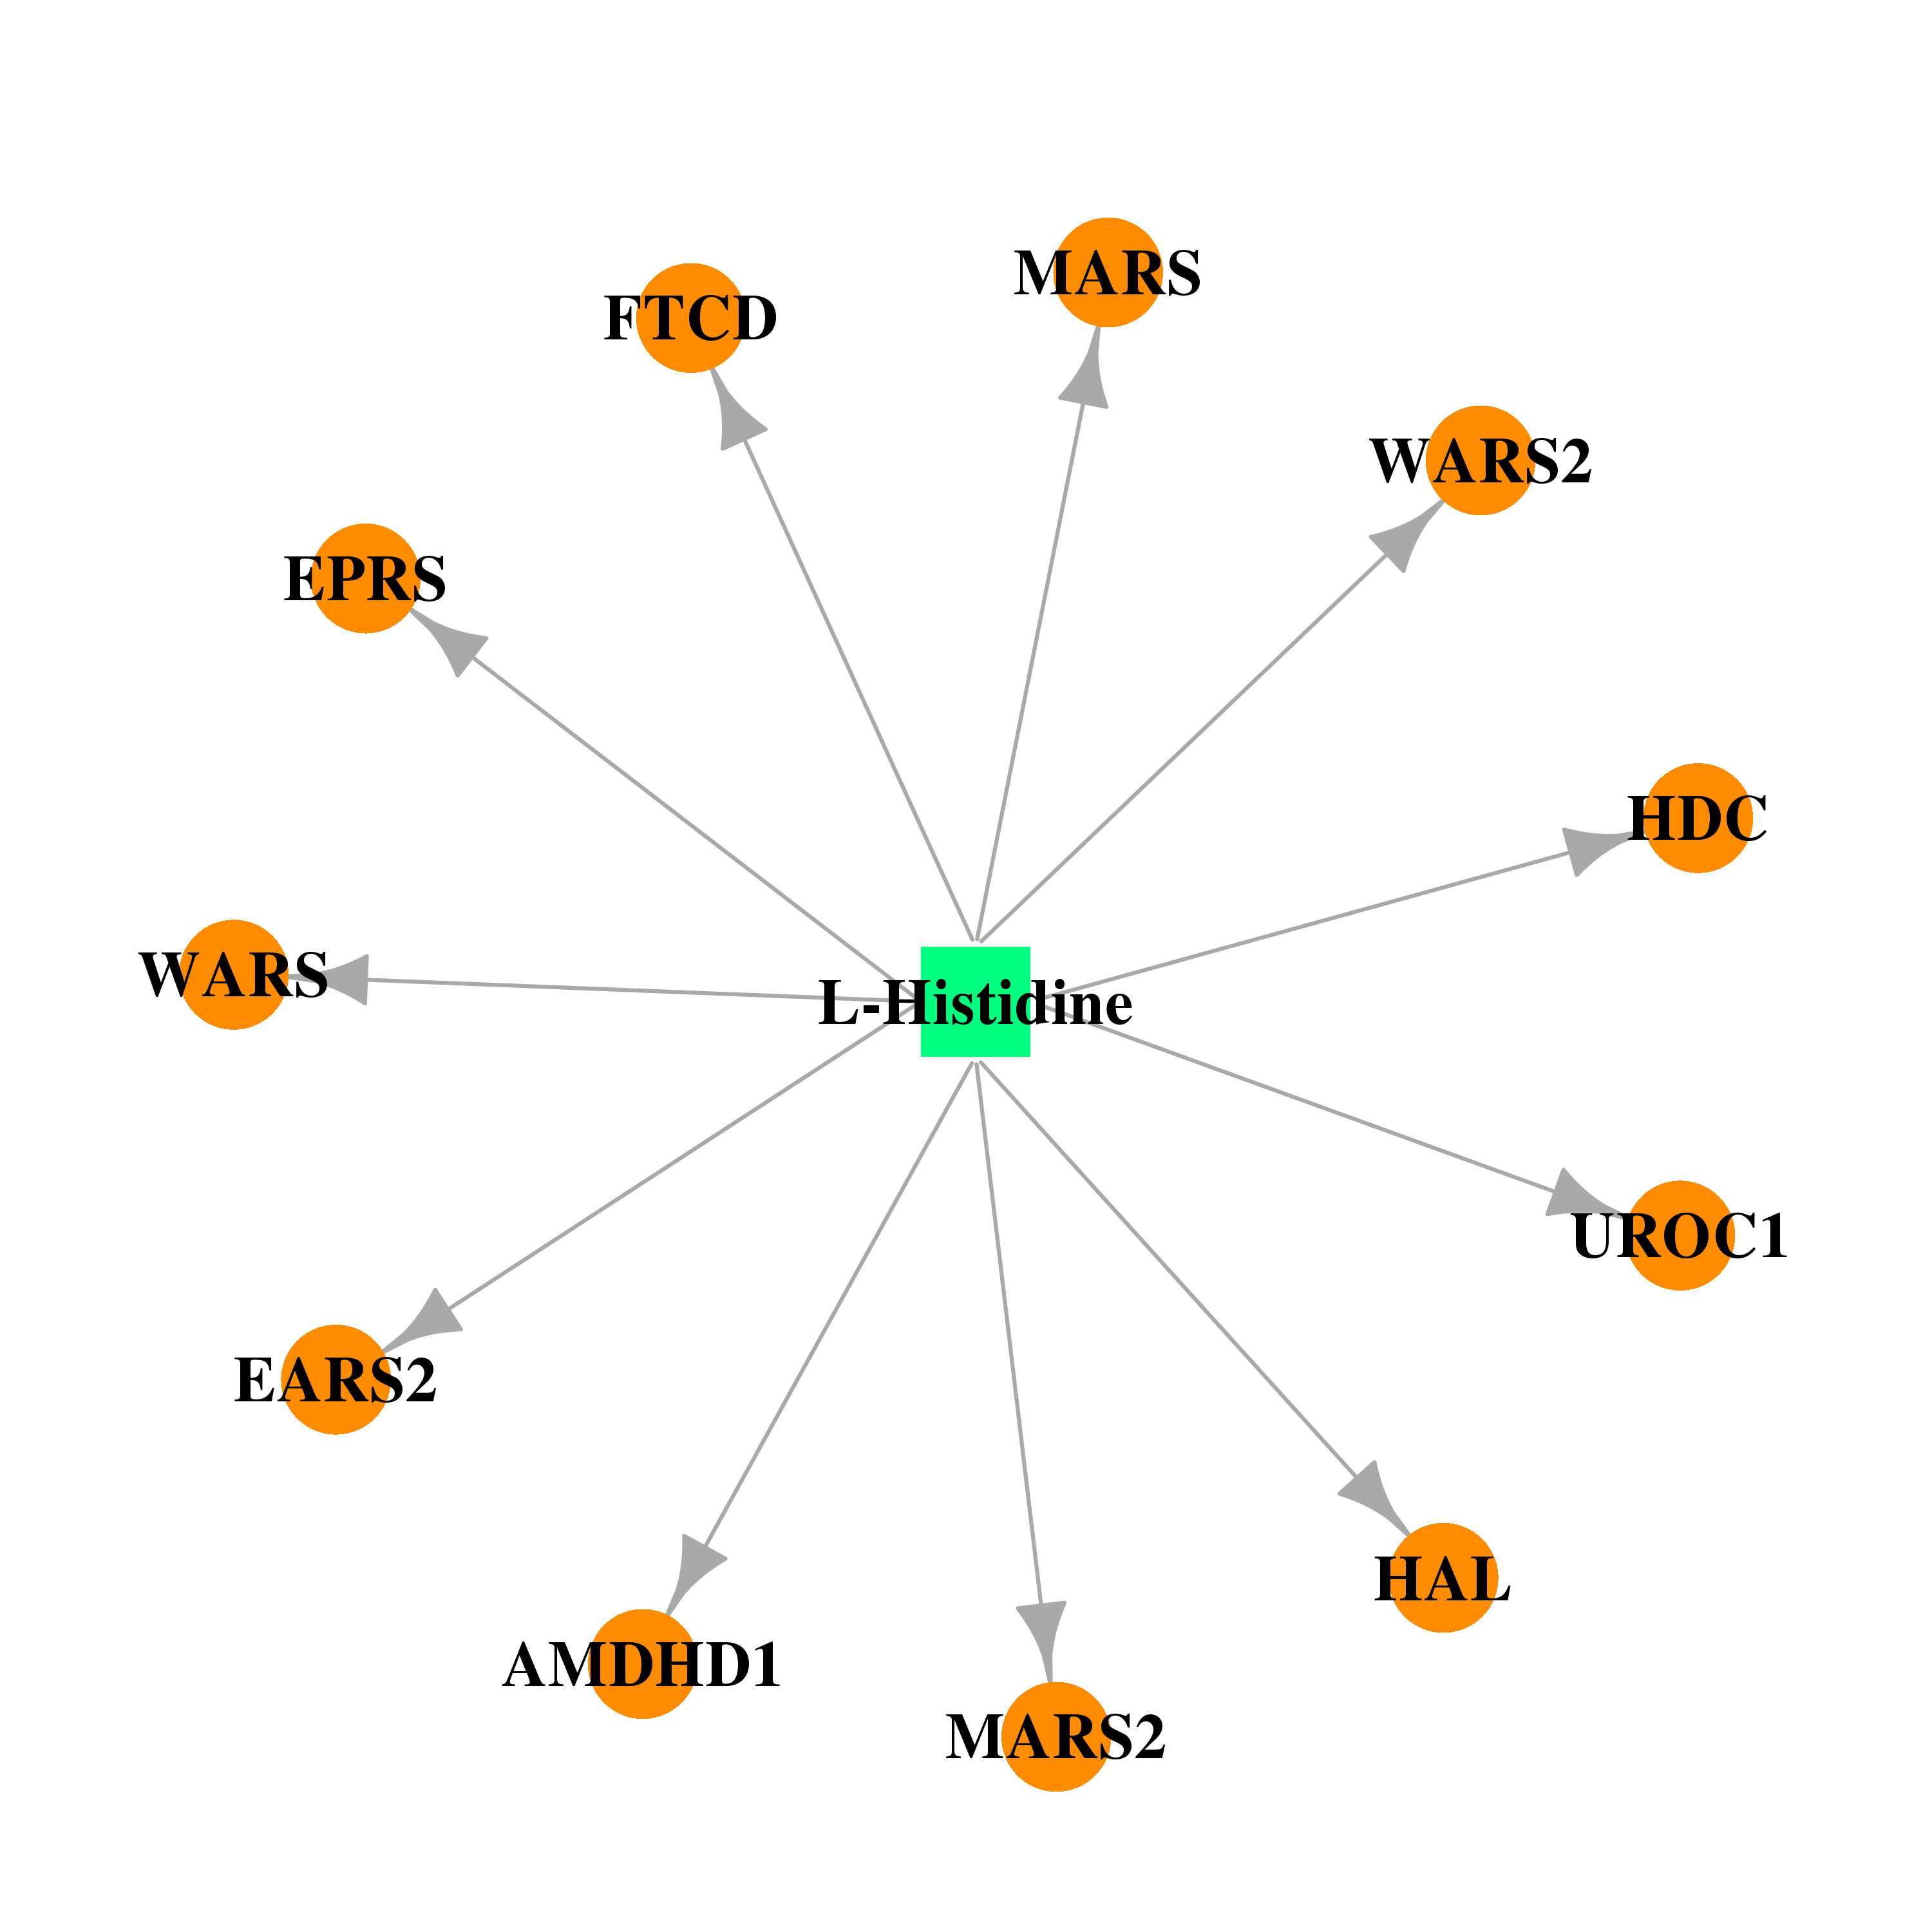 | 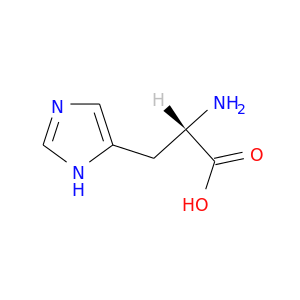 |
| DB00149 | glutamyl-tRNA synthetase 2, mitochondrial | approved; nutraceutical | L-Leucine | 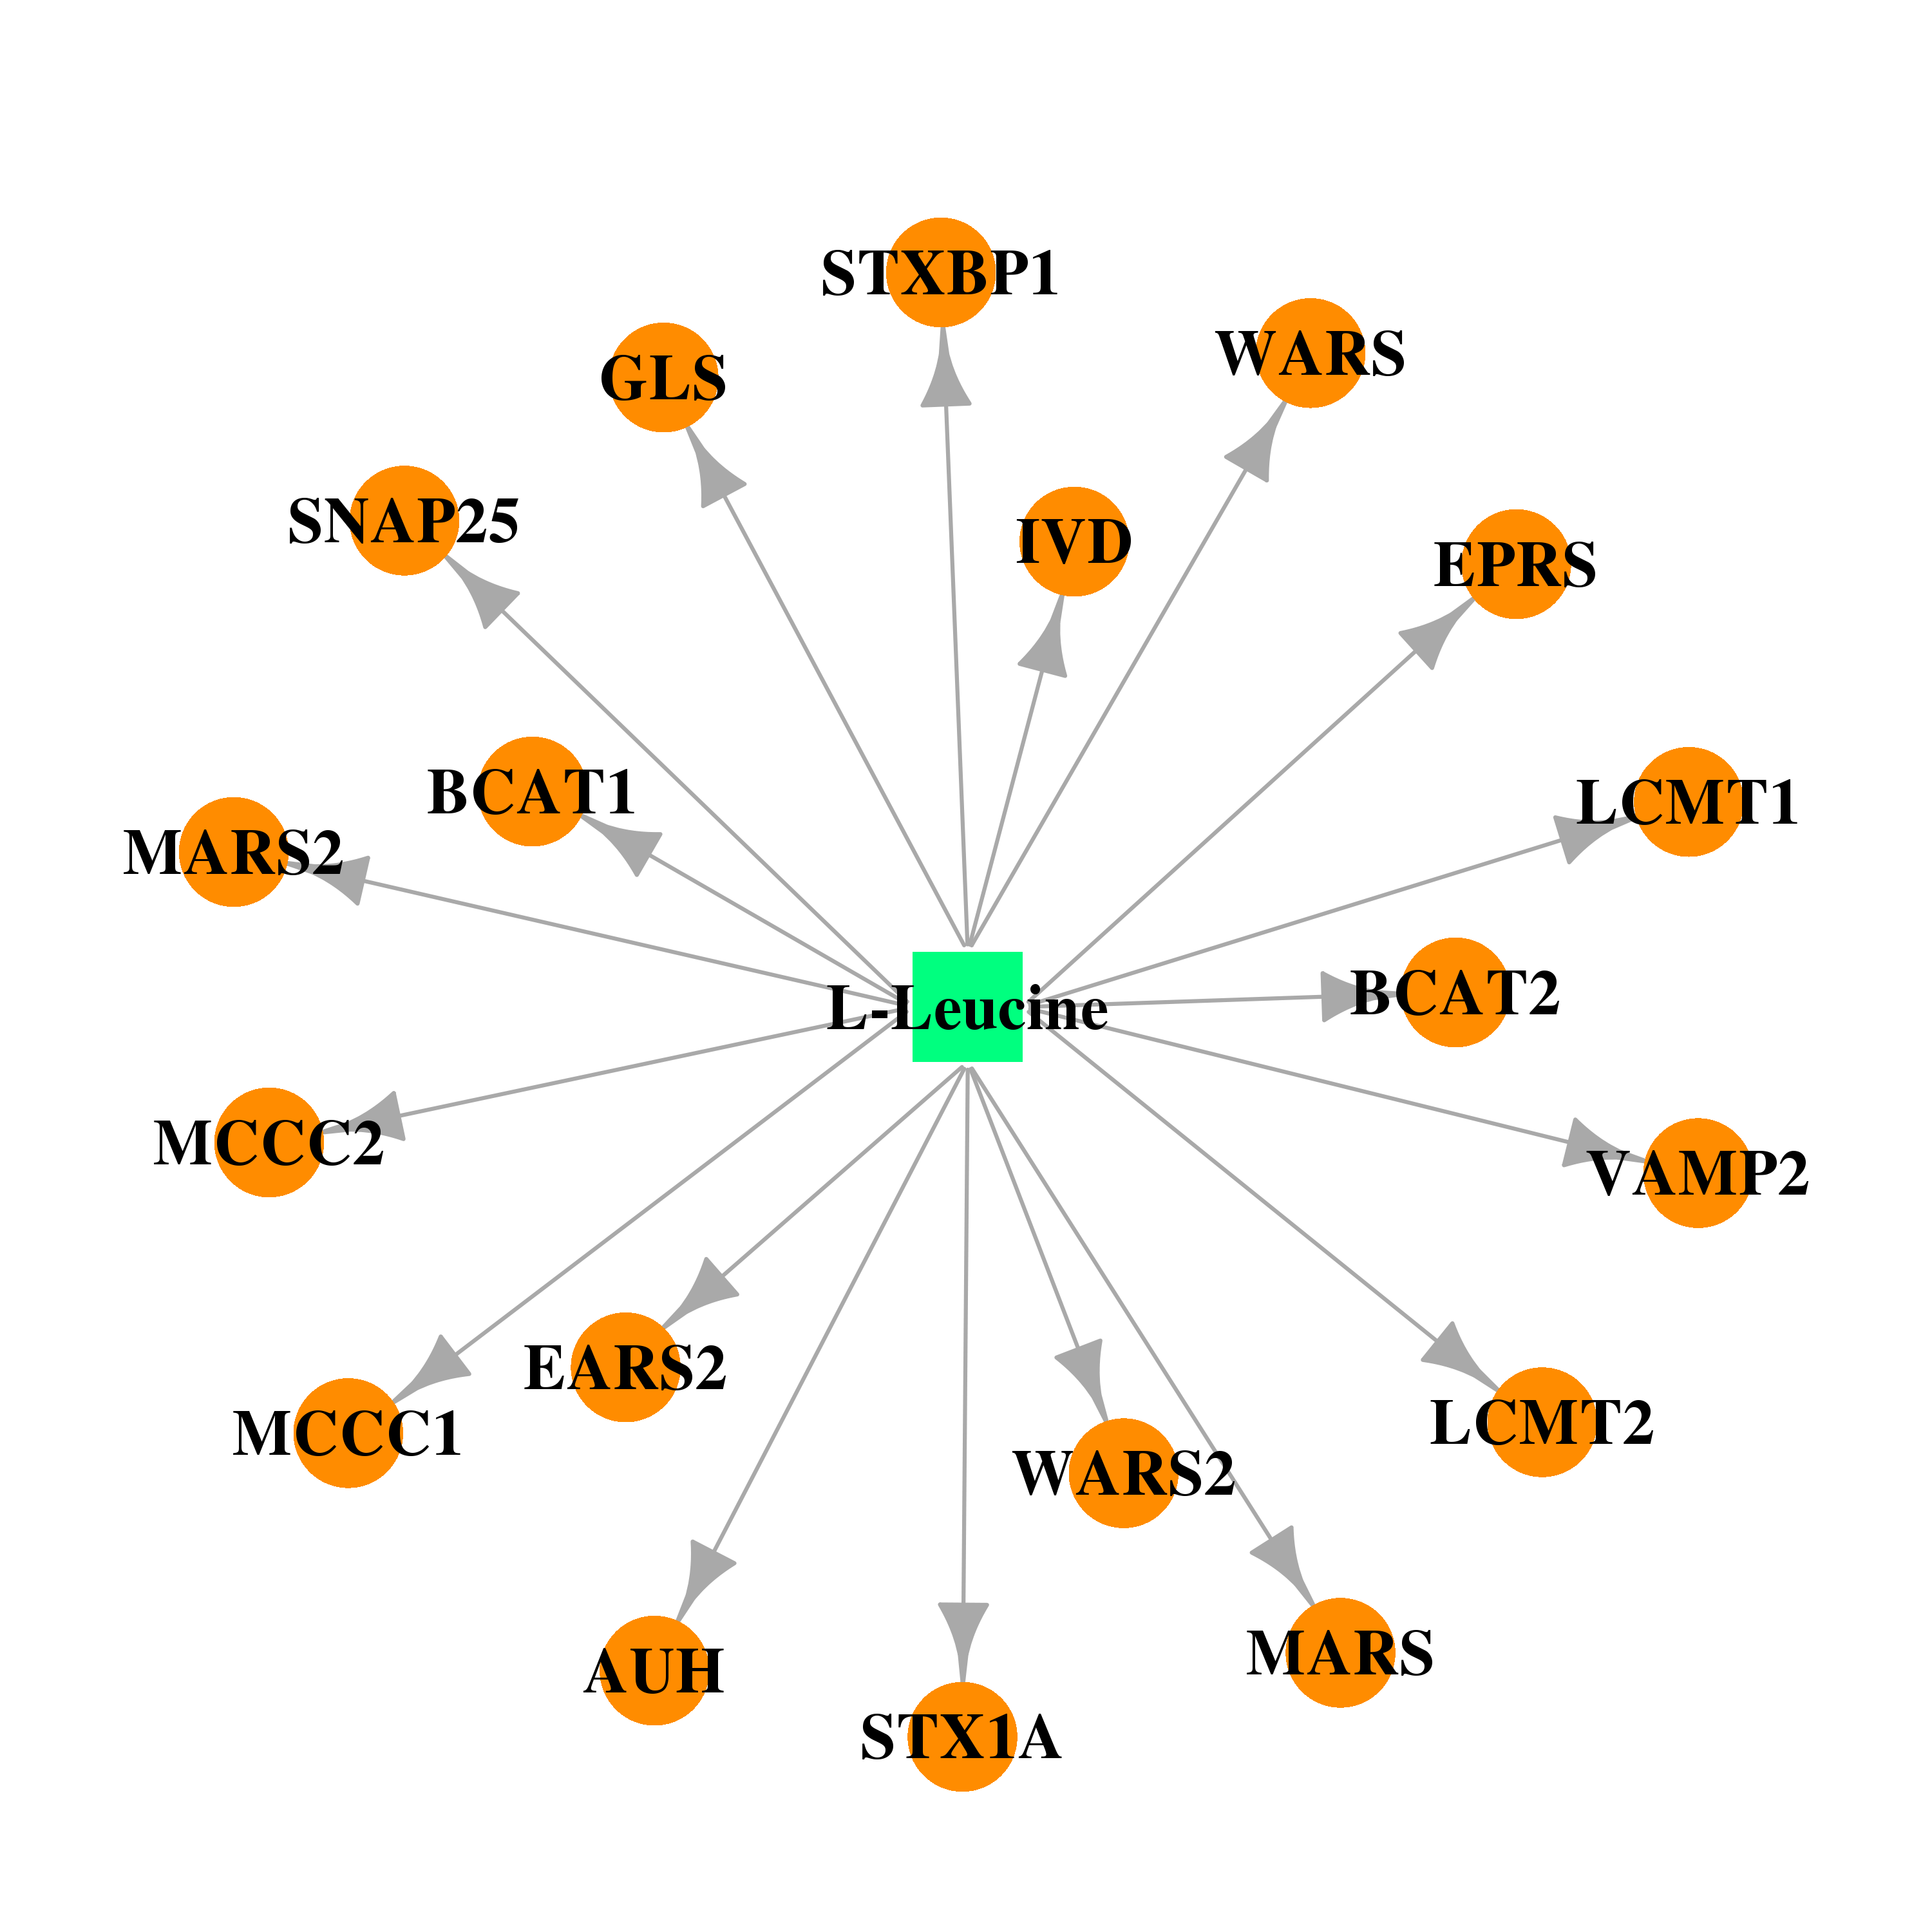 |  |
| DB00123 | glutamyl-tRNA synthetase 2, mitochondrial | approved; nutraceutical | L-Lysine | 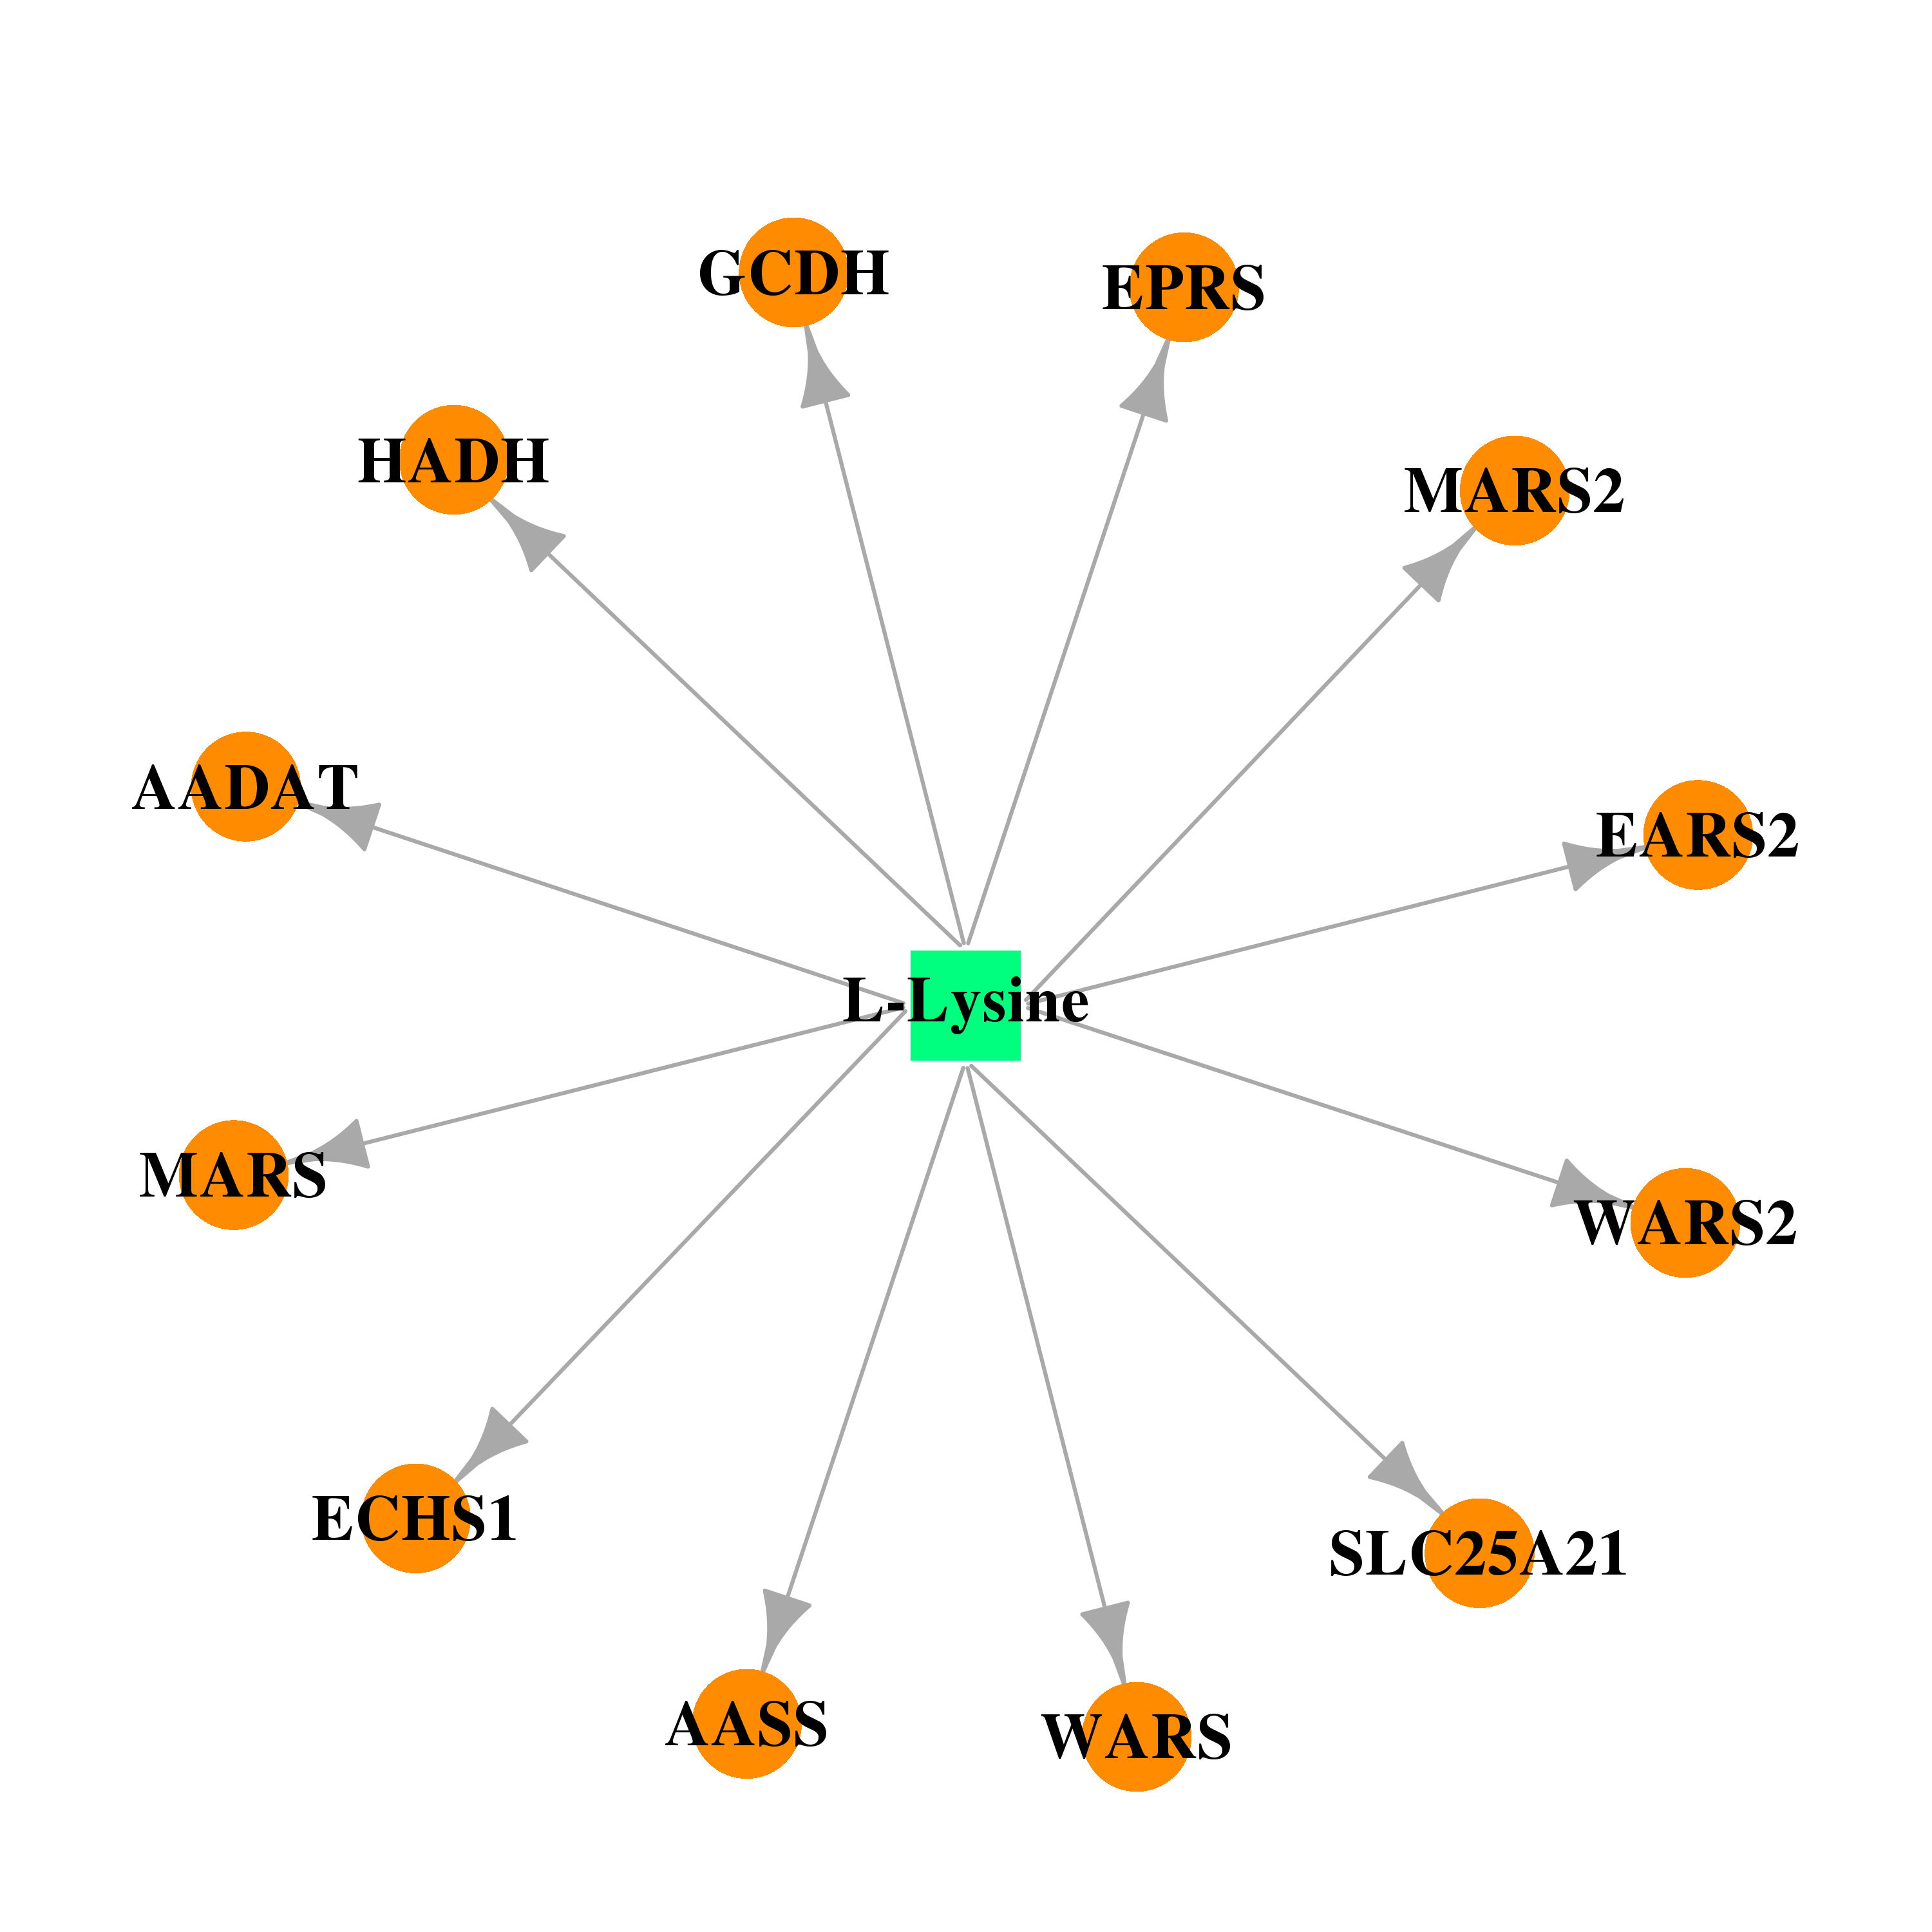 | 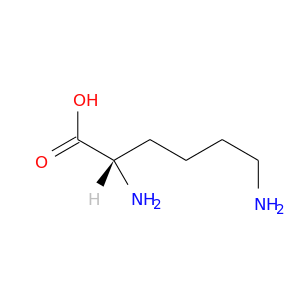 |
| DB00134 | glutamyl-tRNA synthetase 2, mitochondrial | approved; nutraceutical | L-Methionine |  |  |
| DB00120 | glutamyl-tRNA synthetase 2, mitochondrial | approved; nutraceutical | L-Phenylalanine | 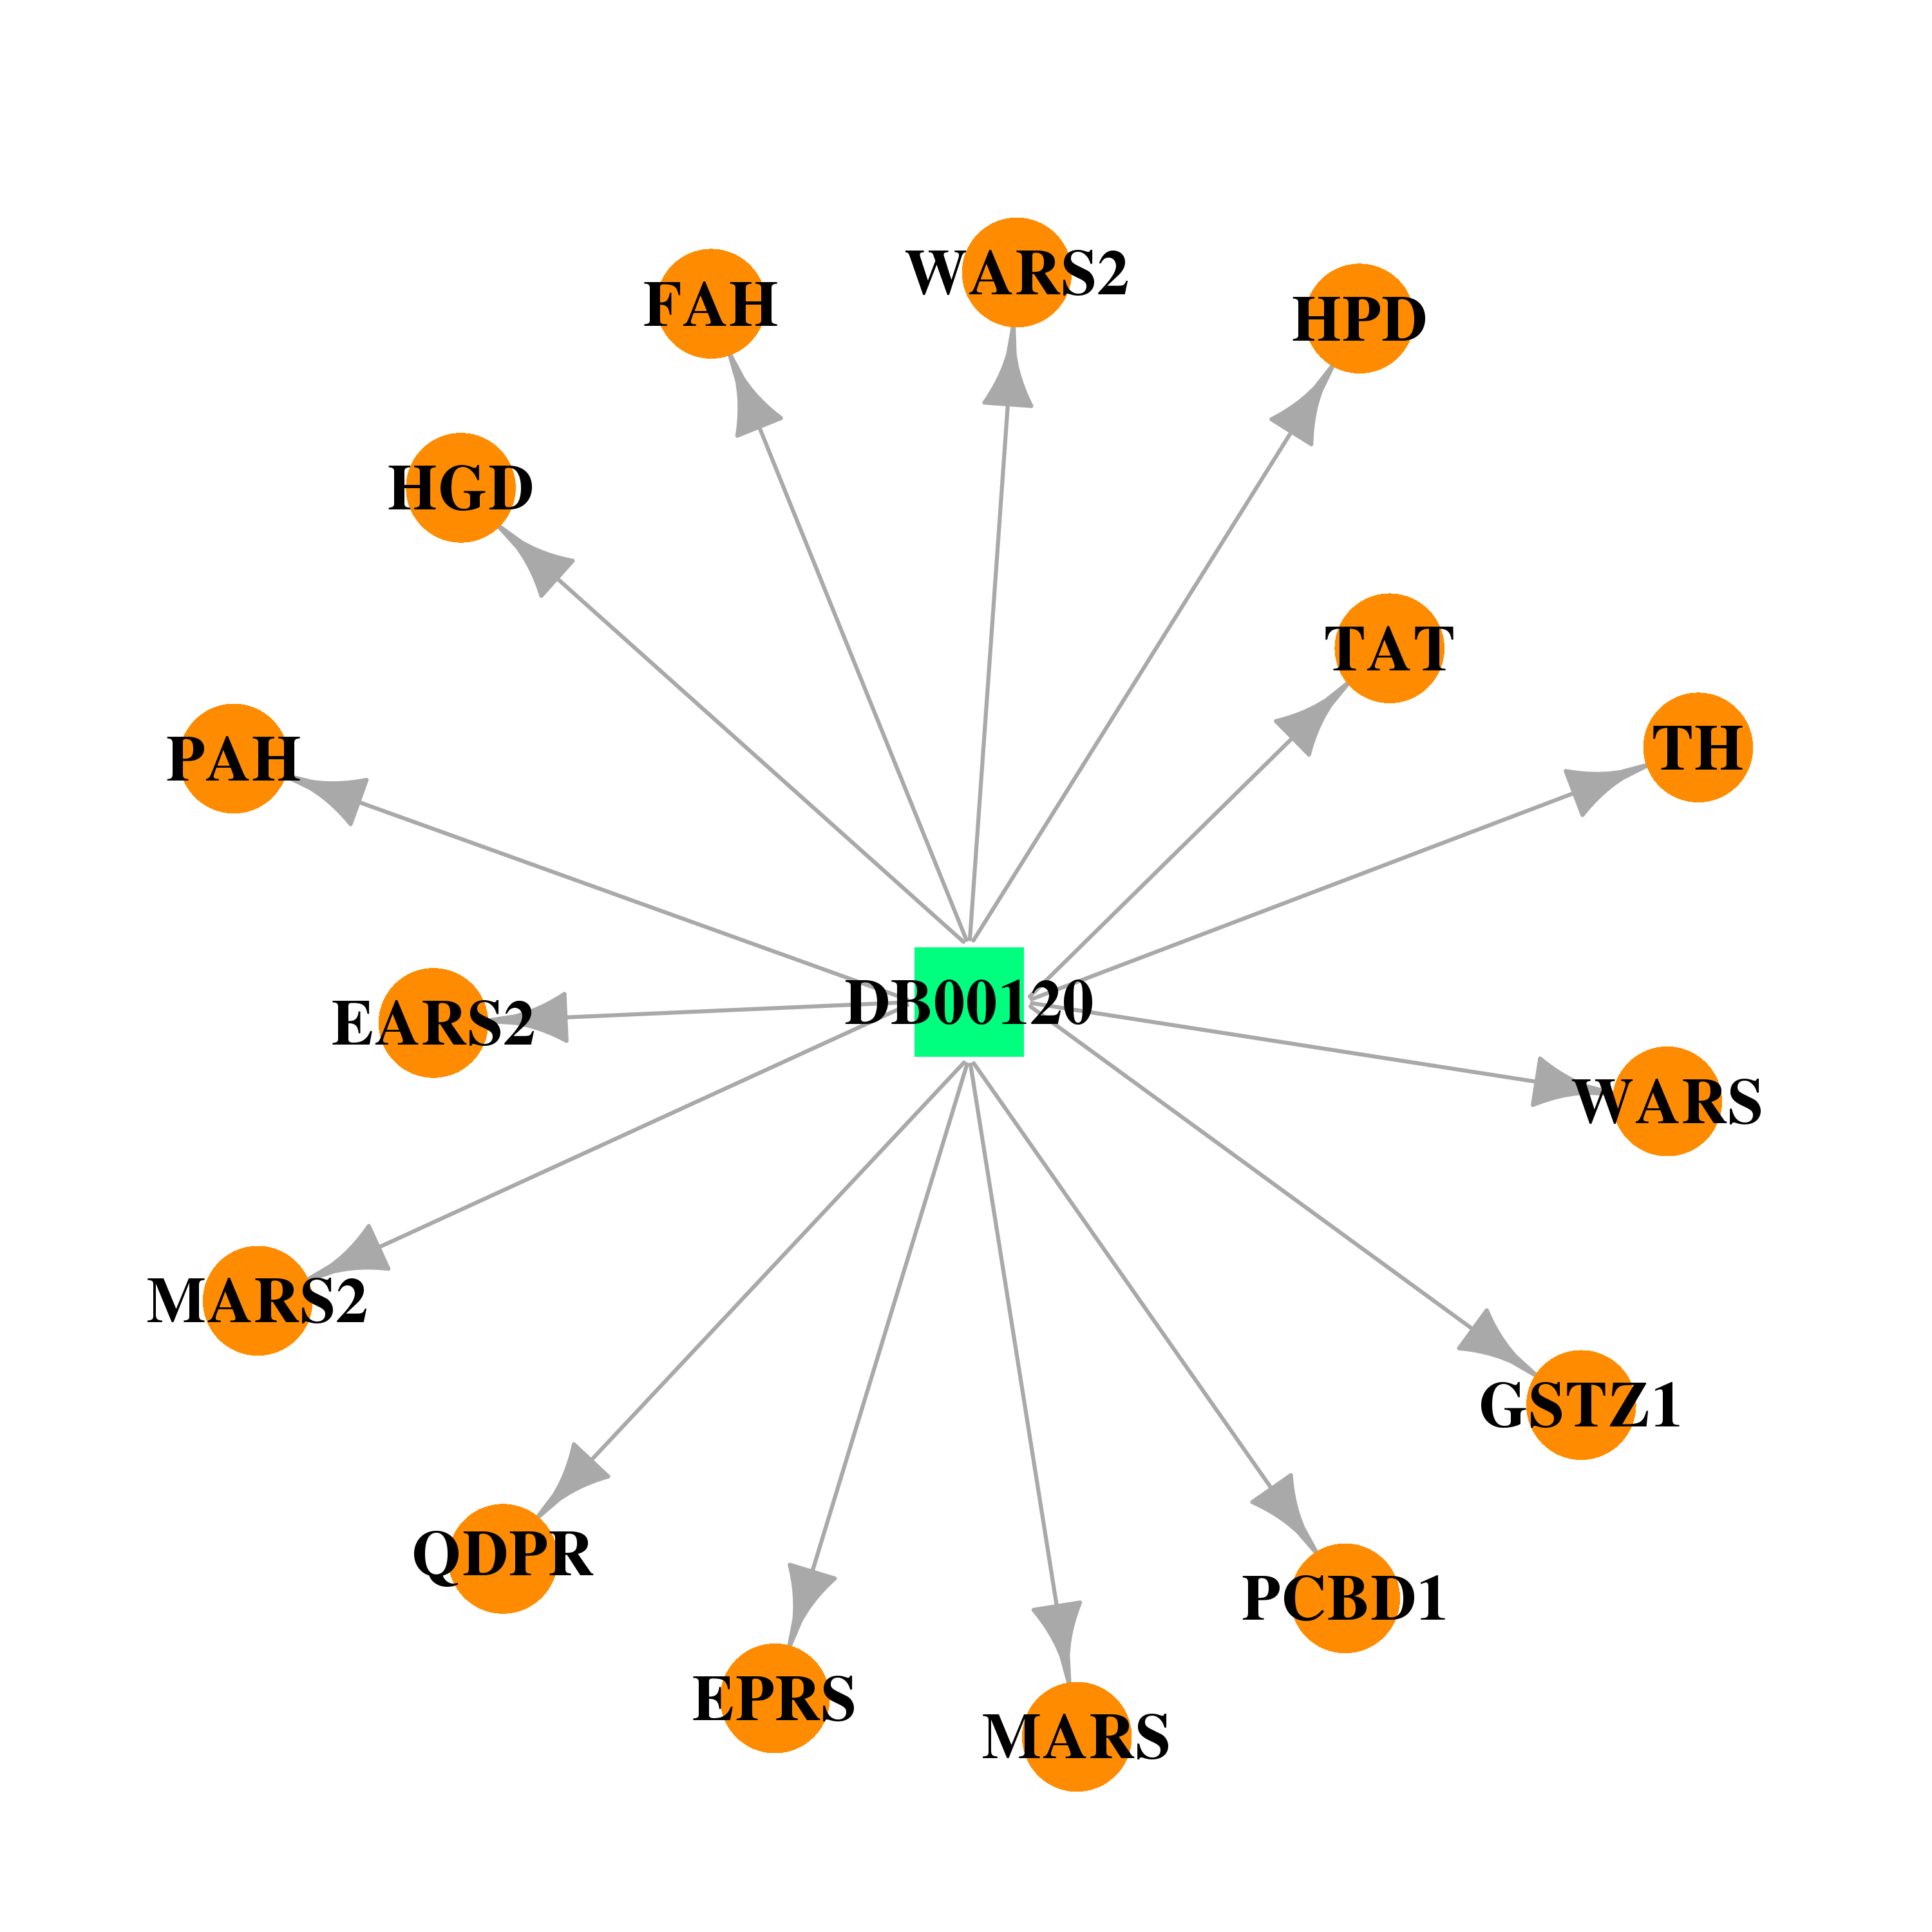 |  |
| DB00133 | glutamyl-tRNA synthetase 2, mitochondrial | approved; nutraceutical | L-Serine | 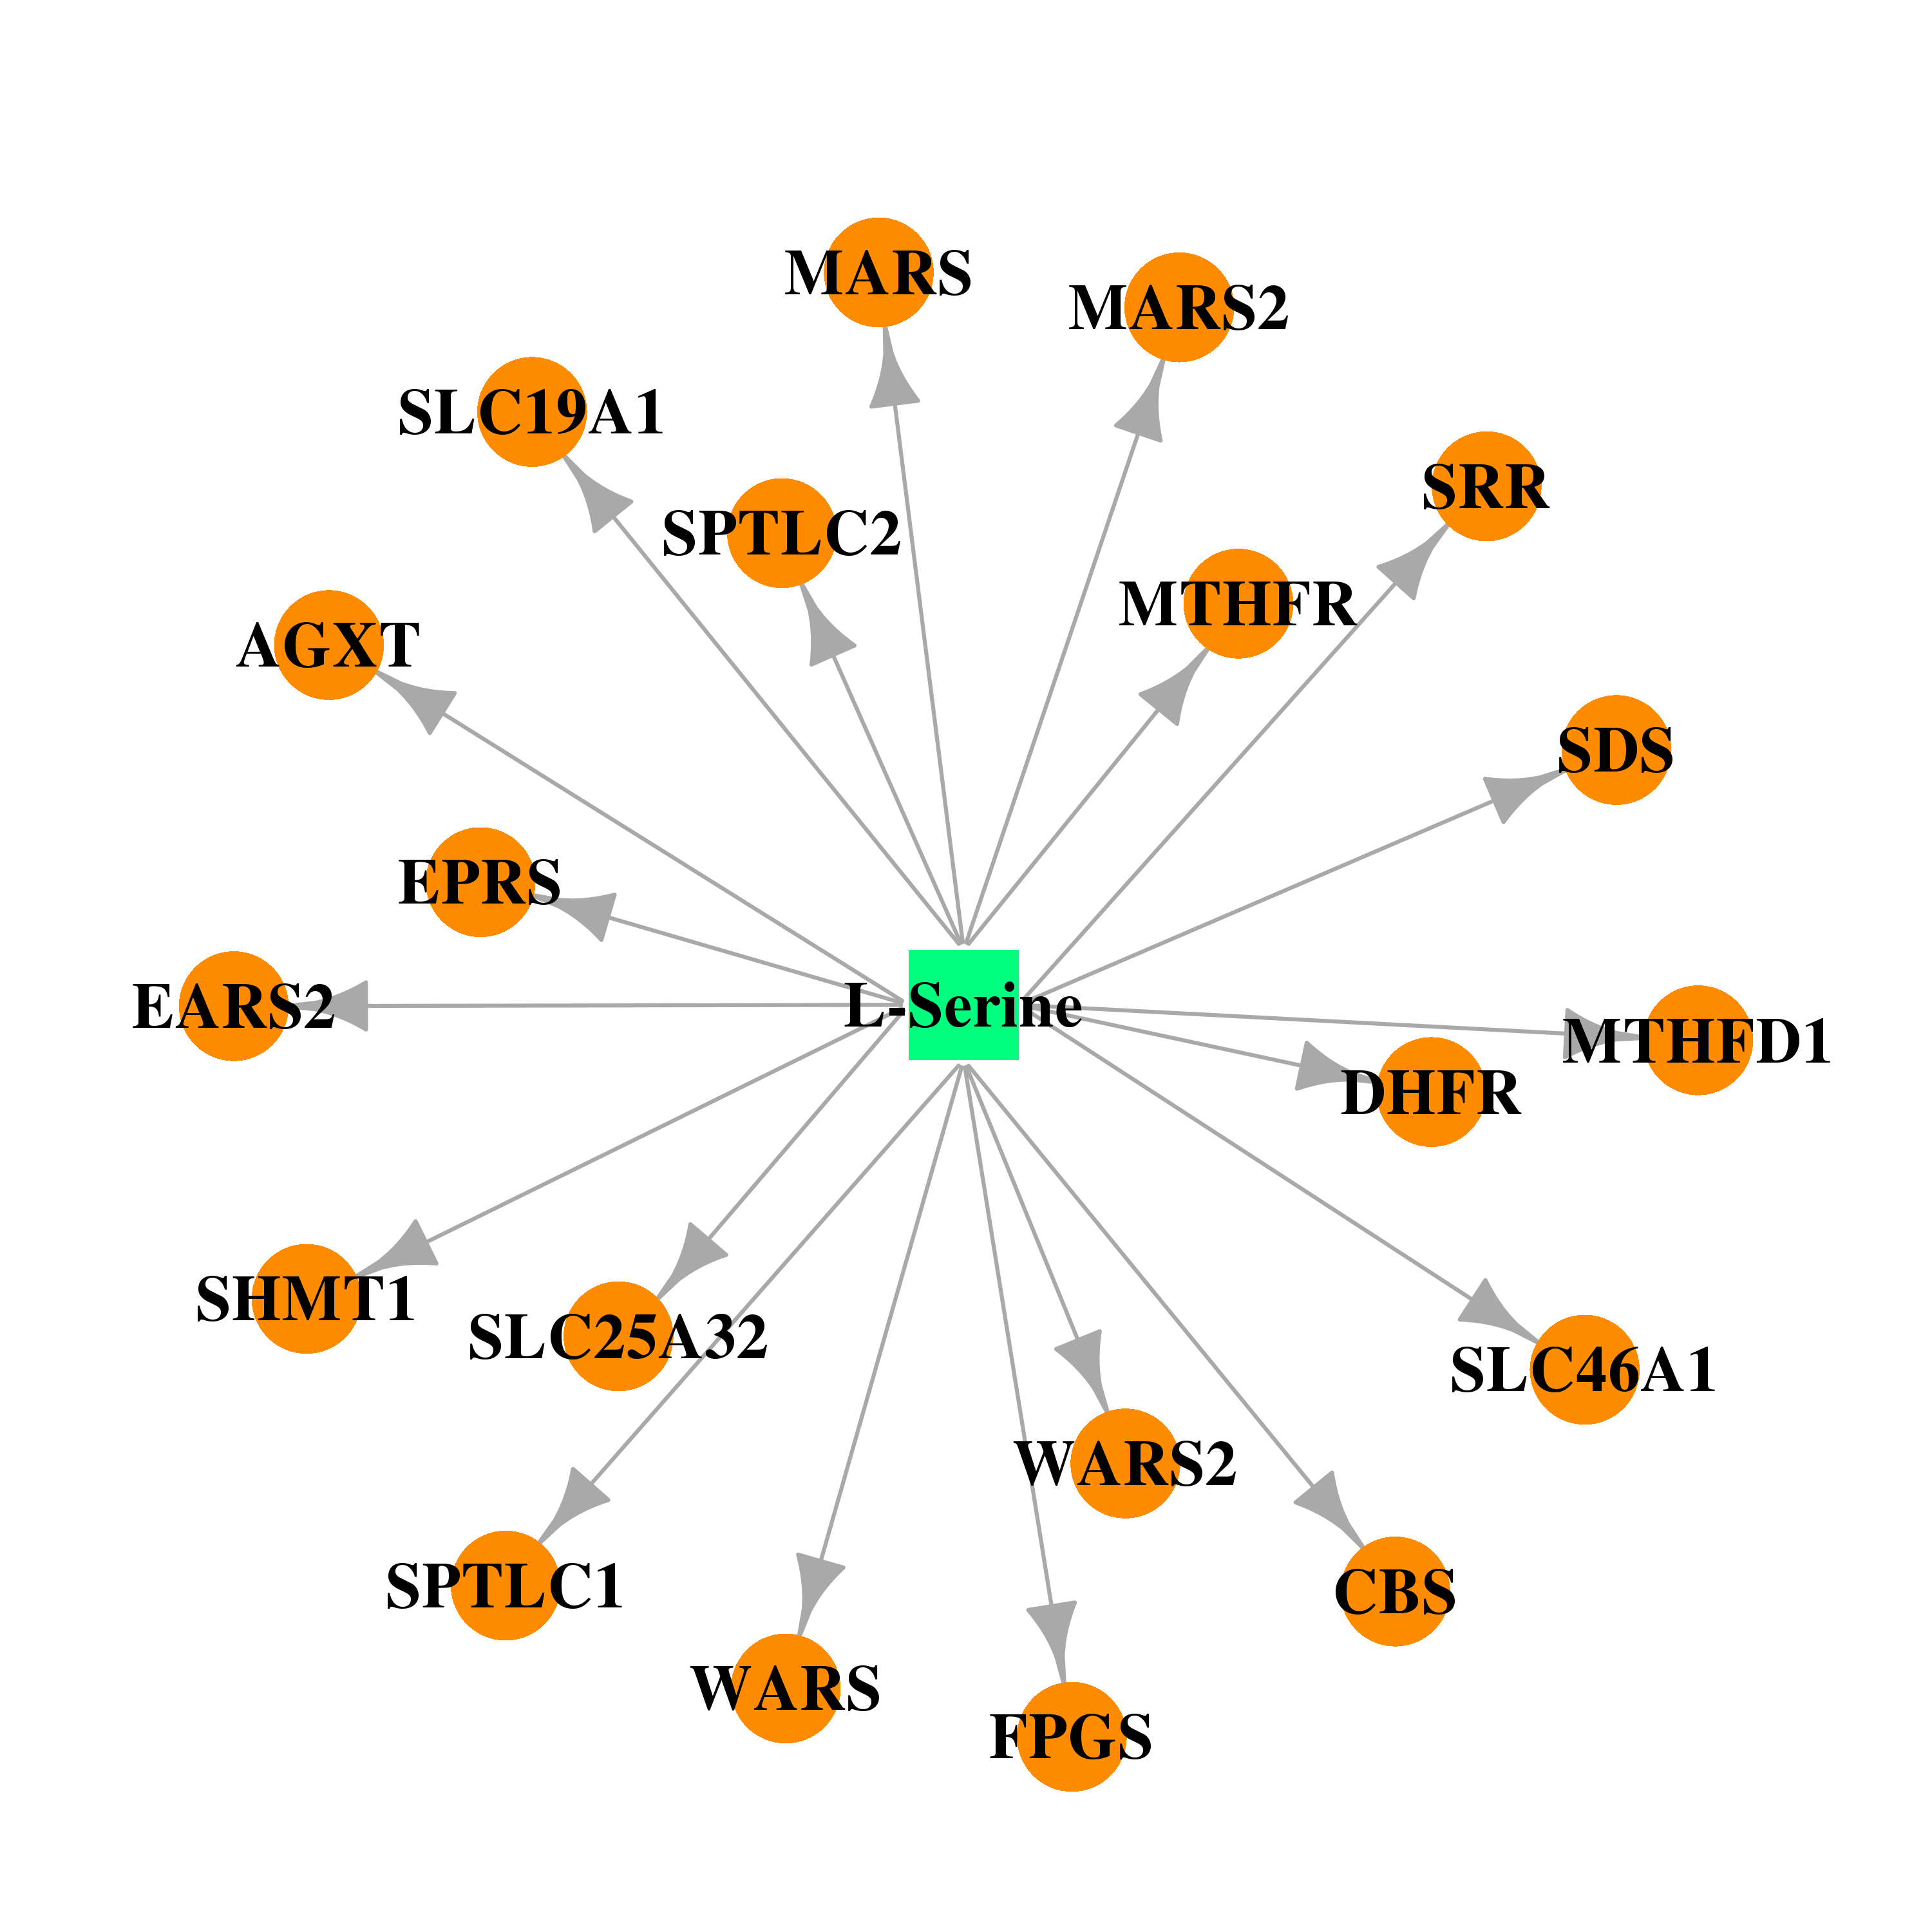 |  |
| DB00156 | glutamyl-tRNA synthetase 2, mitochondrial | approved; nutraceutical | L-Threonine | 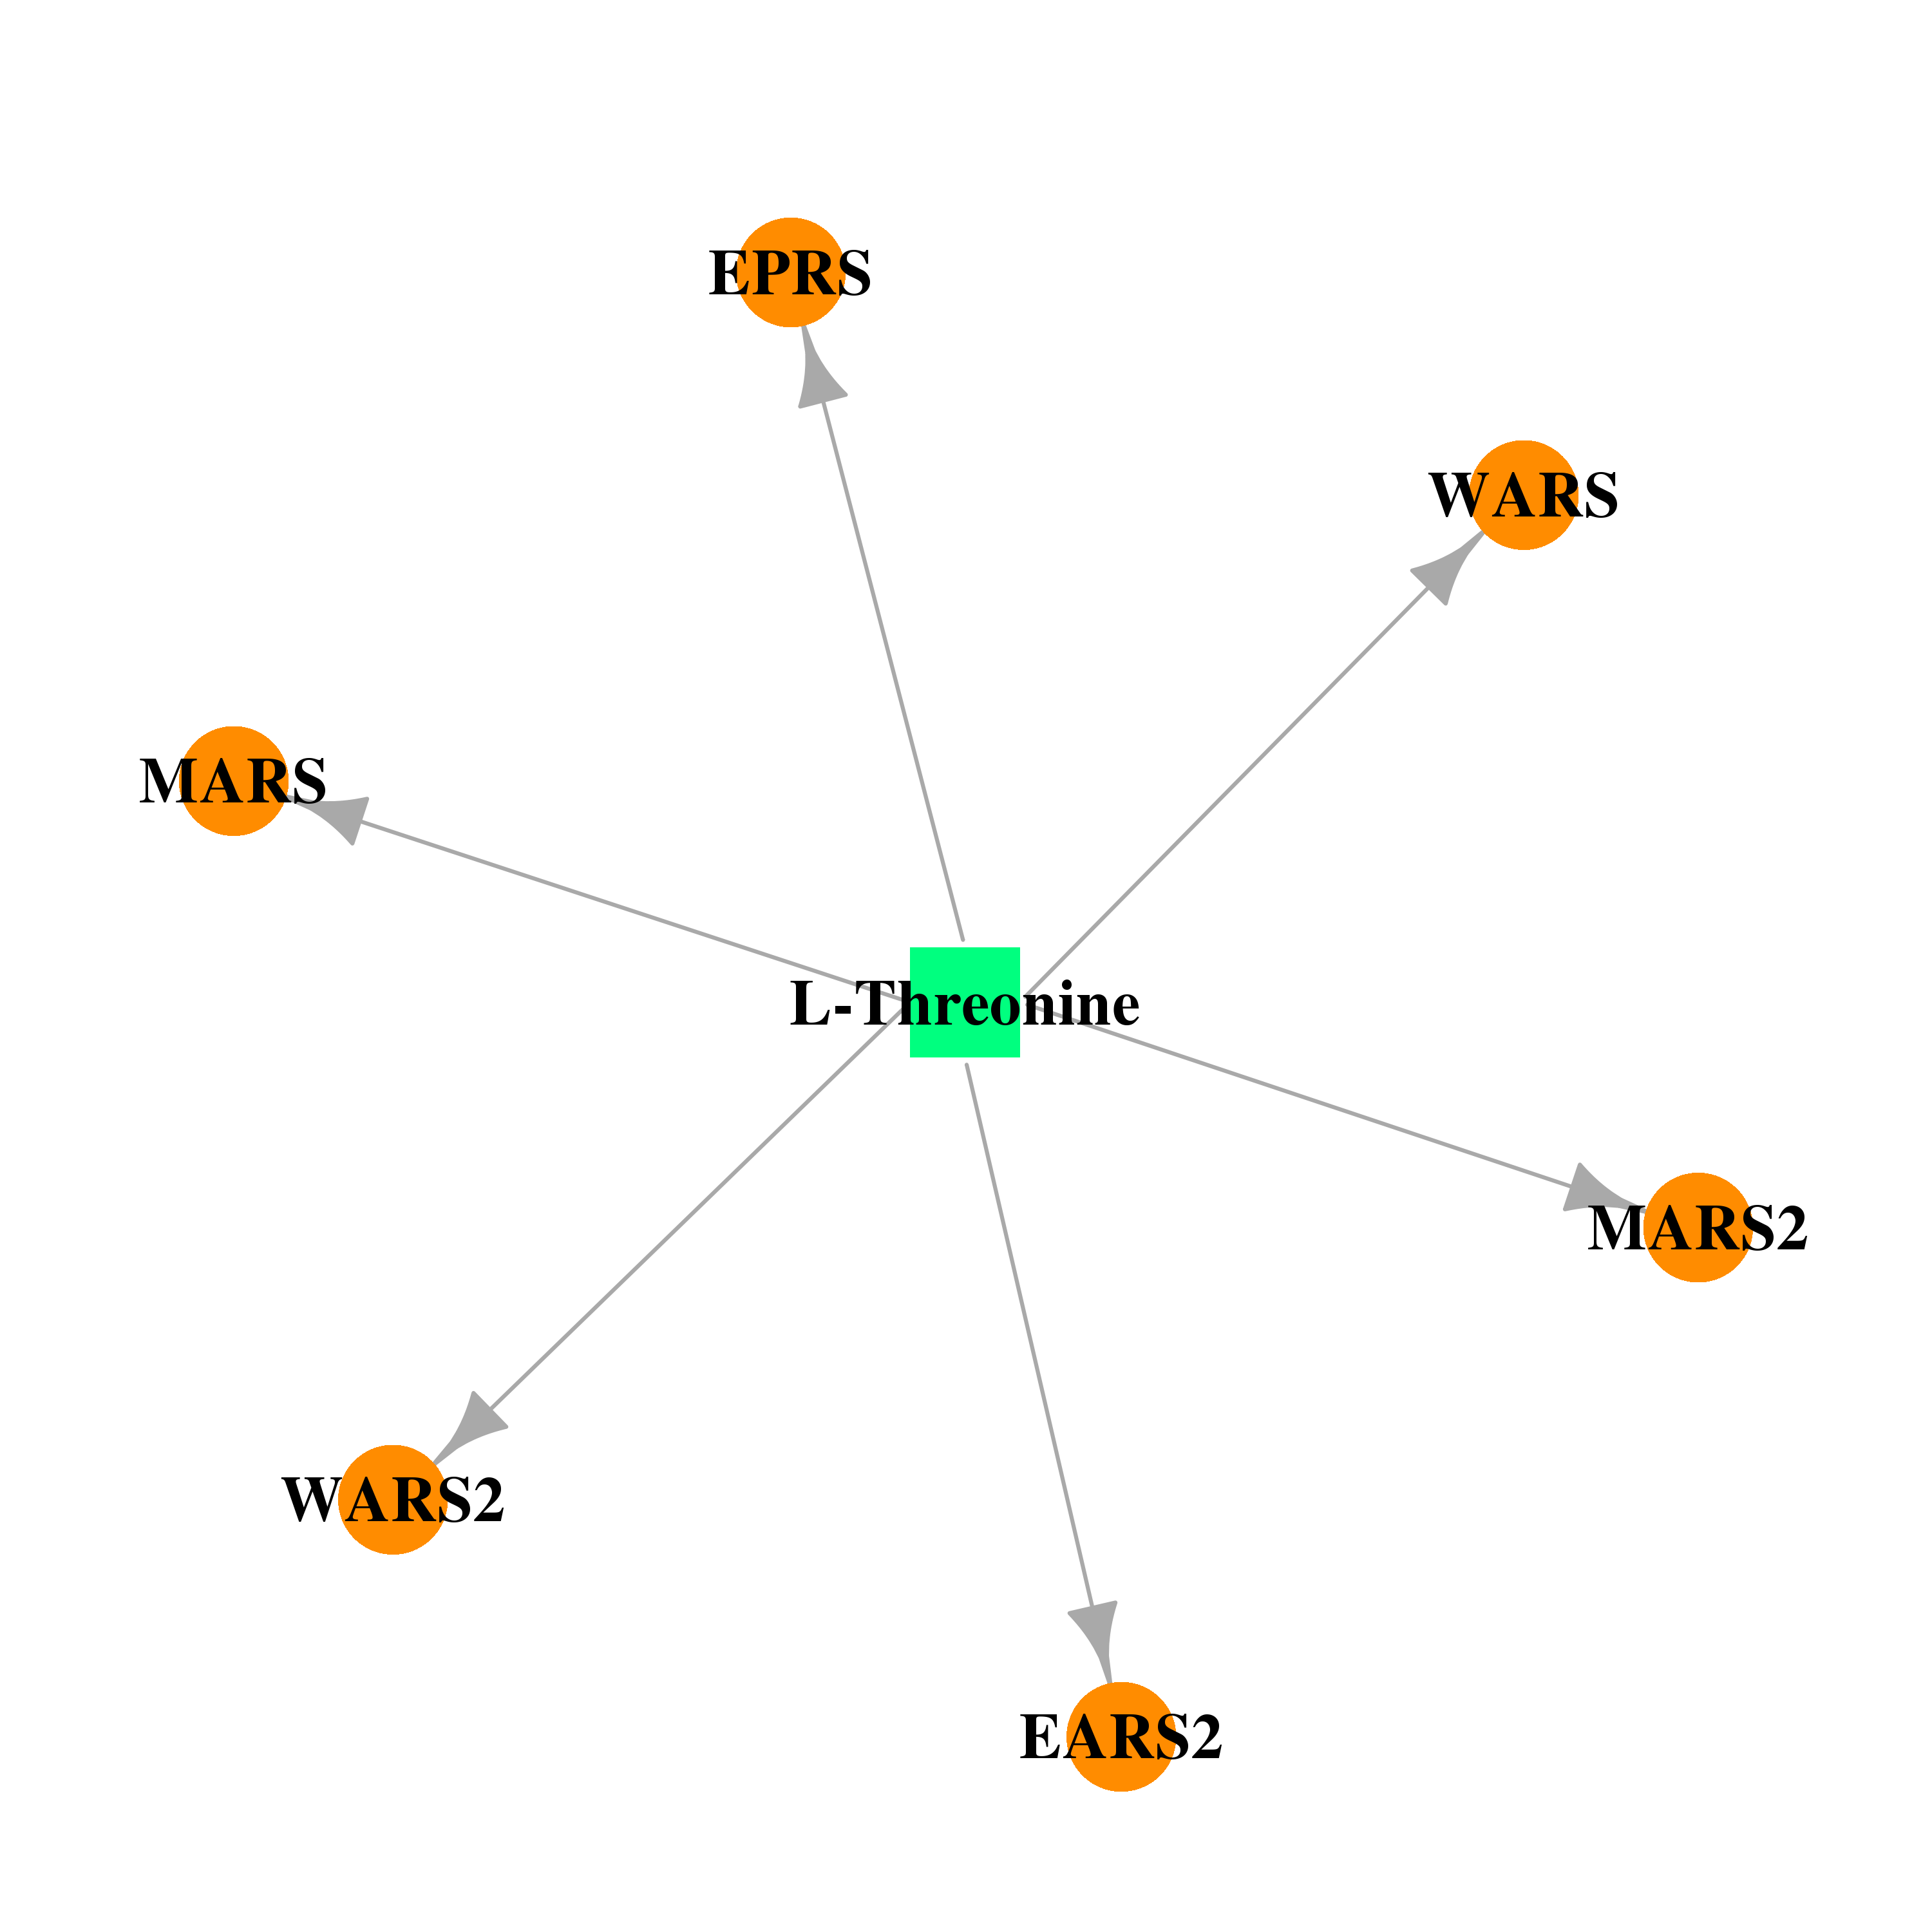 |  |
| DB00150 | glutamyl-tRNA synthetase 2, mitochondrial | approved; nutraceutical | L-Tryptophan | 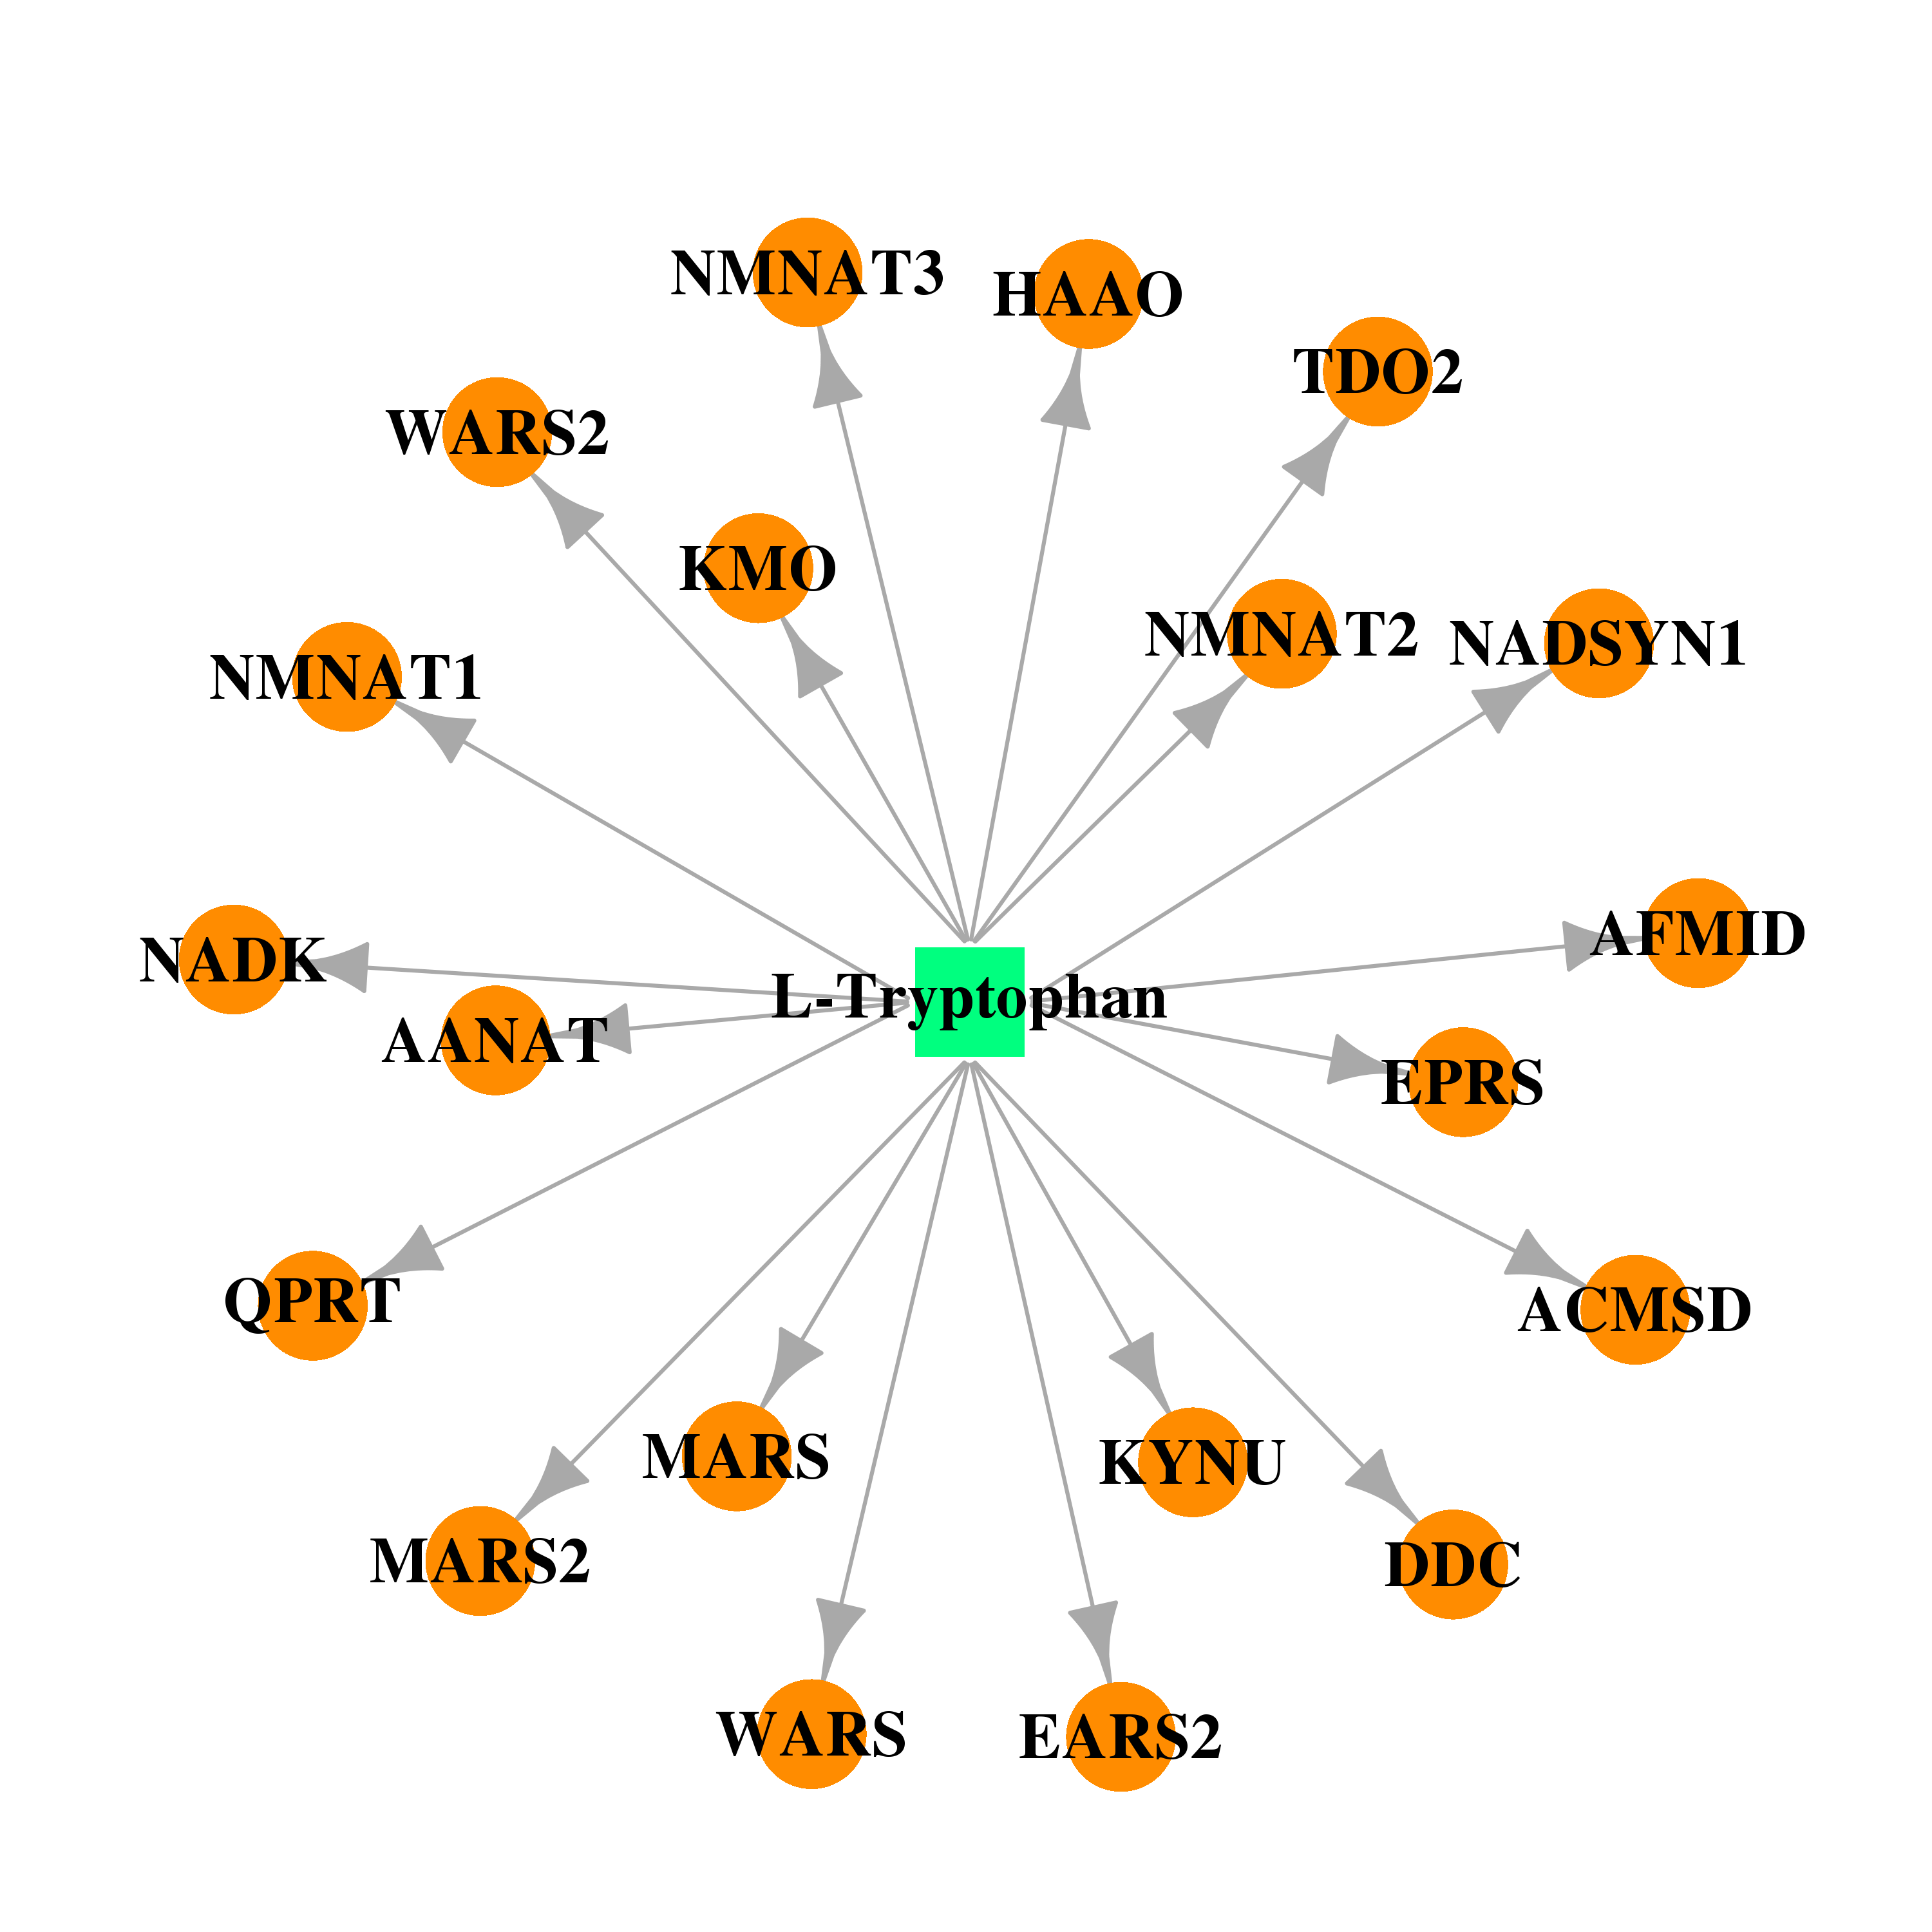 |  |
| DB00135 | glutamyl-tRNA synthetase 2, mitochondrial | approved; nutraceutical | L-Tyrosine |  |  |
| DB00161 | glutamyl-tRNA synthetase 2, mitochondrial | approved; nutraceutical | L-Valine | 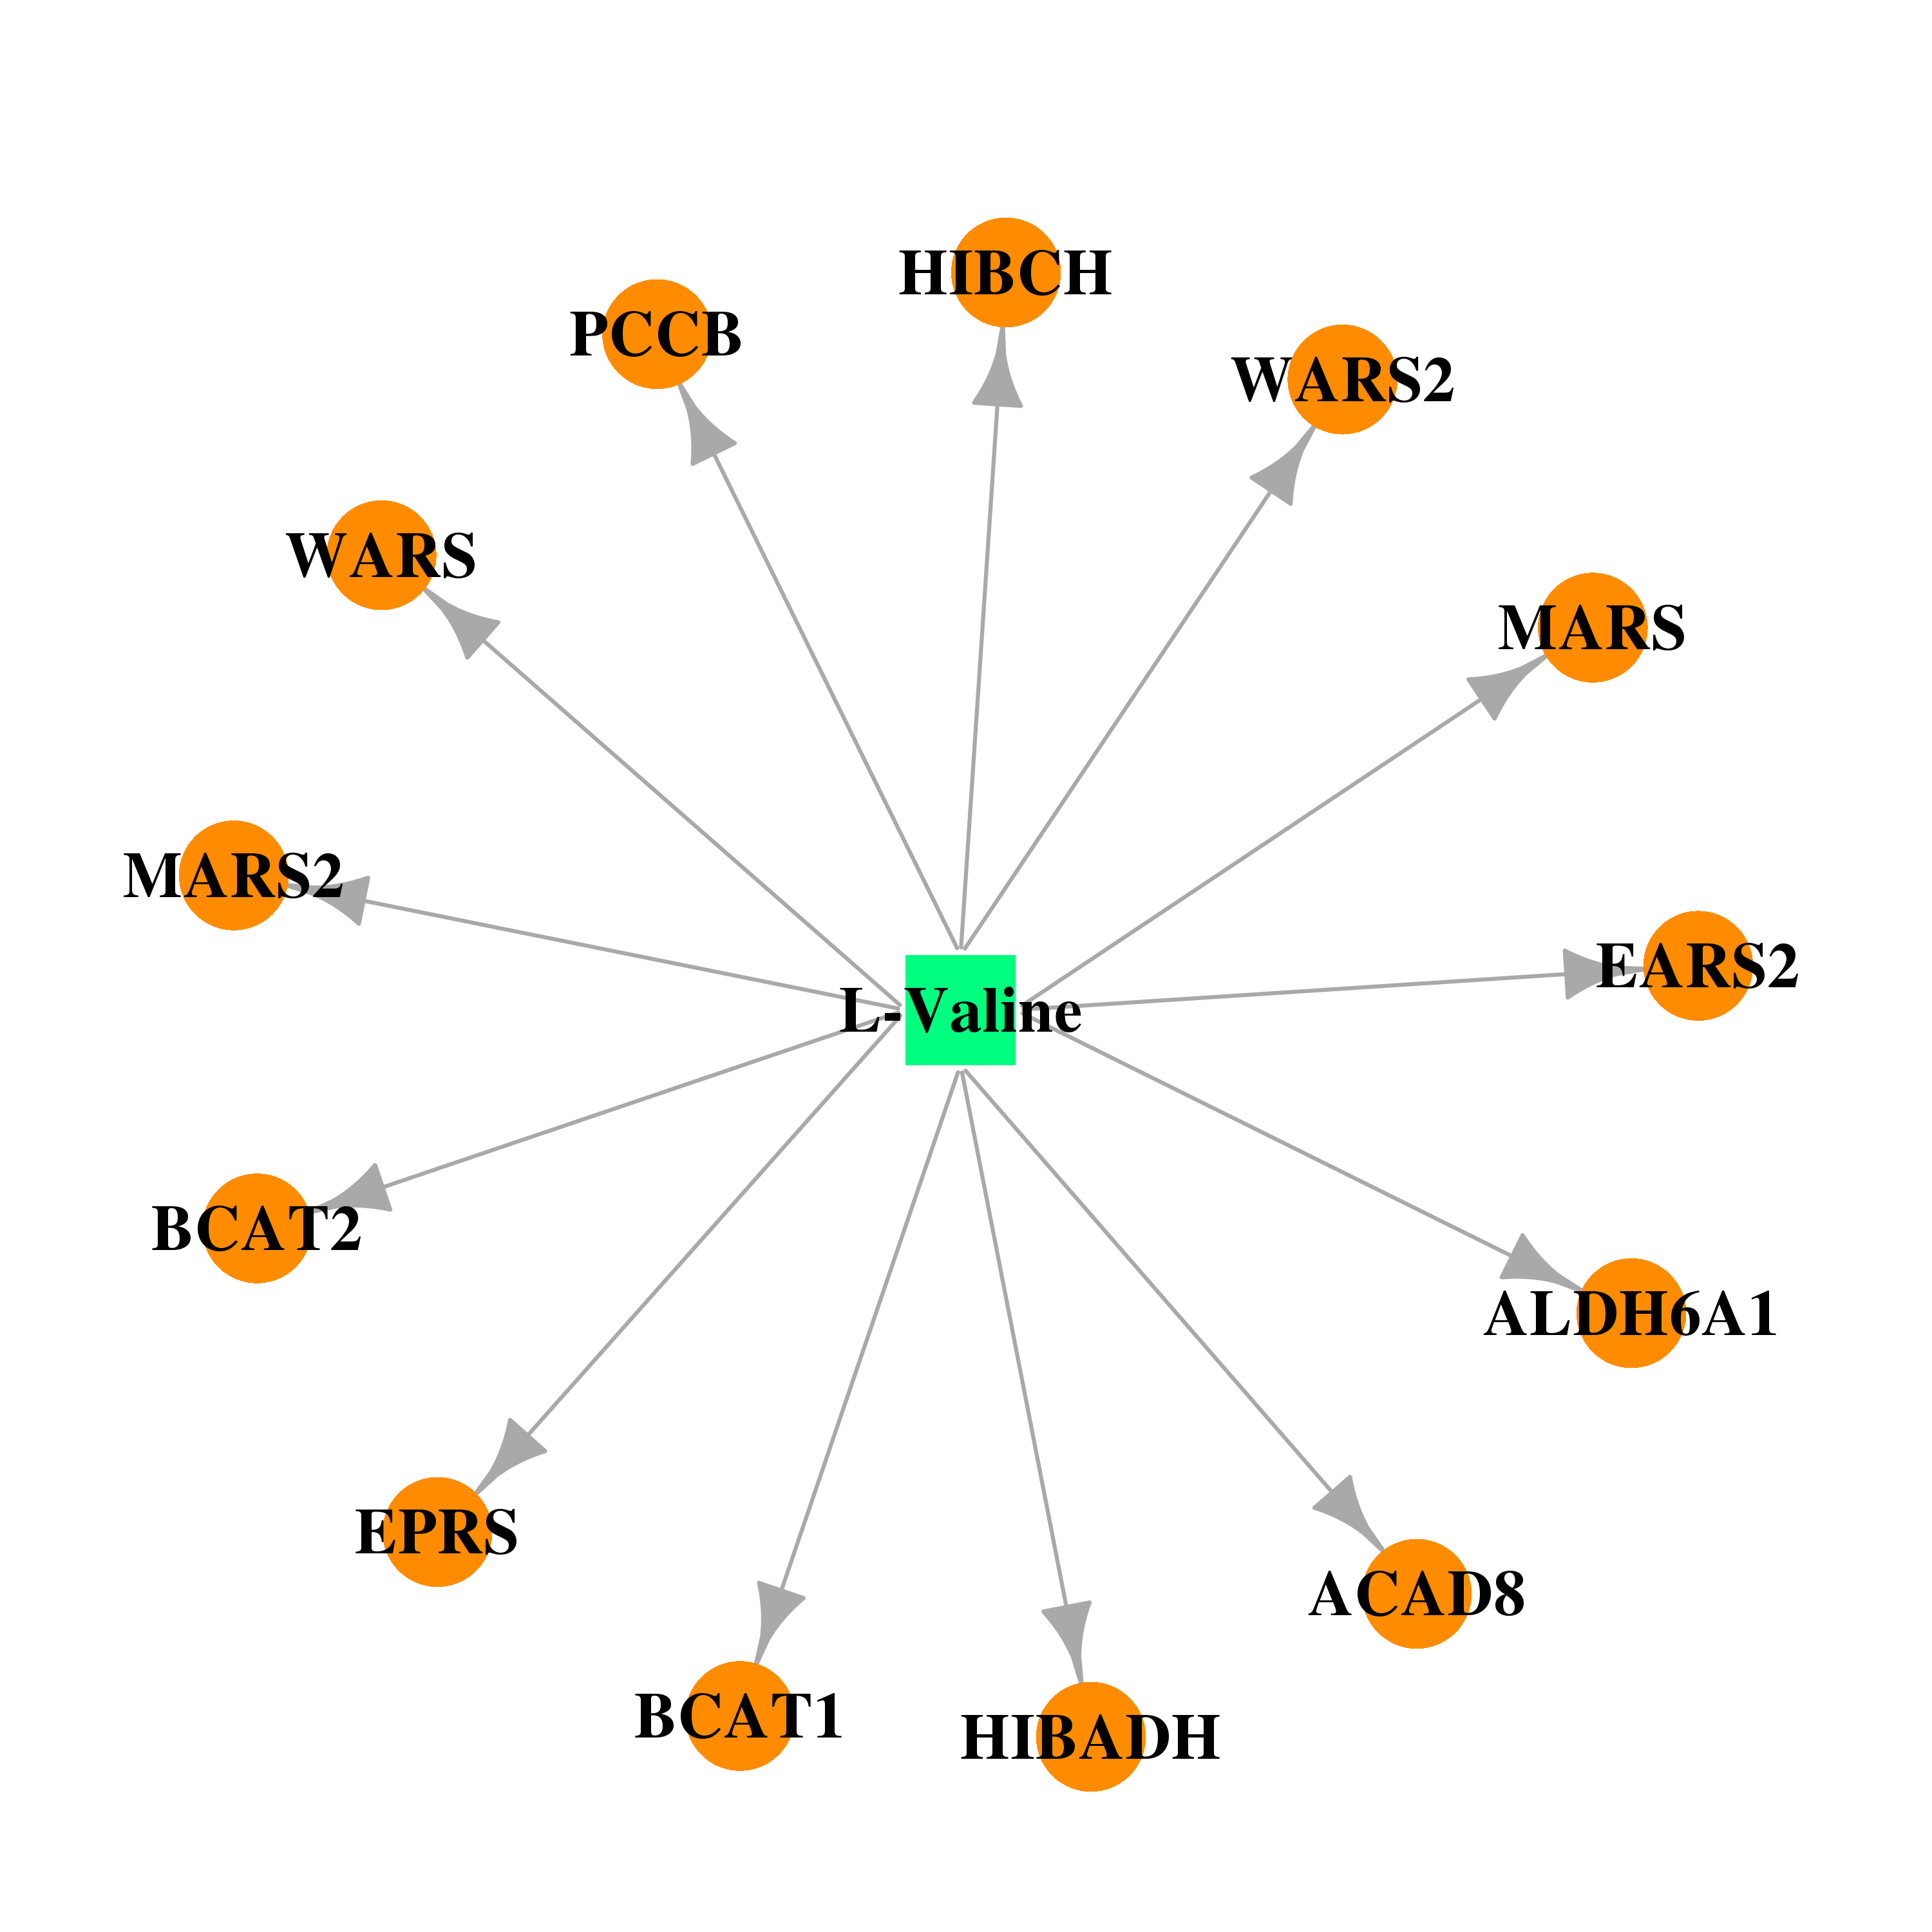 |  |
| Top |
| Cross referenced IDs for EARS2 |
| * We obtained these cross-references from Uniprot database. It covers 150 different DBs, 18 categories. http://www.uniprot.org/help/cross_references_section |
: Open all cross reference information
|
Copyright © 2016-Present - The Univsersity of Texas Health Science Center at Houston @ |