|
||||||||||||||||||||
| |
| Phenotypic Information (metabolism pathway, cancer, disease, phenome) |
| |
| |
| Gene-Gene Network Information: Co-Expression Network, Interacting Genes & KEGG |
| |
|


| Gene Summary for CANT1 |
| Basic gene info. | Gene symbol | CANT1 |
| Gene name | calcium activated nucleotidase 1 | |
| Synonyms | DBQD|SCAN-1|SCAN1|SHAPY | |
| Cytomap | UCSC genome browser: 17q25.3 | |
| Genomic location | chr17 :76987797-77005899 | |
| Type of gene | protein-coding | |
| RefGenes | NM_001159772.1, NM_001159773.1,NM_138793.3, | |
| Ensembl id | ENSG00000171302 | |
| Description | Ca2+-dependent endoplasmic reticulum nucleoside diphosphataseapyrase homologmicromelic dwarfism with vertebral and metaphyseal abnormalities and advanced carpotarsal ossificationputative MAPK-activating protein PM09putative NF-kappa-B-activating prote | |
| Modification date | 20141207 | |
| dbXrefs | MIM : 613165 | |
| HGNC : HGNC | ||
| Ensembl : ENSG00000171302 | ||
| HPRD : 13003 | ||
| Vega : OTTHUMG00000177570 | ||
| Protein | UniProt: Q8WVQ1 go to UniProt's Cross Reference DB Table | |
| Expression | CleanEX: HS_CANT1 | |
| BioGPS: 124583 | ||
| Gene Expression Atlas: ENSG00000171302 | ||
| The Human Protein Atlas: ENSG00000171302 | ||
| Pathway | NCI Pathway Interaction Database: CANT1 | |
| KEGG: CANT1 | ||
| REACTOME: CANT1 | ||
| ConsensusPathDB | ||
| Pathway Commons: CANT1 | ||
| Metabolism | MetaCyc: CANT1 | |
| HUMANCyc: CANT1 | ||
| Regulation | Ensembl's Regulation: ENSG00000171302 | |
| miRBase: chr17 :76,987,797-77,005,899 | ||
| TargetScan: NM_001159772 | ||
| cisRED: ENSG00000171302 | ||
| Context | iHOP: CANT1 | |
| cancer metabolism search in PubMed: CANT1 | ||
| UCL Cancer Institute: CANT1 | ||
| Assigned class in ccmGDB | A - This gene has a literature evidence and it belongs to cancer gene. | |
| References showing role of CANT1 in cancer cell metabolism | 1. Gerhardt J, Steinbrech C, Buchi O, Behnke S, Bohnert A, et al. (2011) The androgen-regulated Calcium-Activated Nucleotidase 1 (CANT1) is commonly overexpressed in prostate cancer and is tumor-biologically relevant in vitro. Am J Pathol 178: 1847-1860. doi: 10.1016/j.ajpath.2010.12.046. pmid: 3078458 go to article | |
| Top |
| Phenotypic Information for CANT1(metabolism pathway, cancer, disease, phenome) |
| Cancer | CGAP: CANT1 |
| Familial Cancer Database: CANT1 | |
| * This gene is included in those cancer gene databases. |
|
|
|
|
|
|
| ||||||||||||||
Oncogene 1 | Significant driver gene in | |||||||||||||||||||
| cf) number; DB name 1 Oncogene; http://nar.oxfordjournals.org/content/35/suppl_1/D721.long, 2 Tumor Suppressor gene; https://bioinfo.uth.edu/TSGene/, 3 Cancer Gene Census; http://www.nature.com/nrc/journal/v4/n3/abs/nrc1299.html, 4 CancerGenes; http://nar.oxfordjournals.org/content/35/suppl_1/D721.long, 5 Network of Cancer Gene; http://ncg.kcl.ac.uk/index.php, 1Therapeutic Vulnerabilities in Cancer; http://cbio.mskcc.org/cancergenomics/statius/ |
| KEGG_PURINE_METABOLISM KEGG_PYRIMIDINE_METABOLISM | |
| OMIM | 251450; phenotype. 613165; gene. |
| Orphanet | 1425; Desbuquois syndrome. |
| Disease | KEGG Disease: CANT1 |
| MedGen: CANT1 (Human Medical Genetics with Condition) | |
| ClinVar: CANT1 | |
| Phenotype | MGI: CANT1 (International Mouse Phenotyping Consortium) |
| PhenomicDB: CANT1 | |
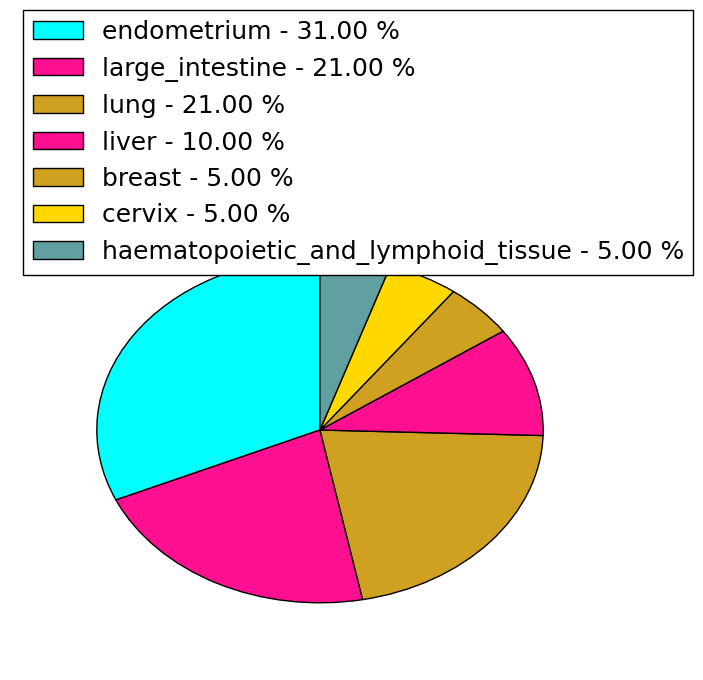
| Mutations for CANT1 |
| * Under tables are showing count per each tissue to give us broad intuition about tissue specific mutation patterns.You can go to the detailed page for each mutation database's web site. |
| There's no structural variation information in COSMIC data for this gene. |
| * From mRNA Sanger sequences, Chitars2.0 arranged chimeric transcripts. This table shows CANT1 related fusion information. |
| ID | Head Gene | Tail Gene | Accession | Gene_a | qStart_a | qEnd_a | Chromosome_a | tStart_a | tEnd_a | Gene_a | qStart_a | qEnd_a | Chromosome_a | tStart_a | tEnd_a |
| EU693078 | CANT1 | 1 | 128 | 17 | 77001454 | 77001581 | ETV4 | 127 | 389 | 17 | 41610637 | 41613849 | |
| BE816214 | CANT1 | 1 | 211 | 17 | 76988787 | 76988997 | CANT1 | 209 | 277 | 17 | 76989012 | 76989080 | |
| Top |
| There's no copy number variation information in COSMIC data for this gene. |
| Top |
|
 |
| Top |
| Stat. for Non-Synonymous SNVs (# total SNVs=26) | (# total SNVs=19) |
 |  |
(# total SNVs=2) | (# total SNVs=0) |
 |
| Top |
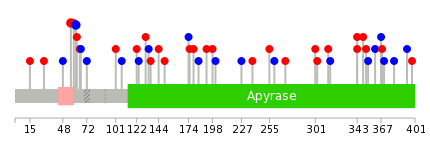
| * When you move the cursor on each content, you can see more deailed mutation information on the Tooltip. Those are primary_site,primary_histology,mutation(aa),pubmedID. |
| GRCh37 position | Mutation(aa) | Unique sampleID count |
| chr17:76993522-76993522 | p.S61S | 2 |
| chr17:76991114-76991114 | p.G274A | 2 |
| chr17:76993169-76993169 | p.S179F | 2 |
| chr17:76993539-76993539 | p.L56F | 2 |
| chr17:76991166-76991166 | p.V257M | 2 |
| chr17:76993423-76993423 | p.S94S | 2 |
| chr17:76993313-76993313 | p.K131R | 2 |
| chr17:76993507-76993507 | p.G67fs*63 | 2 |
| chr17:76989644-76989644 | p.I398M | 2 |
| chr17:76993149-76993149 | p.V186I | 1 |
| Top |
|
 |
| Point Mutation/ Tissue ID | 1 | 2 | 3 | 4 | 5 | 6 | 7 | 8 | 9 | 10 | 11 | 12 | 13 | 14 | 15 | 16 | 17 | 18 | 19 | 20 |
| # sample | 1 | 2 | 1 | 6 | 1 | 2 | 5 | 5 | 1 | 10 | 4 | 5 | ||||||||
| # mutation | 1 | 2 | 1 | 6 | 1 | 2 | 5 | 5 | 1 | 9 | 4 | 7 | ||||||||
| nonsynonymous SNV | 1 | 3 | 1 | 3 | 3 | 1 | 7 | 4 | 1 | |||||||||||
| synonymous SNV | 1 | 1 | 1 | 3 | 2 | 2 | 2 | 2 | 6 |
| cf) Tissue ID; Tissue type (1; BLCA[Bladder Urothelial Carcinoma], 2; BRCA[Breast invasive carcinoma], 3; CESC[Cervical squamous cell carcinoma and endocervical adenocarcinoma], 4; COAD[Colon adenocarcinoma], 5; GBM[Glioblastoma multiforme], 6; Glioma Low Grade, 7; HNSC[Head and Neck squamous cell carcinoma], 8; KICH[Kidney Chromophobe], 9; KIRC[Kidney renal clear cell carcinoma], 10; KIRP[Kidney renal papillary cell carcinoma], 11; LAML[Acute Myeloid Leukemia], 12; LUAD[Lung adenocarcinoma], 13; LUSC[Lung squamous cell carcinoma], 14; OV[Ovarian serous cystadenocarcinoma ], 15; PAAD[Pancreatic adenocarcinoma], 16; PRAD[Prostate adenocarcinoma], 17; SKCM[Skin Cutaneous Melanoma], 18:STAD[Stomach adenocarcinoma], 19:THCA[Thyroid carcinoma], 20:UCEC[Uterine Corpus Endometrial Carcinoma]) |
| Top |
| * We represented just top 10 SNVs. When you move the cursor on each content, you can see more deailed mutation information on the Tooltip. Those are primary_site, primary_histology, mutation(aa), pubmedID. |
| Genomic Position | Mutation(aa) | Unique sampleID count |
| chr17:76993522 | p.S61S,CANT1 | 2 |
| chr17:76993539 | p.L56F,CANT1 | 2 |
| chr17:76993341 | p.A101V,CANT1 | 1 |
| chr17:76989698 | p.G368S,CANT1 | 1 |
| chr17:76993619 | p.G227G,CANT1 | 1 |
| chr17:76989898 | p.H72H,CANT1 | 1 |
| chr17:76993153 | p.S367S,CANT1 | 1 |
| chr17:76993384 | p.L201L,CANT1 | 1 |
| chr17:76989728 | p.W198L,CANT1 | 1 |
| chr17:76993661 | p.P66P,CANT1 | 1 |
| * Copy number data were extracted from TCGA using R package TCGA-Assembler. The URLs of all public data files on TCGA DCC data server were gathered on Jan-05-2015. Function ProcessCNAData in TCGA-Assembler package was used to obtain gene-level copy number value which is calculated as the average copy number of the genomic region of a gene. |
 |
| cf) Tissue ID[Tissue type]: BLCA[Bladder Urothelial Carcinoma], BRCA[Breast invasive carcinoma], CESC[Cervical squamous cell carcinoma and endocervical adenocarcinoma], COAD[Colon adenocarcinoma], GBM[Glioblastoma multiforme], Glioma Low Grade, HNSC[Head and Neck squamous cell carcinoma], KICH[Kidney Chromophobe], KIRC[Kidney renal clear cell carcinoma], KIRP[Kidney renal papillary cell carcinoma], LAML[Acute Myeloid Leukemia], LUAD[Lung adenocarcinoma], LUSC[Lung squamous cell carcinoma], OV[Ovarian serous cystadenocarcinoma ], PAAD[Pancreatic adenocarcinoma], PRAD[Prostate adenocarcinoma], SKCM[Skin Cutaneous Melanoma], STAD[Stomach adenocarcinoma], THCA[Thyroid carcinoma], UCEC[Uterine Corpus Endometrial Carcinoma] |
| Top |
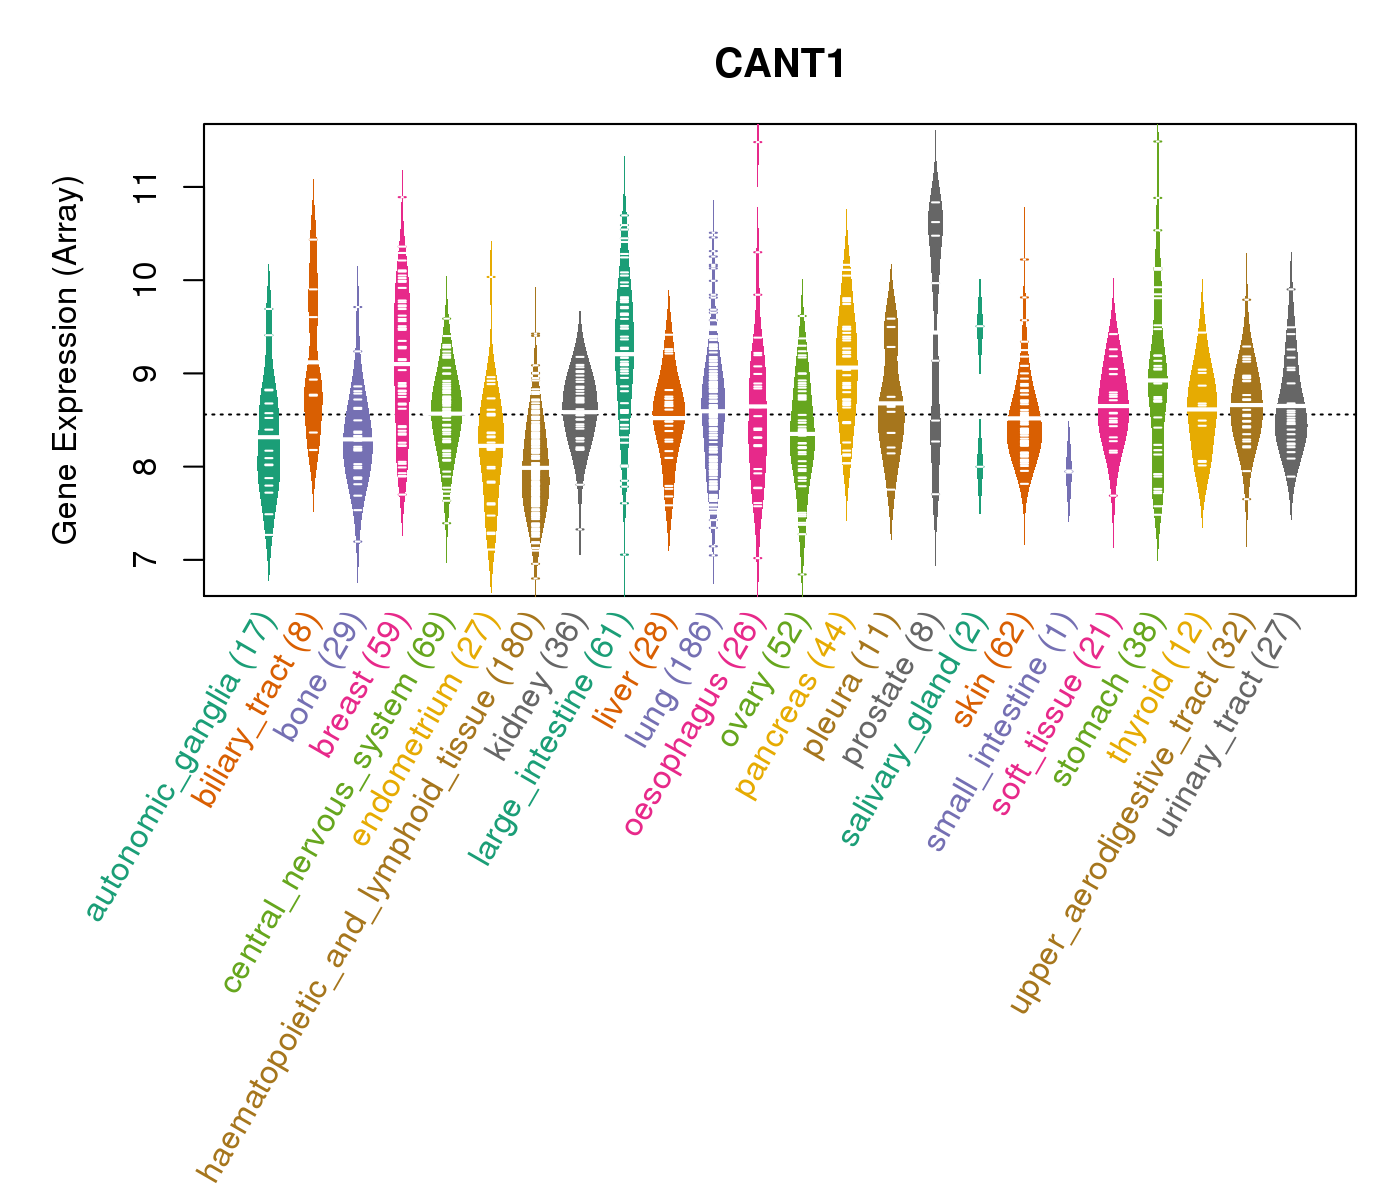
| Gene Expression for CANT1 |
| * CCLE gene expression data were extracted from CCLE_Expression_Entrez_2012-10-18.res: Gene-centric RMA-normalized mRNA expression data. |
 |
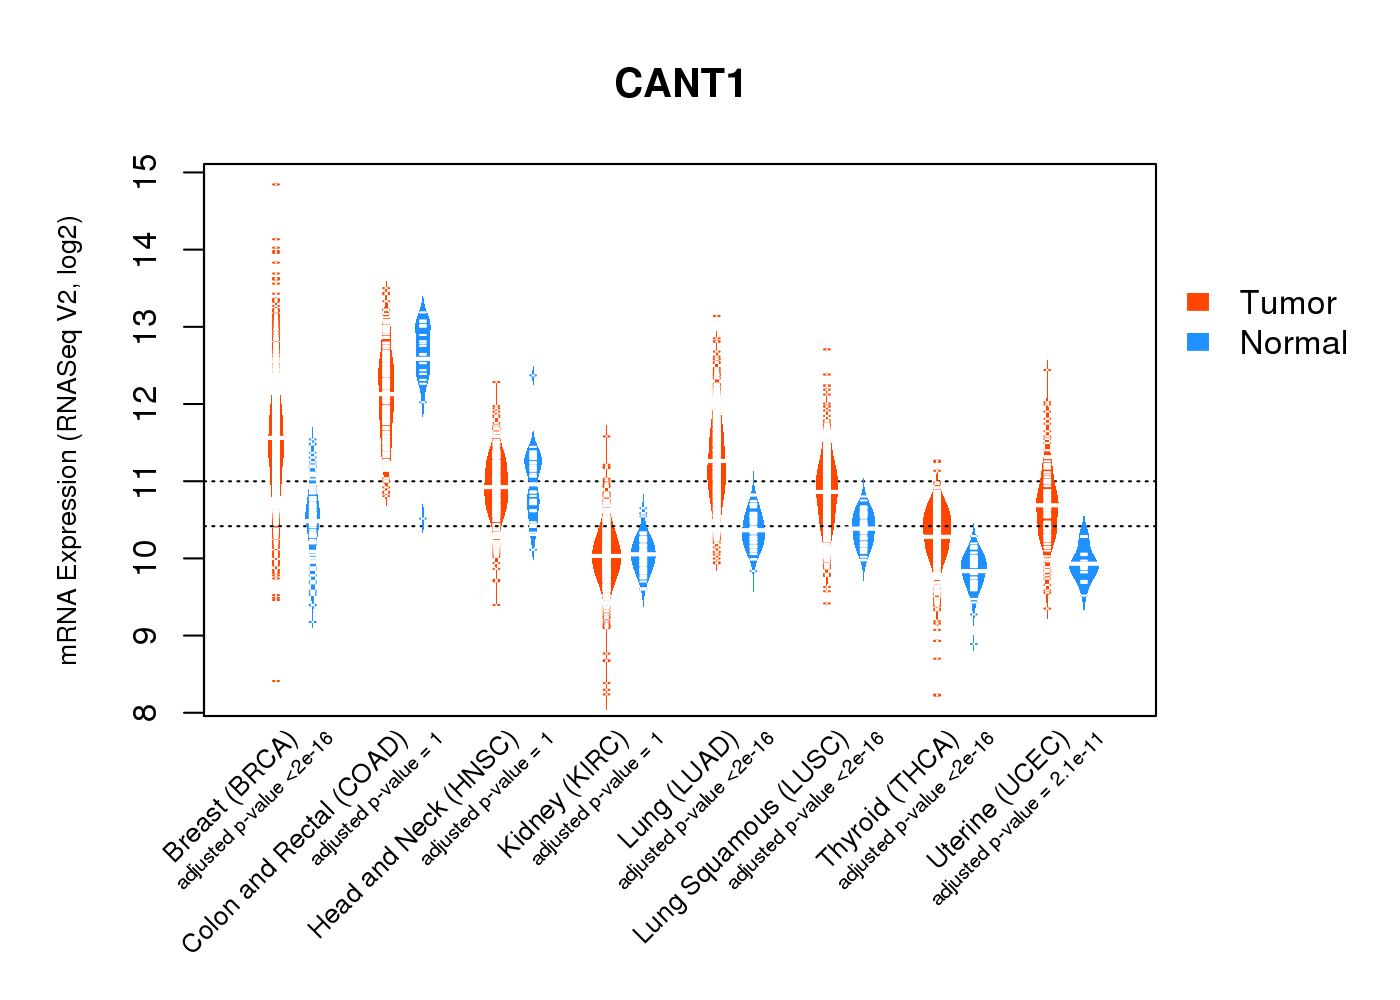
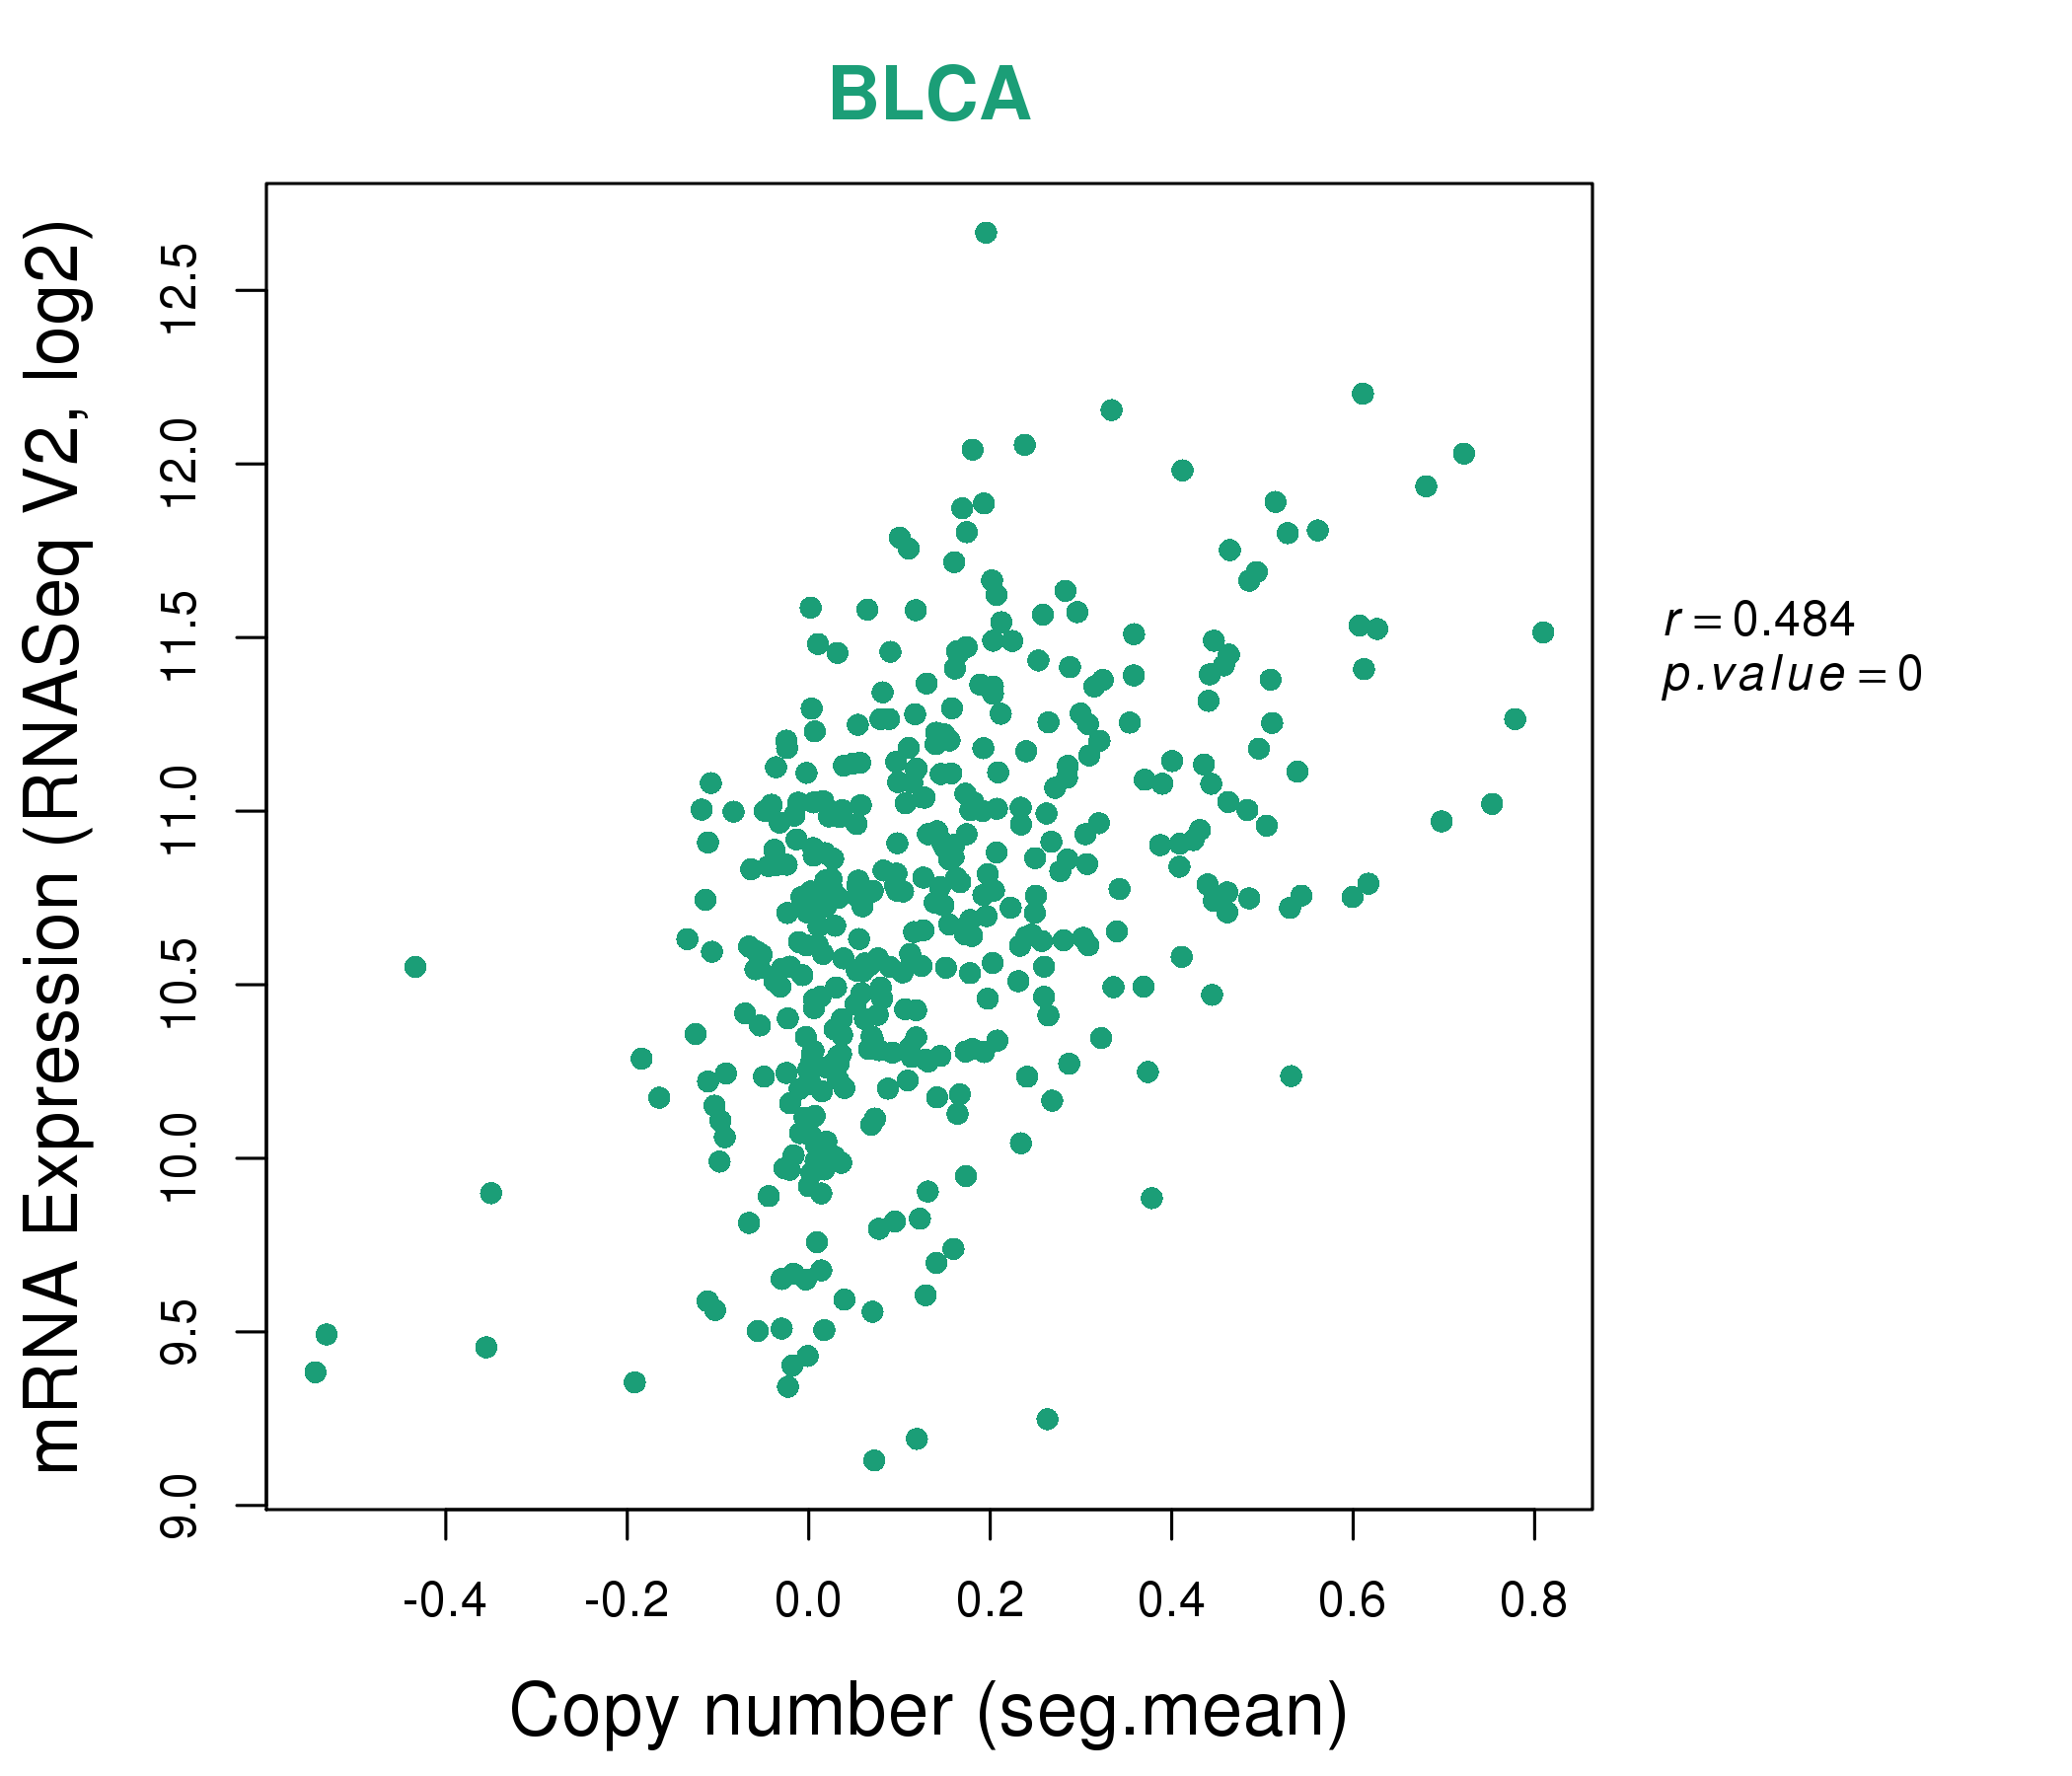
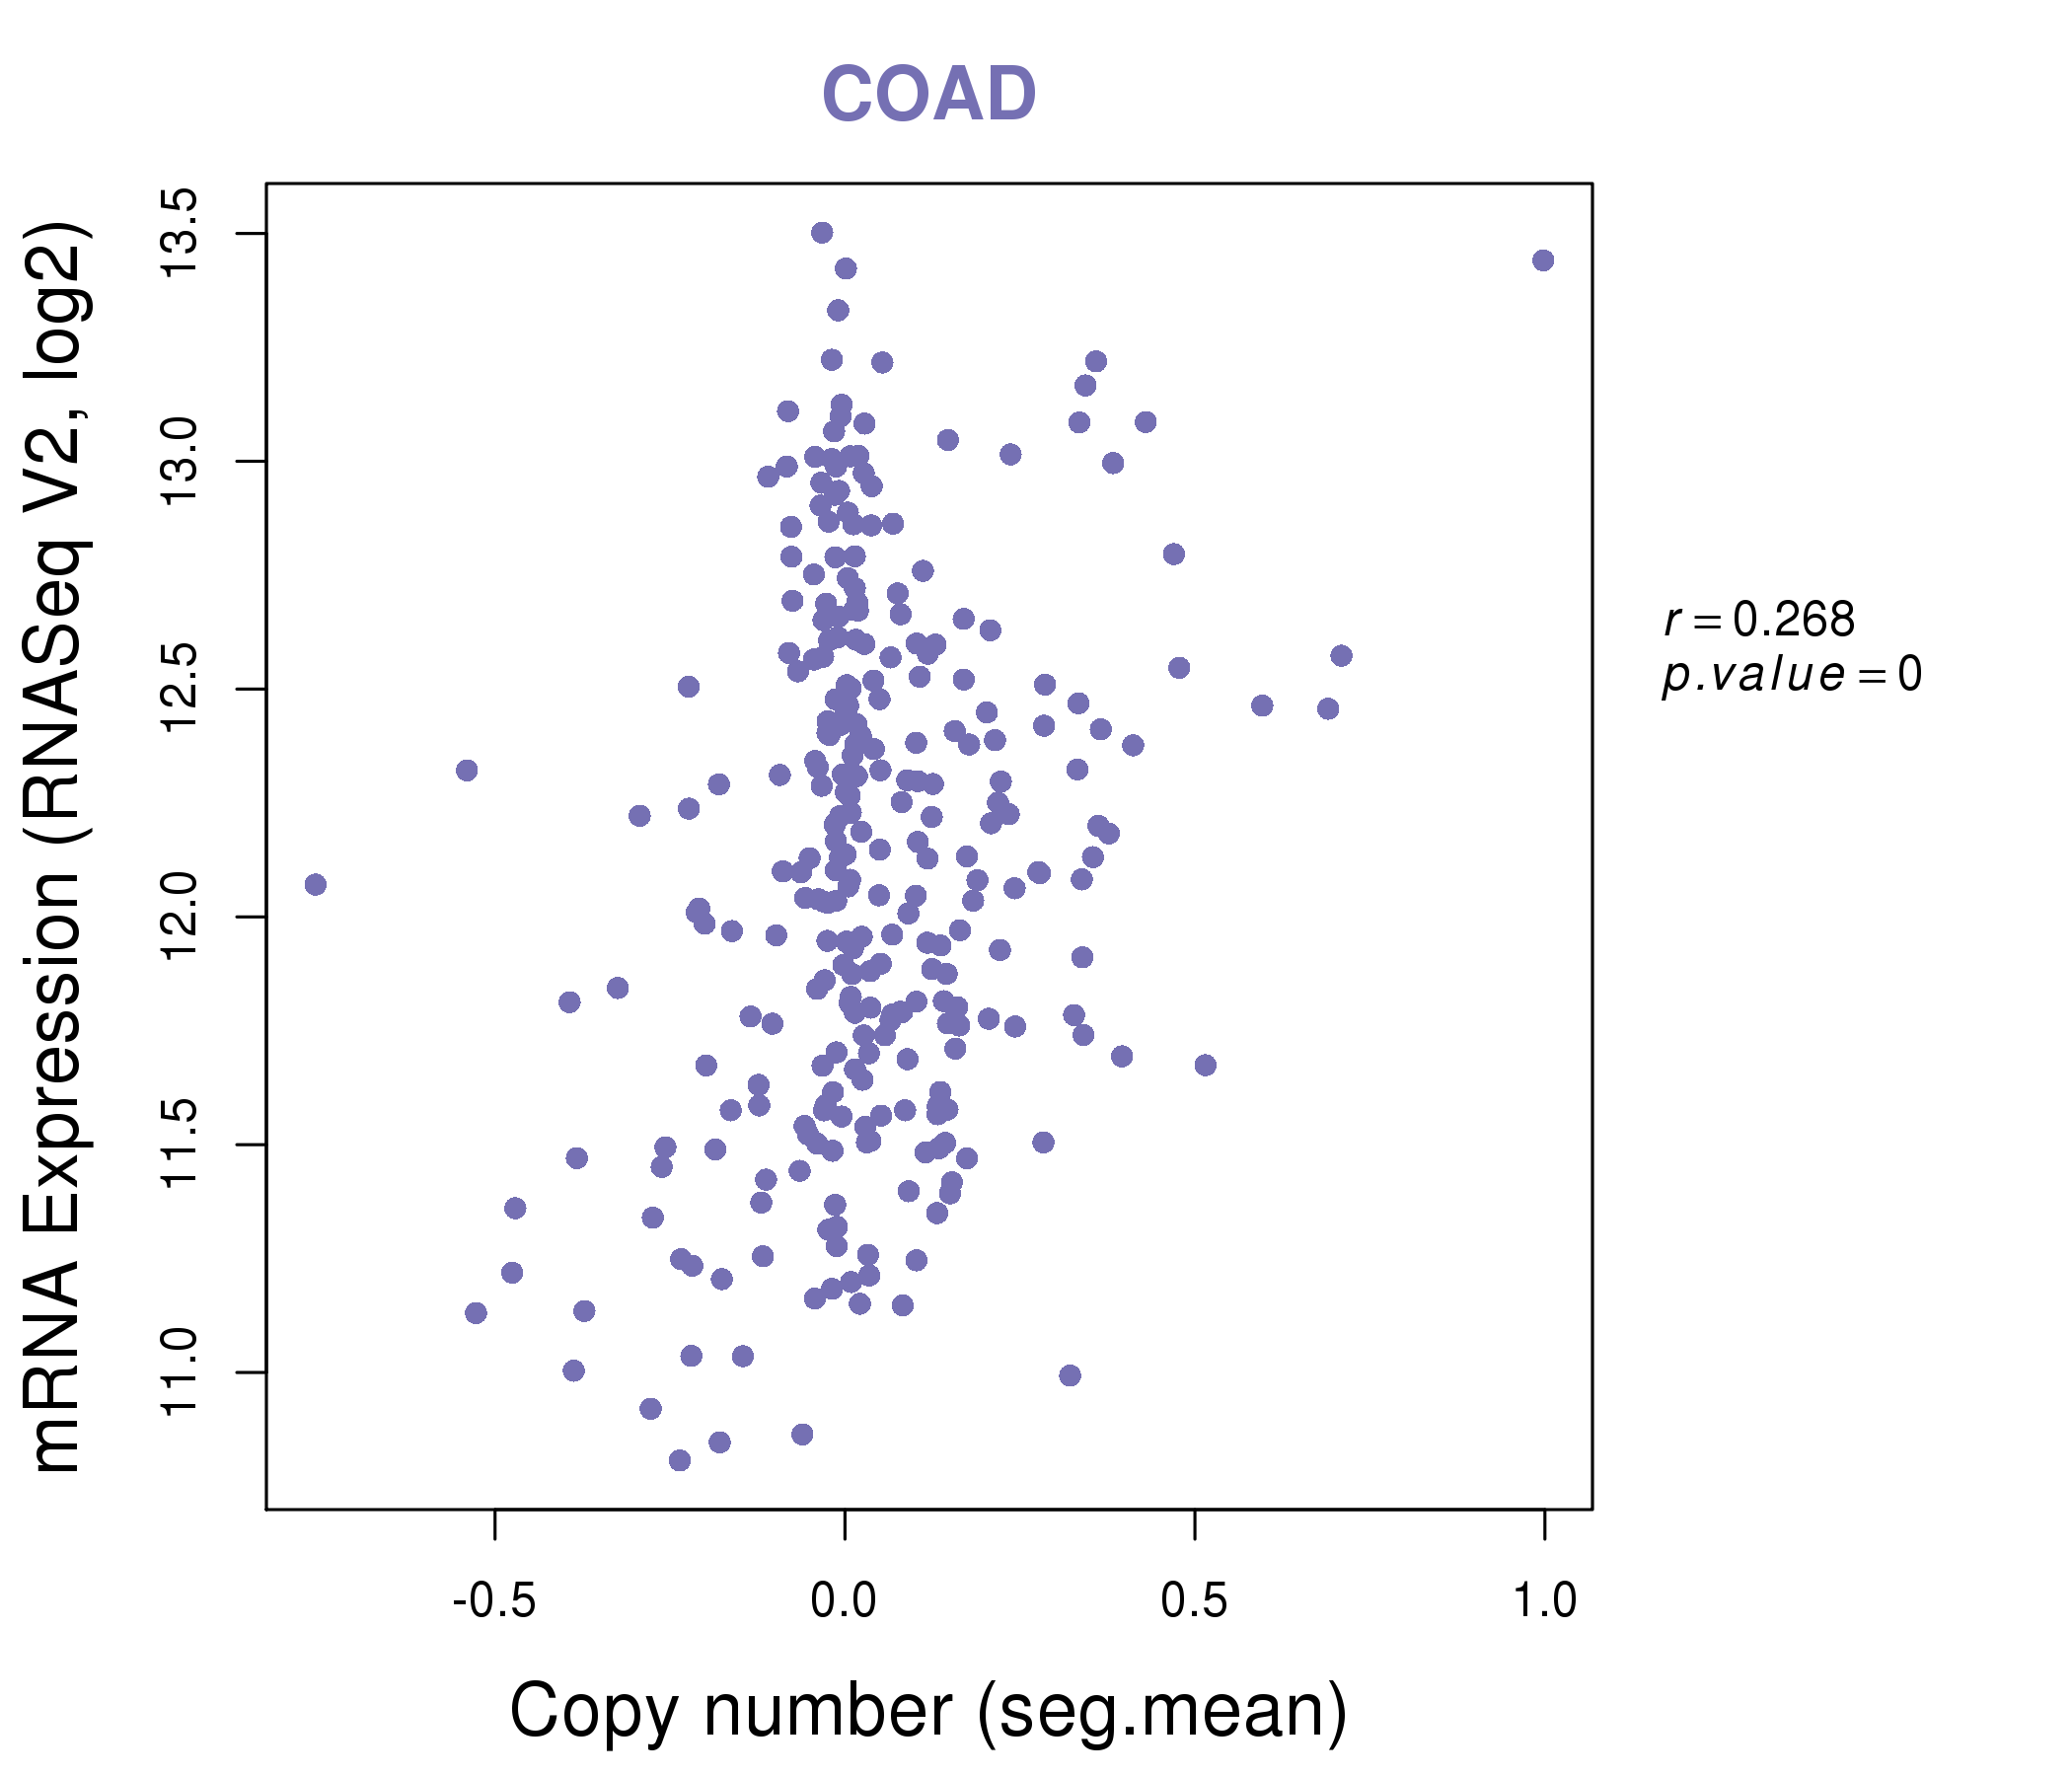
| * Normalized gene expression data of RNASeqV2 was extracted from TCGA using R package TCGA-Assembler. The URLs of all public data files on TCGA DCC data server were gathered at Jan-05-2015. Only eight cancer types have enough normal control samples for differential expression analysis. (t test, adjusted p<0.05 (using Benjamini-Hochberg FDR)) |
 |
| Top |
| * This plots show the correlation between CNV and gene expression. |
: Open all plots for all cancer types
 |
|
 |
|


| Top |
| Gene-Gene Network Information |
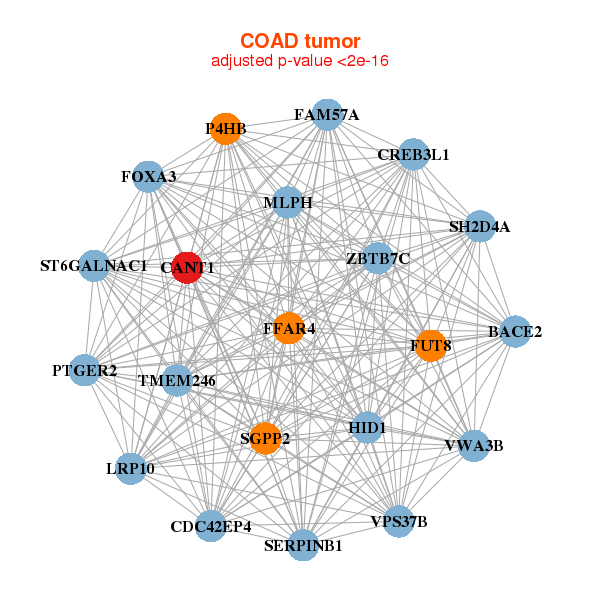
| * Co-Expression network figures were drawn using R package igraph. Only the top 20 genes with the highest correlations were shown. Red circle: input gene, orange circle: cell metabolism gene, sky circle: other gene |
: Open all plots for all cancer types
 |
| ||||
| BAIAP2,HID1,C17orf80,CANT1,COG1,CSNK1D,DNAJA4, DYNLL2,KCTD2,KIAA0195,LLGL2,MIF4GD,MTMR4,PBX1, RNF43,RPTOR,SLC26A11,SLC27A4,SLC9A3R1,SYNGR2,TBCD | AP1M2,ARHGAP39,CANT1,CDH1,CRB3,CREB3L4,DLG3, ERBB3,FAM83H,FKBP4,GOLM1,ILDR1,KIAA1324,CAMSAP3, MAPK13,MARVELD2,RAB11FIP4,SEZ6L2,SHROOM2,SPDEF,TJP3 | ||||
 |
| ||||
| BACE2,HID1,TMEM246,CANT1,CDC42EP4,CREB3L1,FAM57A, FOXA3,FUT8,FFAR4,LRP10,MLPH,P4HB,PTGER2, SERPINB1,SGPP2,SH2D4A,ST6GALNAC1,VPS37B,VWA3B,ZBTB7C | ACVRL1,APH1A,CANT1,CDC42EP5,CDX1,DHX32,GALNT12, GIPC1,GUSB,ILDR1,IMPA2,ITM2C,LIMK2,LLGL2, LSR,MAGIX,MARCH3,OVOL2,RHBDL2,TMPRSS4,TOR2A |
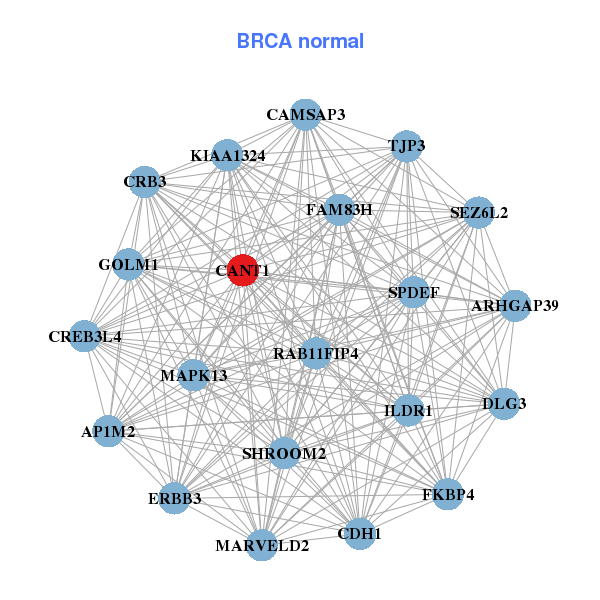
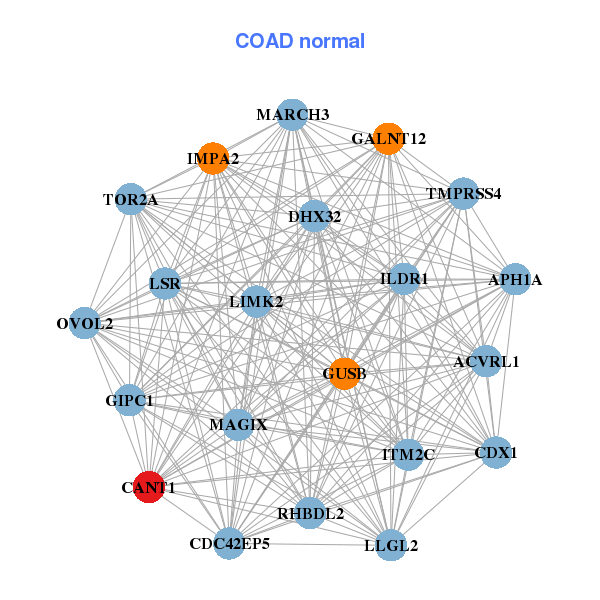
| * Co-Expression network figures were drawn using R package igraph. Only the top 20 genes with the highest correlations were shown. Red circle: input gene, orange circle: cell metabolism gene, sky circle: other gene |
: Open all plots for all cancer types
| Top |
: Open all interacting genes' information including KEGG pathway for all interacting genes from DAVID
| Top |
| Pharmacological Information for CANT1 |
| DB Category | DB Name | DB's ID and Url link |
| Organism-specific databases | PharmGKB | PA134984439; -. |
| Organism-specific databases | CTD | 124583; -. |
| * Gene Centered Interaction Network. |
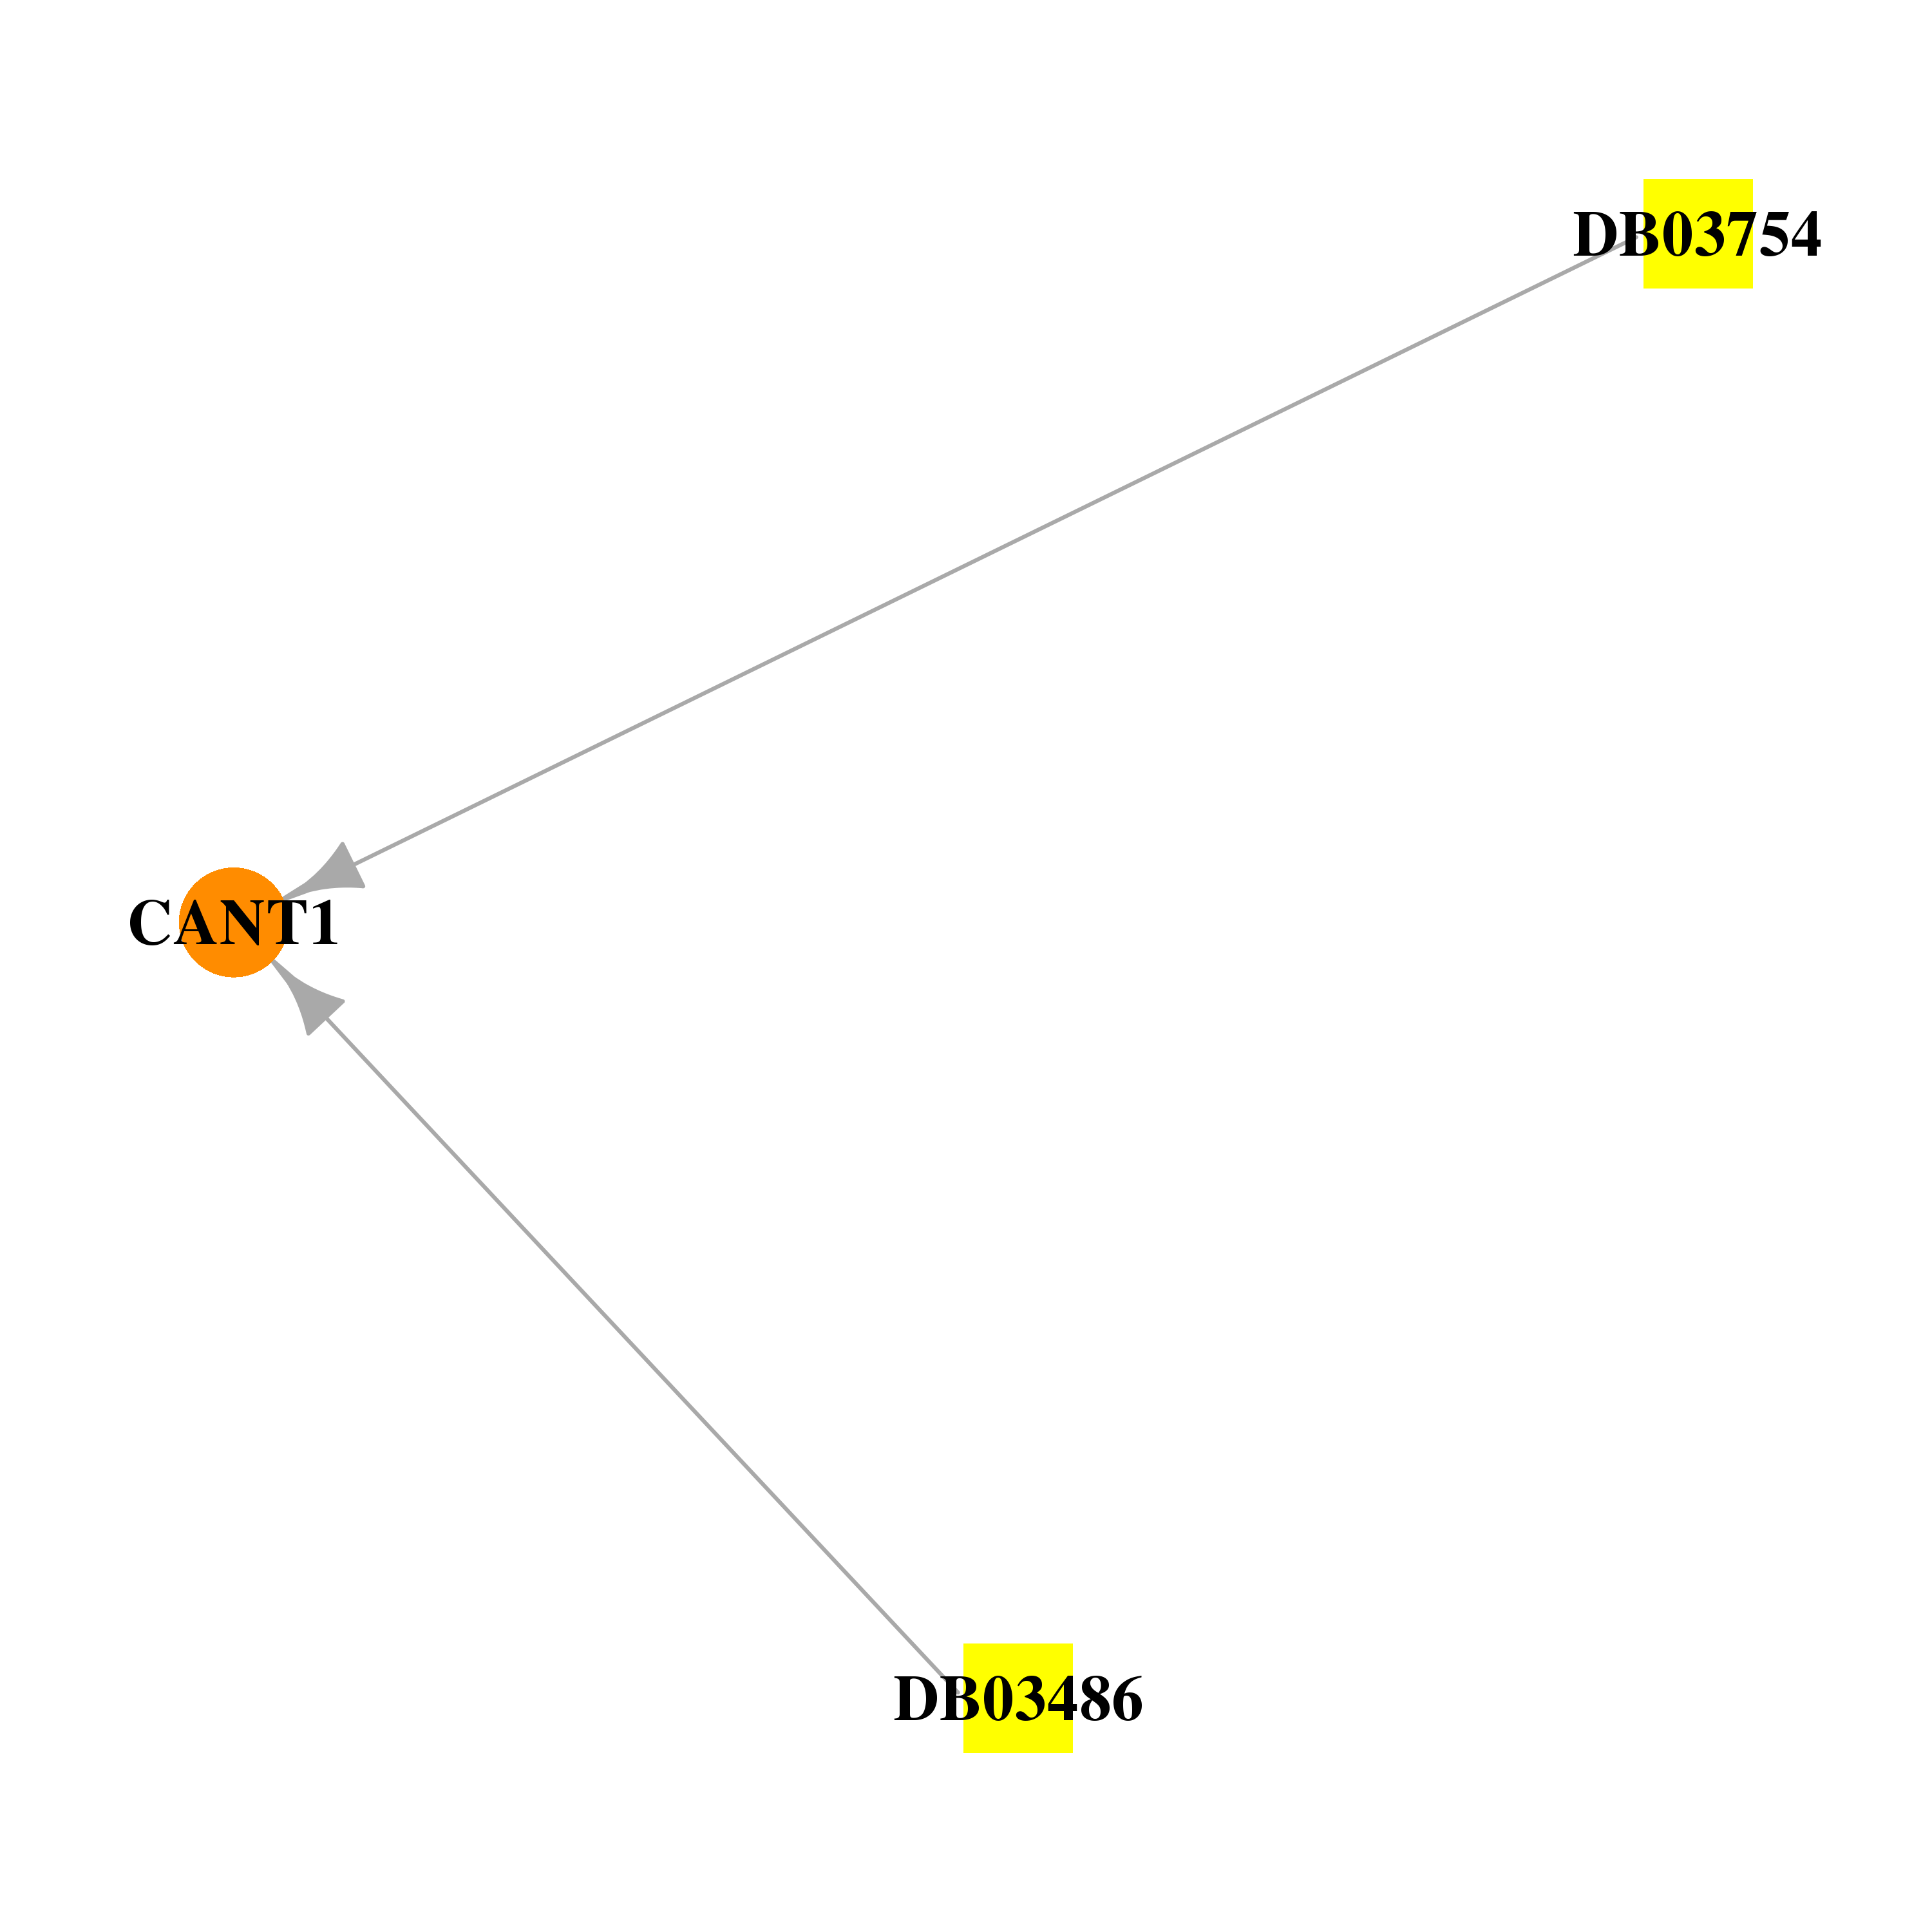 |
| * Drug Centered Interaction Network. |
| DrugBank ID | Target Name | Drug Groups | Generic Name | Drug Centered Network | Drug Structure |
| DB03486 | calcium activated nucleotidase 1 | experimental | Phosphomethylphosphonic Acid Guanosyl Ester | 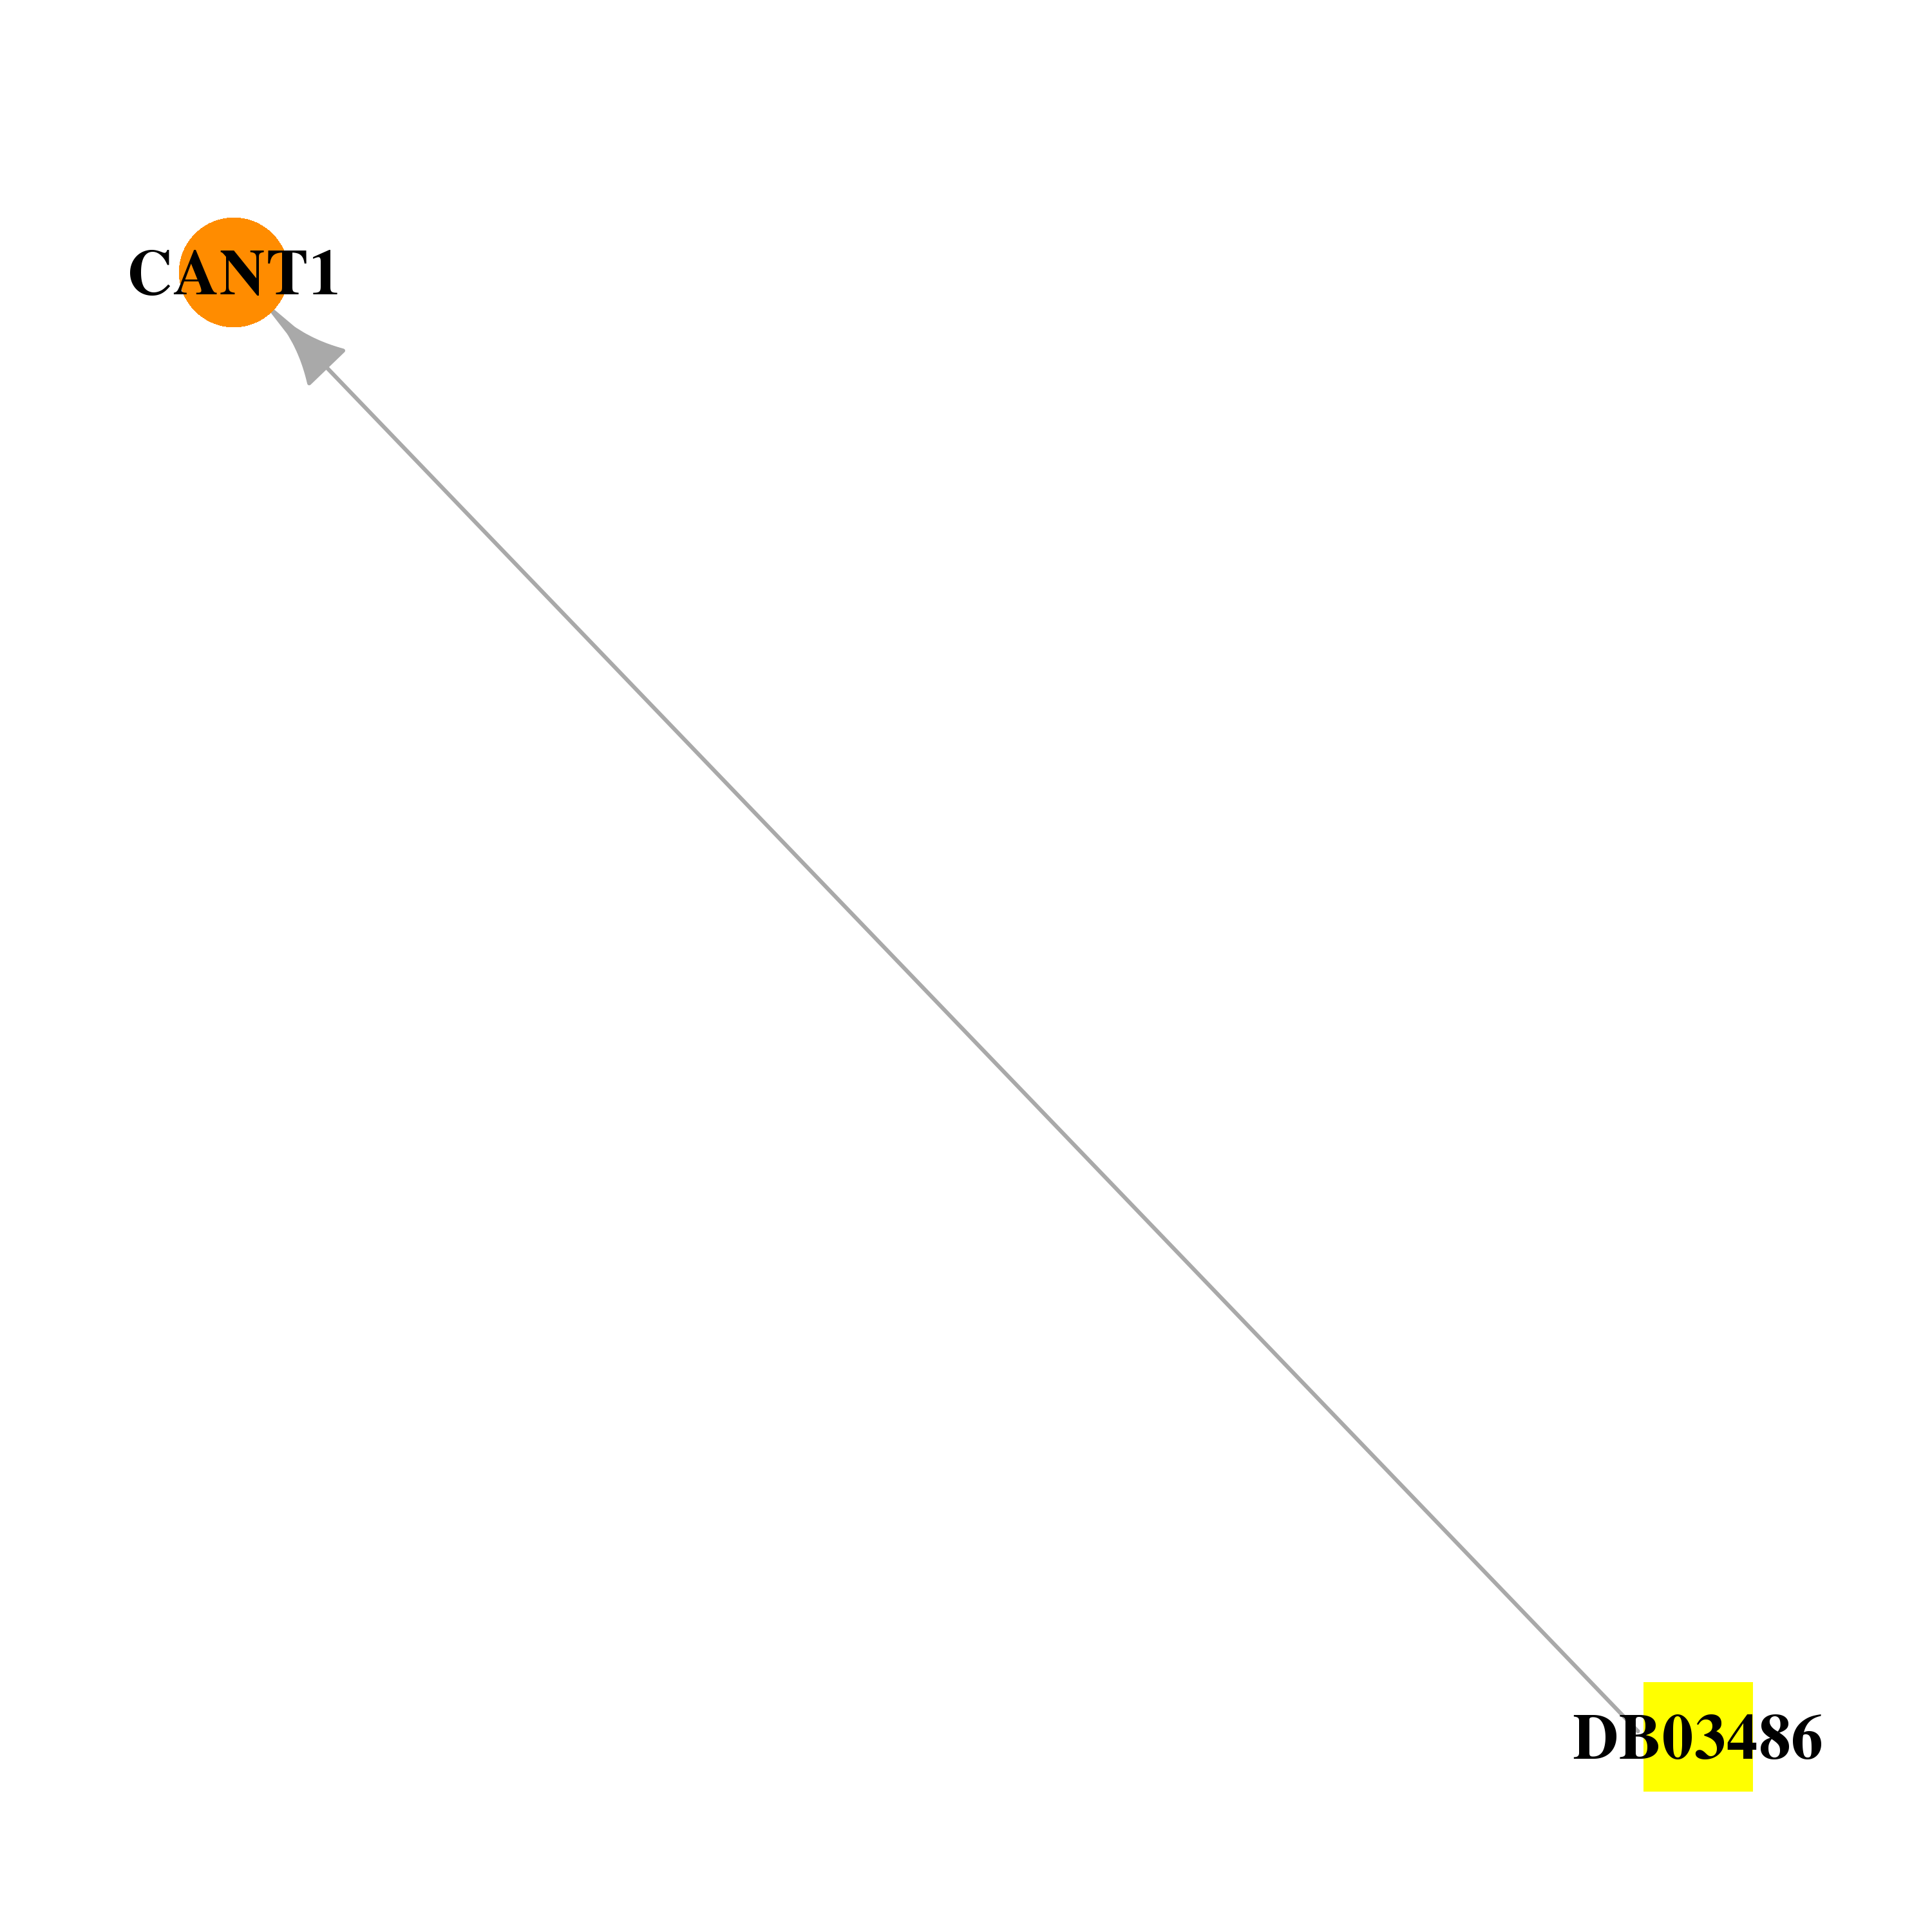 |  |
| DB03754 | calcium activated nucleotidase 1 | experimental | Tris(Hydroxymethyl)Aminomethane | 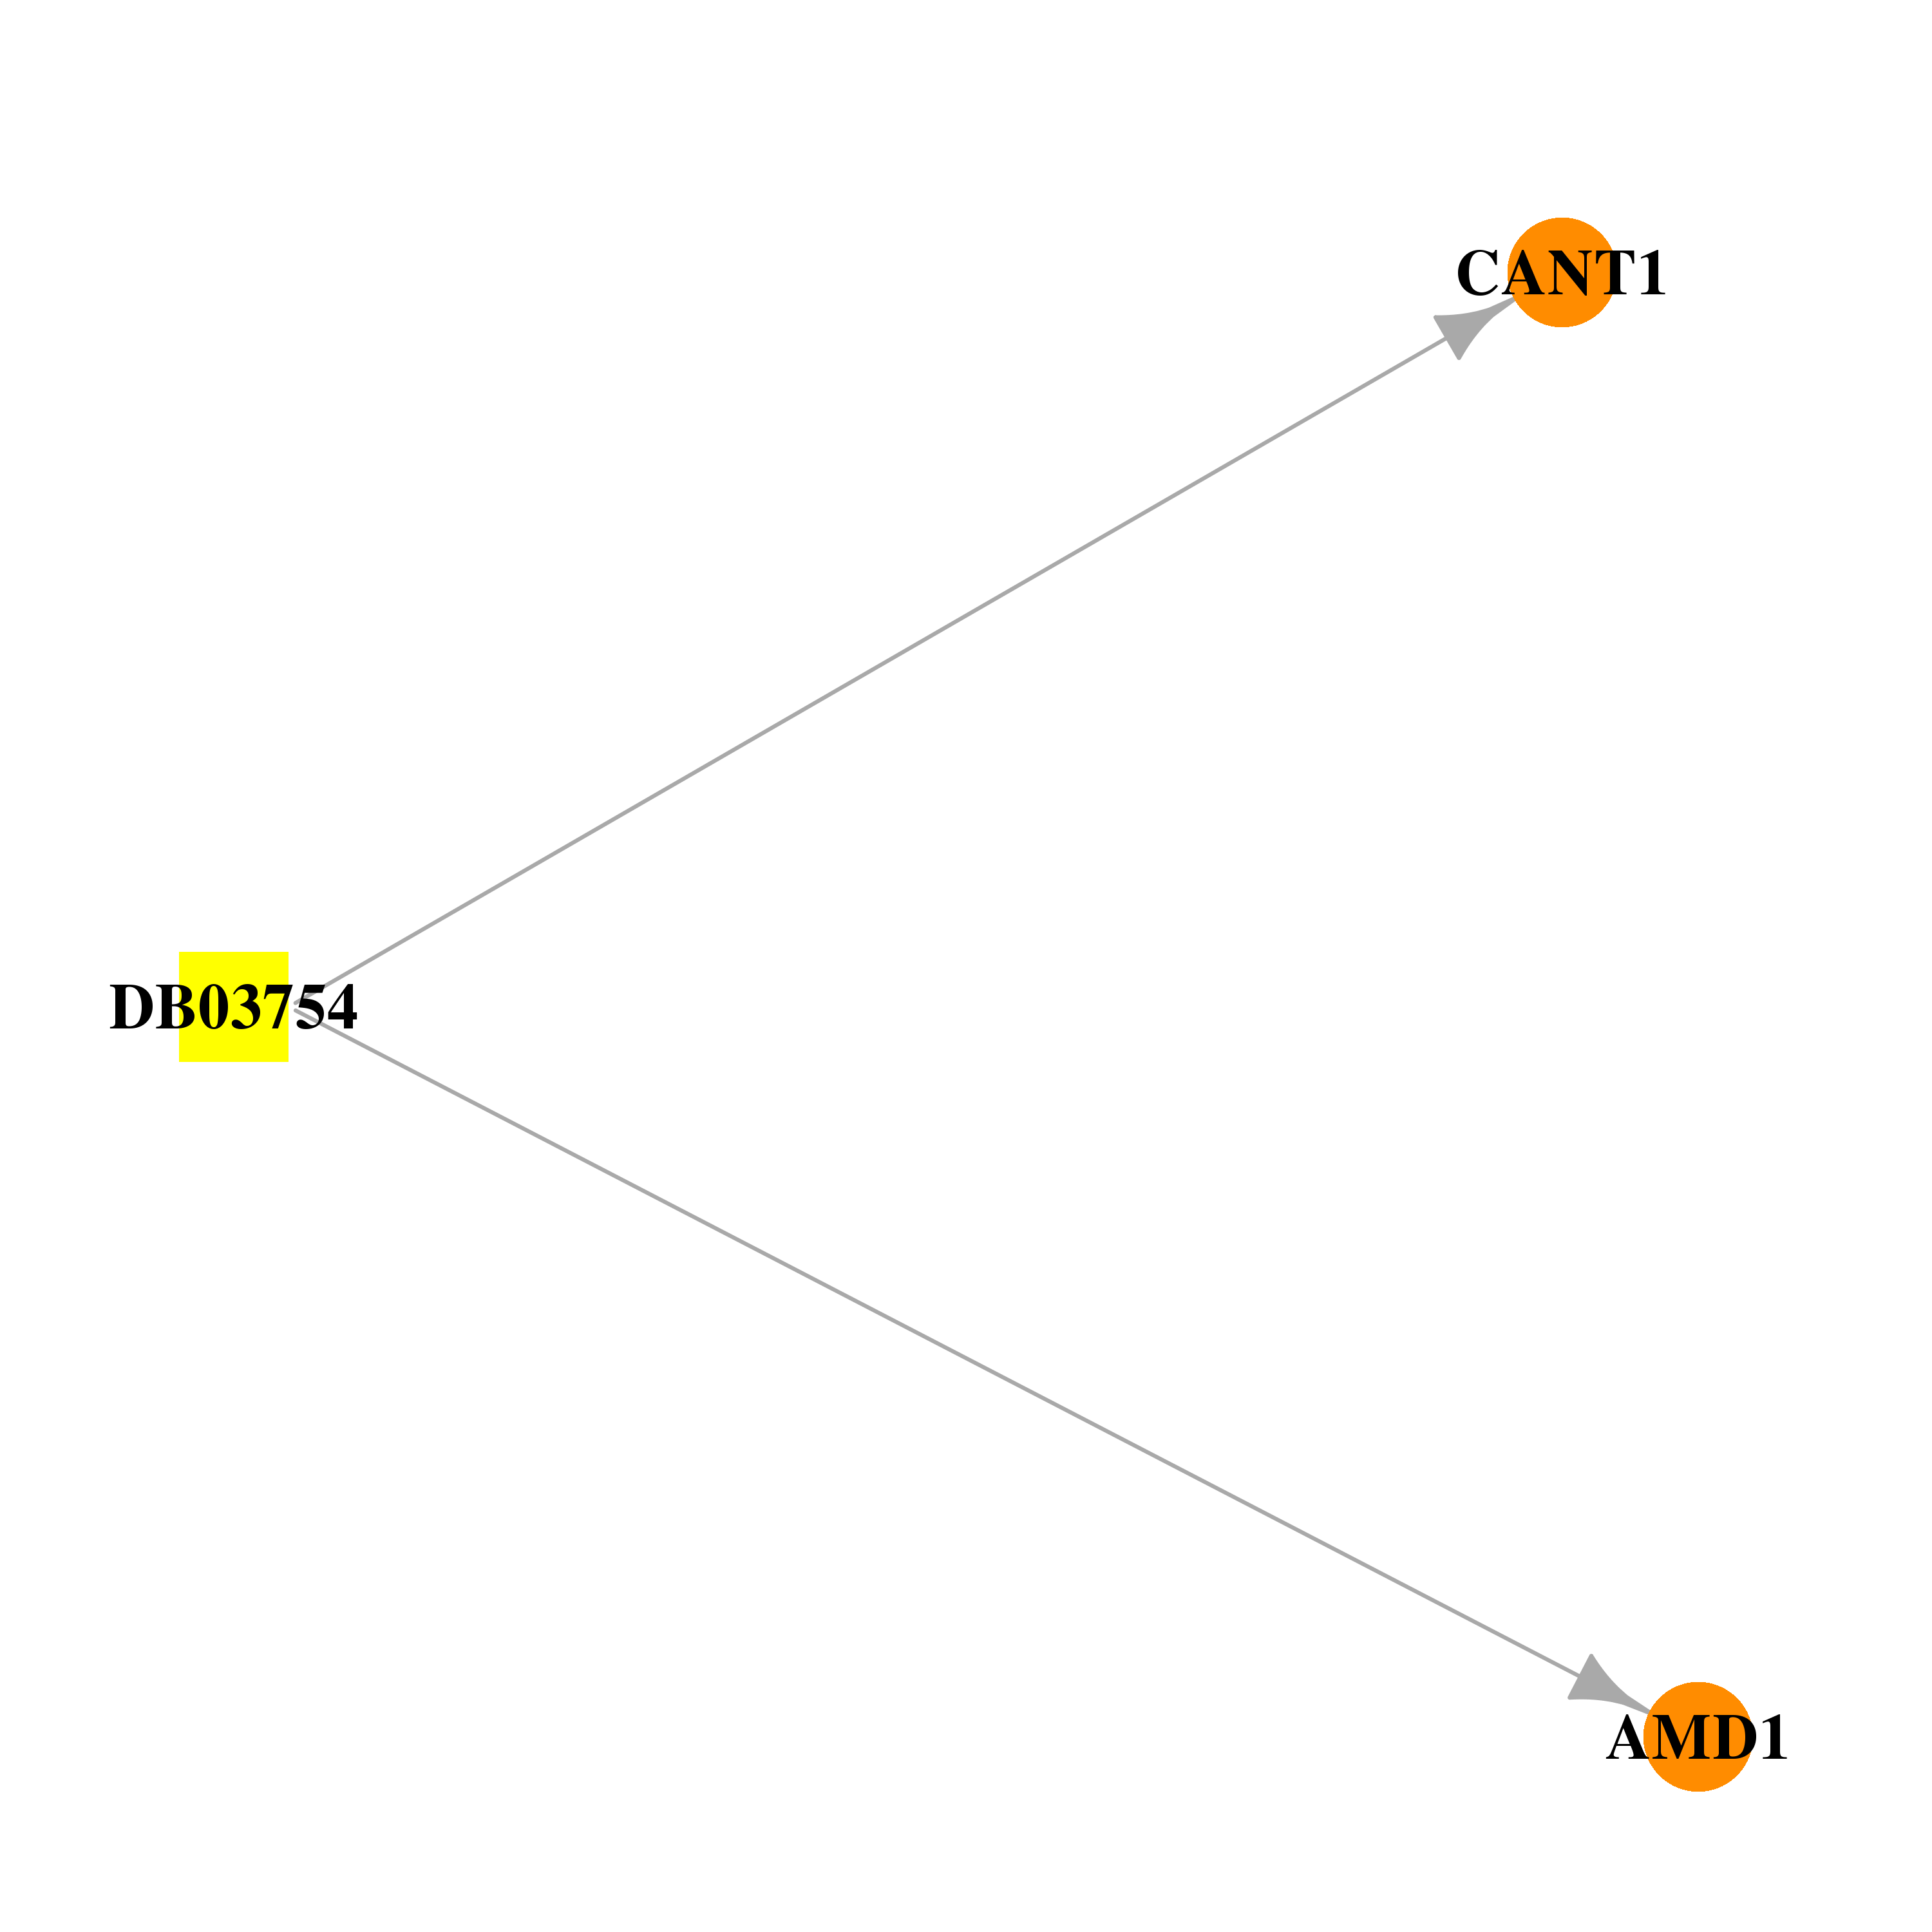 |  |
| Top |
| Cross referenced IDs for CANT1 |
| * We obtained these cross-references from Uniprot database. It covers 150 different DBs, 18 categories. http://www.uniprot.org/help/cross_references_section |
: Open all cross reference information
|
Copyright © 2016-Present - The Univsersity of Texas Health Science Center at Houston @ |