|
||||||||||||||||||||
| |
| Phenotypic Information (metabolism pathway, cancer, disease, phenome) |
| |
| |
| Gene-Gene Network Information: Co-Expression Network, Interacting Genes & KEGG |
| |
|


| Gene Summary for B3GALT6 |
| Basic gene info. | Gene symbol | B3GALT6 |
| Gene name | UDP-Gal:betaGal beta 1,3-galactosyltransferase polypeptide 6 | |
| Synonyms | EDSP2|SEMDJL1|beta3GalT6 | |
| Cytomap | UCSC genome browser: 1p36.33 | |
| Genomic location | chr1 :1167628-1170420 | |
| Type of gene | protein-coding | |
| RefGenes | NM_080605.3, | |
| Ensembl id | ENSG00000176022 | |
| Description | GAG GalTIIUDP-Gal:betaGlcNAc beta 1,3-galactosyltransferase, polypeptide 6beta-1,3-GalTase 6beta-1,3-galactosyltransferase 6beta3Gal-T6galactosyltransferase IIgalactosylxylosylprotein 3-beta-galactosyltransferase | |
| Modification date | 20141207 | |
| dbXrefs | MIM : 615291 | |
| HGNC : HGNC | ||
| Ensembl : ENSG00000176022 | ||
| HPRD : 12509 | ||
| Vega : OTTHUMG00000001813 | ||
| Protein | UniProt: go to UniProt's Cross Reference DB Table | |
| Expression | CleanEX: HS_B3GALT6 | |
| BioGPS: 126792 | ||
| Gene Expression Atlas: ENSG00000176022 | ||
| The Human Protein Atlas: ENSG00000176022 | ||
| Pathway | NCI Pathway Interaction Database: B3GALT6 | |
| KEGG: B3GALT6 | ||
| REACTOME: B3GALT6 | ||
| ConsensusPathDB | ||
| Pathway Commons: B3GALT6 | ||
| Metabolism | MetaCyc: B3GALT6 | |
| HUMANCyc: B3GALT6 | ||
| Regulation | Ensembl's Regulation: ENSG00000176022 | |
| miRBase: chr1 :1,167,628-1,170,420 | ||
| TargetScan: NM_080605 | ||
| cisRED: ENSG00000176022 | ||
| Context | iHOP: B3GALT6 | |
| cancer metabolism search in PubMed: B3GALT6 | ||
| UCL Cancer Institute: B3GALT6 | ||
| Assigned class in ccmGDB | C | |
| Top |
| Phenotypic Information for B3GALT6(metabolism pathway, cancer, disease, phenome) |
| Cancer | CGAP: B3GALT6 |
| Familial Cancer Database: B3GALT6 | |
| * This gene is included in those cancer gene databases. |
|
|
|
|
|
| . | ||||||||||||||
Oncogene 1 | Significant driver gene in | |||||||||||||||||||
| cf) number; DB name 1 Oncogene; http://nar.oxfordjournals.org/content/35/suppl_1/D721.long, 2 Tumor Suppressor gene; https://bioinfo.uth.edu/TSGene/, 3 Cancer Gene Census; http://www.nature.com/nrc/journal/v4/n3/abs/nrc1299.html, 4 CancerGenes; http://nar.oxfordjournals.org/content/35/suppl_1/D721.long, 5 Network of Cancer Gene; http://ncg.kcl.ac.uk/index.php, 1Therapeutic Vulnerabilities in Cancer; http://cbio.mskcc.org/cancergenomics/statius/ |
| REACTOME_METABOLISM_OF_CARBOHYDRATES | |
| Mutations for B3GALT6 |
| * Under tables are showing count per each tissue to give us broad intuition about tissue specific mutation patterns.You can go to the detailed page for each mutation database's web site. |
| There's no structural variation information in COSMIC data for this gene. |
| * From mRNA Sanger sequences, Chitars2.0 arranged chimeric transcripts. This table shows B3GALT6 related fusion information. |
| ID | Head Gene | Tail Gene | Accession | Gene_a | qStart_a | qEnd_a | Chromosome_a | tStart_a | tEnd_a | Gene_a | qStart_a | qEnd_a | Chromosome_a | tStart_a | tEnd_a |
| AI347131 | B3GALT6 | 1 | 393 | 1 | 1169332 | 1170352 | B3GALT6 | 388 | 451 | 1 | 1169946 | 1170009 | |
| Top |
| There's no copy number variation information in COSMIC data for this gene. |
| Top |
|
 |
| Top |
| Stat. for Non-Synonymous SNVs (# total SNVs=3) | (# total SNVs=2) |
 |  |
(# total SNVs=0) | (# total SNVs=0) |
| Top |
| * When you move the cursor on each content, you can see more deailed mutation information on the Tooltip. Those are primary_site,primary_histology,mutation(aa),pubmedID. |
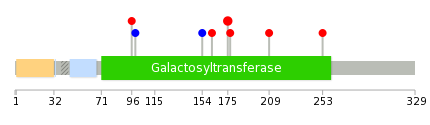
| GRCh37 position | Mutation(aa) | Unique sampleID count |
| chr1:1168182-1168182 | p.P175L | 2 |
| chr1:1167944-1167944 | p.V96L | 1 |
| chr1:1167955-1167955 | p.A99A | 1 |
| chr1:1168120-1168120 | p.K154K | 1 |
| chr1:1168142-1168142 | p.R162W | 1 |
| chr1:1168187-1168187 | p.R177C | 1 |
| chr1:1168284-1168284 | p.Y209C | 1 |
| chr1:1168415-1168415 | p.D253N | 1 |
| Top |
|
 |
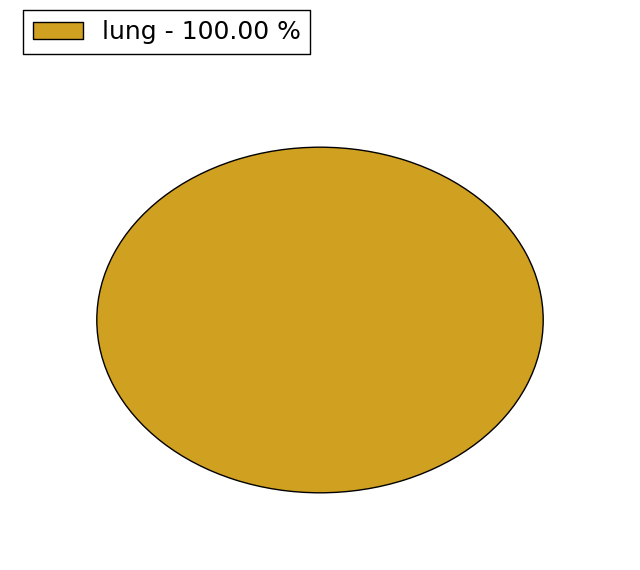
| Point Mutation/ Tissue ID | 1 | 2 | 3 | 4 | 5 | 6 | 7 | 8 | 9 | 10 | 11 | 12 | 13 | 14 | 15 | 16 | 17 | 18 | 19 | 20 |
| # sample | 1 | 1 | 2 | 2 | 1 | |||||||||||||||
| # mutation | 1 | 1 | 2 | 1 | 1 | |||||||||||||||
| nonsynonymous SNV | 1 | 1 | 1 | 1 | 1 | |||||||||||||||
| synonymous SNV | 1 |
| cf) Tissue ID; Tissue type (1; BLCA[Bladder Urothelial Carcinoma], 2; BRCA[Breast invasive carcinoma], 3; CESC[Cervical squamous cell carcinoma and endocervical adenocarcinoma], 4; COAD[Colon adenocarcinoma], 5; GBM[Glioblastoma multiforme], 6; Glioma Low Grade, 7; HNSC[Head and Neck squamous cell carcinoma], 8; KICH[Kidney Chromophobe], 9; KIRC[Kidney renal clear cell carcinoma], 10; KIRP[Kidney renal papillary cell carcinoma], 11; LAML[Acute Myeloid Leukemia], 12; LUAD[Lung adenocarcinoma], 13; LUSC[Lung squamous cell carcinoma], 14; OV[Ovarian serous cystadenocarcinoma ], 15; PAAD[Pancreatic adenocarcinoma], 16; PRAD[Prostate adenocarcinoma], 17; SKCM[Skin Cutaneous Melanoma], 18:STAD[Stomach adenocarcinoma], 19:THCA[Thyroid carcinoma], 20:UCEC[Uterine Corpus Endometrial Carcinoma]) |
| Top |
| * We represented just top 10 SNVs. When you move the cursor on each content, you can see more deailed mutation information on the Tooltip. Those are primary_site, primary_histology, mutation(aa), pubmedID. |
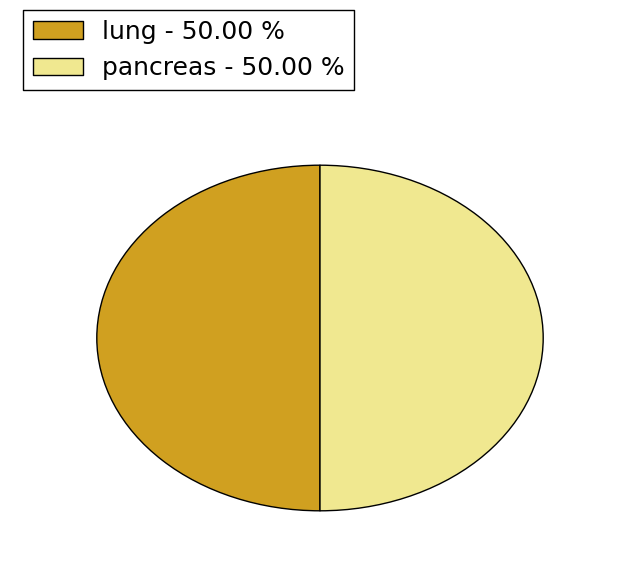
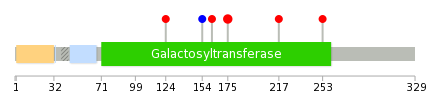
| Genomic Position | Mutation(aa) | Unique sampleID count |
| chr1:1168182 | p.P175L | 2 |
| chr1:1168029 | p.A124G | 1 |
| chr1:1168120 | p.K154K | 1 |
| chr1:1168142 | p.R162W | 1 |
| chr1:1168307 | p.G217C | 1 |
| chr1:1168415 | p.D253N | 1 |
| * Copy number data were extracted from TCGA using R package TCGA-Assembler. The URLs of all public data files on TCGA DCC data server were gathered on Jan-05-2015. Function ProcessCNAData in TCGA-Assembler package was used to obtain gene-level copy number value which is calculated as the average copy number of the genomic region of a gene. |
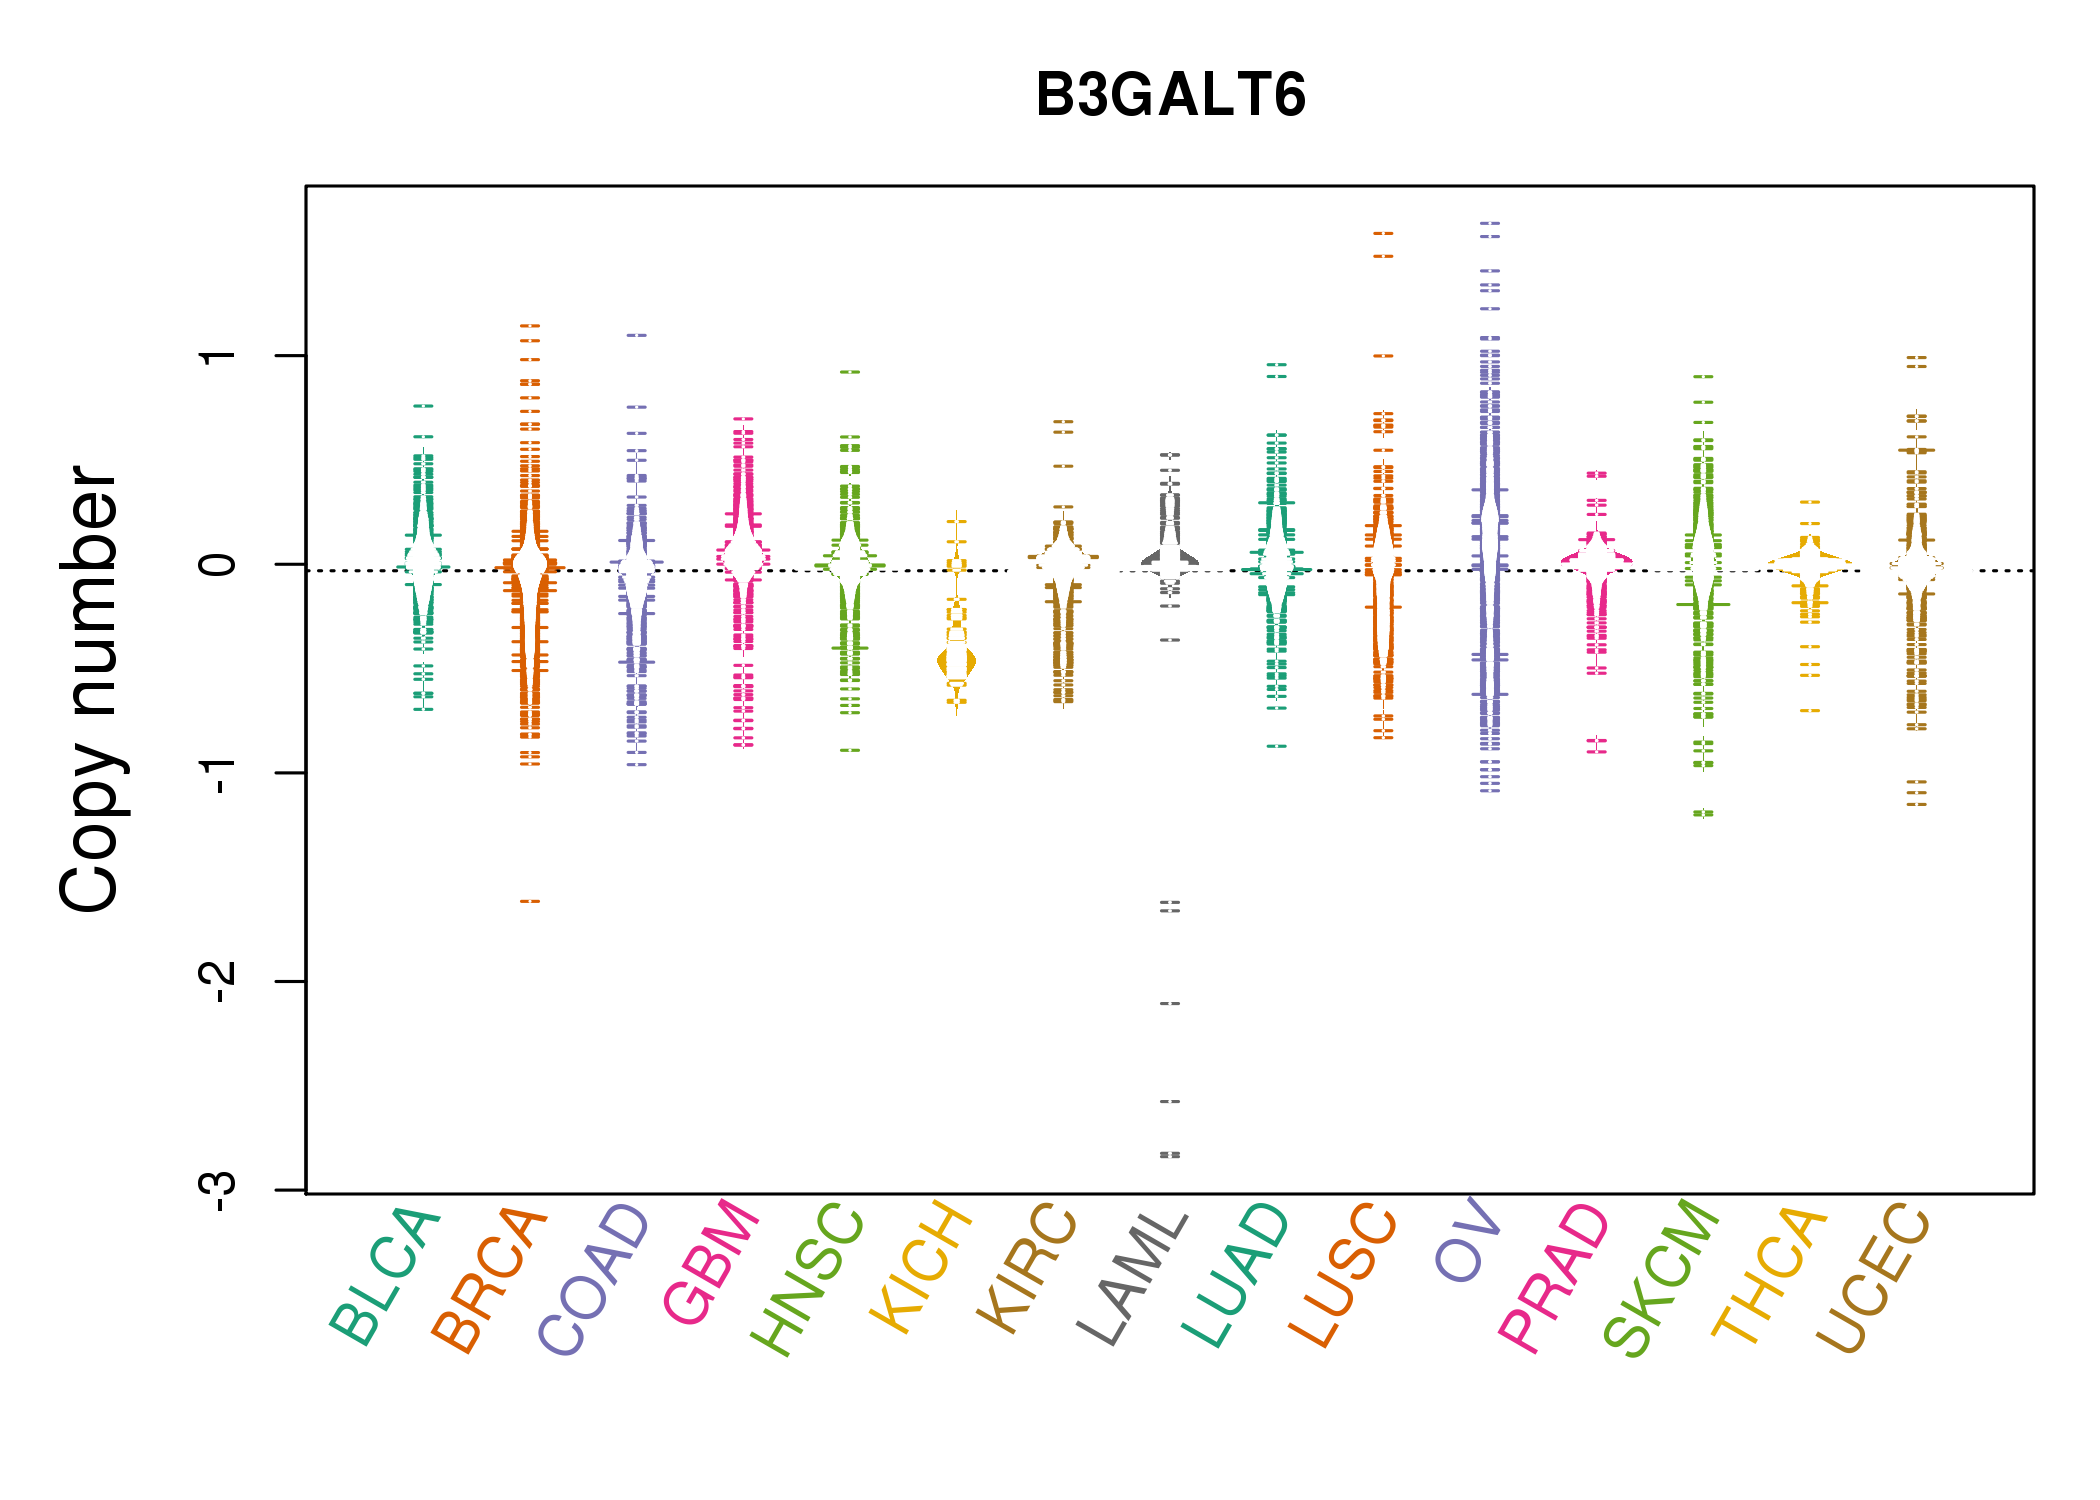 |
| cf) Tissue ID[Tissue type]: BLCA[Bladder Urothelial Carcinoma], BRCA[Breast invasive carcinoma], CESC[Cervical squamous cell carcinoma and endocervical adenocarcinoma], COAD[Colon adenocarcinoma], GBM[Glioblastoma multiforme], Glioma Low Grade, HNSC[Head and Neck squamous cell carcinoma], KICH[Kidney Chromophobe], KIRC[Kidney renal clear cell carcinoma], KIRP[Kidney renal papillary cell carcinoma], LAML[Acute Myeloid Leukemia], LUAD[Lung adenocarcinoma], LUSC[Lung squamous cell carcinoma], OV[Ovarian serous cystadenocarcinoma ], PAAD[Pancreatic adenocarcinoma], PRAD[Prostate adenocarcinoma], SKCM[Skin Cutaneous Melanoma], STAD[Stomach adenocarcinoma], THCA[Thyroid carcinoma], UCEC[Uterine Corpus Endometrial Carcinoma] |
| Top |
| Gene Expression for B3GALT6 |
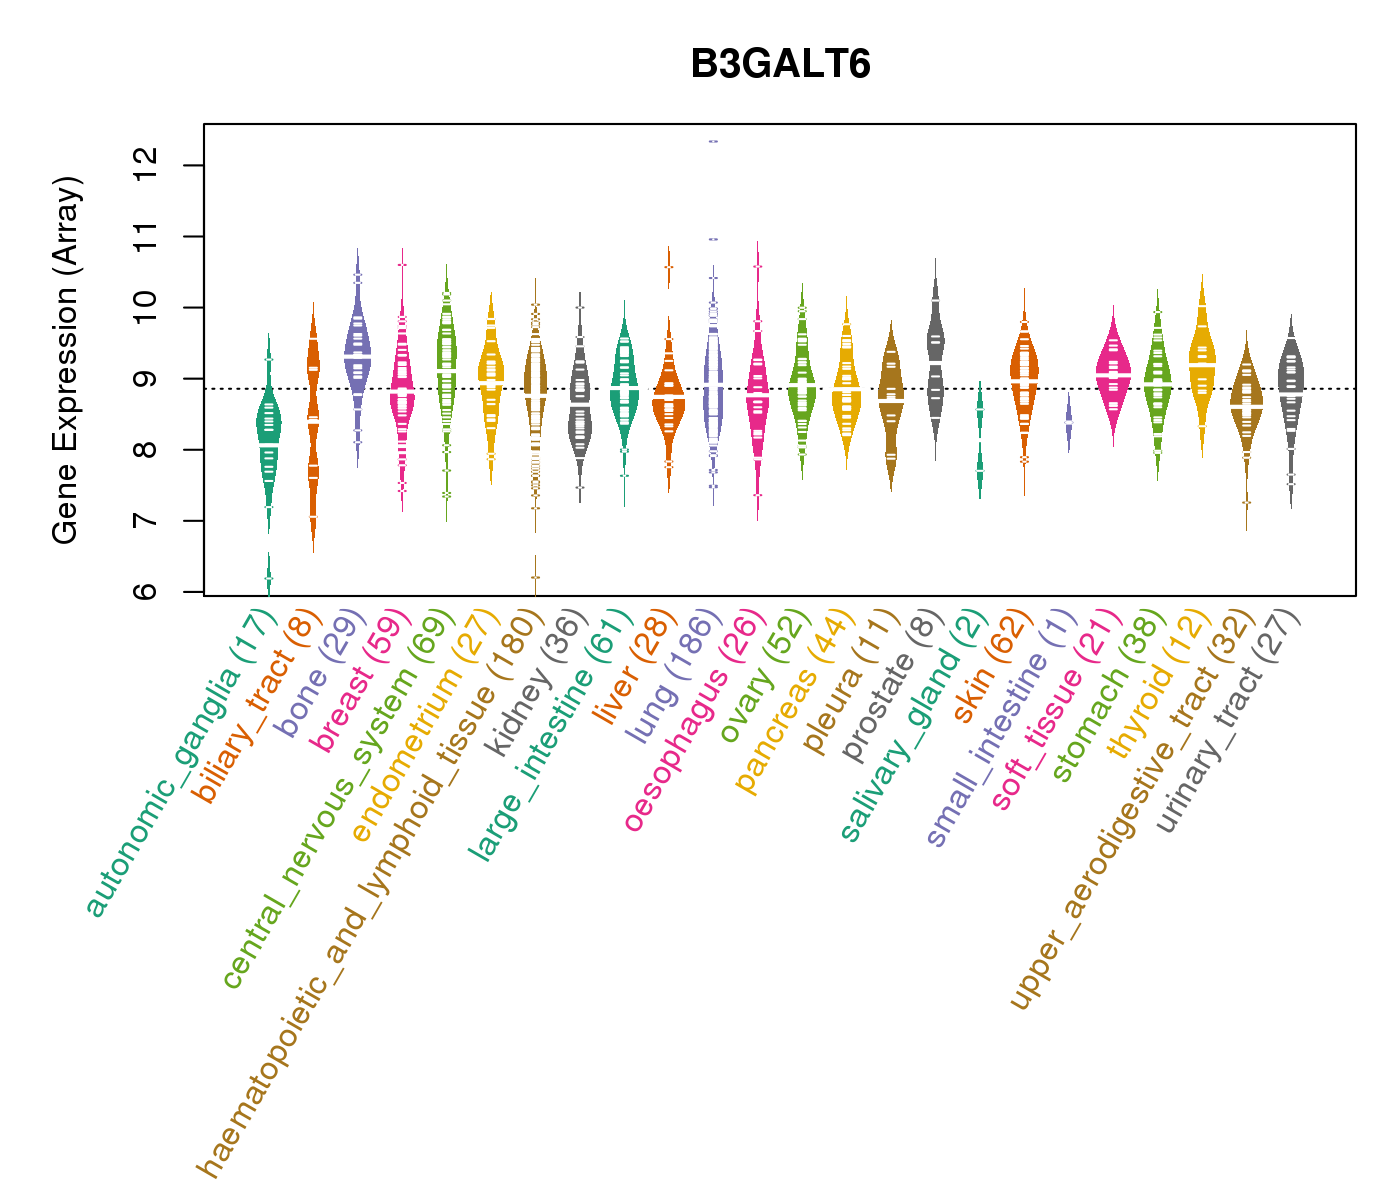
| * CCLE gene expression data were extracted from CCLE_Expression_Entrez_2012-10-18.res: Gene-centric RMA-normalized mRNA expression data. |
 |
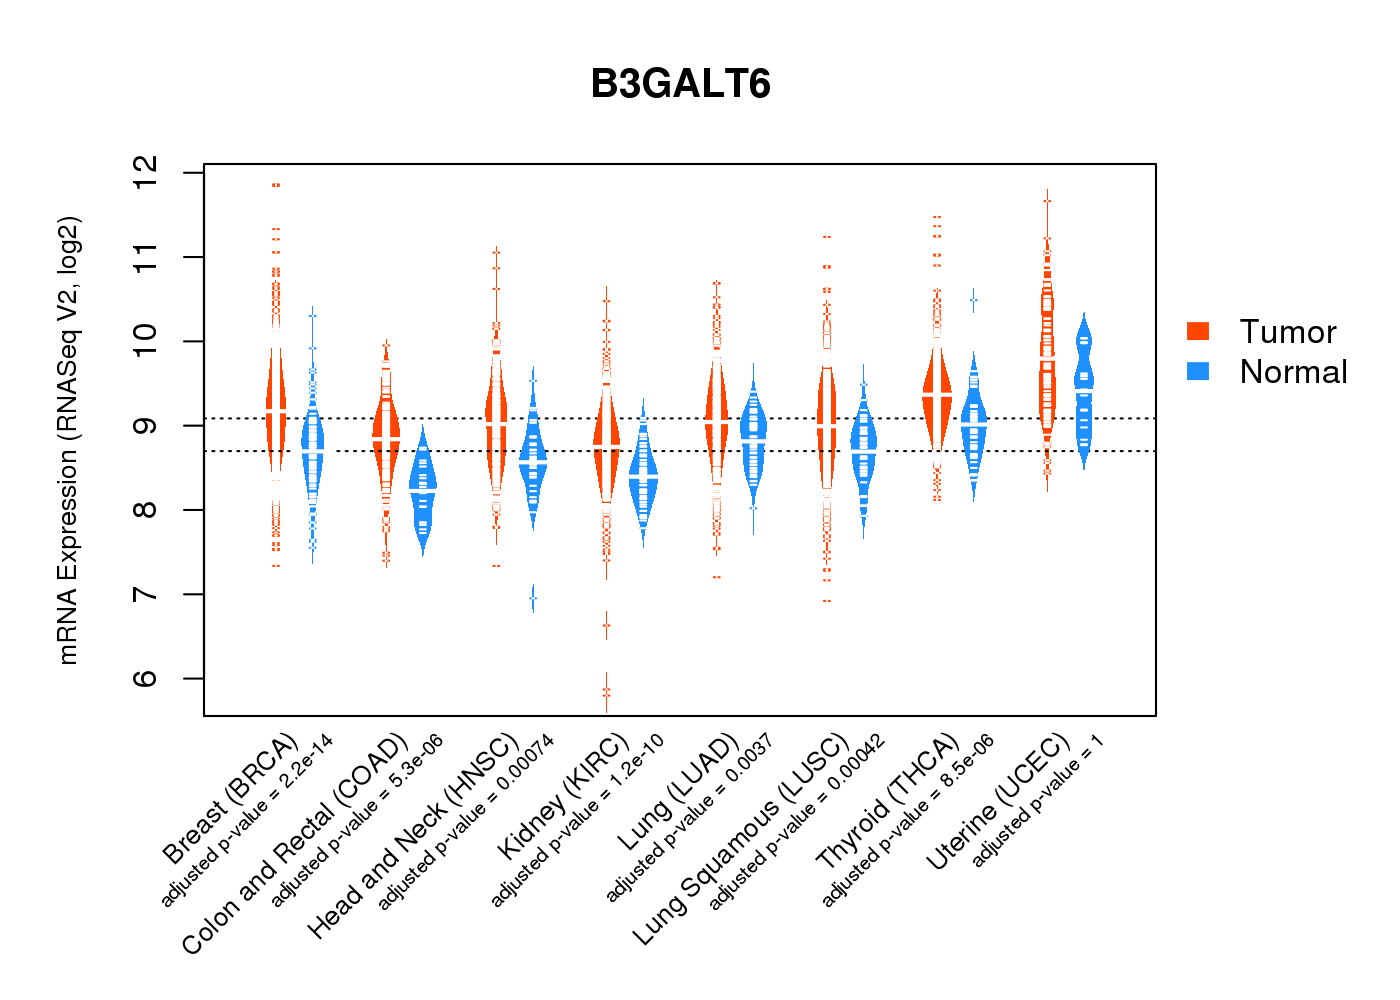
| * Normalized gene expression data of RNASeqV2 was extracted from TCGA using R package TCGA-Assembler. The URLs of all public data files on TCGA DCC data server were gathered at Jan-05-2015. Only eight cancer types have enough normal control samples for differential expression analysis. (t test, adjusted p<0.05 (using Benjamini-Hochberg FDR)) |
 |
| Top |
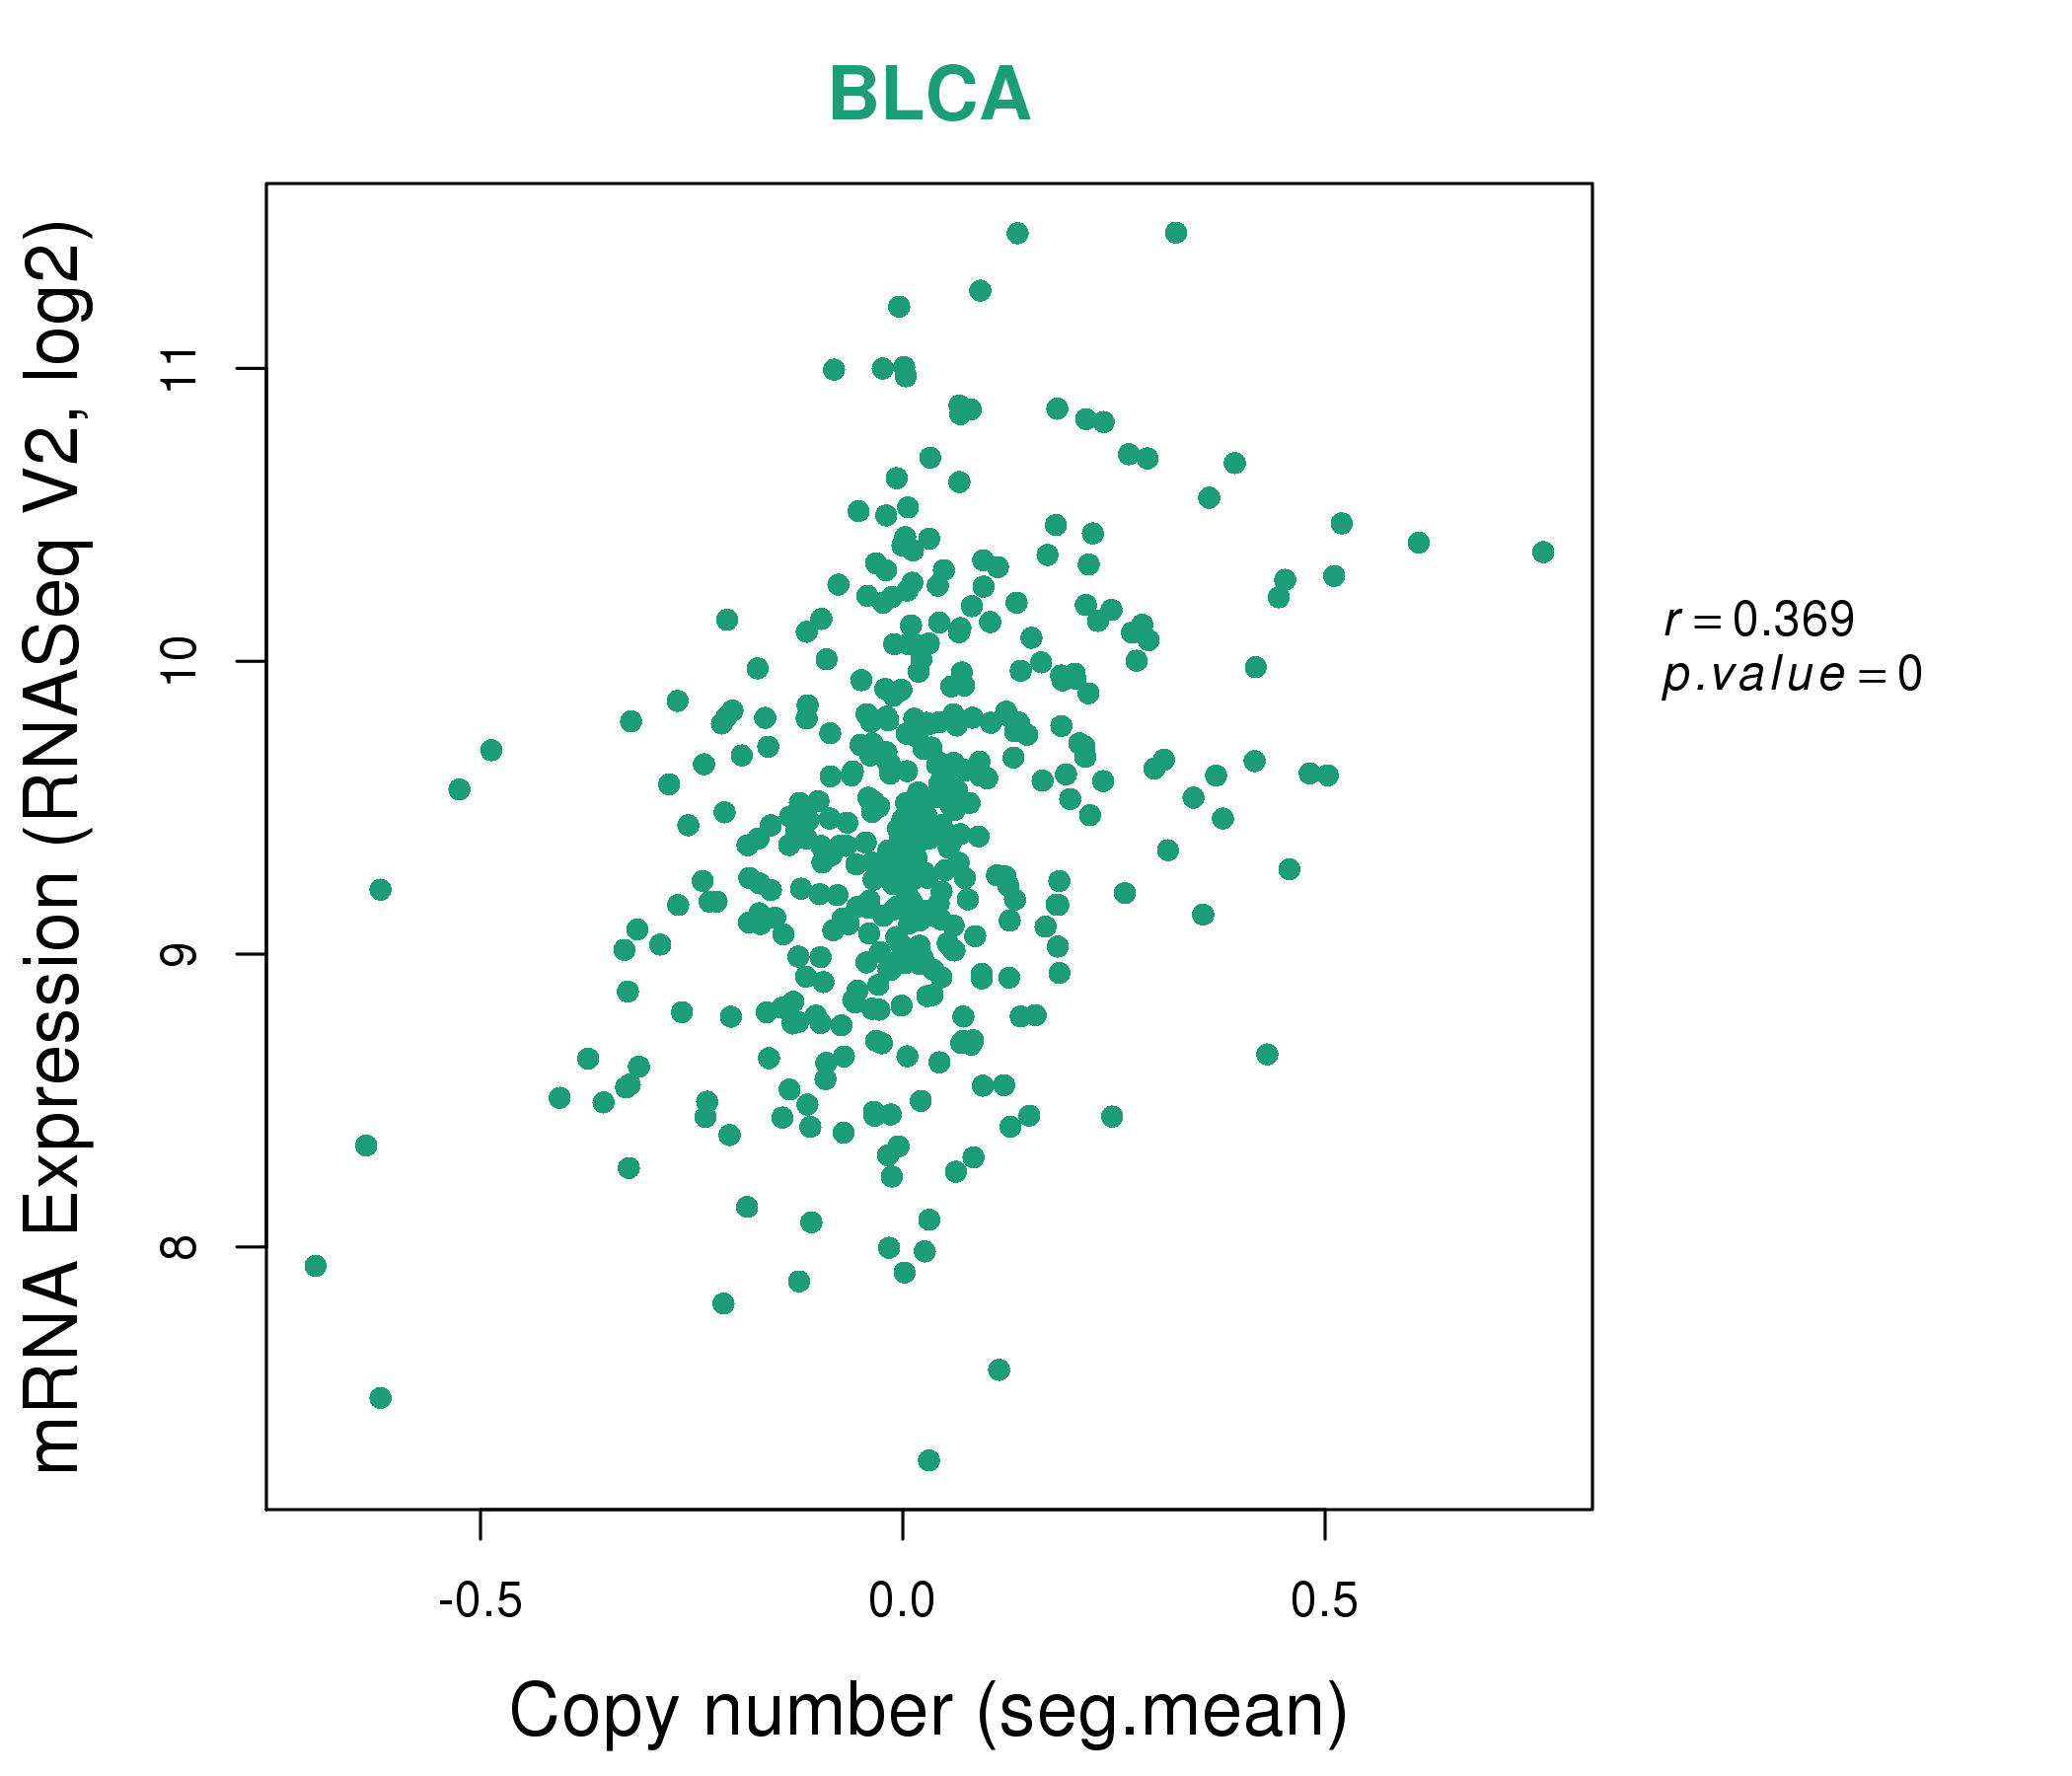
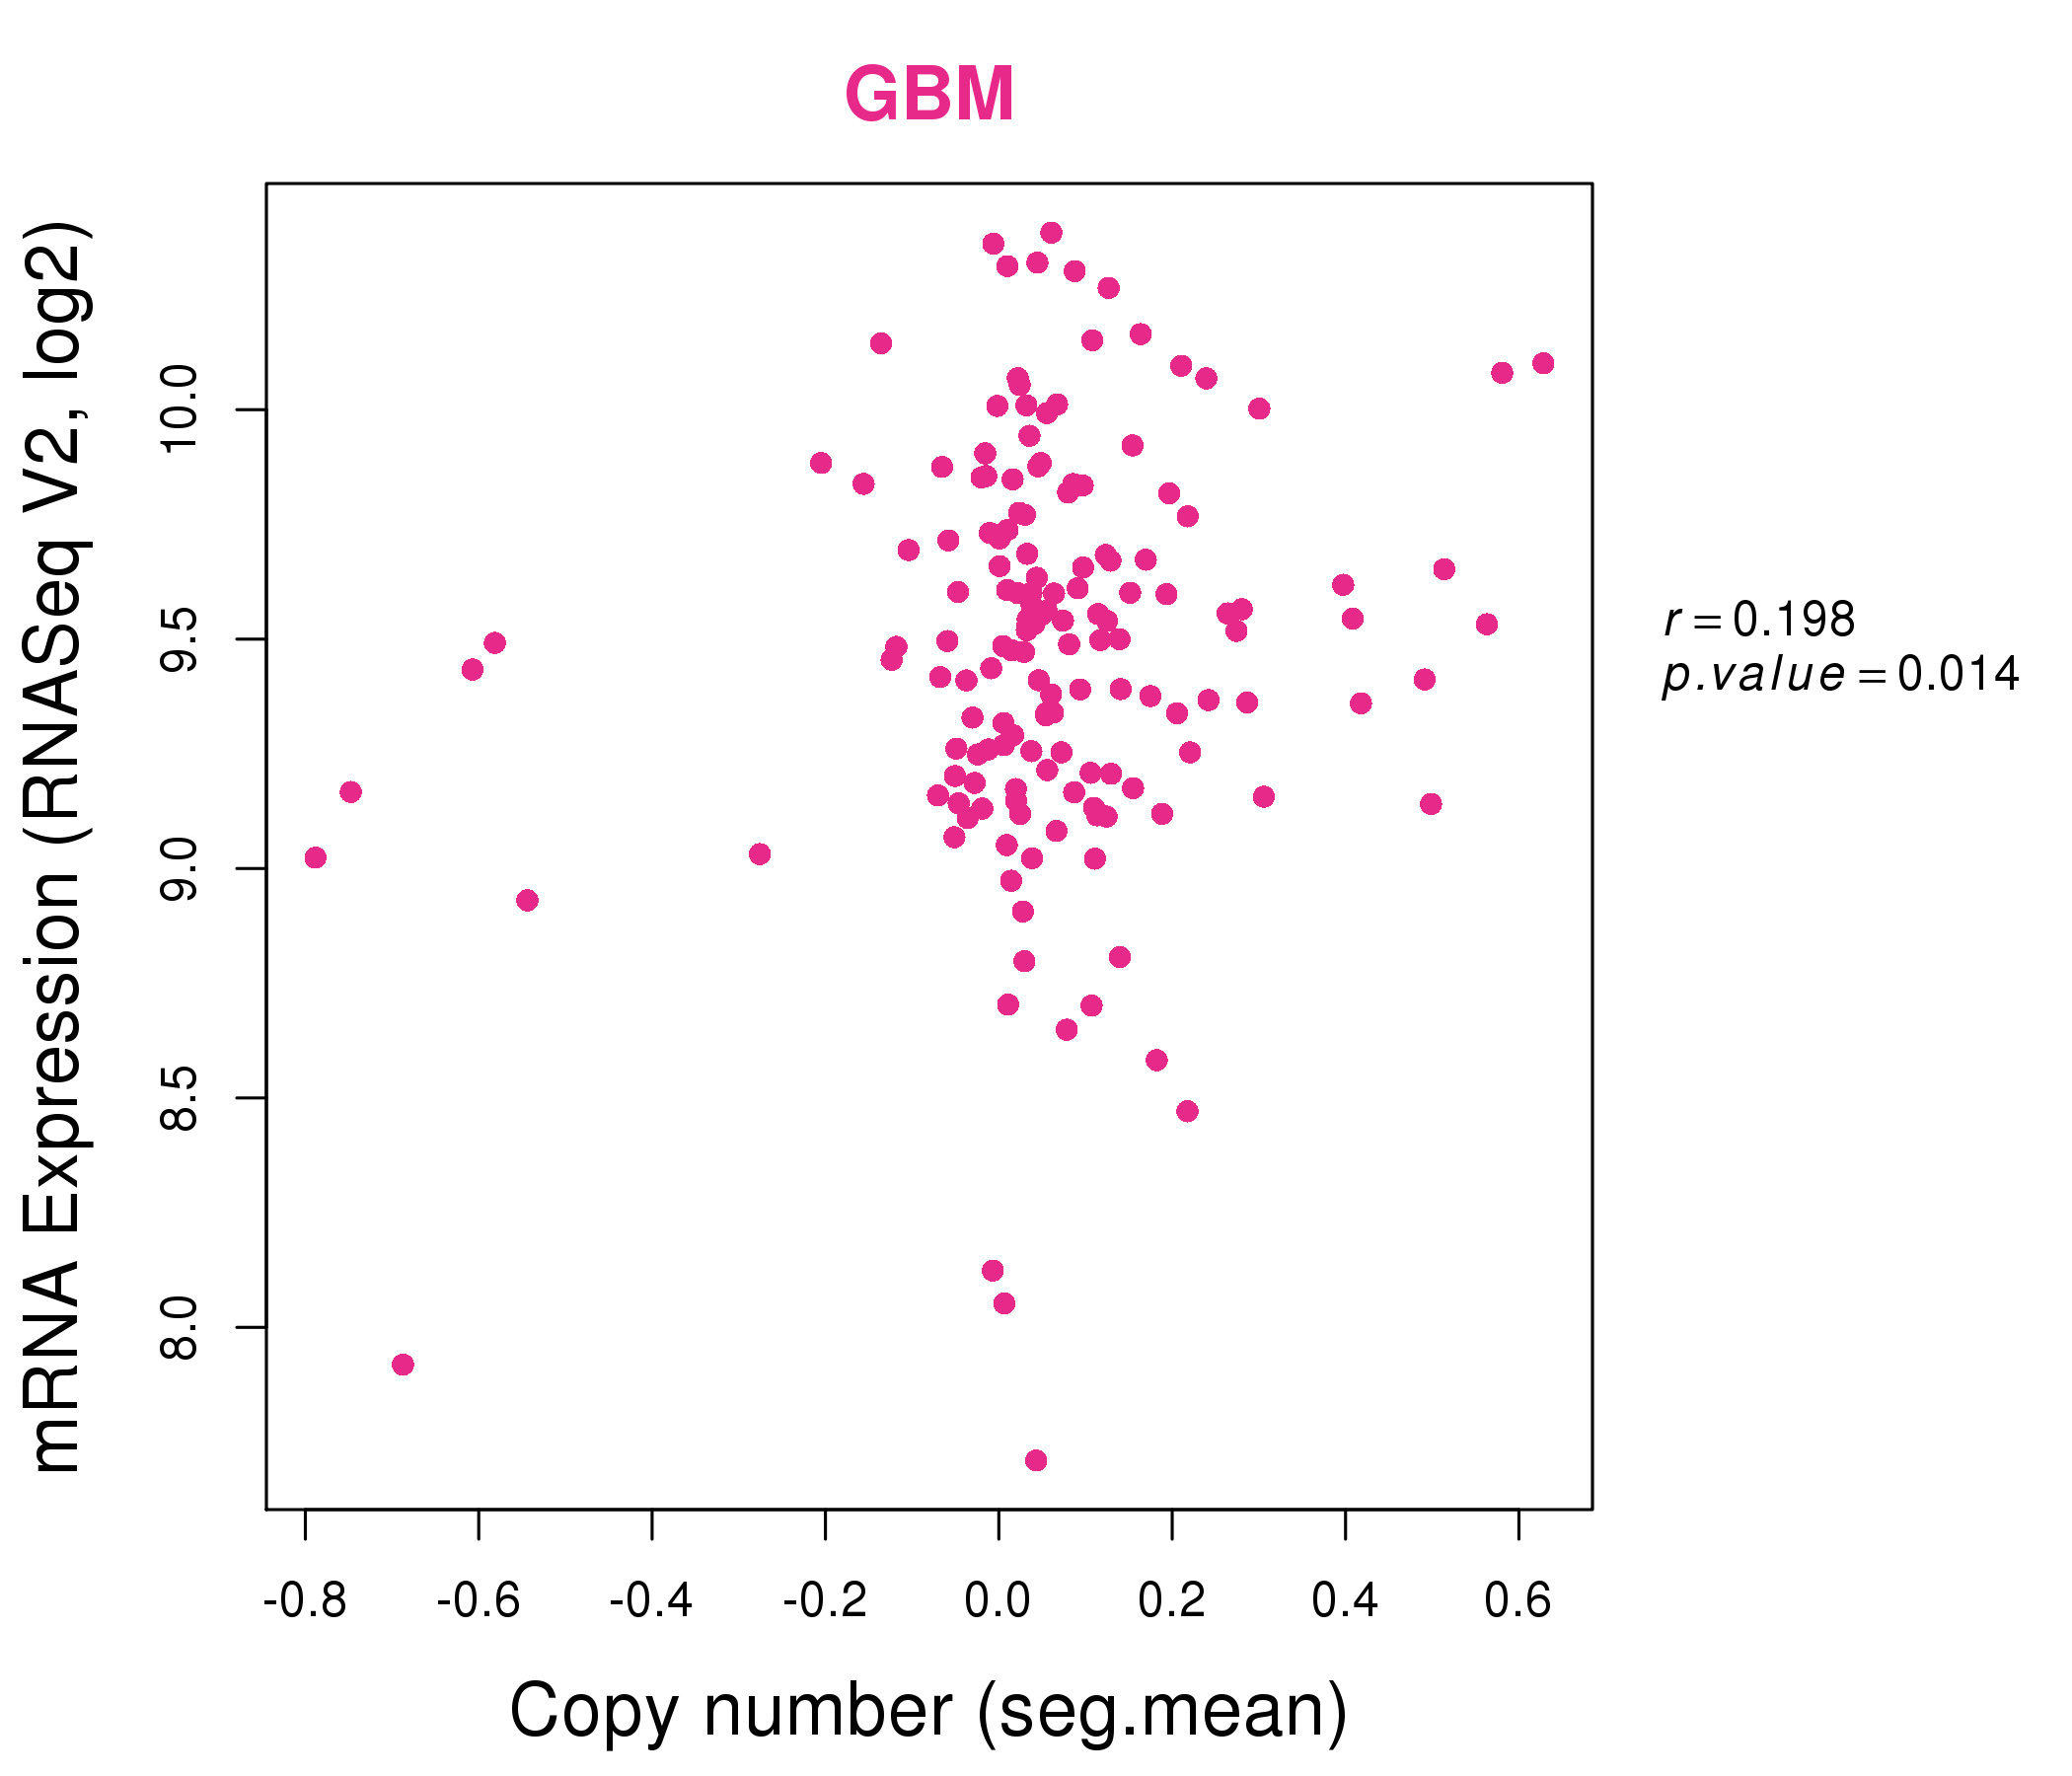
| * This plots show the correlation between CNV and gene expression. |
: Open all plots for all cancer types
 |
|
 |
|

| Top |
| Gene-Gene Network Information |
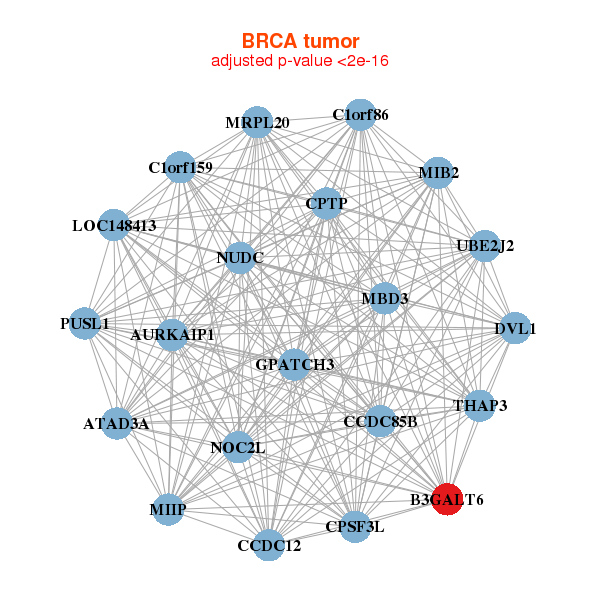
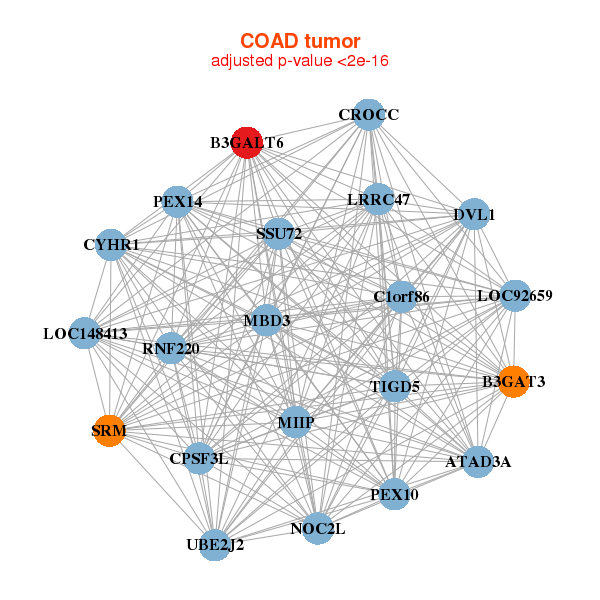
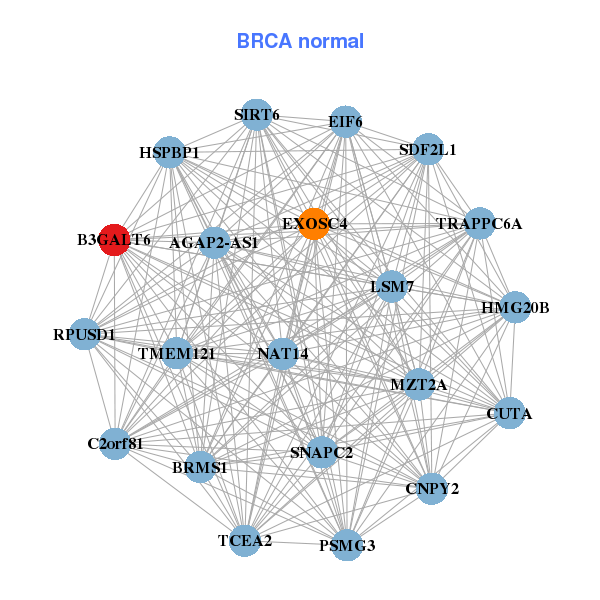
| * Co-Expression network figures were drawn using R package igraph. Only the top 20 genes with the highest correlations were shown. Red circle: input gene, orange circle: cell metabolism gene, sky circle: other gene |
: Open all plots for all cancer types
 |
|
| ATAD3A,AURKAIP1,B3GALT6,C1orf159,C1orf86,CCDC12,CCDC85B, CPSF3L,DVL1,CPTP,GPATCH3,LOC148413,MBD3,MIB2, MIIP,MRPL20,NOC2L,NUDC,PUSL1,THAP3,UBE2J2 | B3GALT6,BRMS1,C2orf81,CNPY2,CUTA,EIF6,EXOSC4, MZT2A,HMG20B,HSPBP1,AGAP2-AS1,LSM7,NAT14,PSMG3, RPUSD1,SDF2L1,SIRT6,SNAPC2,TCEA2,TMEM121,TRAPPC6A |
 |
|
| ATAD3A,B3GALT6,B3GAT3,C1orf86,CPSF3L,CROCC,CYHR1, DVL1,LOC148413,LOC92659,LRRC47,MBD3,MIIP,NOC2L, PEX10,PEX14,RNF220,SRM,SSU72,TIGD5,UBE2J2 | CEP131,B3GALT6,CABIN1,CLEC11A,DHX30,DOHH,EPHB4, UBALD1,KLHL26,MAP1S,MAP3K10,MBD3,MIER2,PELP1, SCAF1,SOX18,TRIM28,UBE2O,ZDHHC8,ZNF746,ZNF777 |
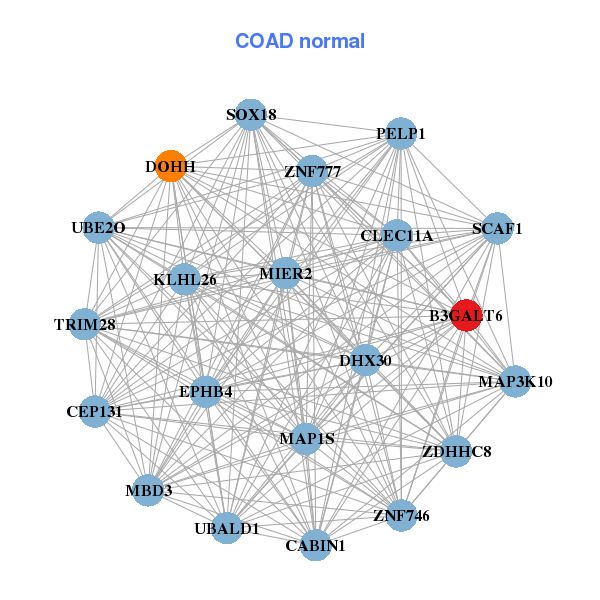
| * Co-Expression network figures were drawn using R package igraph. Only the top 20 genes with the highest correlations were shown. Red circle: input gene, orange circle: cell metabolism gene, sky circle: other gene |
: Open all plots for all cancer types
| Top |
: Open all interacting genes' information including KEGG pathway for all interacting genes from DAVID
| Top |
| Pharmacological Information for B3GALT6 |
| There's no related Drug. |
| Top |
| Cross referenced IDs for B3GALT6 |
| * We obtained these cross-references from Uniprot database. It covers 150 different DBs, 18 categories. http://www.uniprot.org/help/cross_references_section |
: Open all cross reference information
|
Copyright © 2016-Present - The Univsersity of Texas Health Science Center at Houston @ |