|
||||||||||||||||||||||||||||||||||||||||||||||||||||||||||||||||||||||||||||||||||||||||||||||||||||||||||||||||||||||||||||||||||||||||||||||||||||||||||||||||||||||||||||||||||||||||||||||||||||||||||||||||||||||||||||||||||||||||||||||||||||||||||||||||||||||||||||||||||||||||||||||||||||||||||||||||||||||||||
| |
| Phenotypic Information (metabolism pathway, cancer, disease, phenome) |
| |
| |
| Gene-Gene Network Information: Co-Expression Network, Interacting Genes & KEGG |
| |
|


| Gene Summary for PIGU |
| Basic gene info. | Gene symbol | PIGU |
| Gene name | phosphatidylinositol glycan anchor biosynthesis, class U | |
| Synonyms | CDC91L1|GAB1 | |
| Cytomap | UCSC genome browser: 20q11.22 | |
| Genomic location | chr20 :33148345-33265089 | |
| Type of gene | protein-coding | |
| RefGenes | NM_080476.4, | |
| Ensembl id | ENSG00000101464 | |
| Description | CDC91 (cell division cycle 91, S. cerevisiae, homolog)-like 1GPI transamidase component PIG-UGPI transamidase subunitcell division cycle 91-like 1 proteincell division cycle protein 91-like 1phosphatidylinositol glycan anchor biosynthesis class U pro | |
| Modification date | 20141207 | |
| dbXrefs | MIM : 608528 | |
| HGNC : HGNC | ||
| Ensembl : ENSG00000101464 | ||
| HPRD : 12250 | ||
| Vega : OTTHUMG00000032304 | ||
| Protein | UniProt: Q9H490 go to UniProt's Cross Reference DB Table | |
| Expression | CleanEX: HS_PIGU | |
| BioGPS: 128869 | ||
| Gene Expression Atlas: ENSG00000101464 | ||
| The Human Protein Atlas: ENSG00000101464 | ||
| Pathway | NCI Pathway Interaction Database: PIGU | |
| KEGG: PIGU | ||
| REACTOME: PIGU | ||
| ConsensusPathDB | ||
| Pathway Commons: PIGU | ||
| Metabolism | MetaCyc: PIGU | |
| HUMANCyc: PIGU | ||
| Regulation | Ensembl's Regulation: ENSG00000101464 | |
| miRBase: chr20 :33,148,345-33,265,089 | ||
| TargetScan: NM_080476 | ||
| cisRED: ENSG00000101464 | ||
| Context | iHOP: PIGU | |
| cancer metabolism search in PubMed: PIGU | ||
| UCL Cancer Institute: PIGU | ||
| Assigned class in ccmGDB | B - This gene belongs to cancer gene. | |
| Top |
| Phenotypic Information for PIGU(metabolism pathway, cancer, disease, phenome) |
| Cancer | CGAP: PIGU |
| Familial Cancer Database: PIGU | |
| * This gene is included in those cancer gene databases. |
|
|
|
|
|
| . | ||||||||||||||||||||||||||||||||||||||||||||||||||||||||||||||||||||||||||||||||||||||||||||||||||||||||||||||||||||||||||||||||||||||||||||||||||||||||||||||||||||||||||||||||||||||||||||||||||||||||||||||||||||||||||||||||||||||||||||||||||||||||||||||||||||||||||||||||||||||||||||||||||||||||||||||||||||
Oncogene 1 | Significant driver gene in | |||||||||||||||||||||||||||||||||||||||||||||||||||||||||||||||||||||||||||||||||||||||||||||||||||||||||||||||||||||||||||||||||||||||||||||||||||||||||||||||||||||||||||||||||||||||||||||||||||||||||||||||||||||||||||||||||||||||||||||||||||||||||||||||||||||||||||||||||||||||||||||||||||||||||||||||||||||||||
| cf) number; DB name 1 Oncogene; http://nar.oxfordjournals.org/content/35/suppl_1/D721.long, 2 Tumor Suppressor gene; https://bioinfo.uth.edu/TSGene/, 3 Cancer Gene Census; http://www.nature.com/nrc/journal/v4/n3/abs/nrc1299.html, 4 CancerGenes; http://nar.oxfordjournals.org/content/35/suppl_1/D721.long, 5 Network of Cancer Gene; http://ncg.kcl.ac.uk/index.php, 1Therapeutic Vulnerabilities in Cancer; http://cbio.mskcc.org/cancergenomics/statius/ |
| REACTOME_METABOLISM_OF_PROTEINS | |
| OMIM | 608528; gene. |
| Orphanet | |
| Disease | KEGG Disease: PIGU |
| MedGen: PIGU (Human Medical Genetics with Condition) | |
| ClinVar: PIGU | |
| Phenotype | MGI: PIGU (International Mouse Phenotyping Consortium) |
| PhenomicDB: PIGU | |
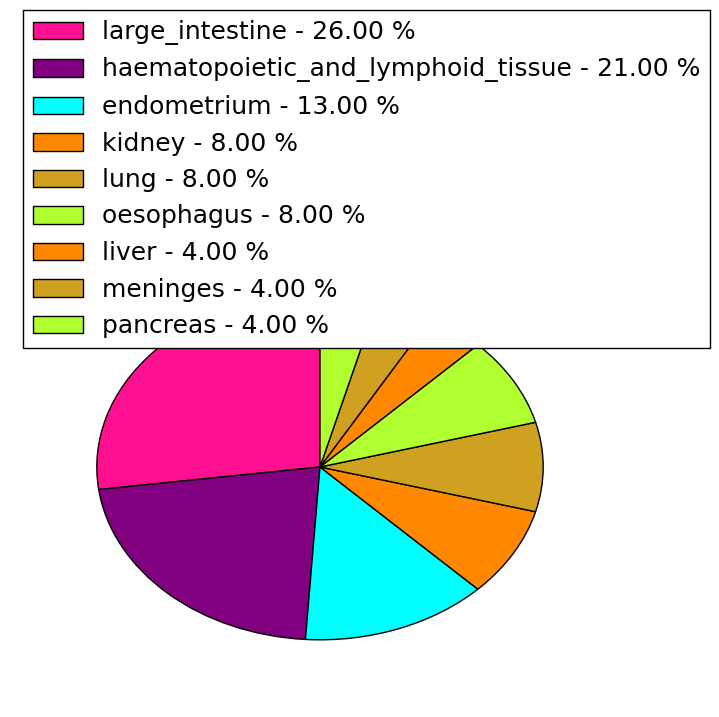
| Mutations for PIGU |
| * Under tables are showing count per each tissue to give us broad intuition about tissue specific mutation patterns.You can go to the detailed page for each mutation database's web site. |
| - Statistics for Tissue and Mutation type | Top |
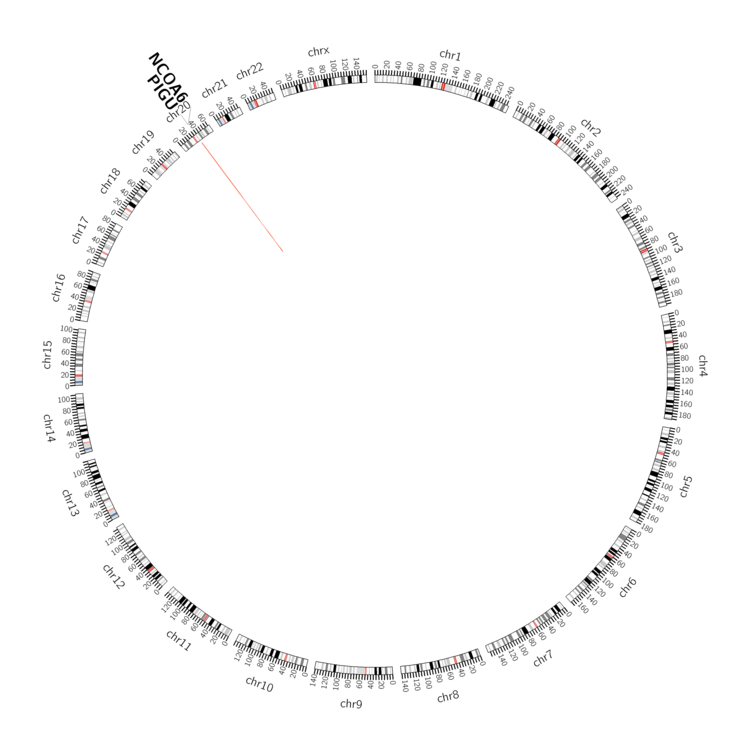 |
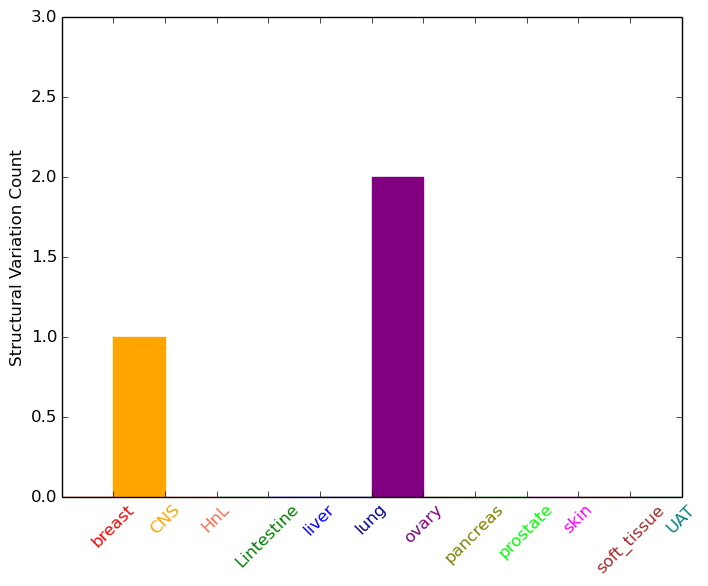
| - For Inter-chromosomal Variations |
| There's no inter-chromosomal structural variation. |
| - For Intra-chromosomal Variations |
| * Intra-chromosomal variantions includes 'intrachromosomal amplicon to amplicon', 'intrachromosomal amplicon to non-amplified dna', 'intrachromosomal deletion', 'intrachromosomal fold-back inversion', 'intrachromosomal inversion', 'intrachromosomal tandem duplication', 'Intrachromosomal unknown type', 'intrachromosomal with inverted orientation', 'intrachromosomal with non-inverted orientation'. |
 |
| Sample | Symbol_a | Chr_a | Start_a | End_a | Symbol_b | Chr_b | Start_b | End_b |
| central_nervous_system | PIGU | chr20 | 33241830 | 33241830 | PIGU | chr20 | 33244289 | 33244289 |
| ovary | PIGU | chr20 | 33162888 | 33162908 | NCOA6 | chr20 | 33359746 | 33359766 |
| ovary | PIGU | chr20 | 33203667 | 33203687 | chr20 | 33736874 | 33736894 |
| cf) Tissue number; Tissue name (1;Breast, 2;Central_nervous_system, 3;Haematopoietic_and_lymphoid_tissue, 4;Large_intestine, 5;Liver, 6;Lung, 7;Ovary, 8;Pancreas, 9;Prostate, 10;Skin, 11;Soft_tissue, 12;Upper_aerodigestive_tract) |
| * From mRNA Sanger sequences, Chitars2.0 arranged chimeric transcripts. This table shows PIGU related fusion information. |
| ID | Head Gene | Tail Gene | Accession | Gene_a | qStart_a | qEnd_a | Chromosome_a | tStart_a | tEnd_a | Gene_a | qStart_a | qEnd_a | Chromosome_a | tStart_a | tEnd_a |
| AA557668 | PIGU | 7 | 89 | 20 | 33148398 | 33148480 | PIGU | 86 | 304 | 20 | 33148477 | 33148696 | |
| CK823810 | SLC4A4 | 27 | 156 | 4 | 72437632 | 72437761 | PIGU | 156 | 462 | 20 | 33185380 | 33185686 | |
| AW367711 | PIGU | 13 | 84 | 20 | 33158665 | 33158737 | YARS | 78 | 164 | 1 | 33247965 | 33248051 | |
| HM245395 | PIGU | 1 | 230 | 20 | 33203846 | 33225710 | ALG5 | 218 | 616 | 13 | 37524107 | 37546195 | |
| HM245394 | ALG5 | 1 | 272 | 13 | 37559764 | 37567805 | PIGU | 273 | 750 | 20 | 33162997 | 33176411 | |
| BM511213 | SLC4A4 | 27 | 156 | 4 | 72437632 | 72437761 | PIGU | 156 | 420 | 20 | 33185422 | 33185686 | |
| Top |
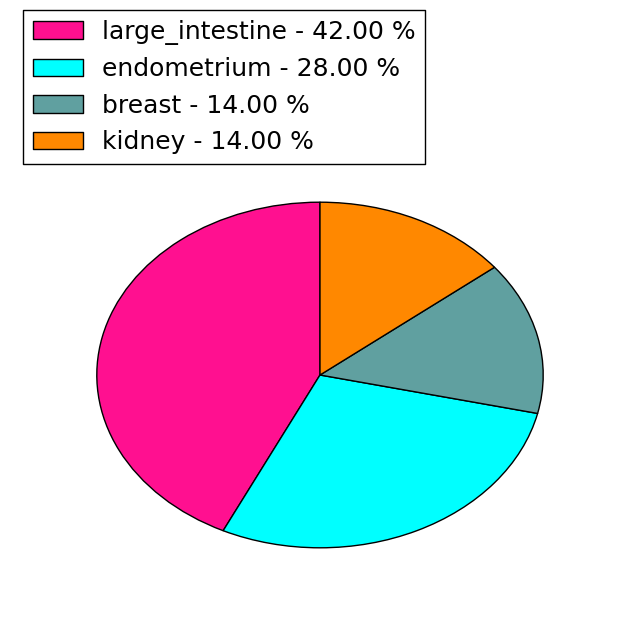
| Mutation type/ Tissue ID | brca | cns | cerv | endome | haematopo | kidn | Lintest | liver | lung | ns | ovary | pancre | prost | skin | stoma | thyro | urina | |||
| Total # sample | 5 | 2 | 1 | 1 | ||||||||||||||||
| GAIN (# sample) | 5 | 2 | 1 | 1 | ||||||||||||||||
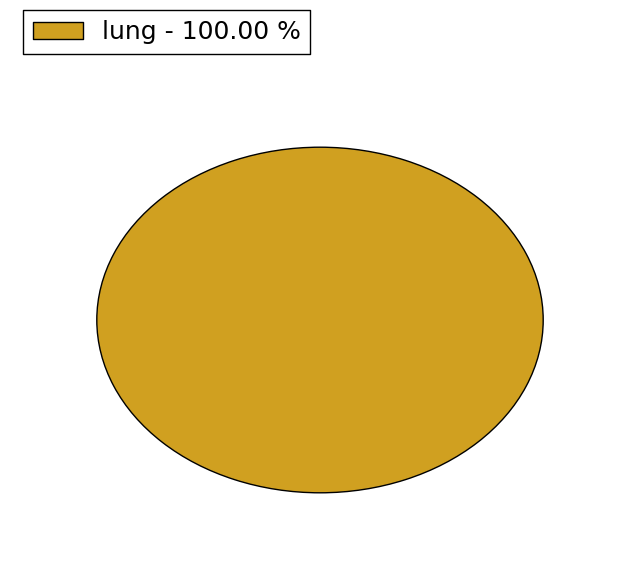
| LOSS (# sample) |
| cf) Tissue ID; Tissue type (1; Breast, 2; Central_nervous_system, 3; Cervix, 4; Endometrium, 5; Haematopoietic_and_lymphoid_tissue, 6; Kidney, 7; Large_intestine, 8; Liver, 9; Lung, 10; NS, 11; Ovary, 12; Pancreas, 13; Prostate, 14; Skin, 15; Stomach, 16; Thyroid, 17; Urinary_tract) |
| Top |
|
 |
| Top |
| Stat. for Non-Synonymous SNVs (# total SNVs=23) | (# total SNVs=7) |
 |  |
(# total SNVs=1) | (# total SNVs=0) |
 |
| Top |
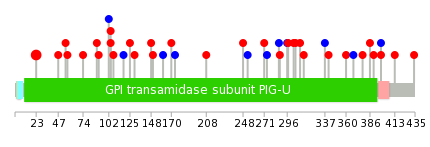
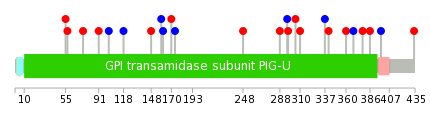
| * When you move the cursor on each content, you can see more deailed mutation information on the Tooltip. Those are primary_site,primary_histology,mutation(aa),pubmedID. |
| GRCh37 position | Mutation(aa) | Unique sampleID count |
| chr20:33264821-33264821 | p.S23R | 4 |
| chr20:33169483-33169483 | p.? | 2 |
| chr20:33162933-33162933 | p.I390T | 1 |
| chr20:33225794-33225794 | p.? | 1 |
| chr20:33173259-33173259 | p.P303L | 1 |
| chr20:33245016-33245016 | p.V55L | 1 |
| chr20:33222438-33222438 | p.F170L | 1 |
| chr20:33162944-33162944 | p.F386L | 1 |
| chr20:33231964-33231964 | p.? | 1 |
| chr20:33173278-33173278 | p.V297I | 1 |
| Top |
|
 |
| Point Mutation/ Tissue ID | 1 | 2 | 3 | 4 | 5 | 6 | 7 | 8 | 9 | 10 | 11 | 12 | 13 | 14 | 15 | 16 | 17 | 18 | 19 | 20 |
| # sample | 2 | 1 | 4 | 2 | 1 | 8 | 2 | 5 | ||||||||||||
| # mutation | 2 | 1 | 4 | 2 | 1 | 8 | 2 | 5 | ||||||||||||
| nonsynonymous SNV | 1 | 2 | 1 | 1 | 7 | 1 | 3 | |||||||||||||
| synonymous SNV | 1 | 1 | 2 | 1 | 1 | 1 | 2 |
| cf) Tissue ID; Tissue type (1; BLCA[Bladder Urothelial Carcinoma], 2; BRCA[Breast invasive carcinoma], 3; CESC[Cervical squamous cell carcinoma and endocervical adenocarcinoma], 4; COAD[Colon adenocarcinoma], 5; GBM[Glioblastoma multiforme], 6; Glioma Low Grade, 7; HNSC[Head and Neck squamous cell carcinoma], 8; KICH[Kidney Chromophobe], 9; KIRC[Kidney renal clear cell carcinoma], 10; KIRP[Kidney renal papillary cell carcinoma], 11; LAML[Acute Myeloid Leukemia], 12; LUAD[Lung adenocarcinoma], 13; LUSC[Lung squamous cell carcinoma], 14; OV[Ovarian serous cystadenocarcinoma ], 15; PAAD[Pancreatic adenocarcinoma], 16; PRAD[Prostate adenocarcinoma], 17; SKCM[Skin Cutaneous Melanoma], 18:STAD[Stomach adenocarcinoma], 19:THCA[Thyroid carcinoma], 20:UCEC[Uterine Corpus Endometrial Carcinoma]) |
| Top |
| * We represented just top 10 SNVs. When you move the cursor on each content, you can see more deailed mutation information on the Tooltip. Those are primary_site, primary_histology, mutation(aa), pubmedID. |
| Genomic Position | Mutation(aa) | Unique sampleID count |
| chr20:33162998 | p.C360Y | 1 |
| chr20:33222438 | p.T91I | 1 |
| chr20:33163023 | p.F341L | 1 |
| chr20:33222465 | p.H74Y | 1 |
| chr20:33169380 | p.L337L | 1 |
| chr20:33222471 | p.P57L | 1 |
| chr20:33169392 | p.E310K | 1 |
| chr20:33222506 | p.V55L | 1 |
| chr20:33169475 | p.A305G | 1 |
| chr20:33225754 | p.V297I | 1 |
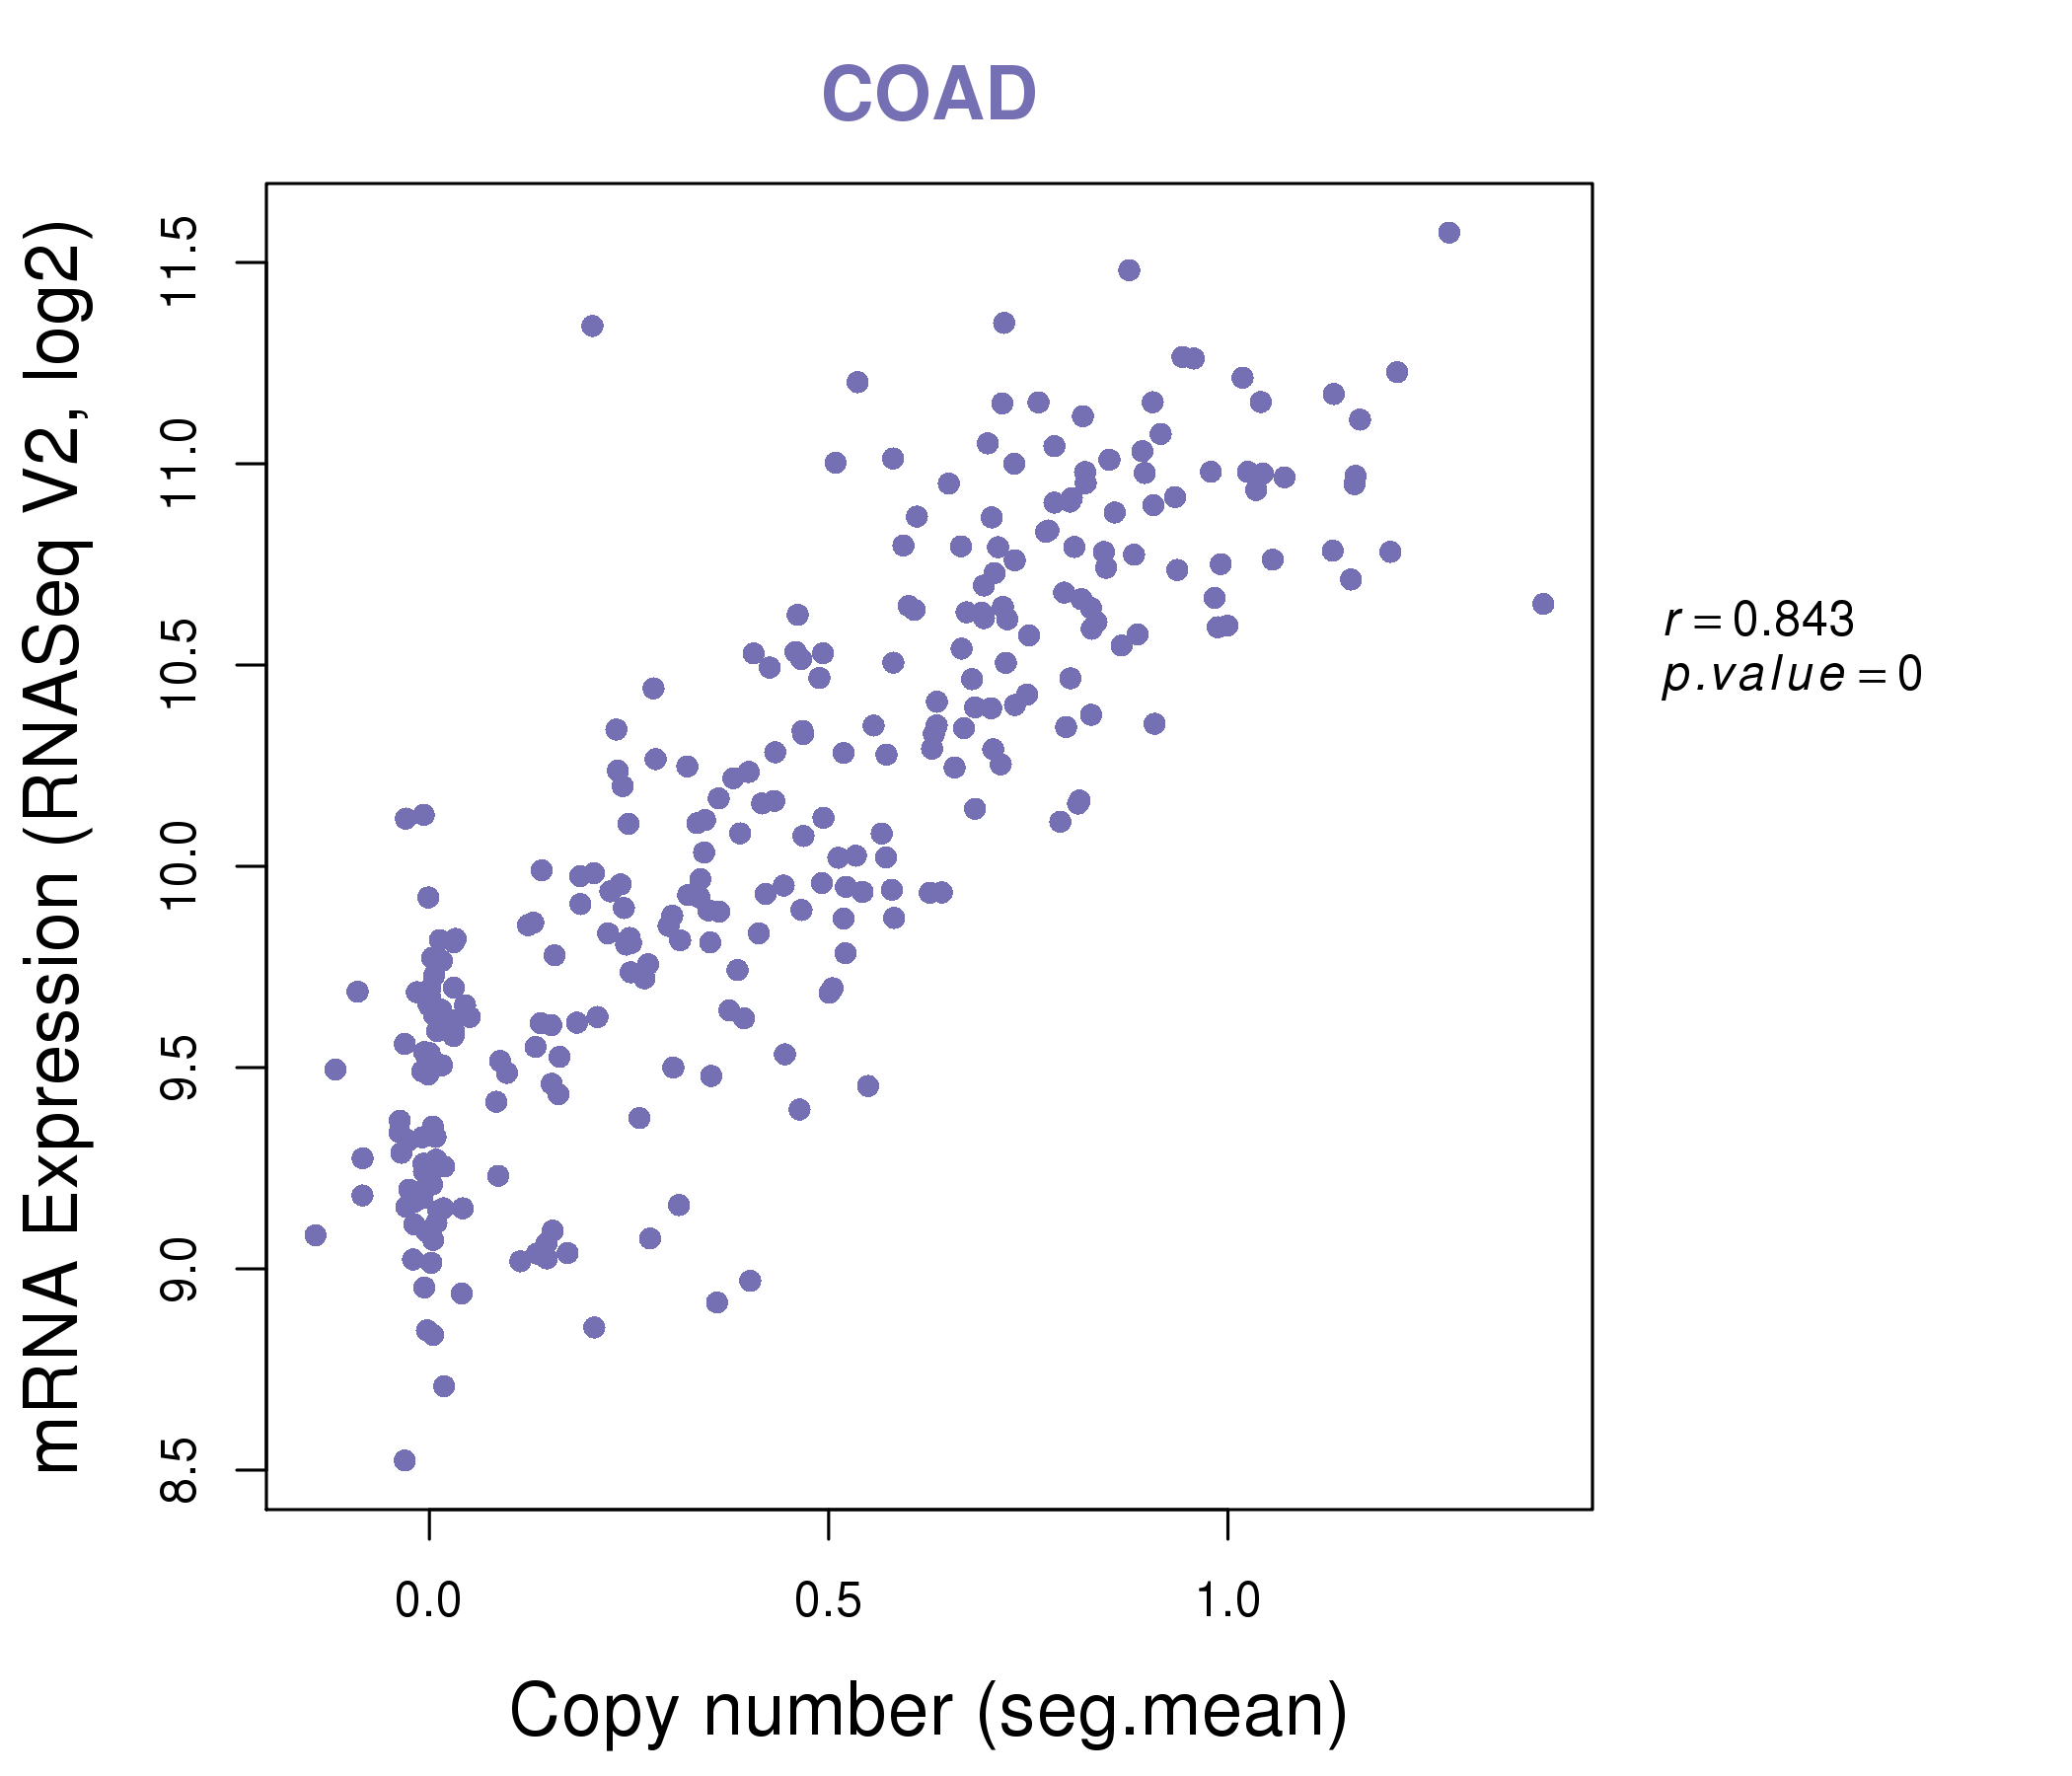
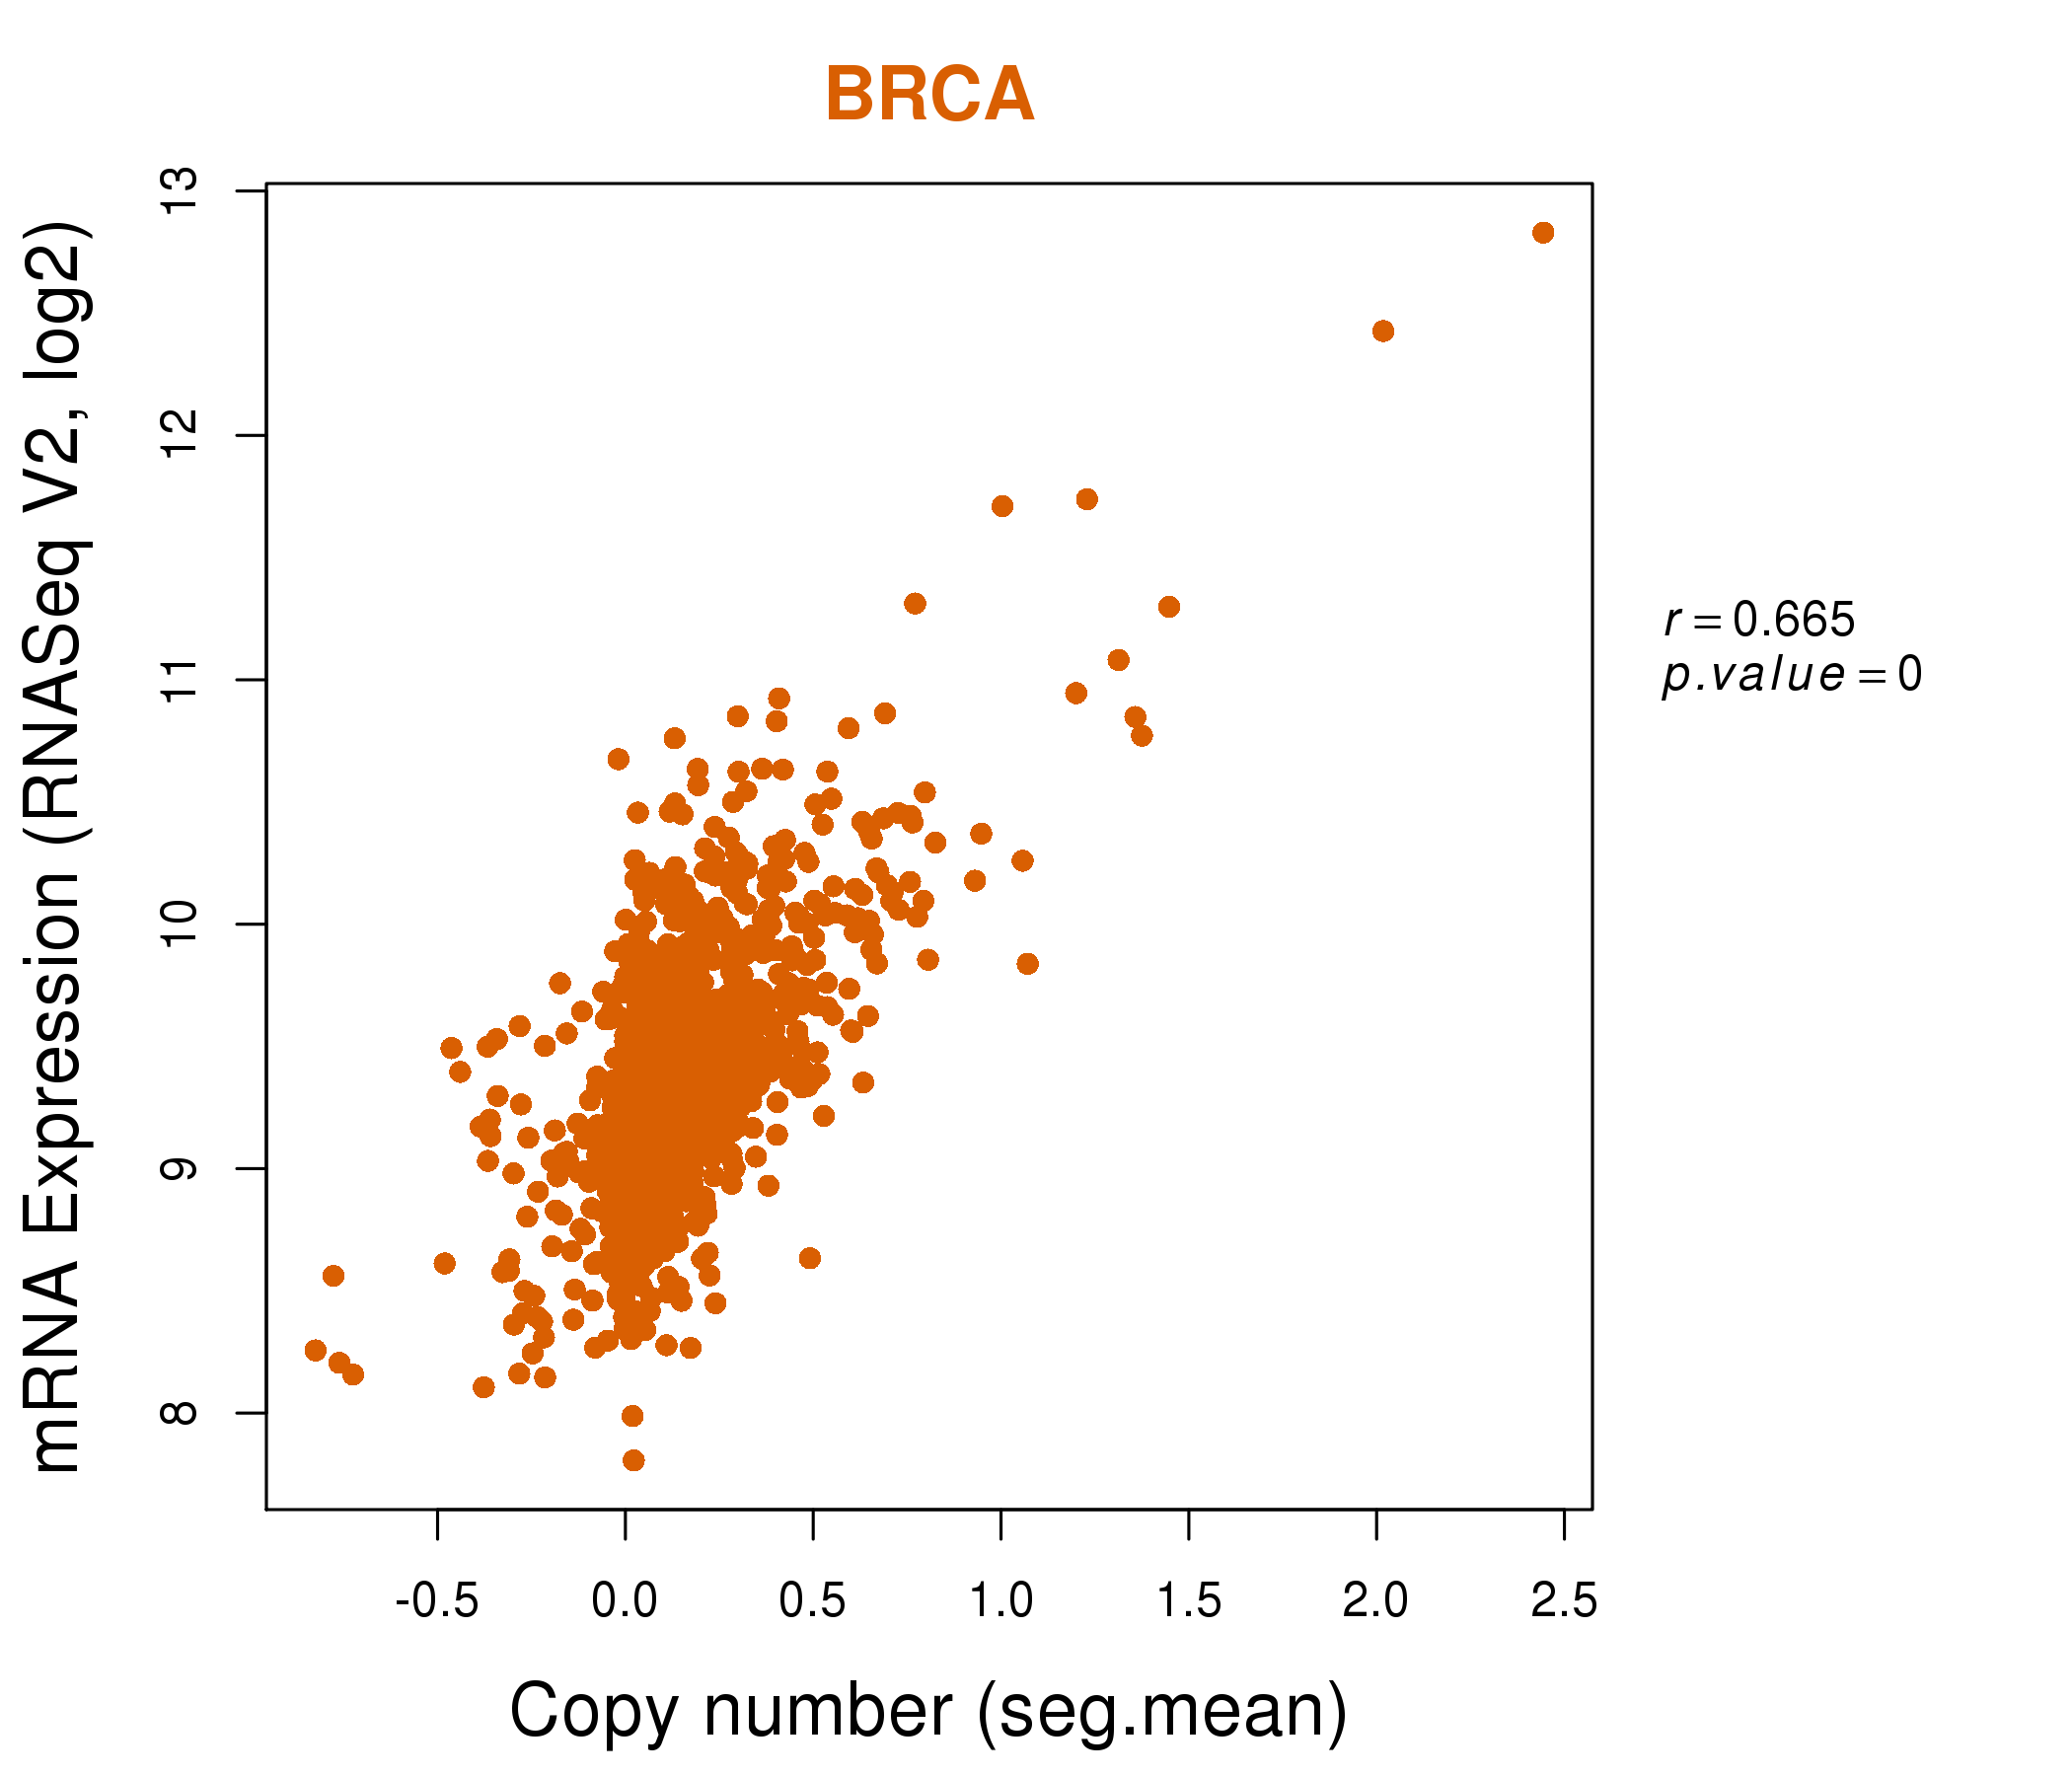
| * Copy number data were extracted from TCGA using R package TCGA-Assembler. The URLs of all public data files on TCGA DCC data server were gathered on Jan-05-2015. Function ProcessCNAData in TCGA-Assembler package was used to obtain gene-level copy number value which is calculated as the average copy number of the genomic region of a gene. |
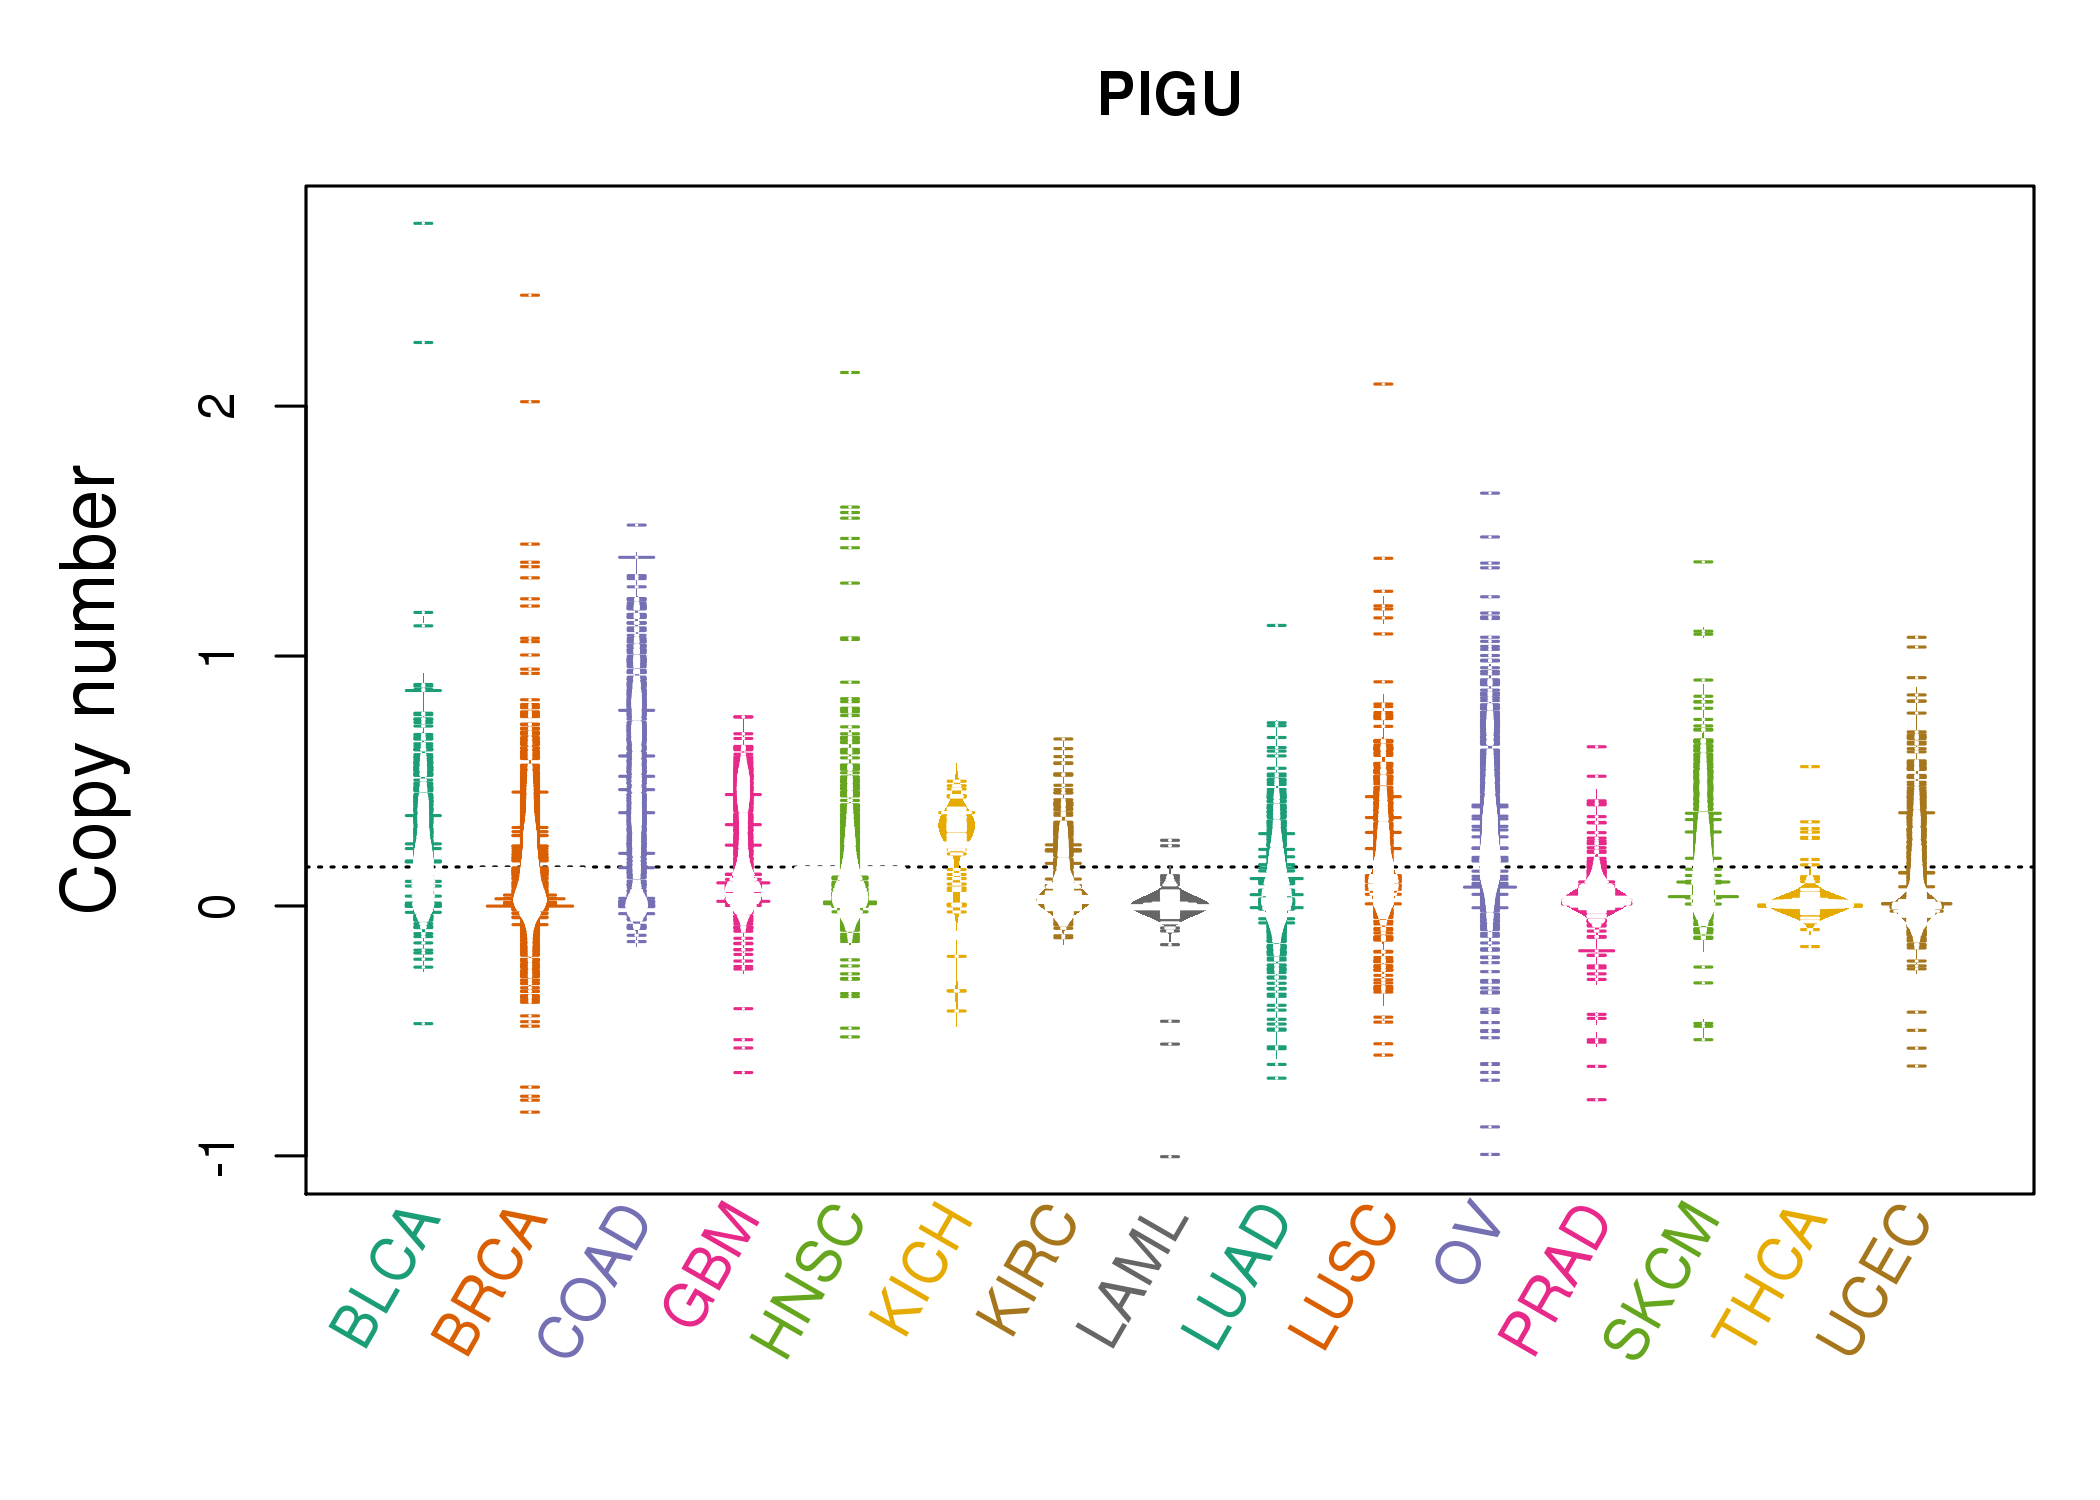 |
| cf) Tissue ID[Tissue type]: BLCA[Bladder Urothelial Carcinoma], BRCA[Breast invasive carcinoma], CESC[Cervical squamous cell carcinoma and endocervical adenocarcinoma], COAD[Colon adenocarcinoma], GBM[Glioblastoma multiforme], Glioma Low Grade, HNSC[Head and Neck squamous cell carcinoma], KICH[Kidney Chromophobe], KIRC[Kidney renal clear cell carcinoma], KIRP[Kidney renal papillary cell carcinoma], LAML[Acute Myeloid Leukemia], LUAD[Lung adenocarcinoma], LUSC[Lung squamous cell carcinoma], OV[Ovarian serous cystadenocarcinoma ], PAAD[Pancreatic adenocarcinoma], PRAD[Prostate adenocarcinoma], SKCM[Skin Cutaneous Melanoma], STAD[Stomach adenocarcinoma], THCA[Thyroid carcinoma], UCEC[Uterine Corpus Endometrial Carcinoma] |
| Top |
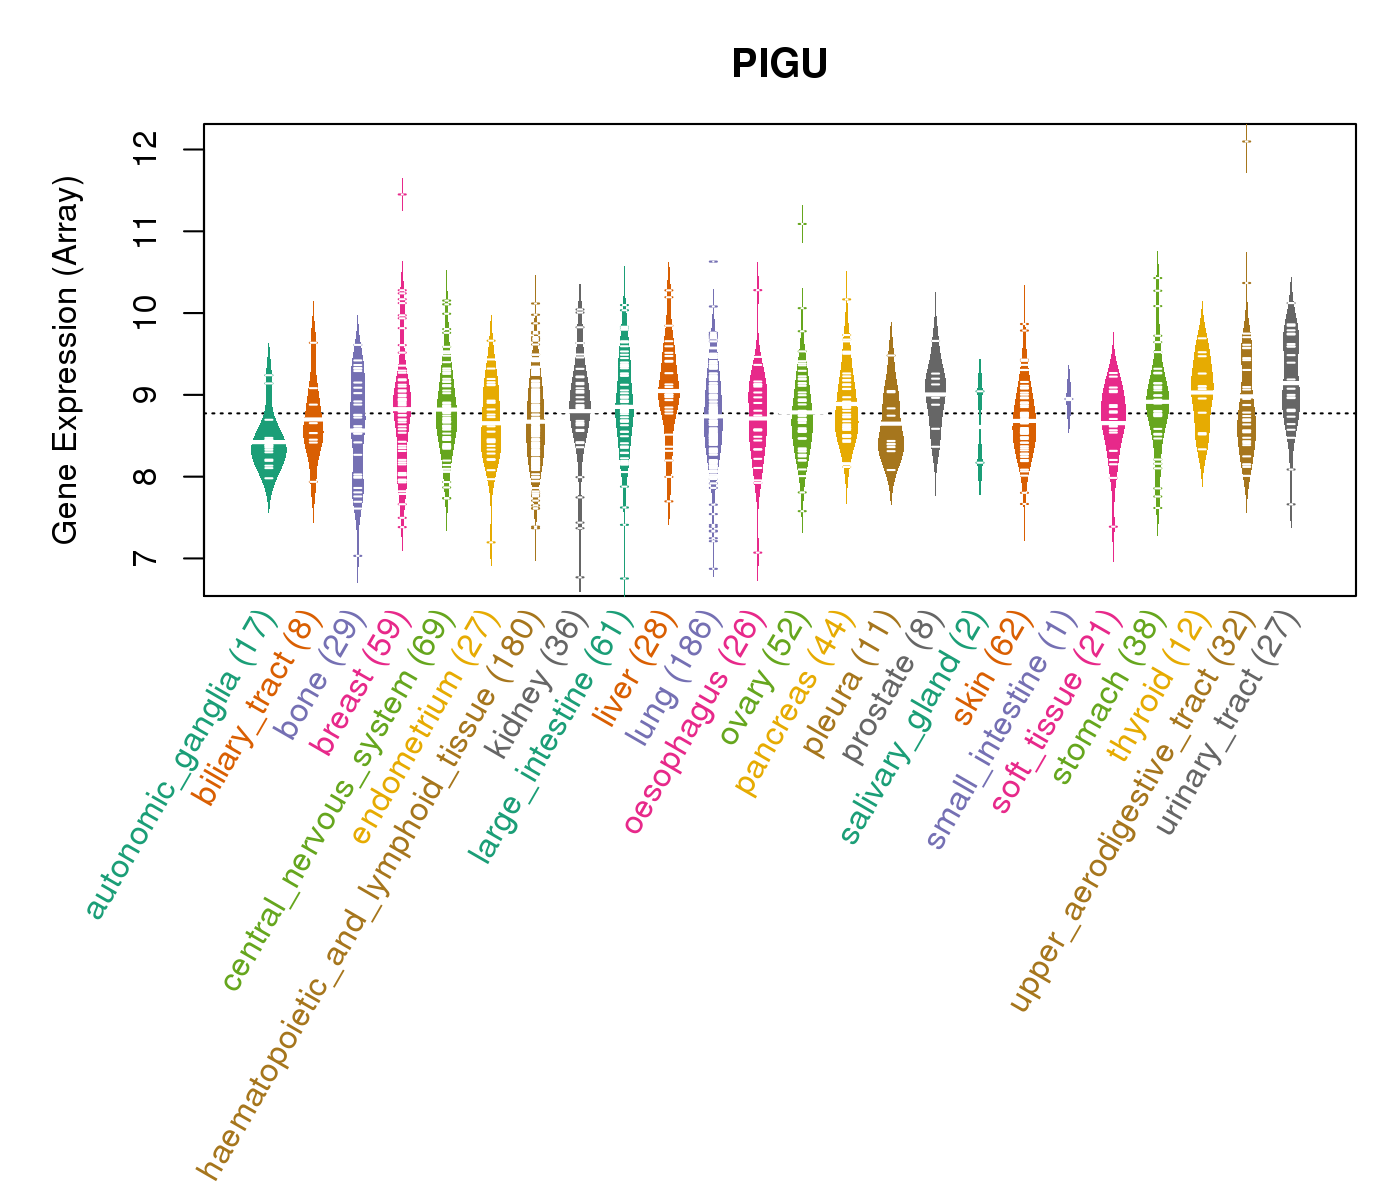
| Gene Expression for PIGU |
| * CCLE gene expression data were extracted from CCLE_Expression_Entrez_2012-10-18.res: Gene-centric RMA-normalized mRNA expression data. |
 |
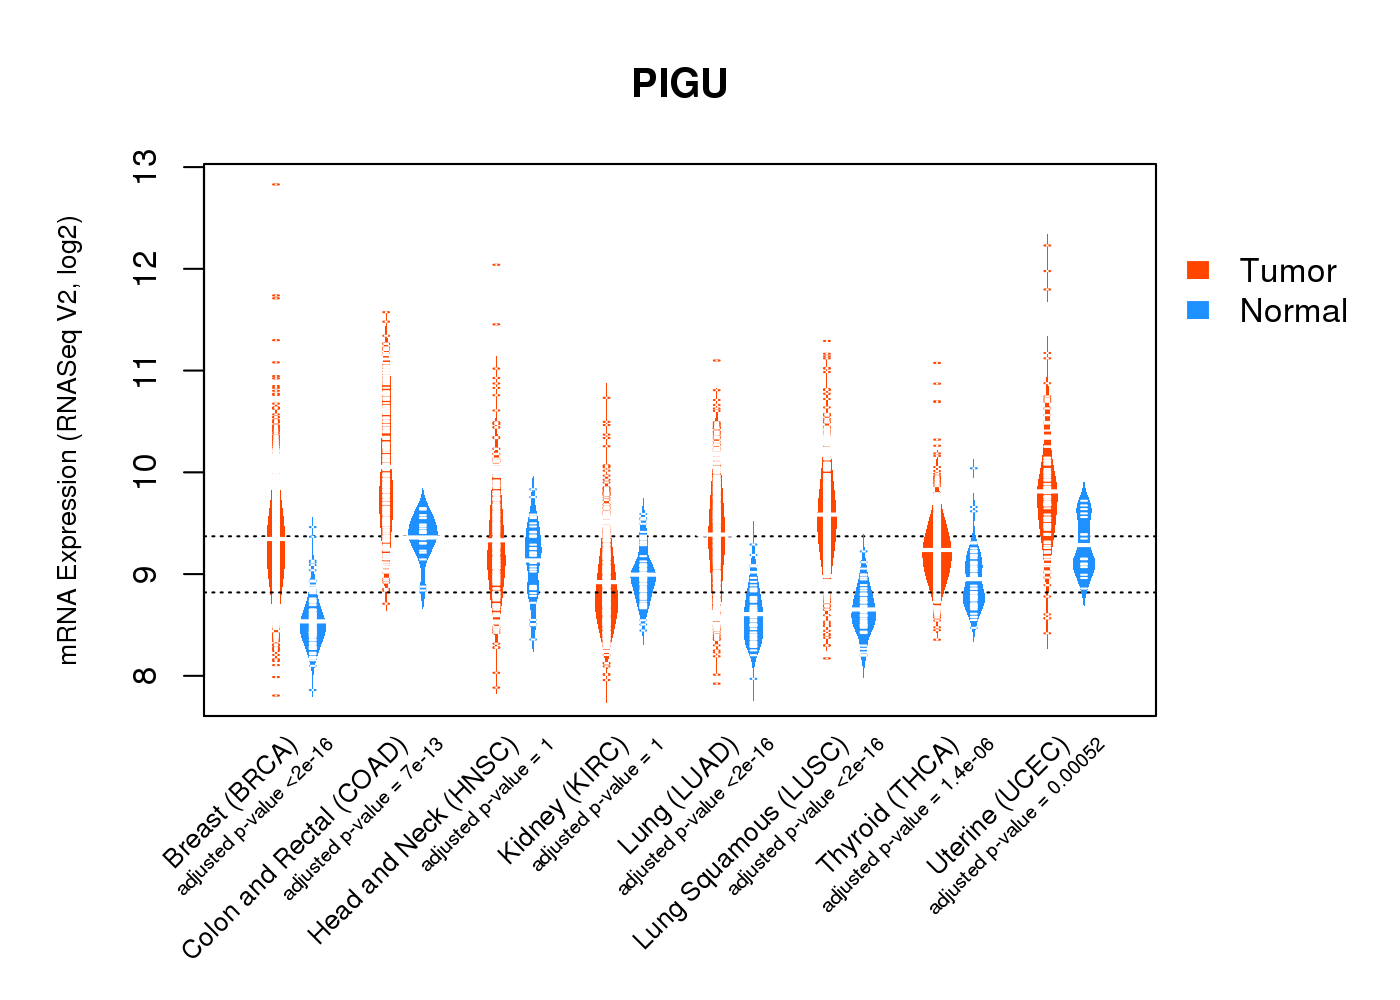
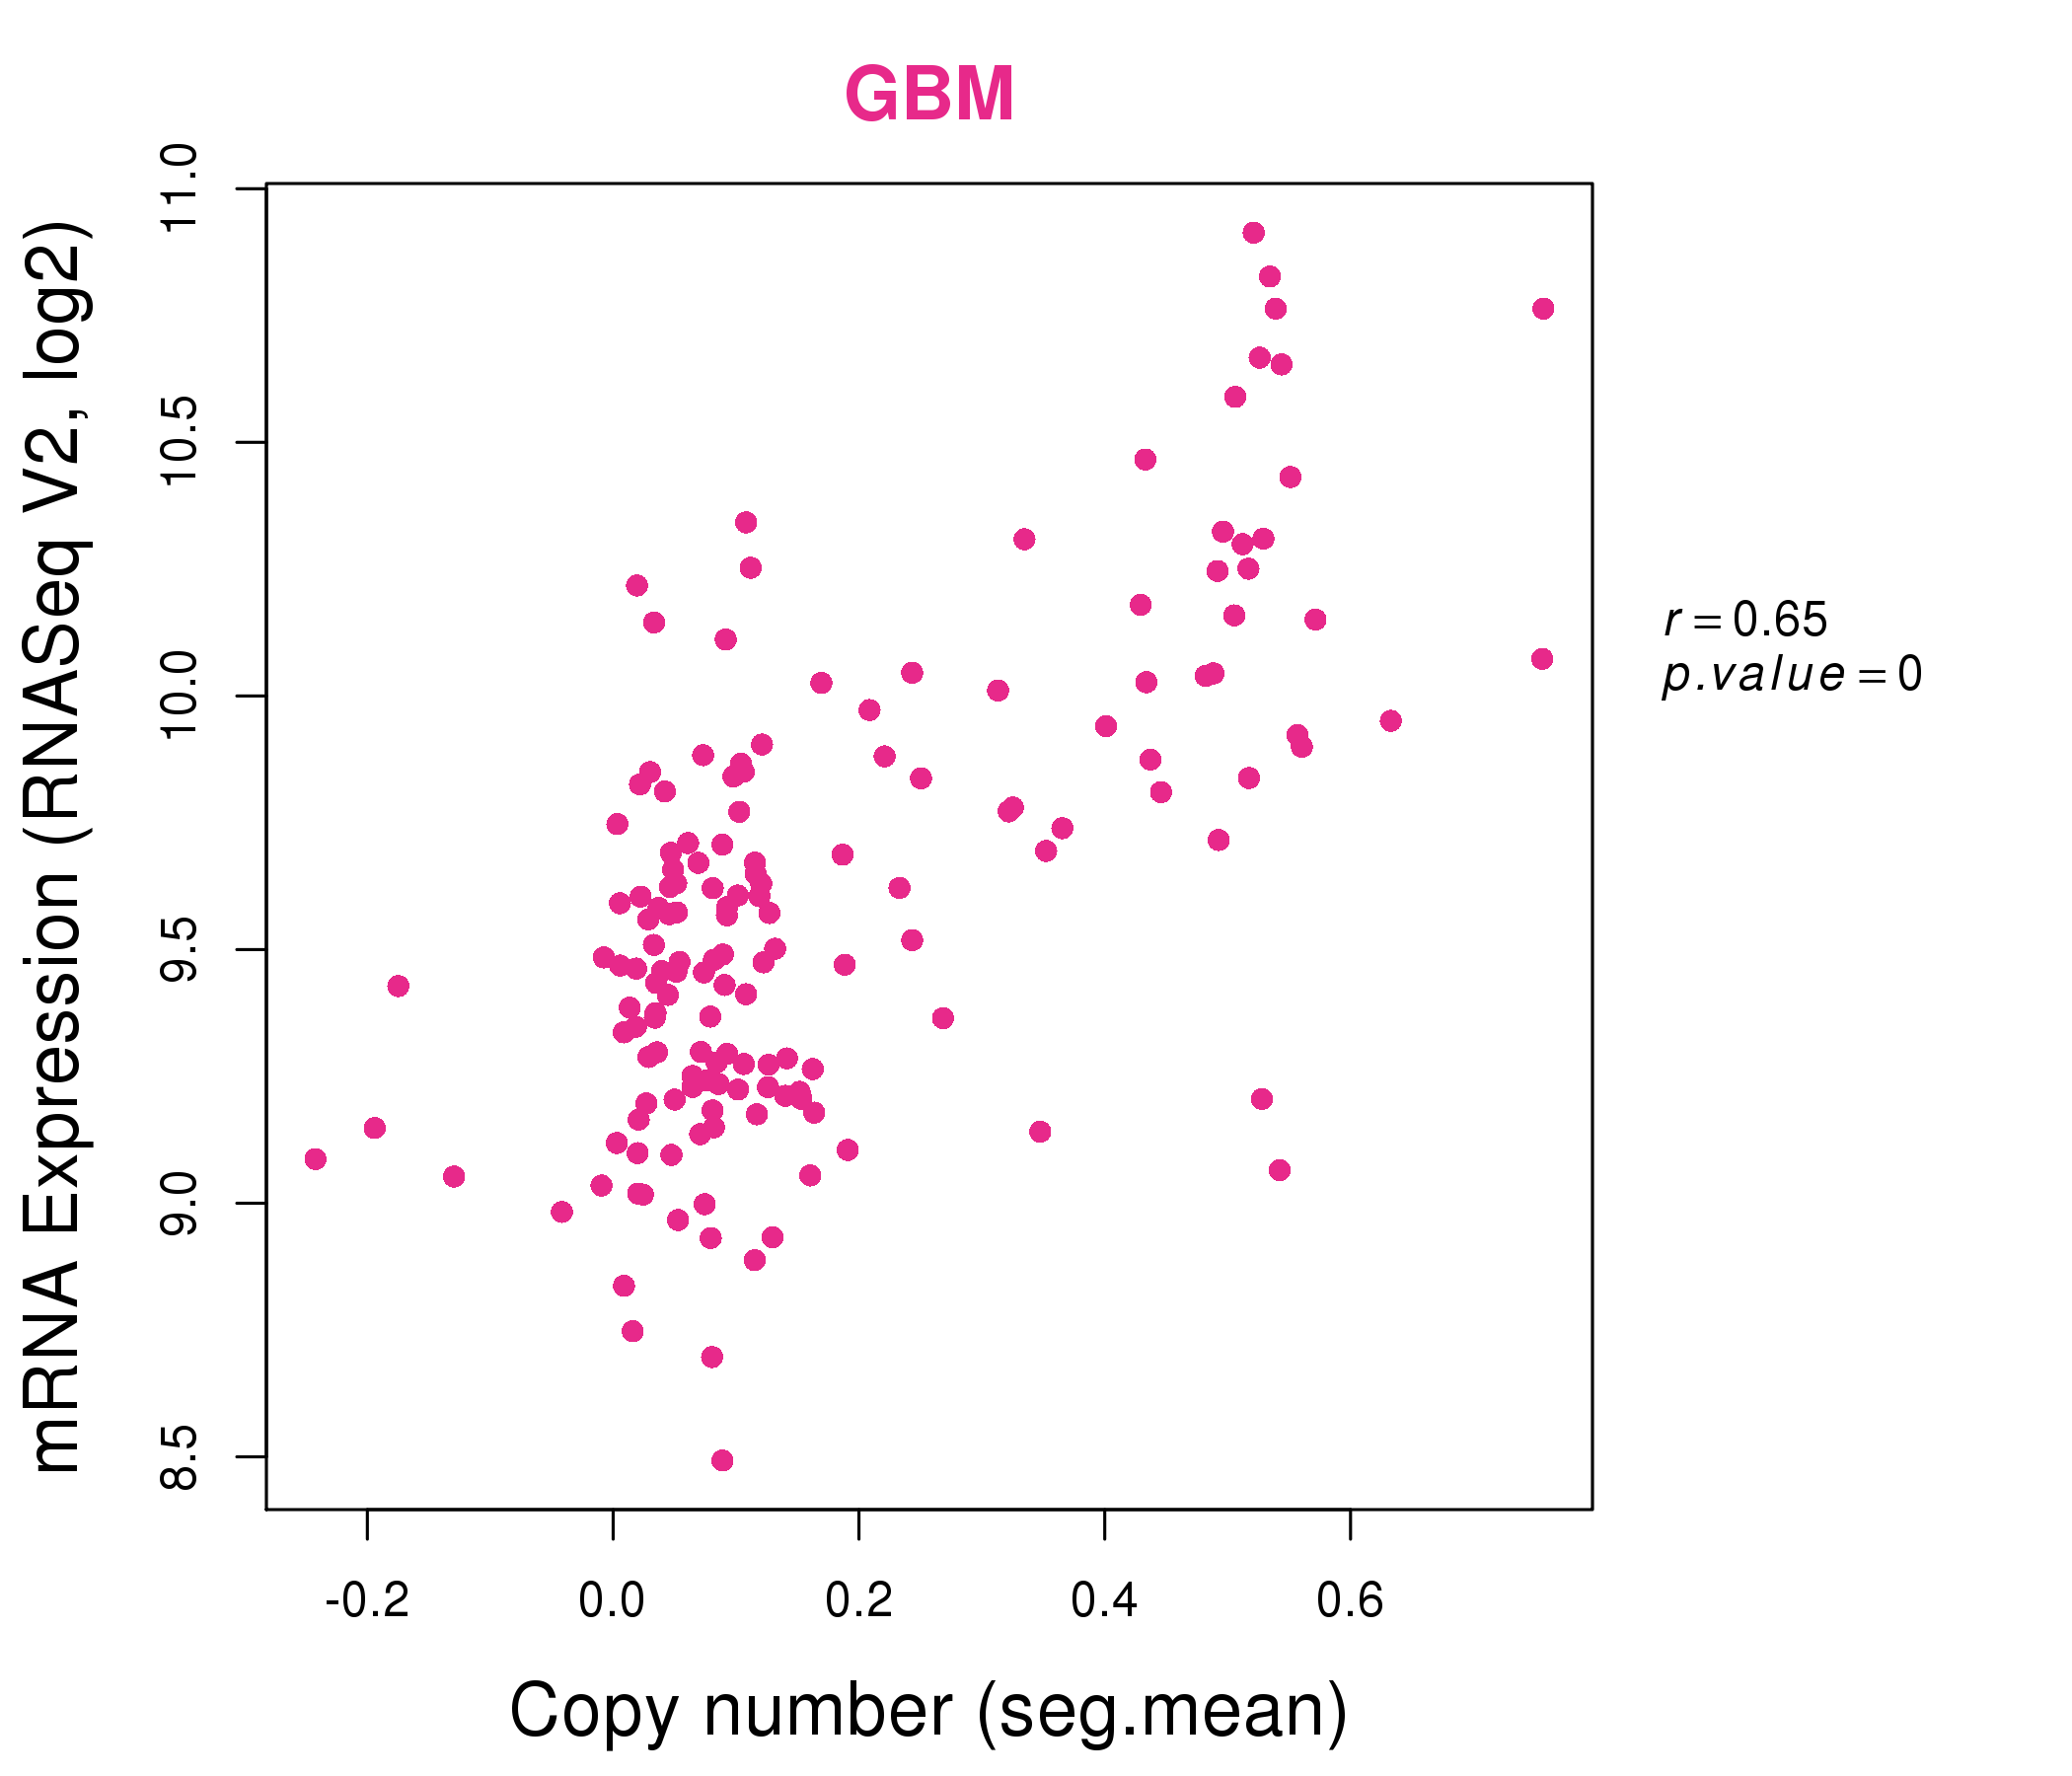
| * Normalized gene expression data of RNASeqV2 was extracted from TCGA using R package TCGA-Assembler. The URLs of all public data files on TCGA DCC data server were gathered at Jan-05-2015. Only eight cancer types have enough normal control samples for differential expression analysis. (t test, adjusted p<0.05 (using Benjamini-Hochberg FDR)) |
 |
| Top |
| * This plots show the correlation between CNV and gene expression. |
: Open all plots for all cancer types
 |
|
 |
|
| Top |
| Gene-Gene Network Information |
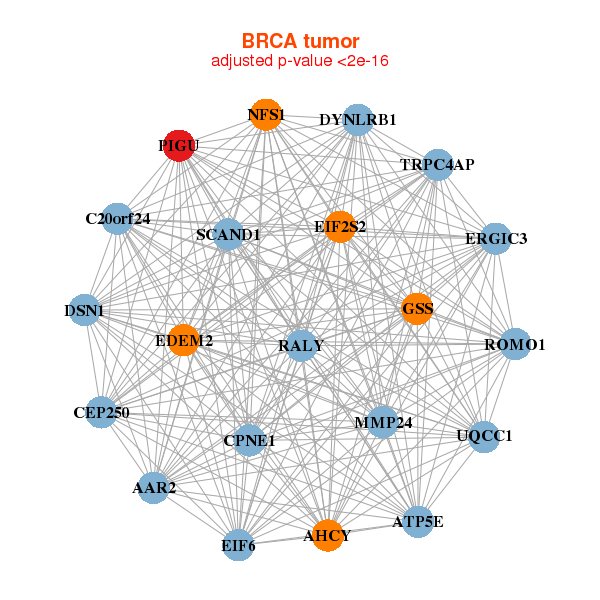
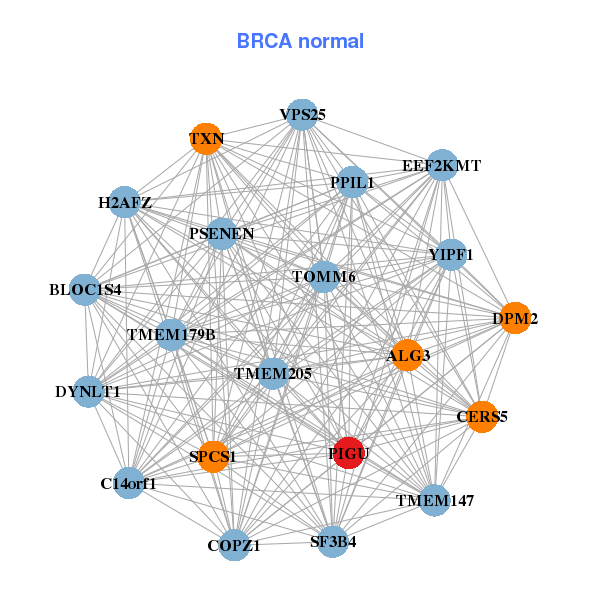
| * Co-Expression network figures were drawn using R package igraph. Only the top 20 genes with the highest correlations were shown. Red circle: input gene, orange circle: cell metabolism gene, sky circle: other gene |
: Open all plots for all cancer types
 |
|
| AHCY,ATP5E,C20orf24,AAR2,CEP250,CPNE1,DSN1, DYNLRB1,EDEM2,EIF2S2,EIF6,ERGIC3,GSS,MMP24, NFS1,PIGU,RALY,ROMO1,SCAND1,TRPC4AP,UQCC1 | ALG3,C14orf1,BLOC1S4,COPZ1,DPM2,DYNLT1,EEF2KMT, H2AFZ,CERS5,PIGU,PPIL1,PSENEN,SF3B4,SPCS1, TMEM147,TMEM179B,TMEM205,TOMM6,TXN,VPS25,YIPF1 |
 |
|
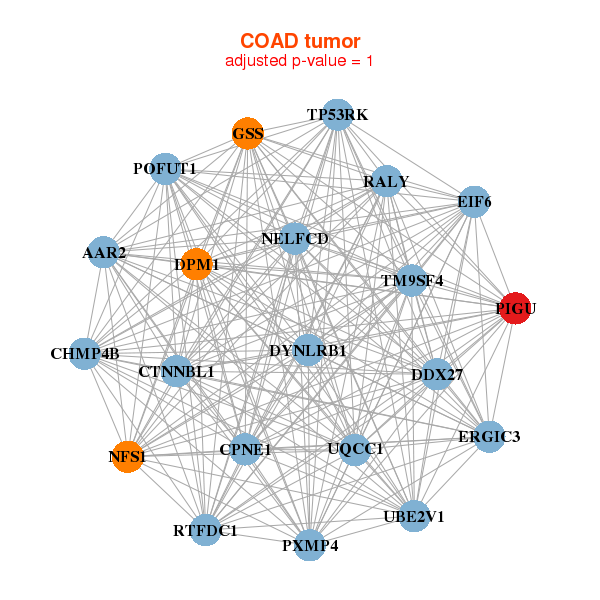
| AAR2,RTFDC1,CHMP4B,CPNE1,CTNNBL1,DDX27,DPM1, DYNLRB1,EIF6,ERGIC3,GSS,NFS1,PIGU,POFUT1, PXMP4,RALY,NELFCD,TM9SF4,TP53RK,UBE2V1,UQCC1 | AGPAT5,ARL6IP1,MPLKIP,DARS2,ERAL1,GSS,METTL15, MLYCD,MRPS30,MRPS5,MTIF2,NDUFA10,PIGU,PPIF, PTDSS1,RPIA,SLC35A4,SMAGP,TUFM,UNG,WARS2 |
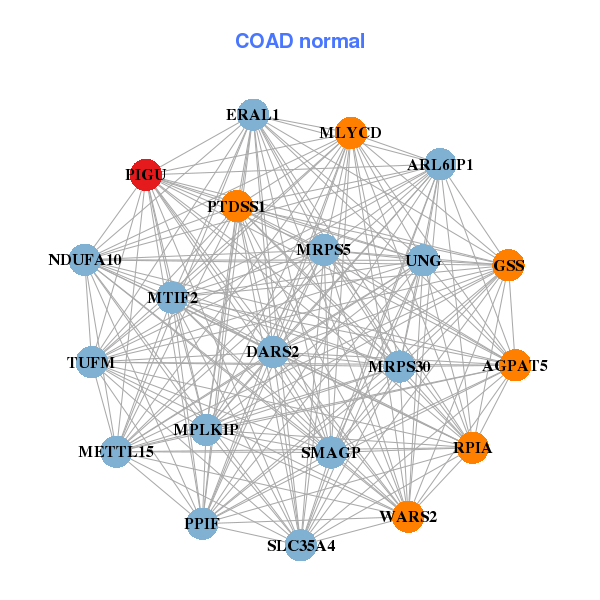
| * Co-Expression network figures were drawn using R package igraph. Only the top 20 genes with the highest correlations were shown. Red circle: input gene, orange circle: cell metabolism gene, sky circle: other gene |
: Open all plots for all cancer types
| Top |
: Open all interacting genes' information including KEGG pathway for all interacting genes from DAVID
| Top |
| Pharmacological Information for PIGU |
| There's no related Drug. |
| Top |
| Cross referenced IDs for PIGU |
| * We obtained these cross-references from Uniprot database. It covers 150 different DBs, 18 categories. http://www.uniprot.org/help/cross_references_section |
: Open all cross reference information
|
Copyright © 2016-Present - The Univsersity of Texas Health Science Center at Houston @ |