|
||||||||||||||||||||||||||||||||||||||||||||||||||||||||||||||||||||||||||||||||||||||||||||||||||||||||||||||||||||||||||||||||||||||||||||||||||||||||||||||||||||||||||||||||||||||||||||||||||||||||||||||||||||||||||||||||||||||||||||||||||||||||||||||||||||||||||||||||||||||||||||||||||||||||||||||||||||||||||
| |
| Phenotypic Information (metabolism pathway, cancer, disease, phenome) |
| |
| |
| Gene-Gene Network Information: Co-Expression Network, Interacting Genes & KEGG |
| |
|


| Gene Summary for MBOAT2 |
| Basic gene info. | Gene symbol | MBOAT2 |
| Gene name | membrane bound O-acyltransferase domain containing 2 | |
| Synonyms | LPCAT4|OACT2 | |
| Cytomap | UCSC genome browser: 2p25.1 | |
| Genomic location | chr2 :8996700-9143876 | |
| Type of gene | protein-coding | |
| RefGenes | NM_138799.2, | |
| Ensembl id | ENSG00000143797 | |
| Description | 1-acylglycerophosphate O-acyltransferase1-acylglycerophosphoethanolamine O-acyltransferaseLPAATLPEATLPLAT 2O-acyltransferase (membrane bound) domain containing 2O-acyltransferase domain-containing protein 2lyso-PA acyltransferaselyso-PE acyltransf | |
| Modification date | 20141207 | |
| dbXrefs | MIM : 611949 | |
| HGNC : HGNC | ||
| HPRD : 11410 | ||
| Protein | UniProt: go to UniProt's Cross Reference DB Table | |
| Expression | CleanEX: HS_MBOAT2 | |
| BioGPS: 129642 | ||
| Gene Expression Atlas: ENSG00000143797 | ||
| The Human Protein Atlas: ENSG00000143797 | ||
| Pathway | NCI Pathway Interaction Database: MBOAT2 | |
| KEGG: MBOAT2 | ||
| REACTOME: MBOAT2 | ||
| ConsensusPathDB | ||
| Pathway Commons: MBOAT2 | ||
| Metabolism | MetaCyc: MBOAT2 | |
| HUMANCyc: MBOAT2 | ||
| Regulation | Ensembl's Regulation: ENSG00000143797 | |
| miRBase: chr2 :8,996,700-9,143,876 | ||
| TargetScan: NM_138799 | ||
| cisRED: ENSG00000143797 | ||
| Context | iHOP: MBOAT2 | |
| cancer metabolism search in PubMed: MBOAT2 | ||
| UCL Cancer Institute: MBOAT2 | ||
| Assigned class in ccmGDB | C | |
| Top |
| Phenotypic Information for MBOAT2(metabolism pathway, cancer, disease, phenome) |
| Cancer | CGAP: MBOAT2 |
| Familial Cancer Database: MBOAT2 | |
| * This gene is included in those cancer gene databases. |
|
|
|
|
|
|
| ||||||||||||||||||||||||||||||||||||||||||||||||||||||||||||||||||||||||||||||||||||||||||||||||||||||||||||||||||||||||||||||||||||||||||||||||||||||||||||||||||||||||||||||||||||||||||||||||||||||||||||||||||||||||||||||||||||||||||||||||||||||||||||||||||||||||||||||||||||||||||||||||||||||||||||||||||||
Oncogene 1 | Significant driver gene in | |||||||||||||||||||||||||||||||||||||||||||||||||||||||||||||||||||||||||||||||||||||||||||||||||||||||||||||||||||||||||||||||||||||||||||||||||||||||||||||||||||||||||||||||||||||||||||||||||||||||||||||||||||||||||||||||||||||||||||||||||||||||||||||||||||||||||||||||||||||||||||||||||||||||||||||||||||||||||
| cf) number; DB name 1 Oncogene; http://nar.oxfordjournals.org/content/35/suppl_1/D721.long, 2 Tumor Suppressor gene; https://bioinfo.uth.edu/TSGene/, 3 Cancer Gene Census; http://www.nature.com/nrc/journal/v4/n3/abs/nrc1299.html, 4 CancerGenes; http://nar.oxfordjournals.org/content/35/suppl_1/D721.long, 5 Network of Cancer Gene; http://ncg.kcl.ac.uk/index.php, 1Therapeutic Vulnerabilities in Cancer; http://cbio.mskcc.org/cancergenomics/statius/ |
| KEGG_GLYCEROLIPID_METABOLISM KEGG_GLYCEROPHOSPHOLIPID_METABOLISM REACTOME_PHOSPHOLIPID_METABOLISM REACTOME_METABOLISM_OF_LIPIDS_AND_LIPOPROTEINS | |
| OMIM | |
| Orphanet | |
| Disease | KEGG Disease: MBOAT2 |
| MedGen: MBOAT2 (Human Medical Genetics with Condition) | |
| ClinVar: MBOAT2 | |
| Phenotype | MGI: MBOAT2 (International Mouse Phenotyping Consortium) |
| PhenomicDB: MBOAT2 | |
| Mutations for MBOAT2 |
| * Under tables are showing count per each tissue to give us broad intuition about tissue specific mutation patterns.You can go to the detailed page for each mutation database's web site. |
| - Statistics for Tissue and Mutation type | Top |
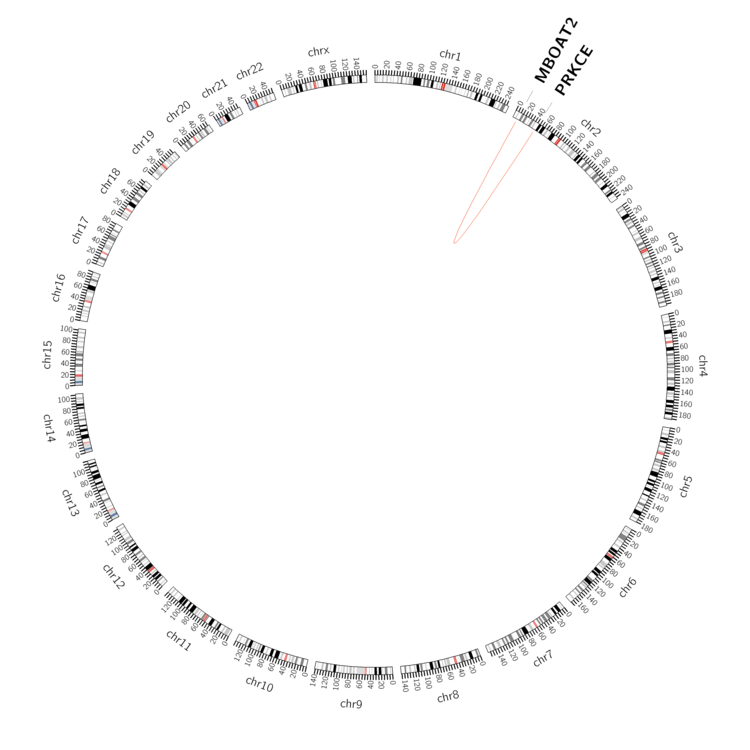 |
| - For Inter-chromosomal Variations |
| There's no inter-chromosomal structural variation. |
| - For Intra-chromosomal Variations |
| * Intra-chromosomal variantions includes 'intrachromosomal amplicon to amplicon', 'intrachromosomal amplicon to non-amplified dna', 'intrachromosomal deletion', 'intrachromosomal fold-back inversion', 'intrachromosomal inversion', 'intrachromosomal tandem duplication', 'Intrachromosomal unknown type', 'intrachromosomal with inverted orientation', 'intrachromosomal with non-inverted orientation'. |
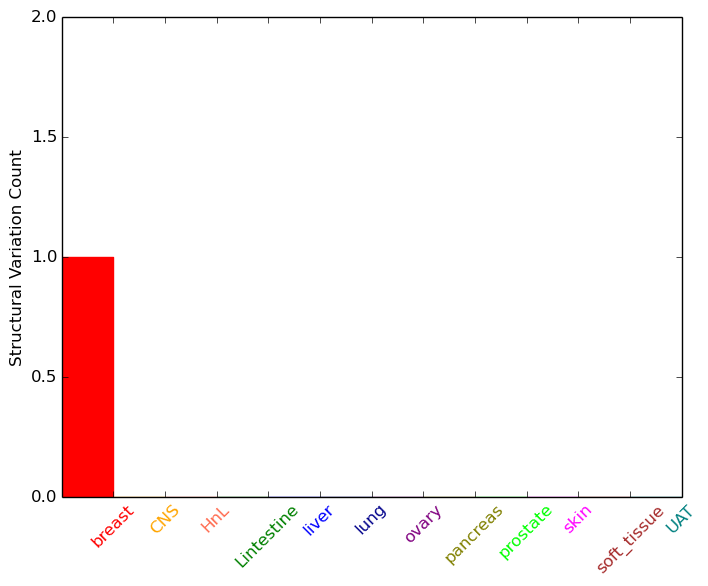 |
| Sample | Symbol_a | Chr_a | Start_a | End_a | Symbol_b | Chr_b | Start_b | End_b |
| breast | MBOAT2 | chr2 | 9017642 | 9017642 | PRKCE | chr2 | 46325940 | 46325940 |
| cf) Tissue number; Tissue name (1;Breast, 2;Central_nervous_system, 3;Haematopoietic_and_lymphoid_tissue, 4;Large_intestine, 5;Liver, 6;Lung, 7;Ovary, 8;Pancreas, 9;Prostate, 10;Skin, 11;Soft_tissue, 12;Upper_aerodigestive_tract) |
| * From mRNA Sanger sequences, Chitars2.0 arranged chimeric transcripts. This table shows MBOAT2 related fusion information. |
| ID | Head Gene | Tail Gene | Accession | Gene_a | qStart_a | qEnd_a | Chromosome_a | tStart_a | tEnd_a | Gene_a | qStart_a | qEnd_a | Chromosome_a | tStart_a | tEnd_a |
| BP270882 | FABP2 | 1 | 327 | 4 | 120240727 | 120243273 | MBOAT2 | 323 | 583 | 2 | 9003275 | 9003534 | |
| AW001546 | IDH1 | 1 | 242 | 2 | 209100954 | 209101195 | MBOAT2 | 239 | 557 | 2 | 9077895 | 9078213 | |
| Top |
| Mutation type/ Tissue ID | brca | cns | cerv | endome | haematopo | kidn | Lintest | liver | lung | ns | ovary | pancre | prost | skin | stoma | thyro | urina | |||
| Total # sample | 1 | |||||||||||||||||||
| GAIN (# sample) | 1 | |||||||||||||||||||
| LOSS (# sample) |
| cf) Tissue ID; Tissue type (1; Breast, 2; Central_nervous_system, 3; Cervix, 4; Endometrium, 5; Haematopoietic_and_lymphoid_tissue, 6; Kidney, 7; Large_intestine, 8; Liver, 9; Lung, 10; NS, 11; Ovary, 12; Pancreas, 13; Prostate, 14; Skin, 15; Stomach, 16; Thyroid, 17; Urinary_tract) |
| Top |
|
 |
| Top |
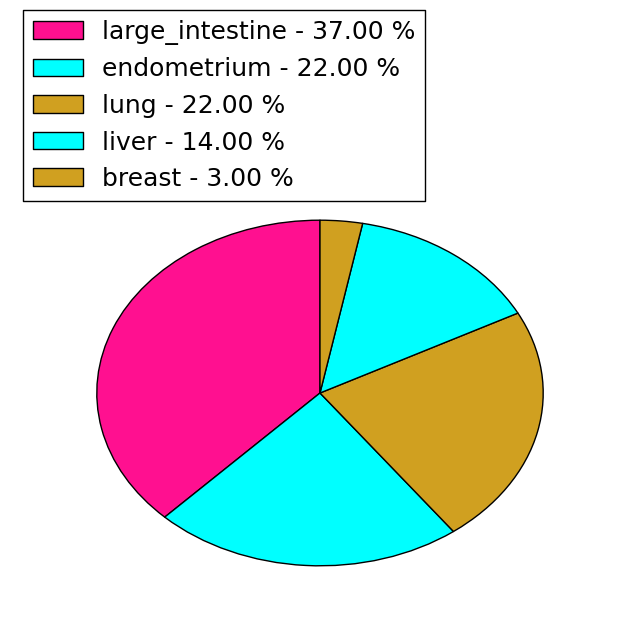
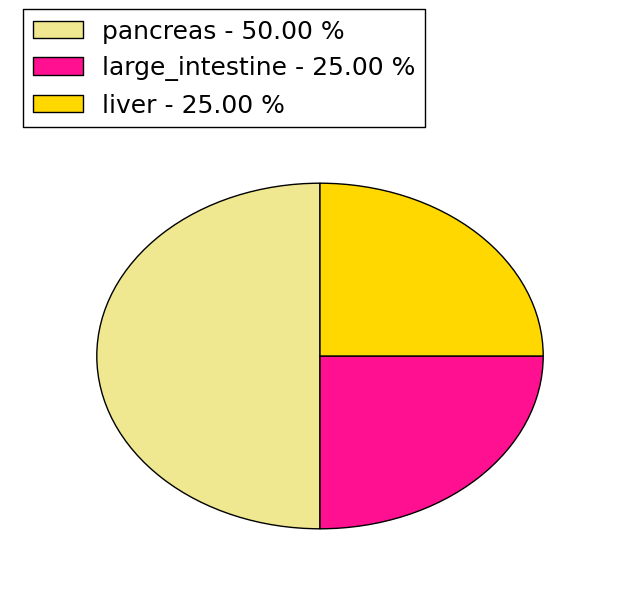
| Stat. for Non-Synonymous SNVs (# total SNVs=27) | (# total SNVs=6) |
 | 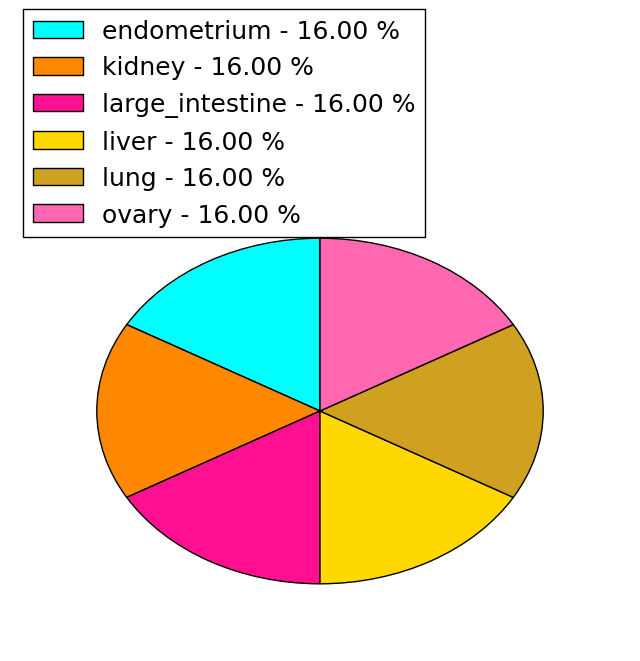 |
(# total SNVs=4) | (# total SNVs=0) |
 |
| Top |
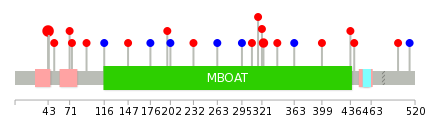
| * When you move the cursor on each content, you can see more deailed mutation information on the Tooltip. Those are primary_site,primary_histology,mutation(aa),pubmedID. |
| GRCh37 position | Mutation(aa) | Unique sampleID count |
| chr2:9098719-9098719 | p.R43Q | 7 |
| chr2:9017342-9017342 | p.R170C | 3 |
| chr2:9004366-9004366 | p.? | 2 |
| chr2:9008594-9008594 | p.L323F | 2 |
| chr2:8998958-8998958 | p.K472E | 2 |
| chr2:9022671-9022673 | p.L159delL | 2 |
| chr2:9028160-9028160 | p.E147K | 2 |
| chr2:9013315-9013315 | p.S269L | 2 |
| chr2:9098716-9098716 | p.T44I | 1 |
| chr2:9017244-9017244 | p.I202I | 1 |
| Top |
|
 |
| Point Mutation/ Tissue ID | 1 | 2 | 3 | 4 | 5 | 6 | 7 | 8 | 9 | 10 | 11 | 12 | 13 | 14 | 15 | 16 | 17 | 18 | 19 | 20 |
| # sample | 1 | 8 | 1 | 1 | 4 | 1 | 3 | 2 | 1 | 6 | ||||||||||
| # mutation | 1 | 9 | 1 | 1 | 3 | 1 | 3 | 2 | 1 | 3 | ||||||||||
| nonsynonymous SNV | 1 | 8 | 3 | 1 | 2 | 1 | 3 | |||||||||||||
| synonymous SNV | 1 | 1 | 1 | 1 | 2 |
| cf) Tissue ID; Tissue type (1; BLCA[Bladder Urothelial Carcinoma], 2; BRCA[Breast invasive carcinoma], 3; CESC[Cervical squamous cell carcinoma and endocervical adenocarcinoma], 4; COAD[Colon adenocarcinoma], 5; GBM[Glioblastoma multiforme], 6; Glioma Low Grade, 7; HNSC[Head and Neck squamous cell carcinoma], 8; KICH[Kidney Chromophobe], 9; KIRC[Kidney renal clear cell carcinoma], 10; KIRP[Kidney renal papillary cell carcinoma], 11; LAML[Acute Myeloid Leukemia], 12; LUAD[Lung adenocarcinoma], 13; LUSC[Lung squamous cell carcinoma], 14; OV[Ovarian serous cystadenocarcinoma ], 15; PAAD[Pancreatic adenocarcinoma], 16; PRAD[Prostate adenocarcinoma], 17; SKCM[Skin Cutaneous Melanoma], 18:STAD[Stomach adenocarcinoma], 19:THCA[Thyroid carcinoma], 20:UCEC[Uterine Corpus Endometrial Carcinoma]) |
| Top |
| * We represented just top 10 SNVs. When you move the cursor on each content, you can see more deailed mutation information on the Tooltip. Those are primary_site, primary_histology, mutation(aa), pubmedID. |
| Genomic Position | Mutation(aa) | Unique sampleID count |
| chr2:9098719 | p.R43Q | 6 |
| chr2:9008594 | p.L323F | 2 |
| chr2:9008641 | p.Y198C | 1 |
| chr2:9098635 | p.S513S | 1 |
| chr2:8998833 | p.E176E | 1 |
| chr2:9008678 | p.F498L | 1 |
| chr2:9098695 | p.E147K | 1 |
| chr2:8998878 | p.S441L | 1 |
| chr2:9013332 | p.T116T | 1 |
| chr2:9098716 | p.L436V | 1 |
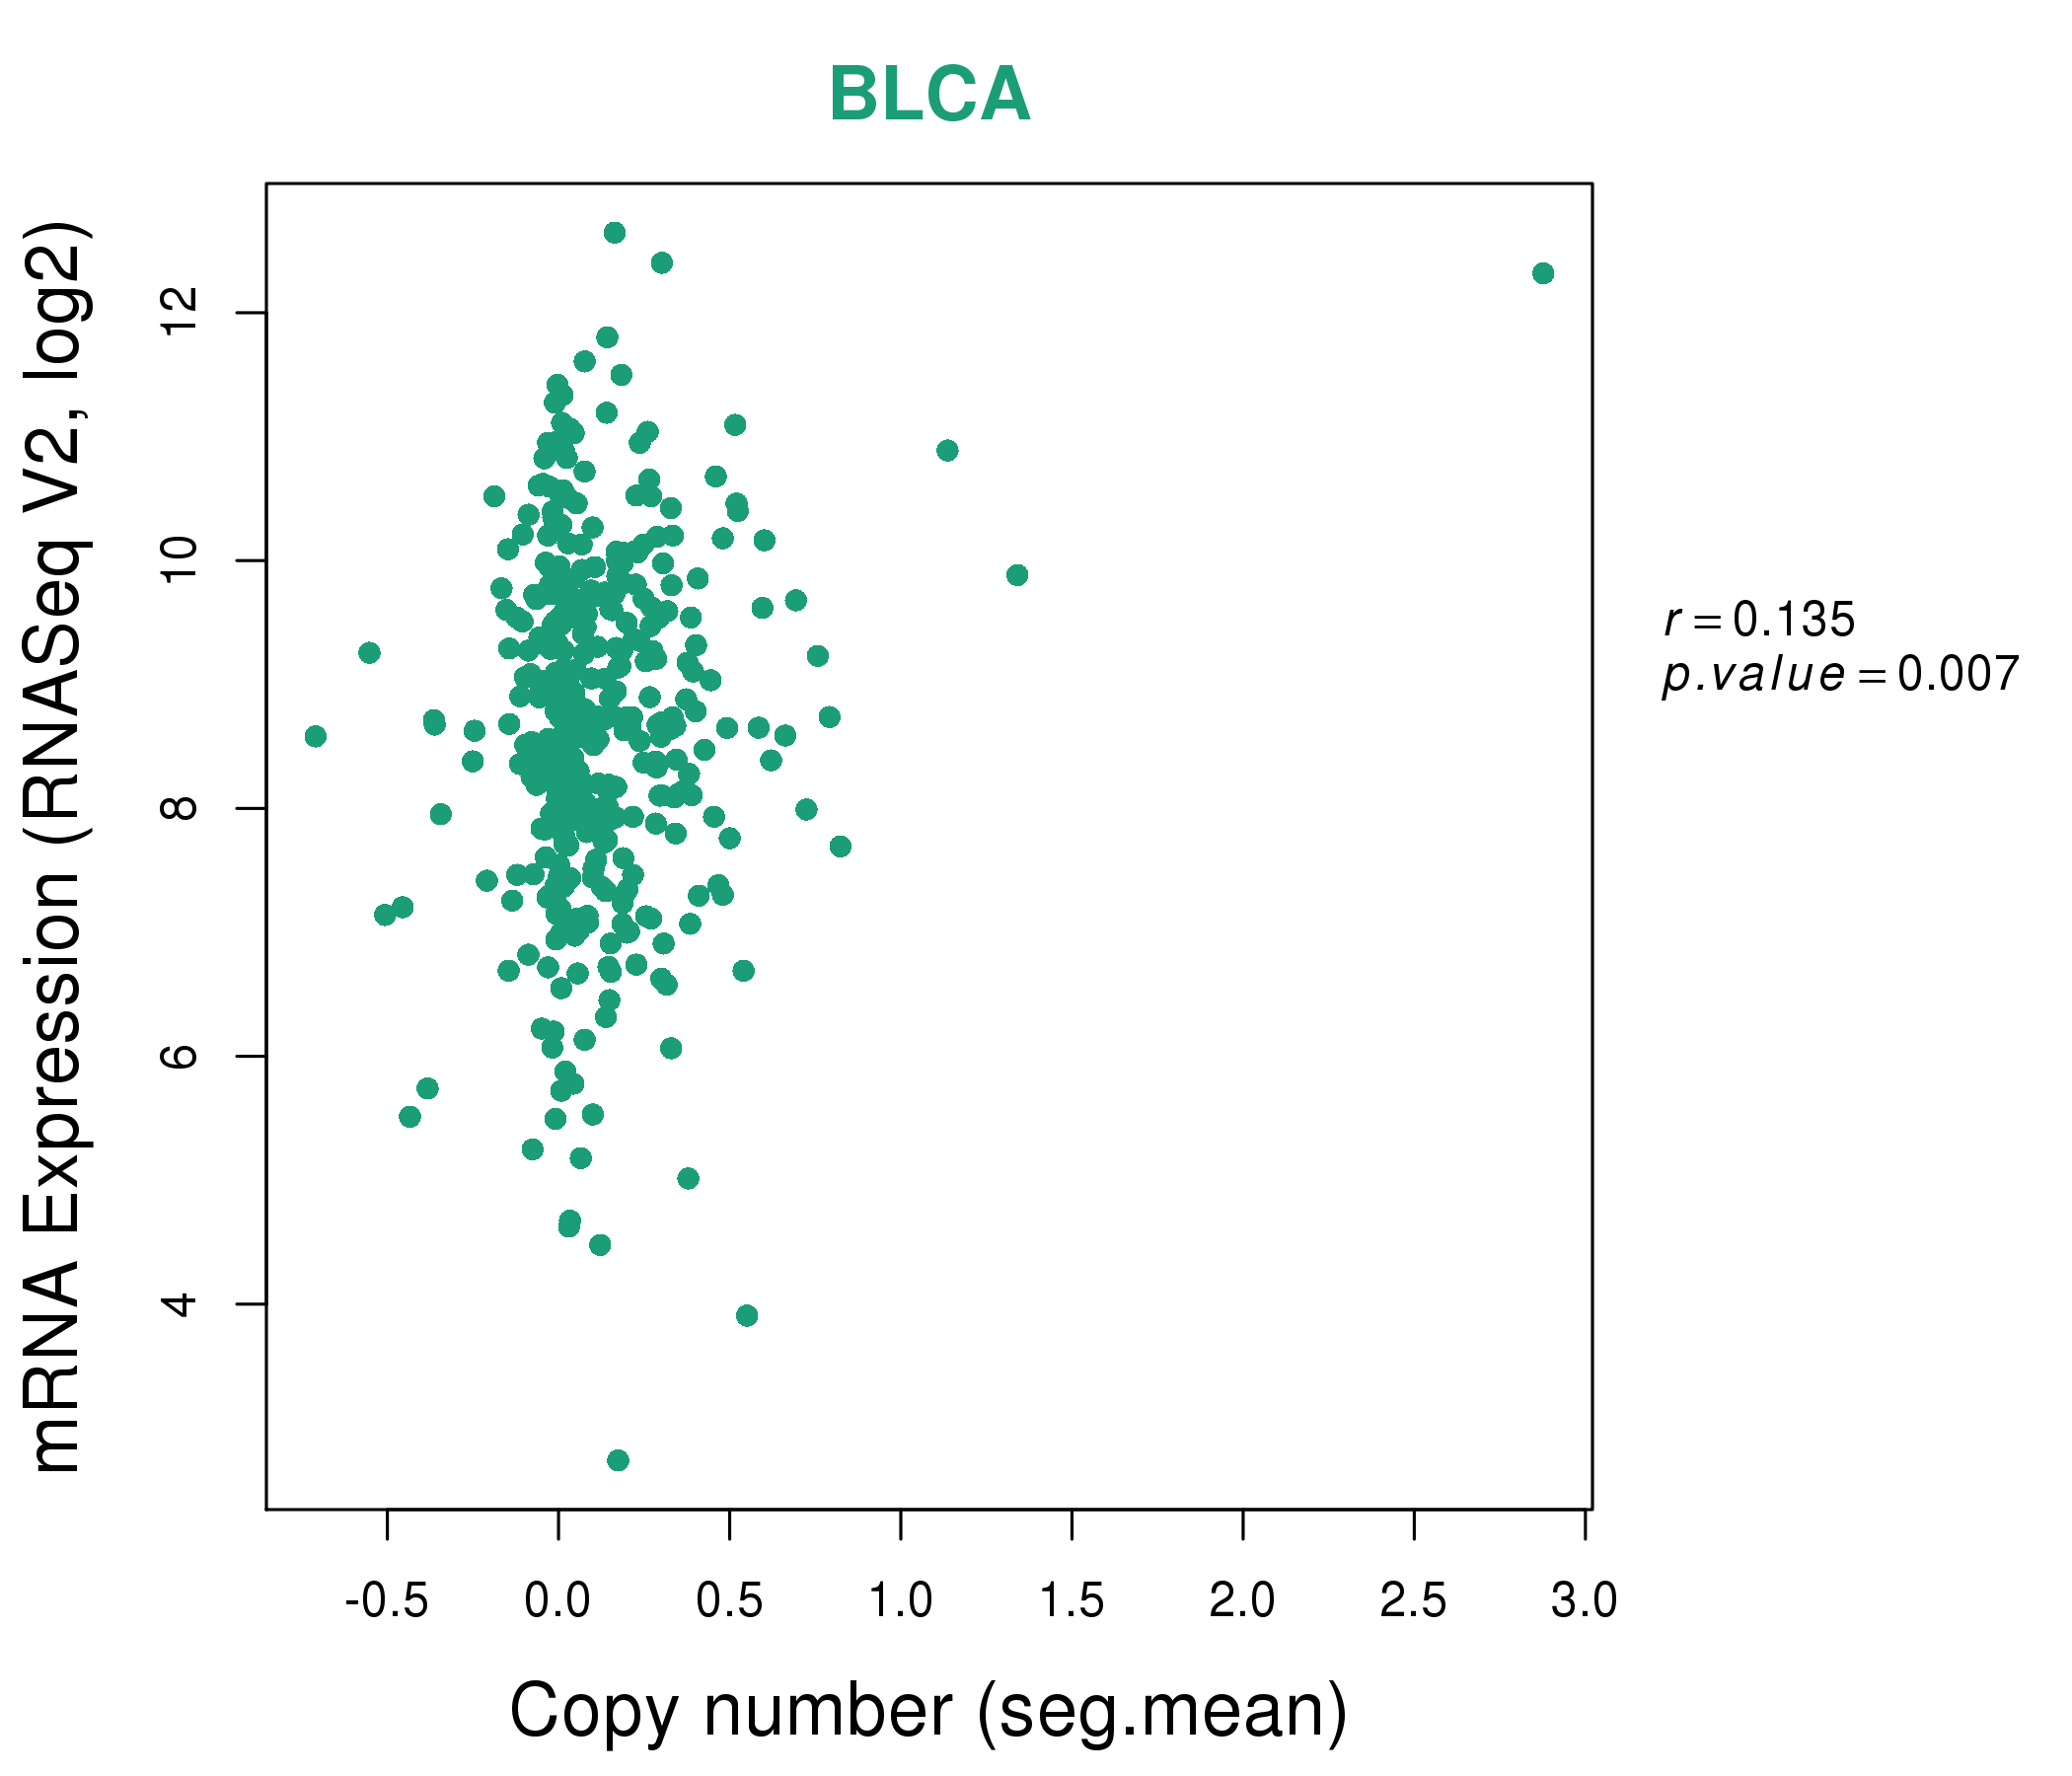
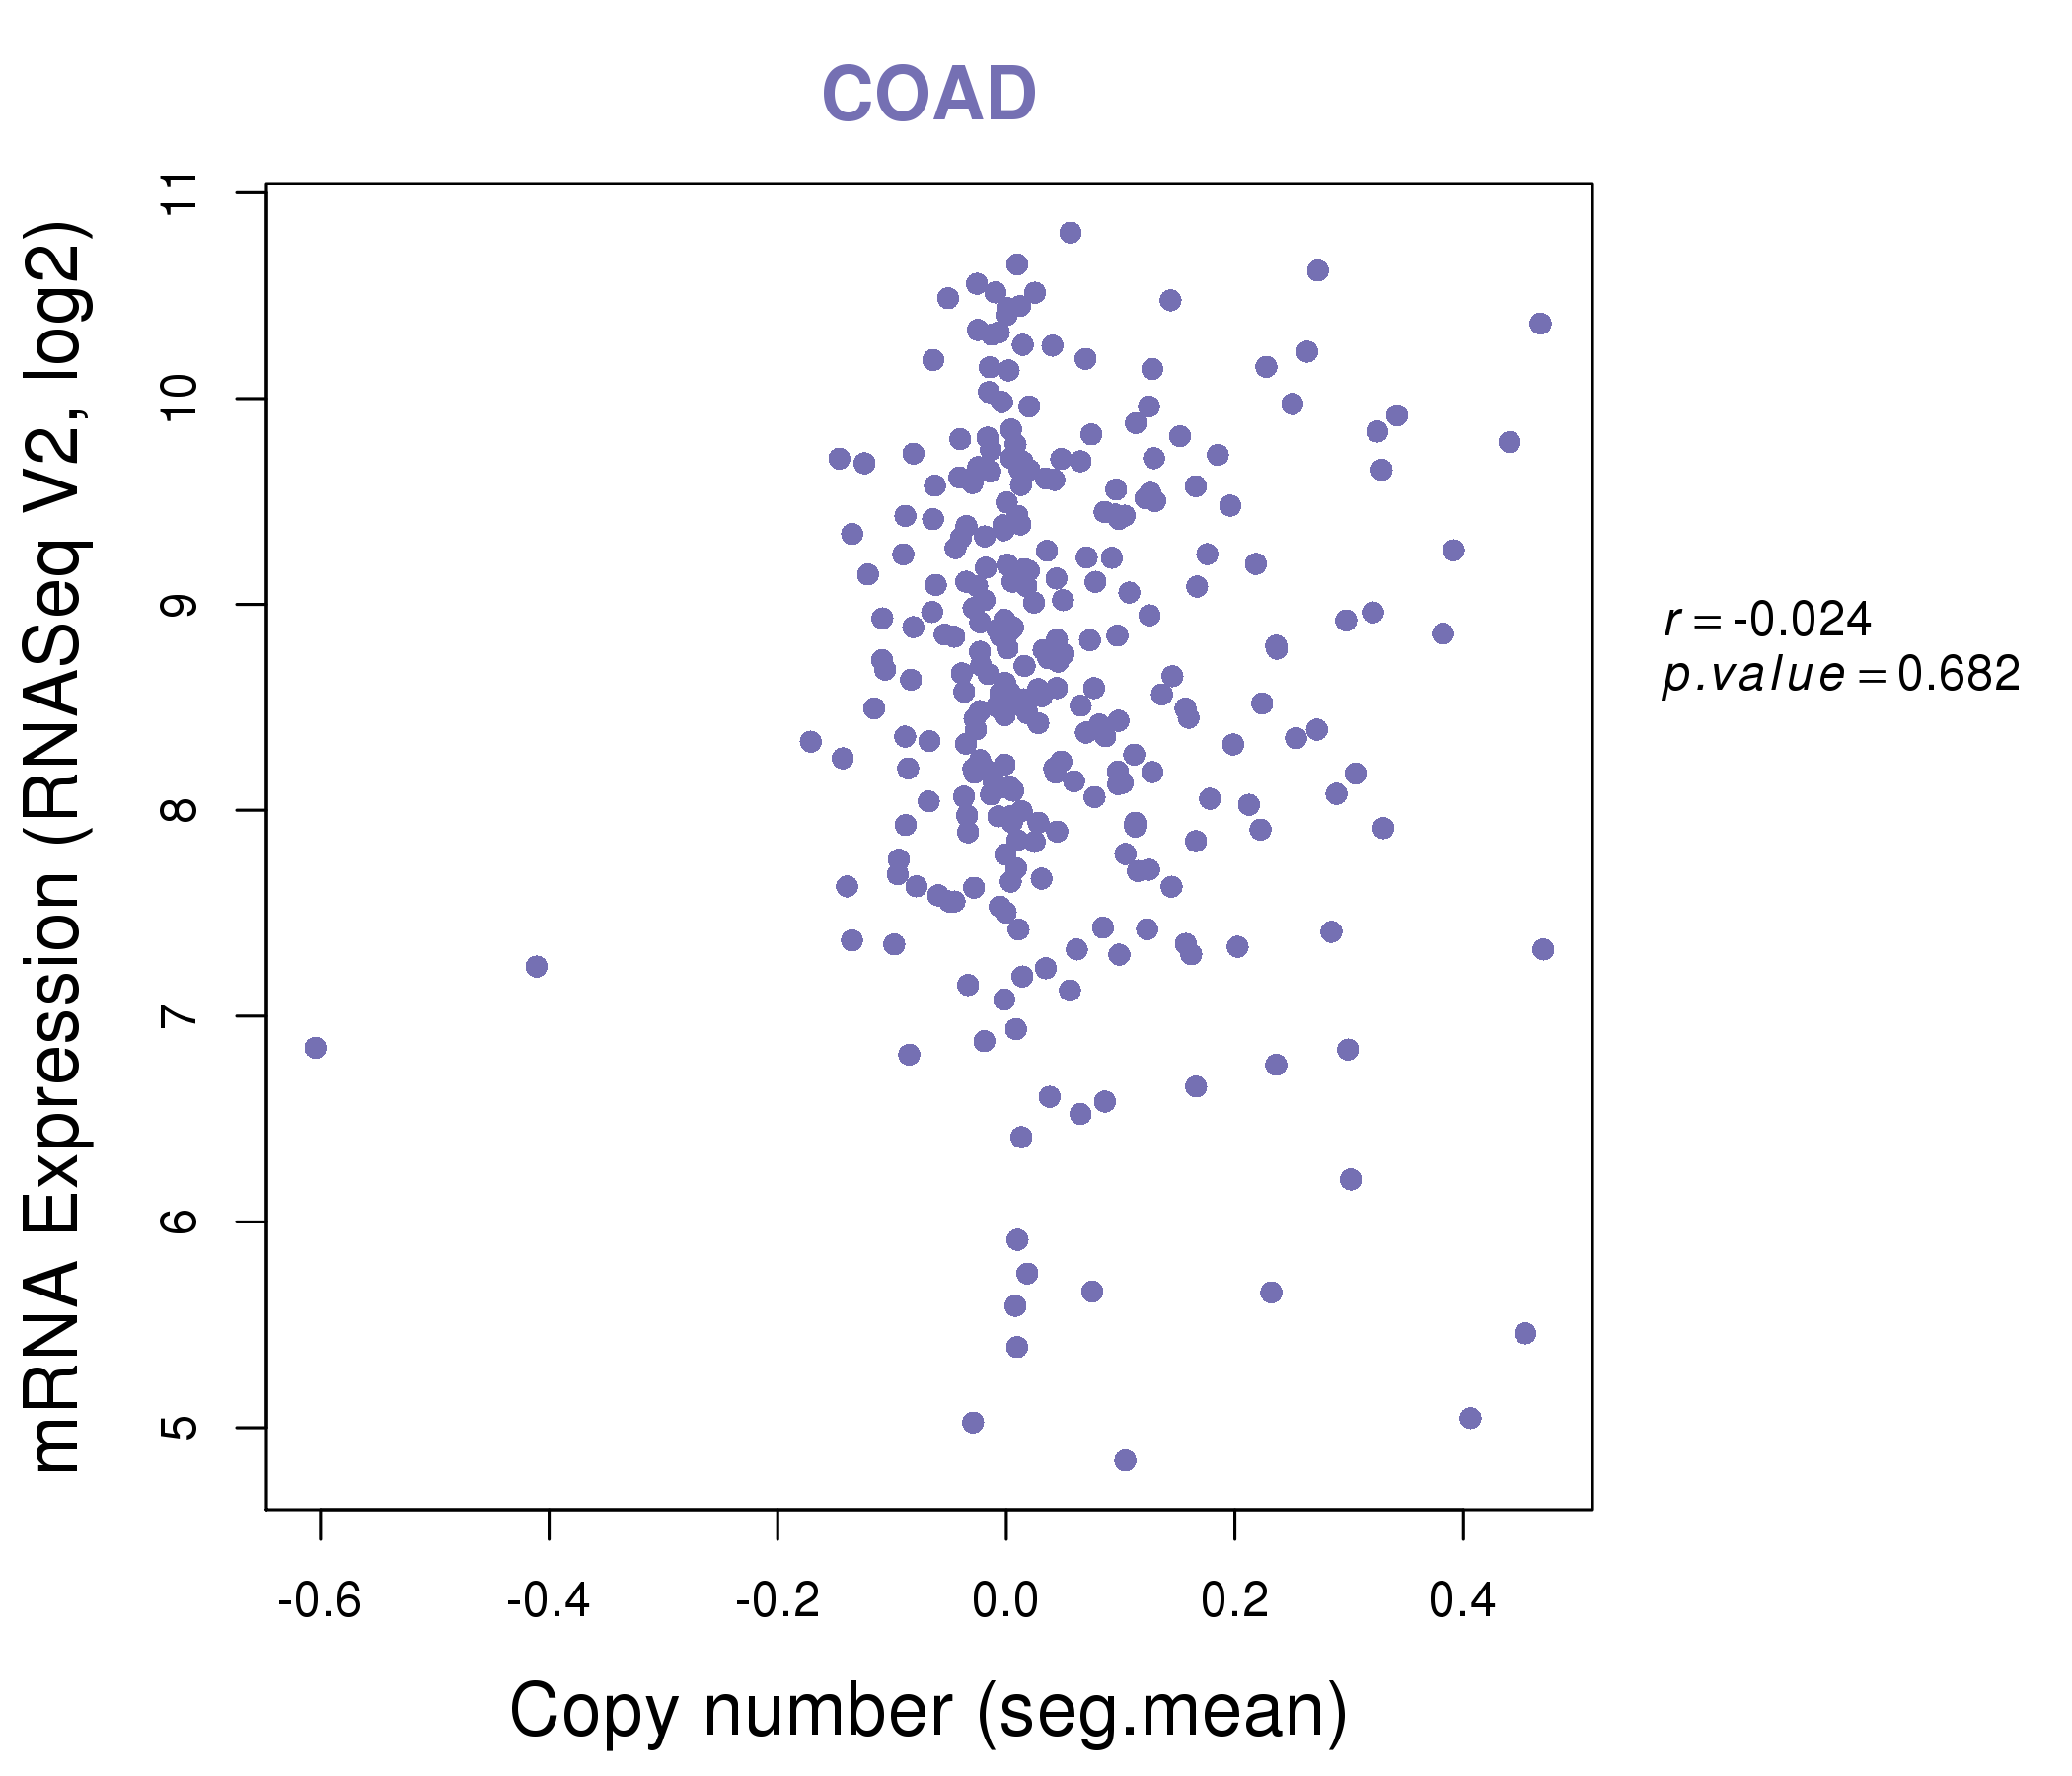
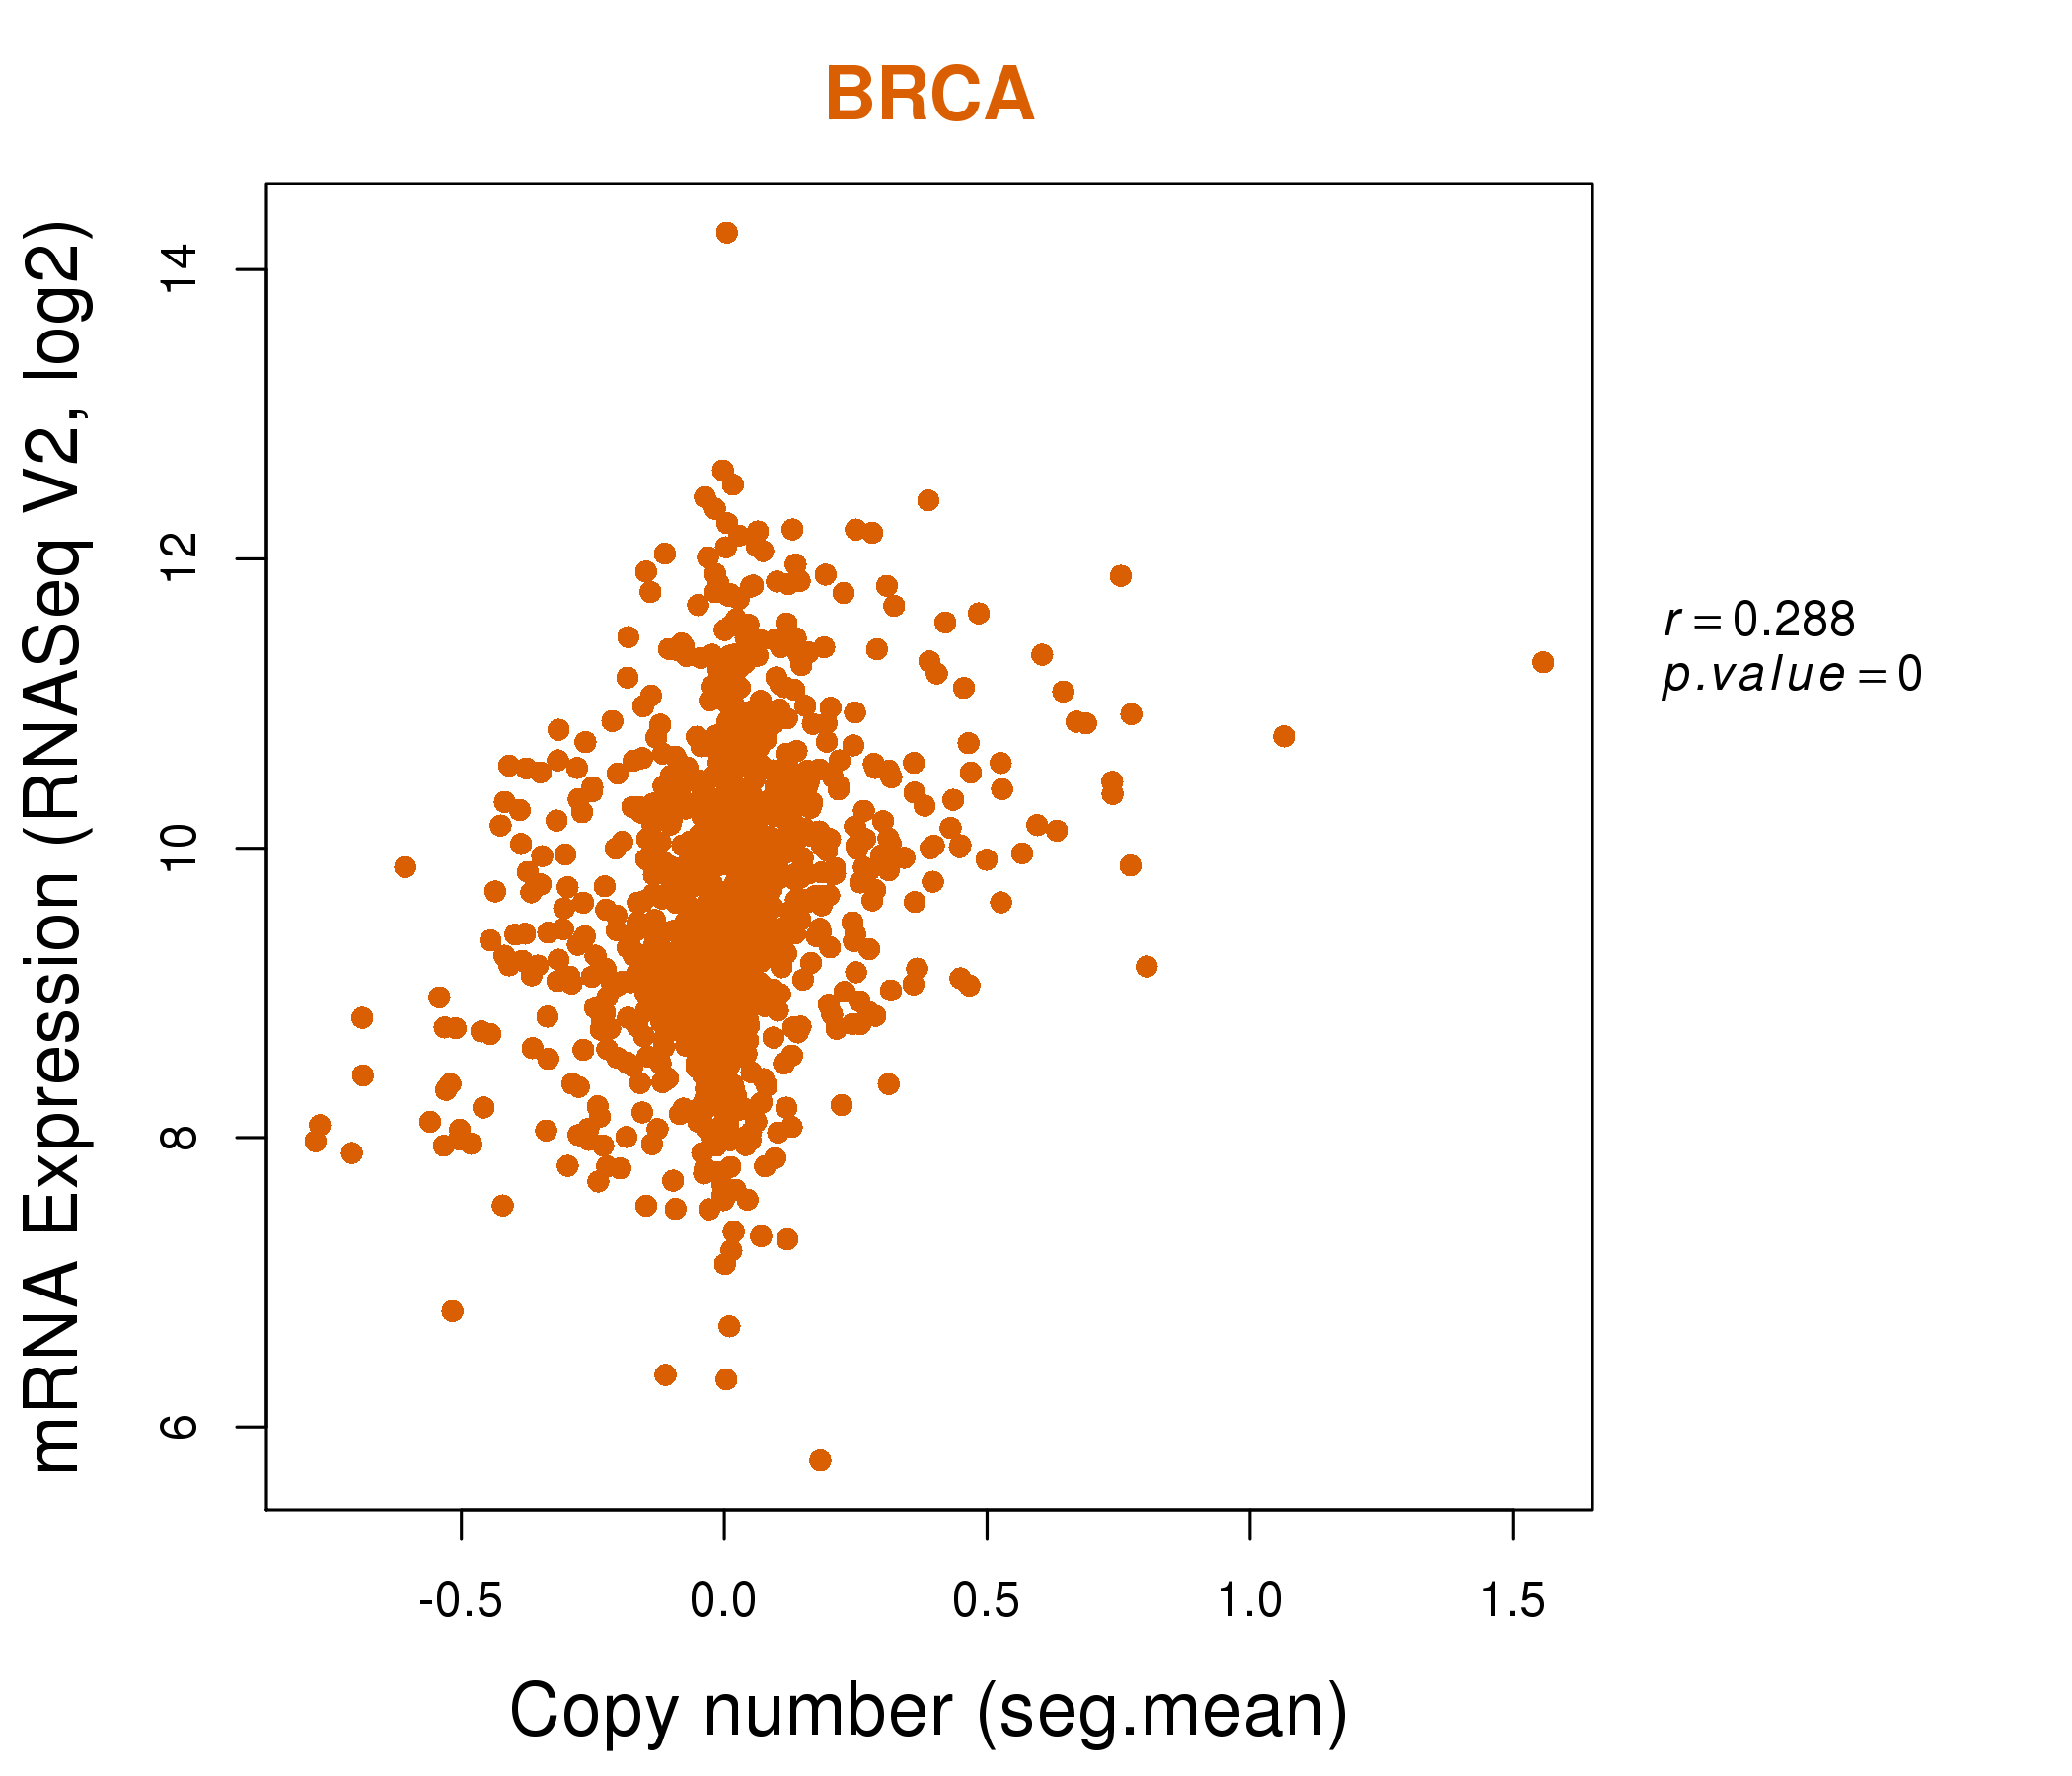
| * Copy number data were extracted from TCGA using R package TCGA-Assembler. The URLs of all public data files on TCGA DCC data server were gathered on Jan-05-2015. Function ProcessCNAData in TCGA-Assembler package was used to obtain gene-level copy number value which is calculated as the average copy number of the genomic region of a gene. |
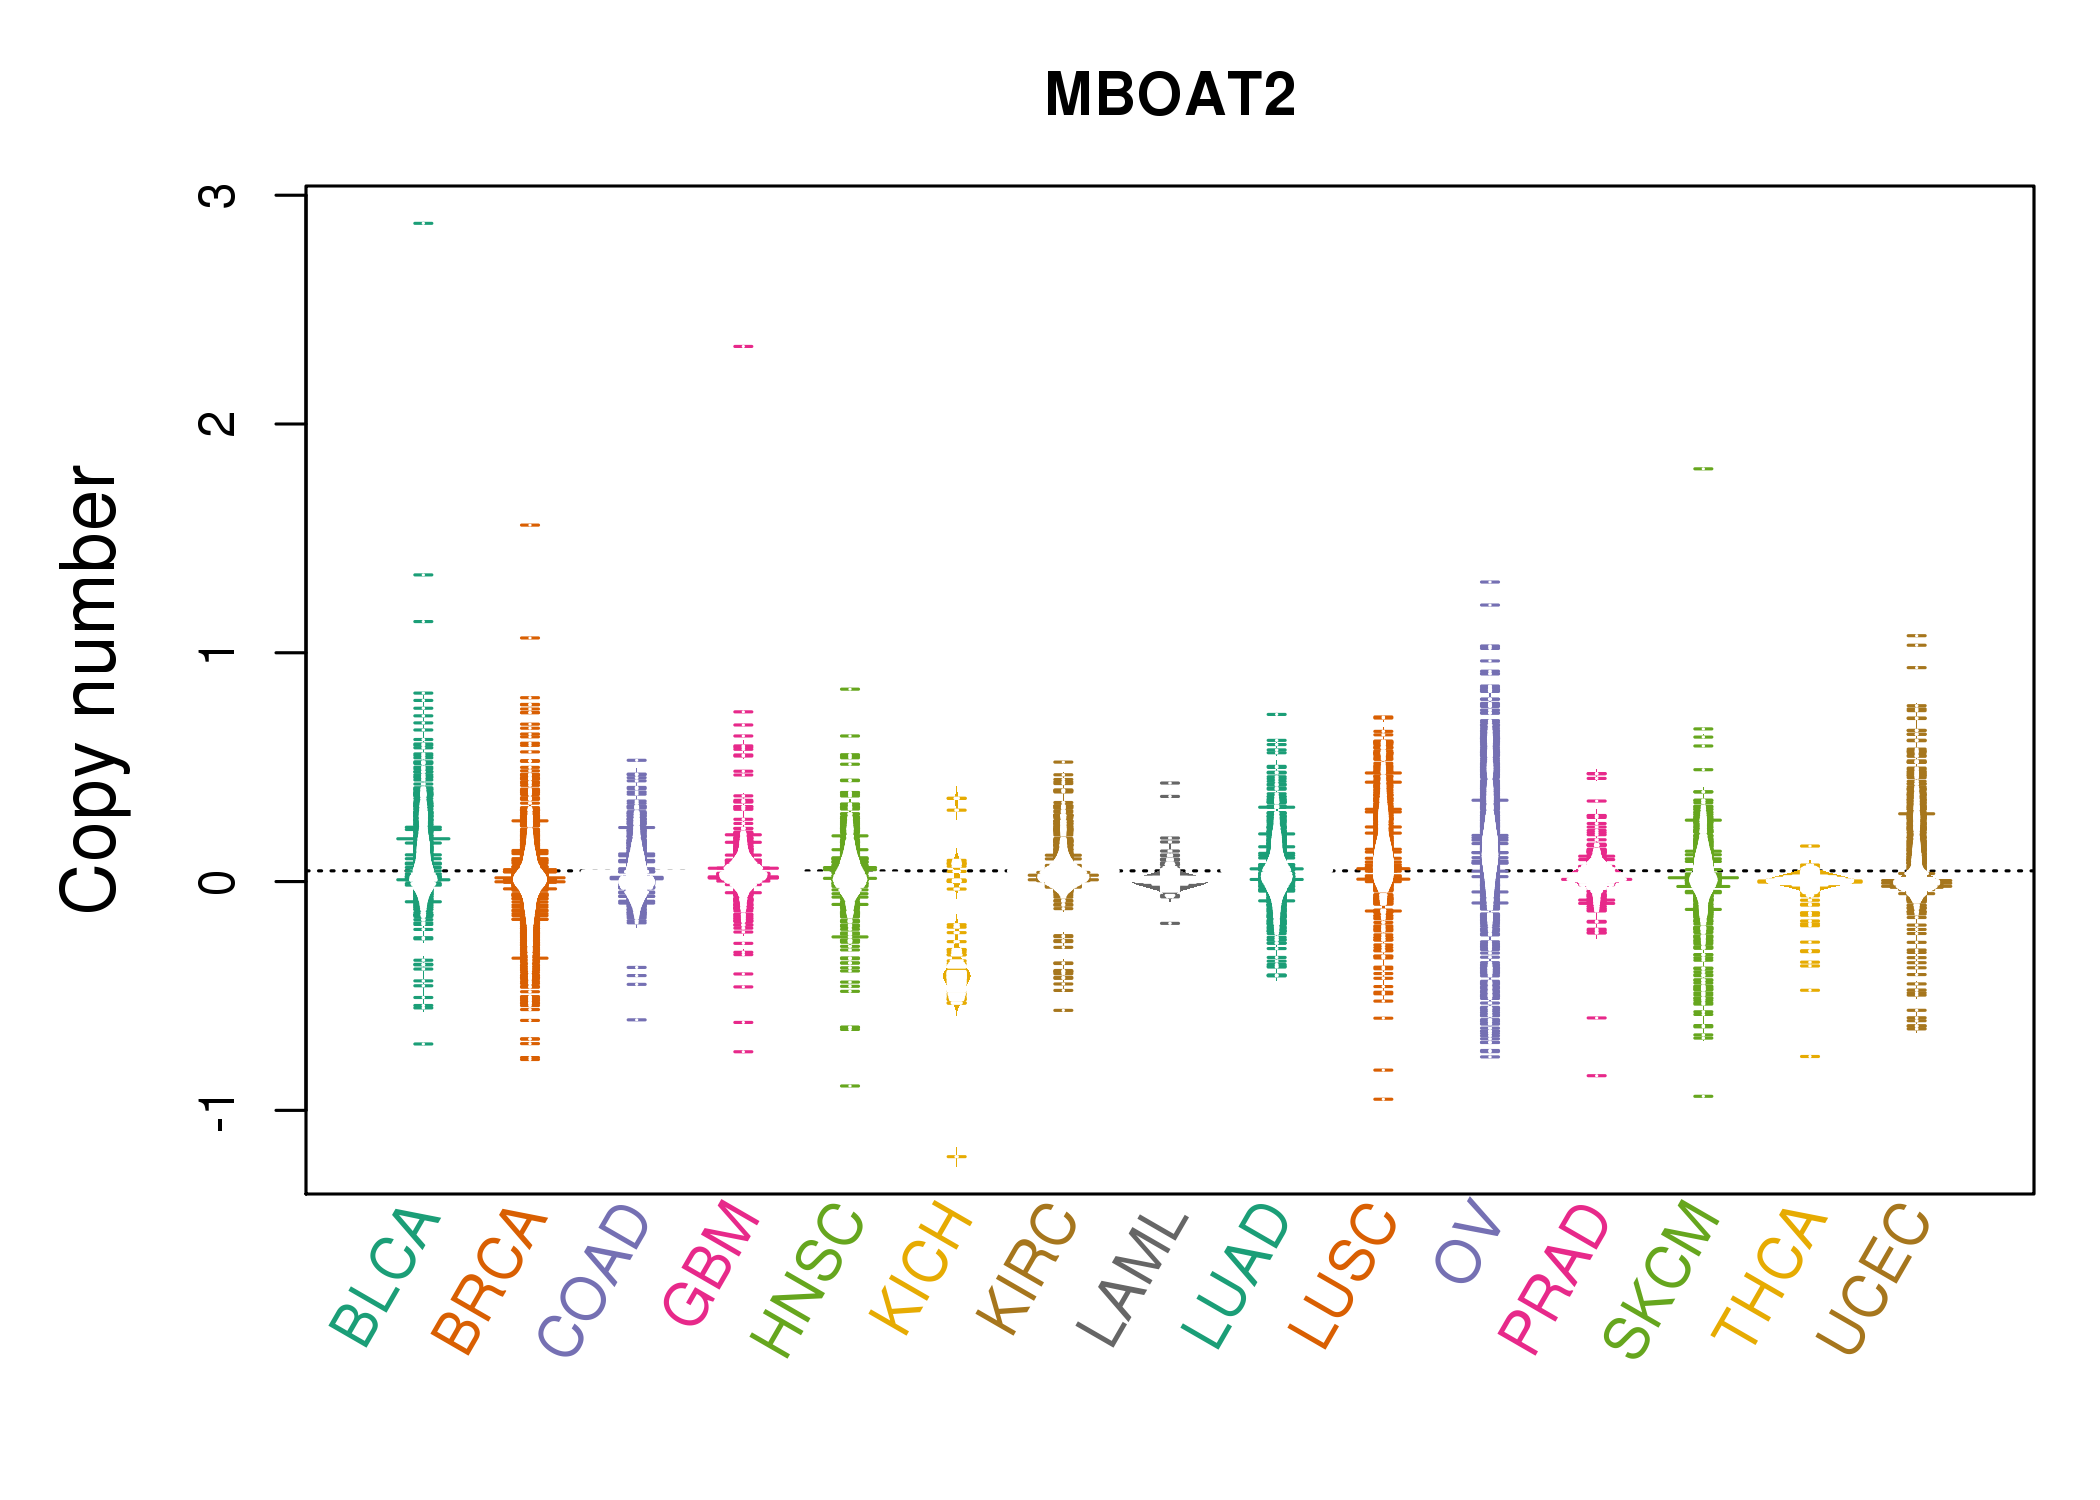 |
| cf) Tissue ID[Tissue type]: BLCA[Bladder Urothelial Carcinoma], BRCA[Breast invasive carcinoma], CESC[Cervical squamous cell carcinoma and endocervical adenocarcinoma], COAD[Colon adenocarcinoma], GBM[Glioblastoma multiforme], Glioma Low Grade, HNSC[Head and Neck squamous cell carcinoma], KICH[Kidney Chromophobe], KIRC[Kidney renal clear cell carcinoma], KIRP[Kidney renal papillary cell carcinoma], LAML[Acute Myeloid Leukemia], LUAD[Lung adenocarcinoma], LUSC[Lung squamous cell carcinoma], OV[Ovarian serous cystadenocarcinoma ], PAAD[Pancreatic adenocarcinoma], PRAD[Prostate adenocarcinoma], SKCM[Skin Cutaneous Melanoma], STAD[Stomach adenocarcinoma], THCA[Thyroid carcinoma], UCEC[Uterine Corpus Endometrial Carcinoma] |
| Top |
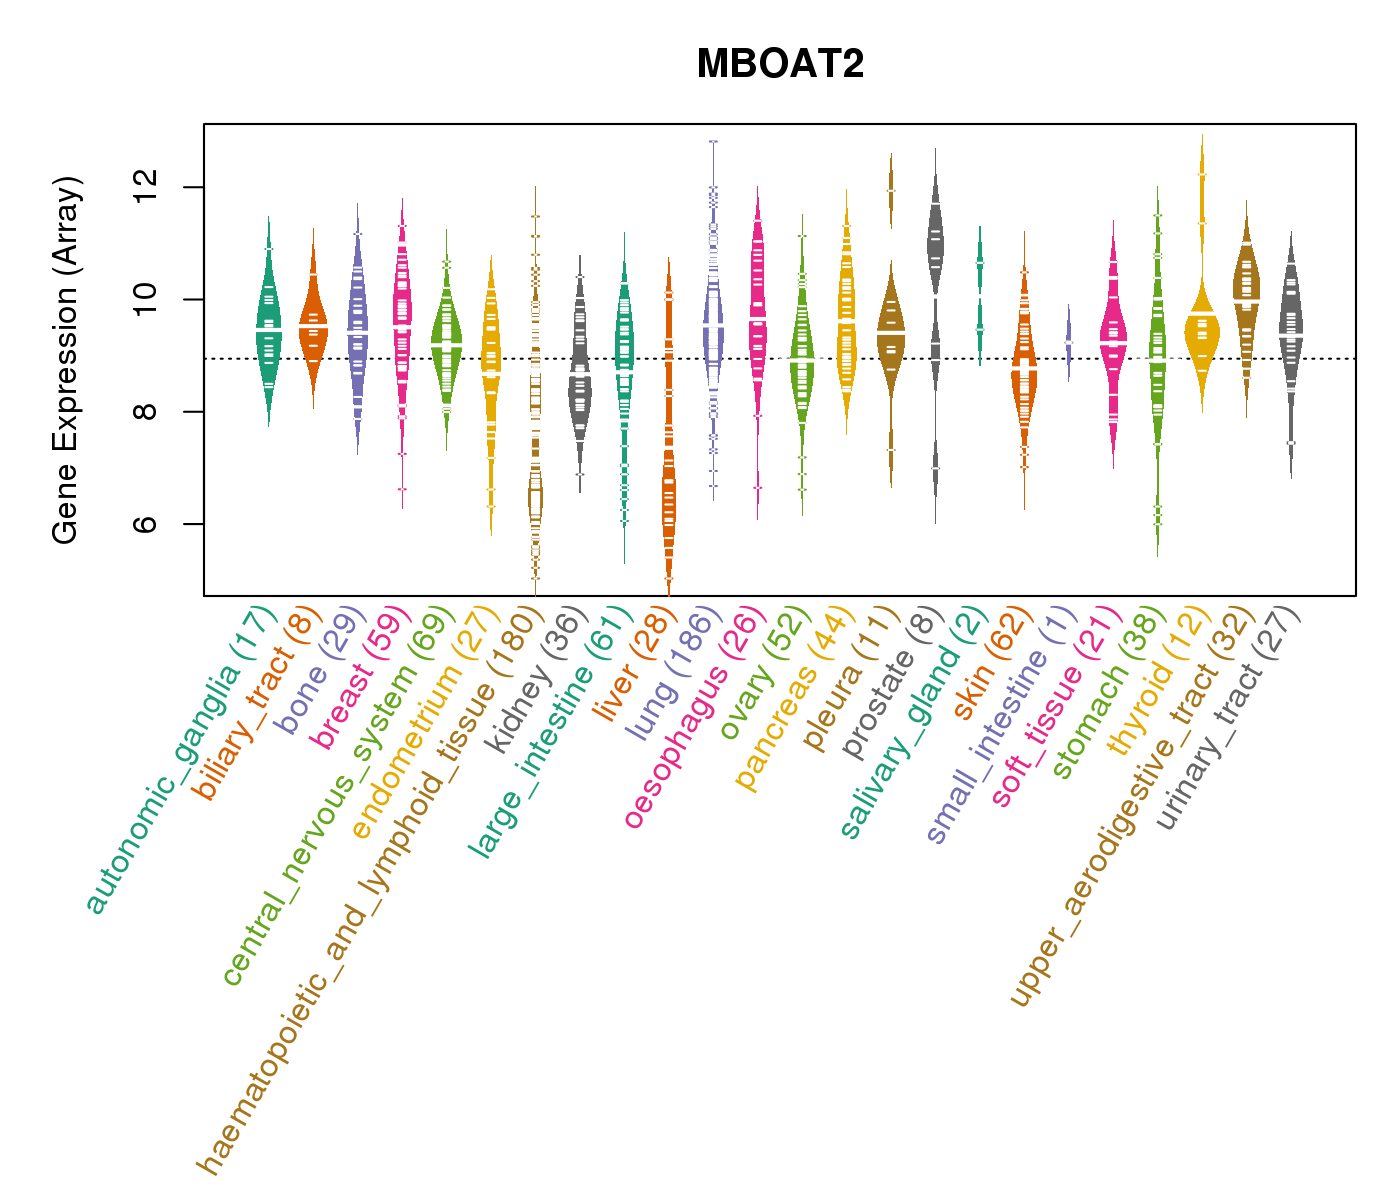
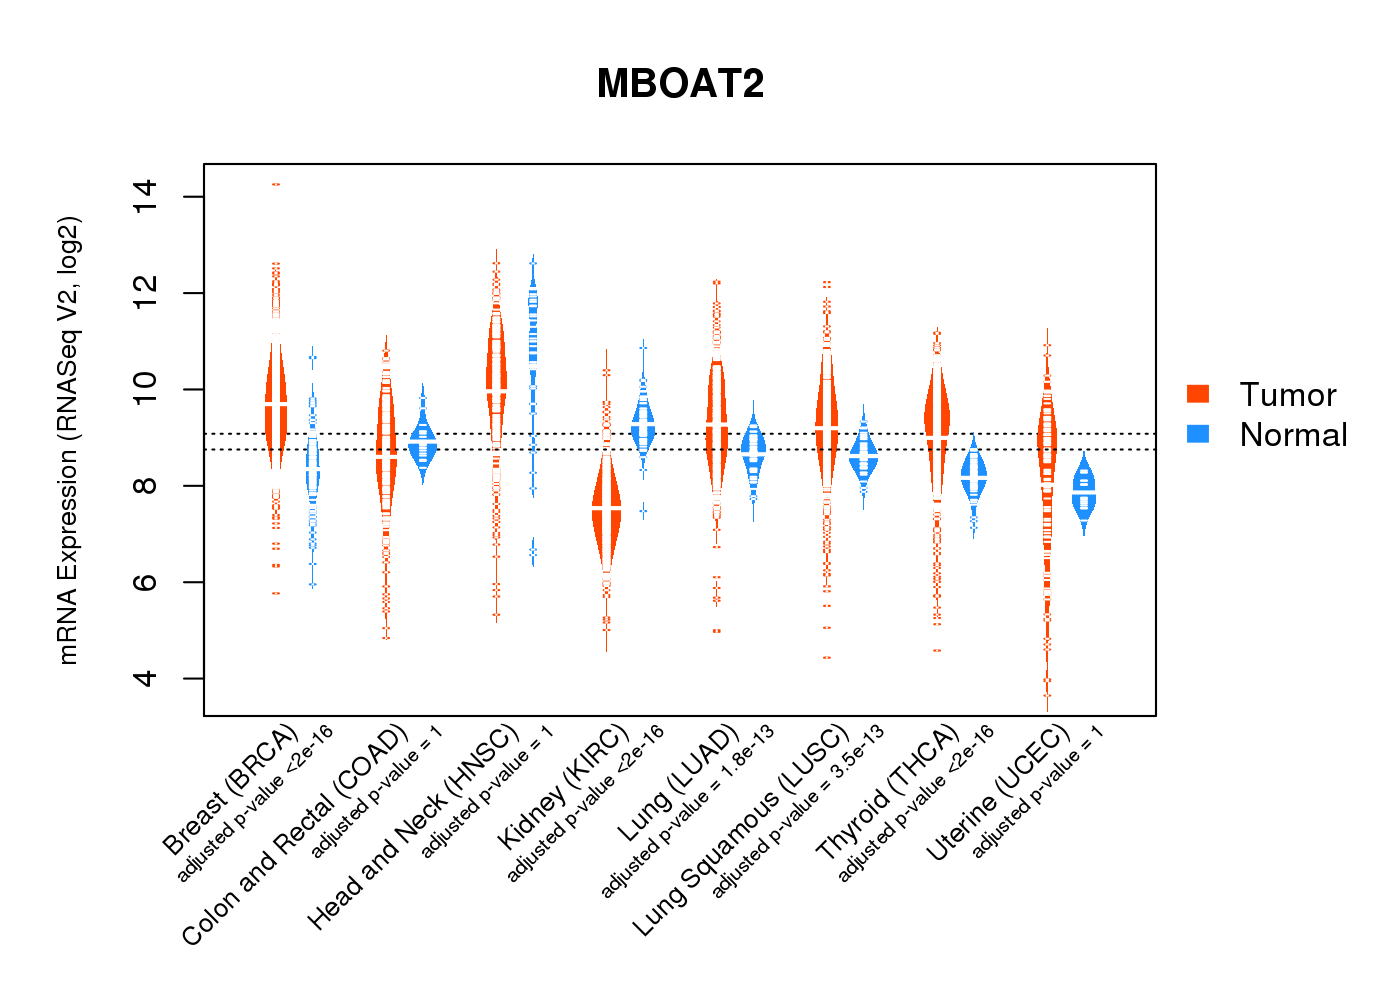
| Gene Expression for MBOAT2 |
| * CCLE gene expression data were extracted from CCLE_Expression_Entrez_2012-10-18.res: Gene-centric RMA-normalized mRNA expression data. |
 |
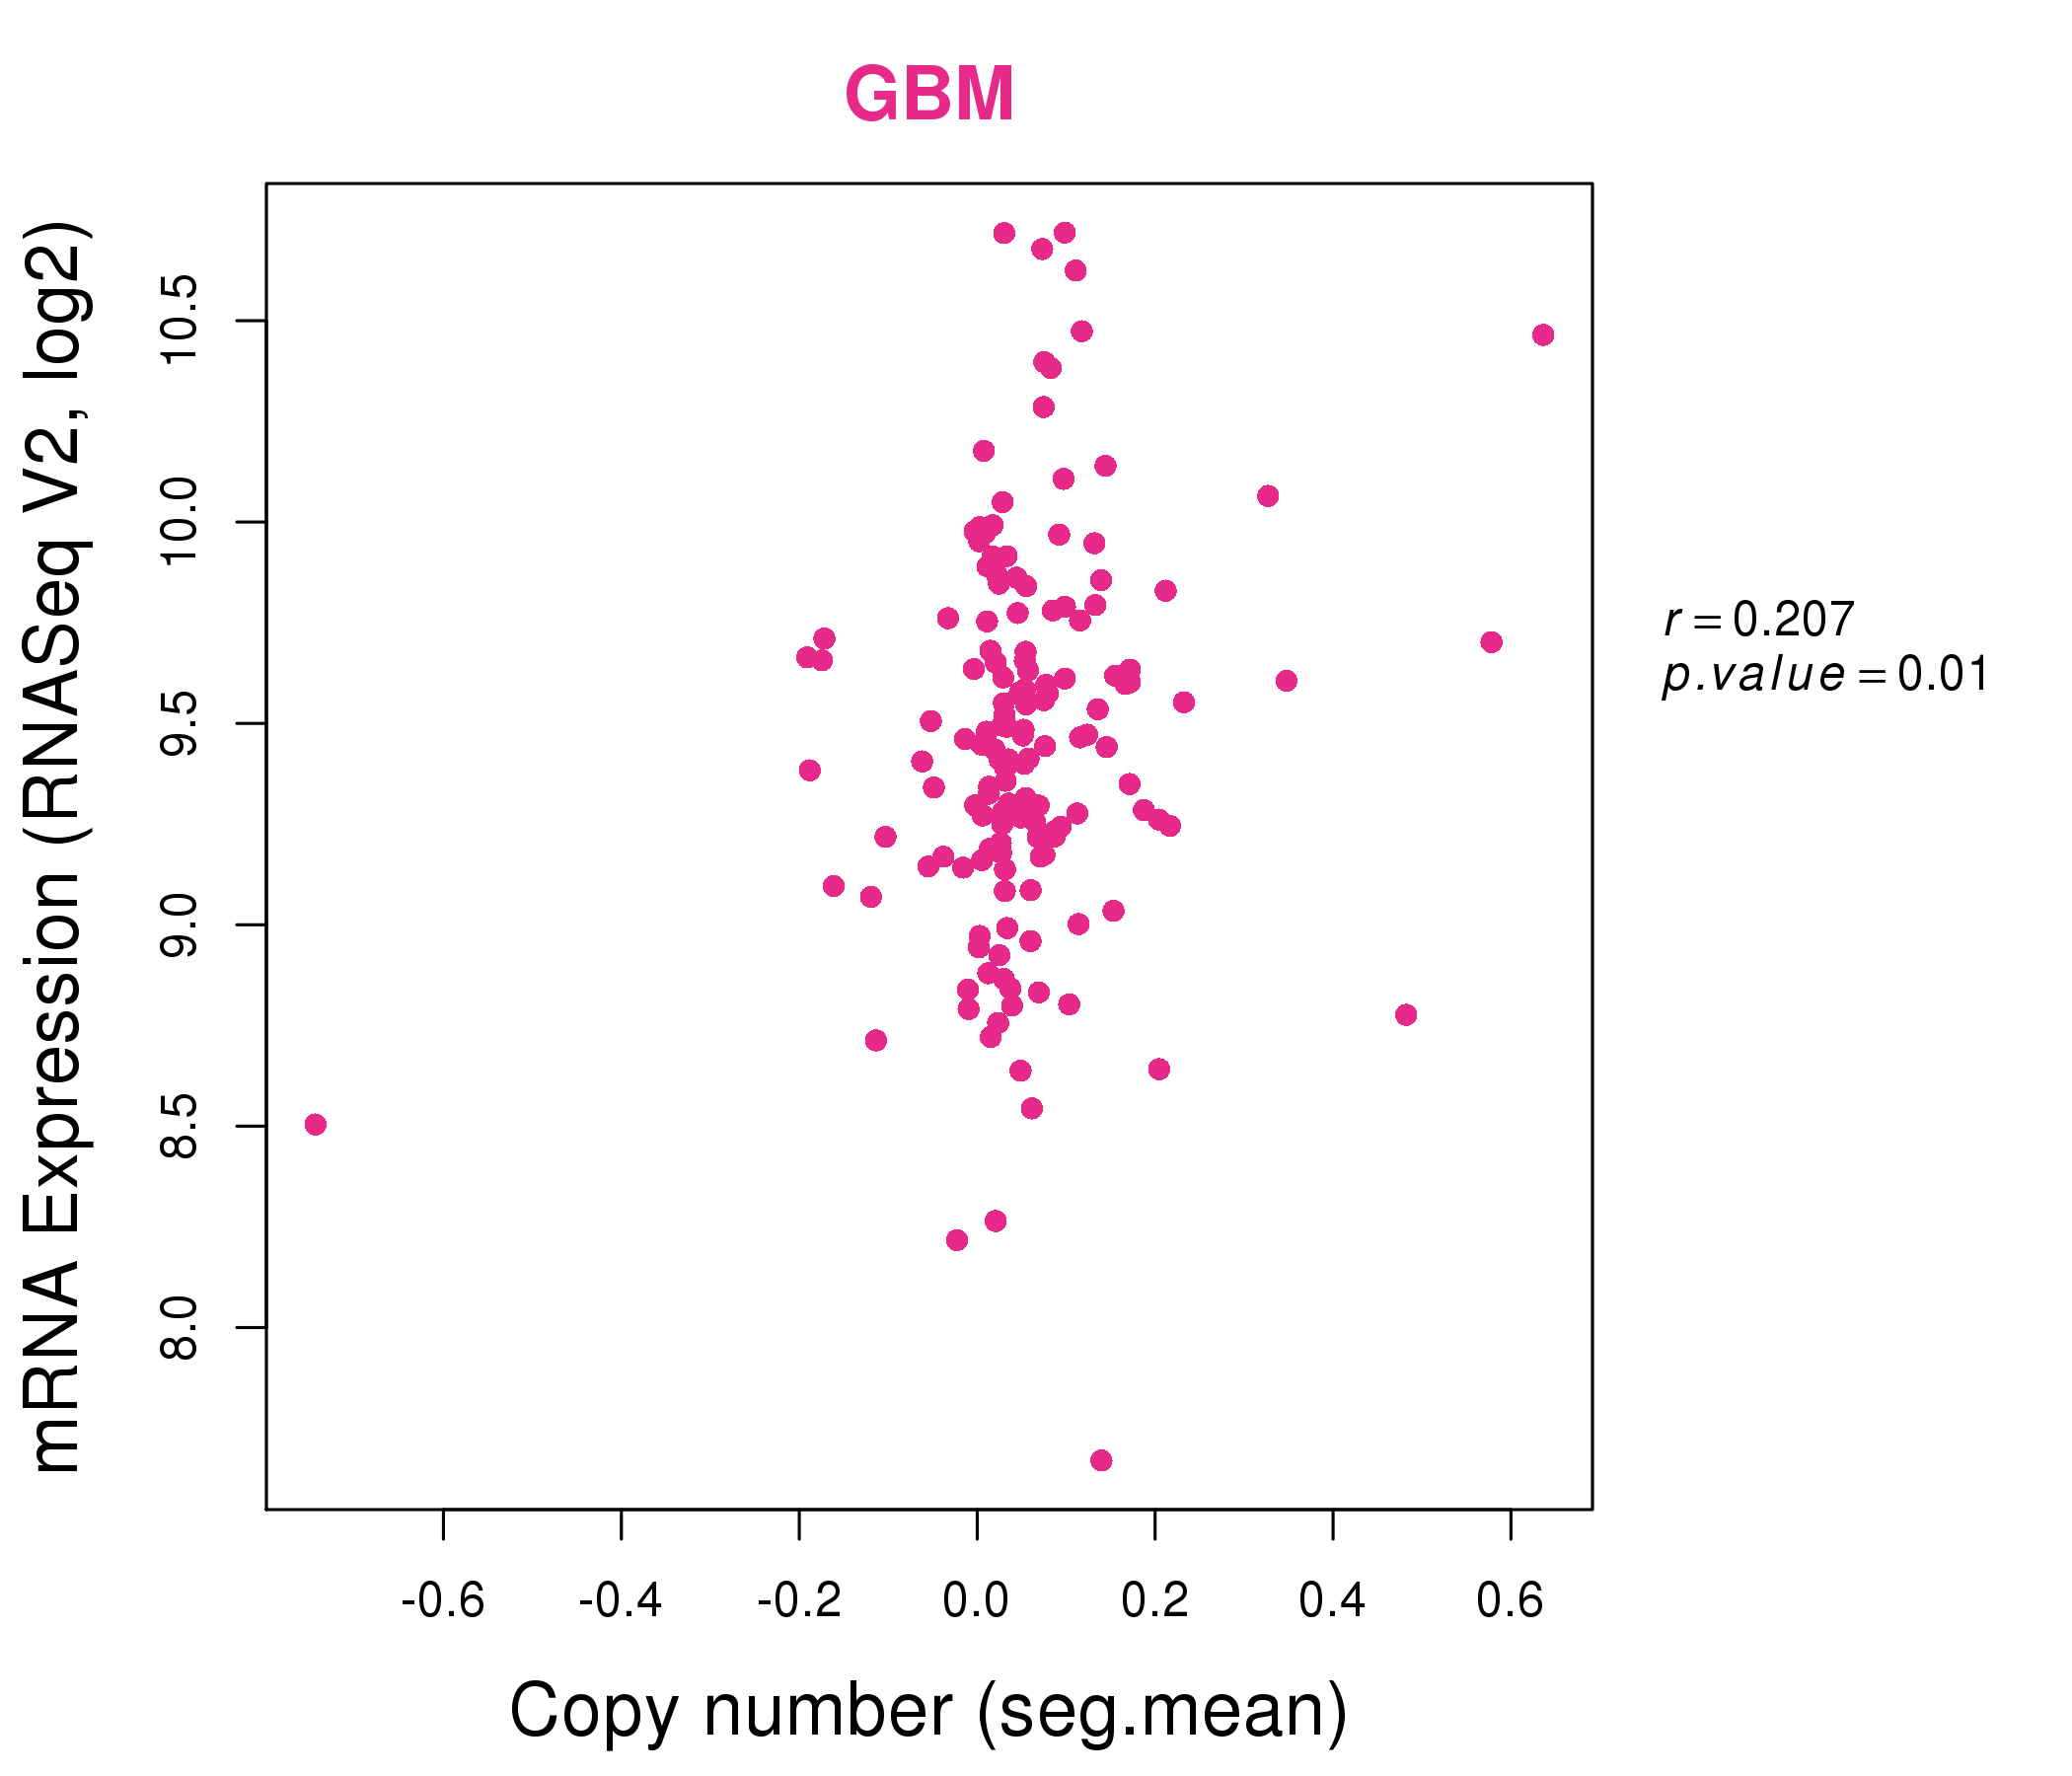
| * Normalized gene expression data of RNASeqV2 was extracted from TCGA using R package TCGA-Assembler. The URLs of all public data files on TCGA DCC data server were gathered at Jan-05-2015. Only eight cancer types have enough normal control samples for differential expression analysis. (t test, adjusted p<0.05 (using Benjamini-Hochberg FDR)) |
 |
| Top |
| * This plots show the correlation between CNV and gene expression. |
: Open all plots for all cancer types
 |
|
 |
|
| Top |
| Gene-Gene Network Information |
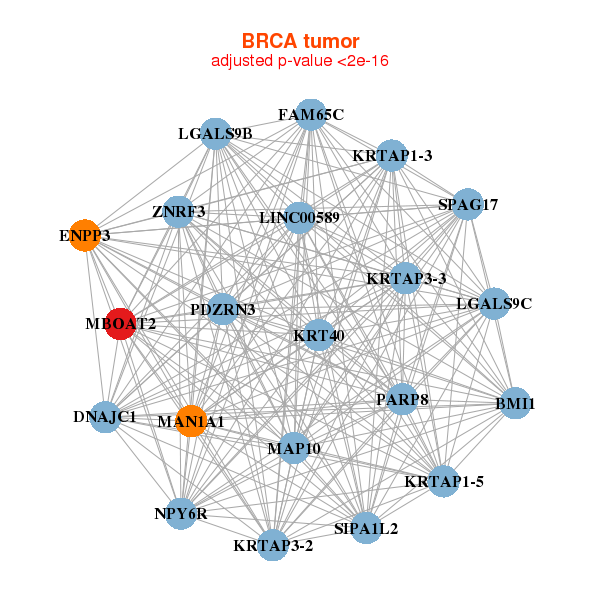
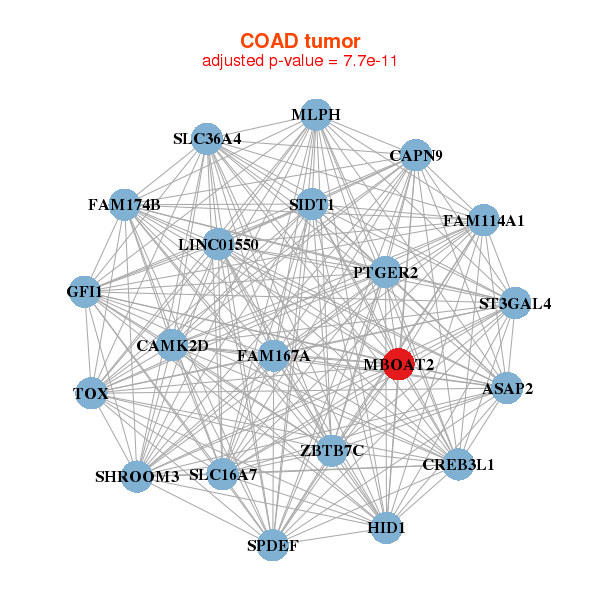
| * Co-Expression network figures were drawn using R package igraph. Only the top 20 genes with the highest correlations were shown. Red circle: input gene, orange circle: cell metabolism gene, sky circle: other gene |
: Open all plots for all cancer types
 |
|
| BMI1,LINC00589,DNAJC1,ENPP3,FAM65C,MAP10,KRT40, KRTAP1-3,KRTAP1-5,KRTAP3-2,KRTAP3-3,LGALS9B,LGALS9C,MAN1A1, MBOAT2,NPY6R,PARP8,PDZRN3,SIPA1L2,SPAG17,ZNRF3 | ACSL3,ALCAM,ALDH3B2,CEP128,CCDC15,CROT,FMO5, GCNT2,IQGAP2,KIAA1244,MBOAT2,MCCC2,NUP62CL,PON3, PTPLAD1,PXMP4,SLC38A1,TMEM62,TMEM63C,TRIM36,UGT2B11 |
 |
|
| ASAP2,LINC01550,HID1,CAMK2D,CAPN9,CREB3L1,FAM114A1, FAM167A,FAM174B,GFI1,MBOAT2,MLPH,PTGER2,SHROOM3, SIDT1,SLC16A7,SLC36A4,SPDEF,ST3GAL4,TOX,ZBTB7C | AP2B1,LINC00589,C9orf152,CASD1,CPM,GALNT5,IL1R2, KLK1,MAP3K5,MBOAT2,MFSD6L,MLPH,MTMR1,MYO5C, NANS,QSOX1,SLC1A5,SLC7A4,SYTL4,TTC39A,WNK4 |

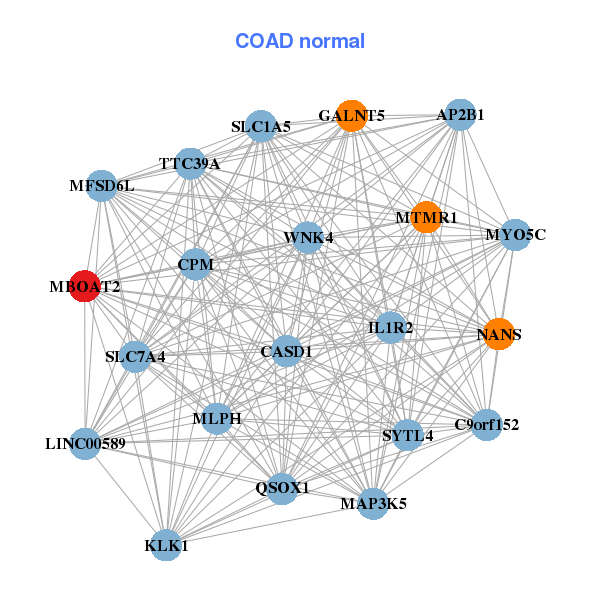
| * Co-Expression network figures were drawn using R package igraph. Only the top 20 genes with the highest correlations were shown. Red circle: input gene, orange circle: cell metabolism gene, sky circle: other gene |
: Open all plots for all cancer types
| Top |
: Open all interacting genes' information including KEGG pathway for all interacting genes from DAVID
| Top |
| Pharmacological Information for MBOAT2 |
| There's no related Drug. |
| Top |
| Cross referenced IDs for MBOAT2 |
| * We obtained these cross-references from Uniprot database. It covers 150 different DBs, 18 categories. http://www.uniprot.org/help/cross_references_section |
: Open all cross reference information
|
Copyright © 2016-Present - The Univsersity of Texas Health Science Center at Houston @ |