|
||||||||||||||||||||
| |
| Phenotypic Information (metabolism pathway, cancer, disease, phenome) |
| |
| |
| Gene-Gene Network Information: Co-Expression Network, Interacting Genes & KEGG |
| |
|


| Gene Summary for GALM |
| Top |
| Phenotypic Information for GALM(metabolism pathway, cancer, disease, phenome) |
| Cancer | CGAP: GALM |
| Familial Cancer Database: GALM | |
| * This gene is included in those cancer gene databases. |
|
|
|
|
|
| . | ||||||||||||||
Oncogene 1 | Significant driver gene in | |||||||||||||||||||
| cf) number; DB name 1 Oncogene; http://nar.oxfordjournals.org/content/35/suppl_1/D721.long, 2 Tumor Suppressor gene; https://bioinfo.uth.edu/TSGene/, 3 Cancer Gene Census; http://www.nature.com/nrc/journal/v4/n3/abs/nrc1299.html, 4 CancerGenes; http://nar.oxfordjournals.org/content/35/suppl_1/D721.long, 5 Network of Cancer Gene; http://ncg.kcl.ac.uk/index.php, 1Therapeutic Vulnerabilities in Cancer; http://cbio.mskcc.org/cancergenomics/statius/ |
| KEGG_GLYCOLYSIS_GLUCONEOGENESIS | |
| OMIM | |
| Orphanet | |
| Disease | KEGG Disease: GALM |
| MedGen: GALM (Human Medical Genetics with Condition) | |
| ClinVar: GALM | |
| Phenotype | MGI: GALM (International Mouse Phenotyping Consortium) |
| PhenomicDB: GALM | |
| Mutations for GALM |
| * Under tables are showing count per each tissue to give us broad intuition about tissue specific mutation patterns.You can go to the detailed page for each mutation database's web site. |
| - Statistics for Tissue and Mutation type | Top |
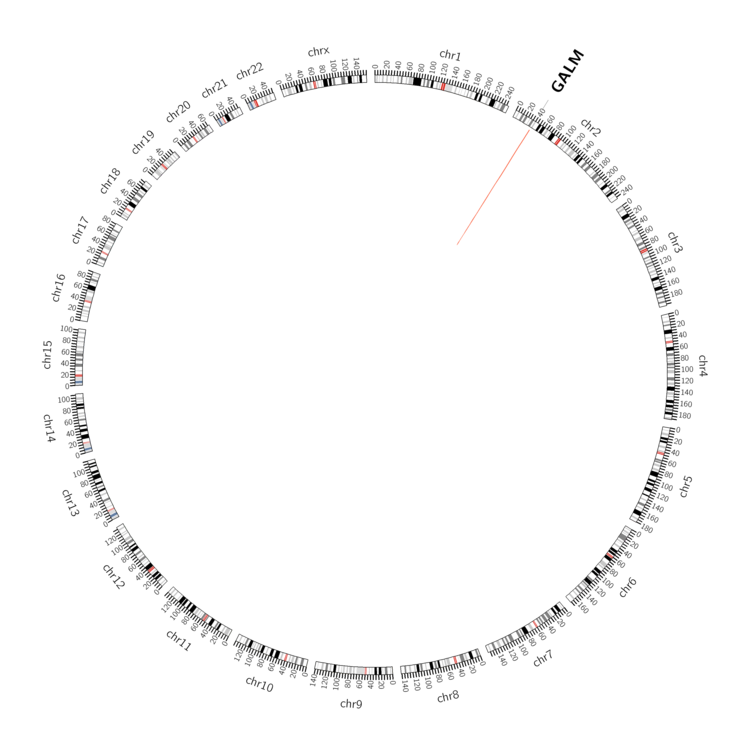 |
| - For Inter-chromosomal Variations |
| There's no inter-chromosomal structural variation. |
| - For Intra-chromosomal Variations |
| * Intra-chromosomal variantions includes 'intrachromosomal amplicon to amplicon', 'intrachromosomal amplicon to non-amplified dna', 'intrachromosomal deletion', 'intrachromosomal fold-back inversion', 'intrachromosomal inversion', 'intrachromosomal tandem duplication', 'Intrachromosomal unknown type', 'intrachromosomal with inverted orientation', 'intrachromosomal with non-inverted orientation'. |
 |
| Sample | Symbol_a | Chr_a | Start_a | End_a | Symbol_b | Chr_b | Start_b | End_b |
| ovary | GALM | chr2 | 38944272 | 38944292 | GALM | chr2 | 38944398 | 38944418 |
| pancreas | GALM | chr2 | 38931828 | 38931848 | chr2 | 38346045 | 38346065 |
| cf) Tissue number; Tissue name (1;Breast, 2;Central_nervous_system, 3;Haematopoietic_and_lymphoid_tissue, 4;Large_intestine, 5;Liver, 6;Lung, 7;Ovary, 8;Pancreas, 9;Prostate, 10;Skin, 11;Soft_tissue, 12;Upper_aerodigestive_tract) |
| * From mRNA Sanger sequences, Chitars2.0 arranged chimeric transcripts. This table shows GALM related fusion information. |
| ID | Head Gene | Tail Gene | Accession | Gene_a | qStart_a | qEnd_a | Chromosome_a | tStart_a | tEnd_a | Gene_a | qStart_a | qEnd_a | Chromosome_a | tStart_a | tEnd_a |
| BX107111 | GALM | 1 | 170 | 2 | 38960844 | 38961013 | SNX14 | 167 | 471 | 6 | 86216319 | 86216623 | |
| CR997728 | GALM | 257 | 751 | 2 | 38905701 | 39308967 | ALK | 745 | 796 | 2 | 30081615 | 30081666 | |
| Top |
| There's no copy number variation information in COSMIC data for this gene. |
| Top |
|
 |
| Top |
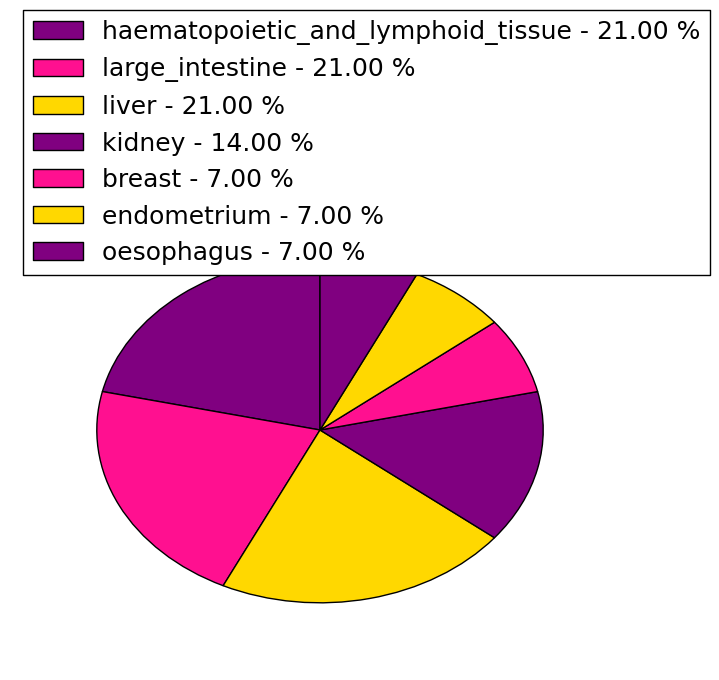
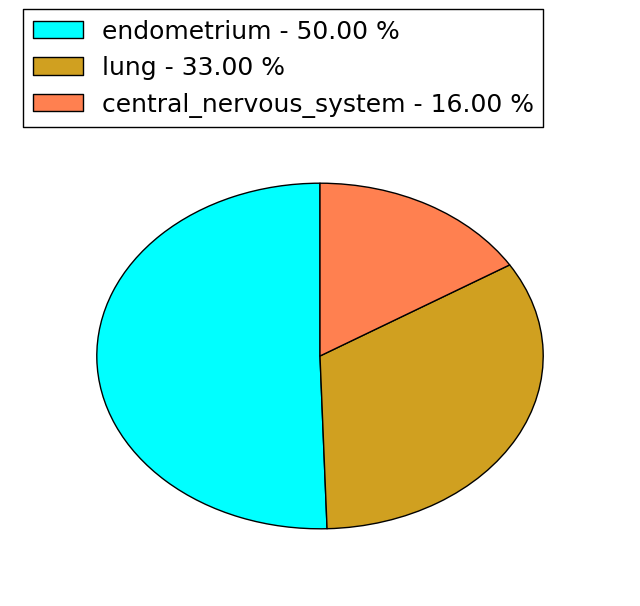
| Stat. for Non-Synonymous SNVs (# total SNVs=14) | (# total SNVs=6) |
 |  |
(# total SNVs=0) | (# total SNVs=0) |
| Top |
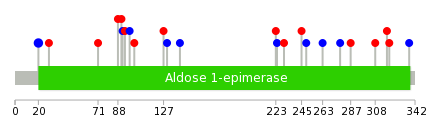
| * When you move the cursor on each content, you can see more deailed mutation information on the Tooltip. Those are primary_site,primary_histology,mutation(aa),pubmedID. |
| GRCh37 position | Mutation(aa) | Unique sampleID count |
| chr2:38893492-38893492 | p.E63D | 3 |
| chr2:38960639-38960639 | p.P321S | 2 |
| chr2:38956797-38956797 | p.N245I | 1 |
| chr2:38893397-38893397 | p.D32N | 1 |
| chr2:38908466-38908466 | p.S130S | 1 |
| chr2:38956810-38956810 | p.K249K | 1 |
| chr2:38893484-38893484 | p.E61* | 1 |
| chr2:38908499-38908499 | p.P141P | 1 |
| chr2:38958889-38958889 | p.A263A | 1 |
| chr2:38908517-38908517 | p.W147* | 1 |
| Top |
|
 |
| Point Mutation/ Tissue ID | 1 | 2 | 3 | 4 | 5 | 6 | 7 | 8 | 9 | 10 | 11 | 12 | 13 | 14 | 15 | 16 | 17 | 18 | 19 | 20 |
| # sample | 4 | 2 | 1 | 2 | 3 | 1 | 3 | 2 | 4 | |||||||||||
| # mutation | 5 | 2 | 1 | 2 | 3 | 1 | 3 | 3 | 4 | |||||||||||
| nonsynonymous SNV | 2 | 2 | 2 | 1 | 2 | 3 | 1 | |||||||||||||
| synonymous SNV | 3 | 1 | 2 | 1 | 1 | 3 |
| cf) Tissue ID; Tissue type (1; BLCA[Bladder Urothelial Carcinoma], 2; BRCA[Breast invasive carcinoma], 3; CESC[Cervical squamous cell carcinoma and endocervical adenocarcinoma], 4; COAD[Colon adenocarcinoma], 5; GBM[Glioblastoma multiforme], 6; Glioma Low Grade, 7; HNSC[Head and Neck squamous cell carcinoma], 8; KICH[Kidney Chromophobe], 9; KIRC[Kidney renal clear cell carcinoma], 10; KIRP[Kidney renal papillary cell carcinoma], 11; LAML[Acute Myeloid Leukemia], 12; LUAD[Lung adenocarcinoma], 13; LUSC[Lung squamous cell carcinoma], 14; OV[Ovarian serous cystadenocarcinoma ], 15; PAAD[Pancreatic adenocarcinoma], 16; PRAD[Prostate adenocarcinoma], 17; SKCM[Skin Cutaneous Melanoma], 18:STAD[Stomach adenocarcinoma], 19:THCA[Thyroid carcinoma], 20:UCEC[Uterine Corpus Endometrial Carcinoma]) |
| Top |
| * We represented just top 10 SNVs. When you move the cursor on each content, you can see more deailed mutation information on the Tooltip. Those are primary_site, primary_histology, mutation(aa), pubmedID. |
| Genomic Position | Mutation(aa) | Unique sampleID count |
| chr2:38893363 | p.E20E | 2 |
| chr2:38903126 | p.G92G | 1 |
| chr2:38956751 | p.P318S | 1 |
| chr2:38903134 | p.E94K | 1 |
| chr2:38956797 | p.F320S | 1 |
| chr2:38903139 | p.A98A | 1 |
| chr2:38956810 | p.F337F | 1 |
| chr2:38903143 | p.E102K | 1 |
| chr2:38958889 | p.V127I | 1 |
| chr2:38903157 | p.S130S | 1 |
| * Copy number data were extracted from TCGA using R package TCGA-Assembler. The URLs of all public data files on TCGA DCC data server were gathered on Jan-05-2015. Function ProcessCNAData in TCGA-Assembler package was used to obtain gene-level copy number value which is calculated as the average copy number of the genomic region of a gene. |
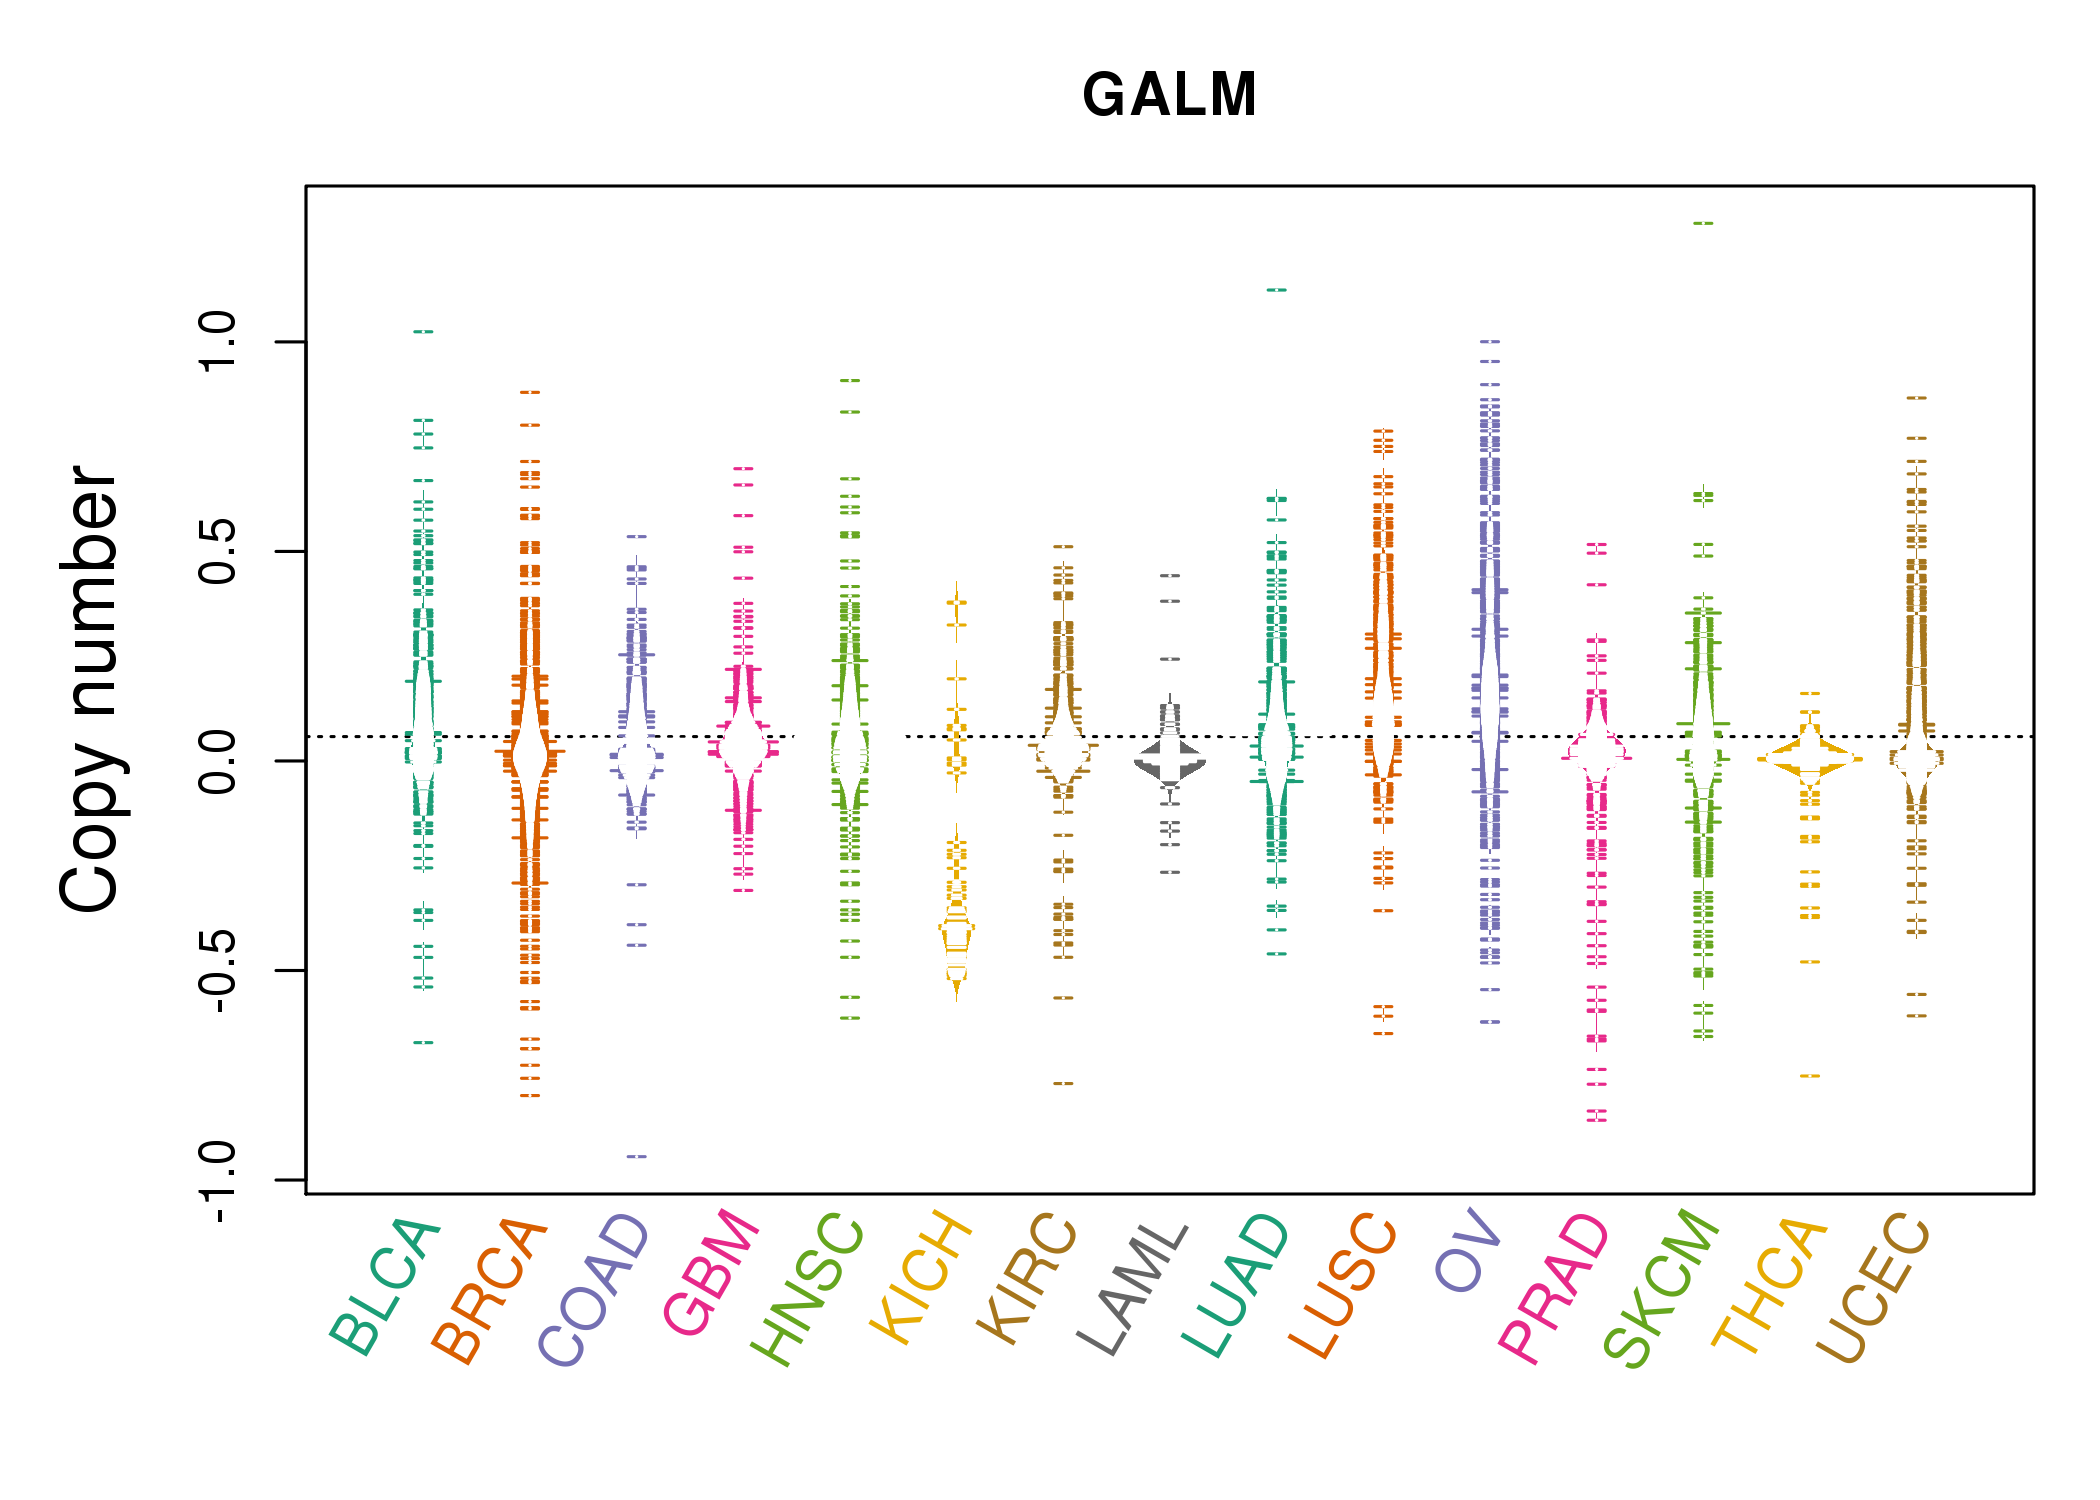 |
| cf) Tissue ID[Tissue type]: BLCA[Bladder Urothelial Carcinoma], BRCA[Breast invasive carcinoma], CESC[Cervical squamous cell carcinoma and endocervical adenocarcinoma], COAD[Colon adenocarcinoma], GBM[Glioblastoma multiforme], Glioma Low Grade, HNSC[Head and Neck squamous cell carcinoma], KICH[Kidney Chromophobe], KIRC[Kidney renal clear cell carcinoma], KIRP[Kidney renal papillary cell carcinoma], LAML[Acute Myeloid Leukemia], LUAD[Lung adenocarcinoma], LUSC[Lung squamous cell carcinoma], OV[Ovarian serous cystadenocarcinoma ], PAAD[Pancreatic adenocarcinoma], PRAD[Prostate adenocarcinoma], SKCM[Skin Cutaneous Melanoma], STAD[Stomach adenocarcinoma], THCA[Thyroid carcinoma], UCEC[Uterine Corpus Endometrial Carcinoma] |
| Top |
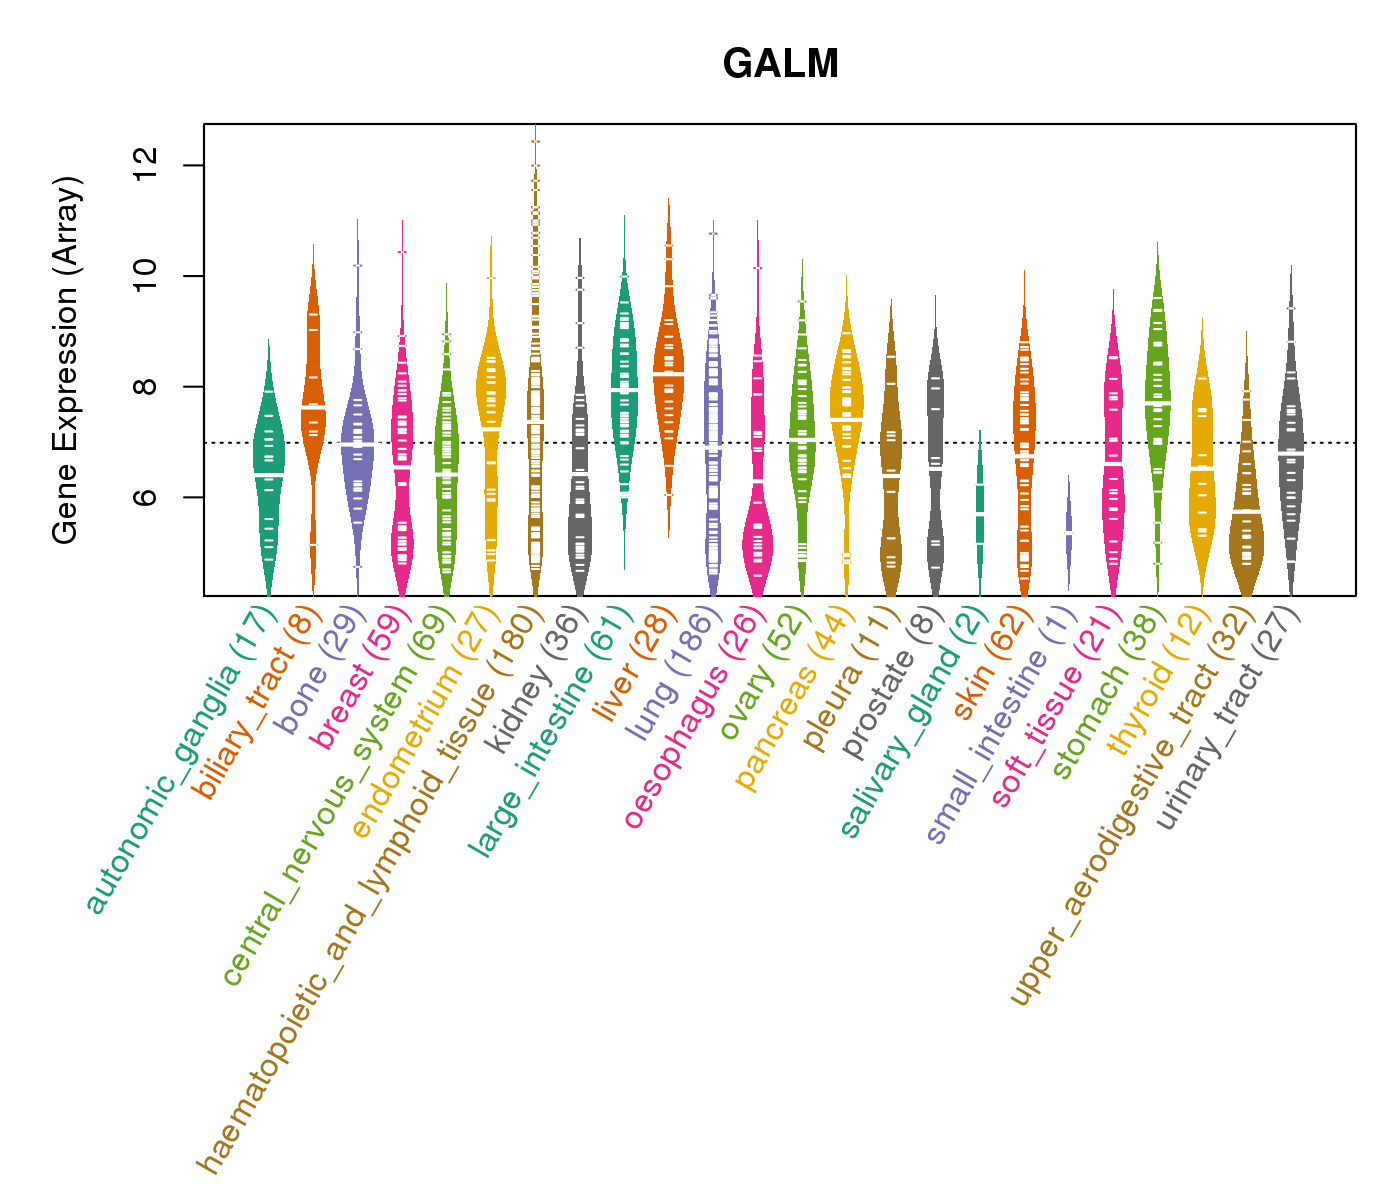
| Gene Expression for GALM |
| * CCLE gene expression data were extracted from CCLE_Expression_Entrez_2012-10-18.res: Gene-centric RMA-normalized mRNA expression data. |
 |
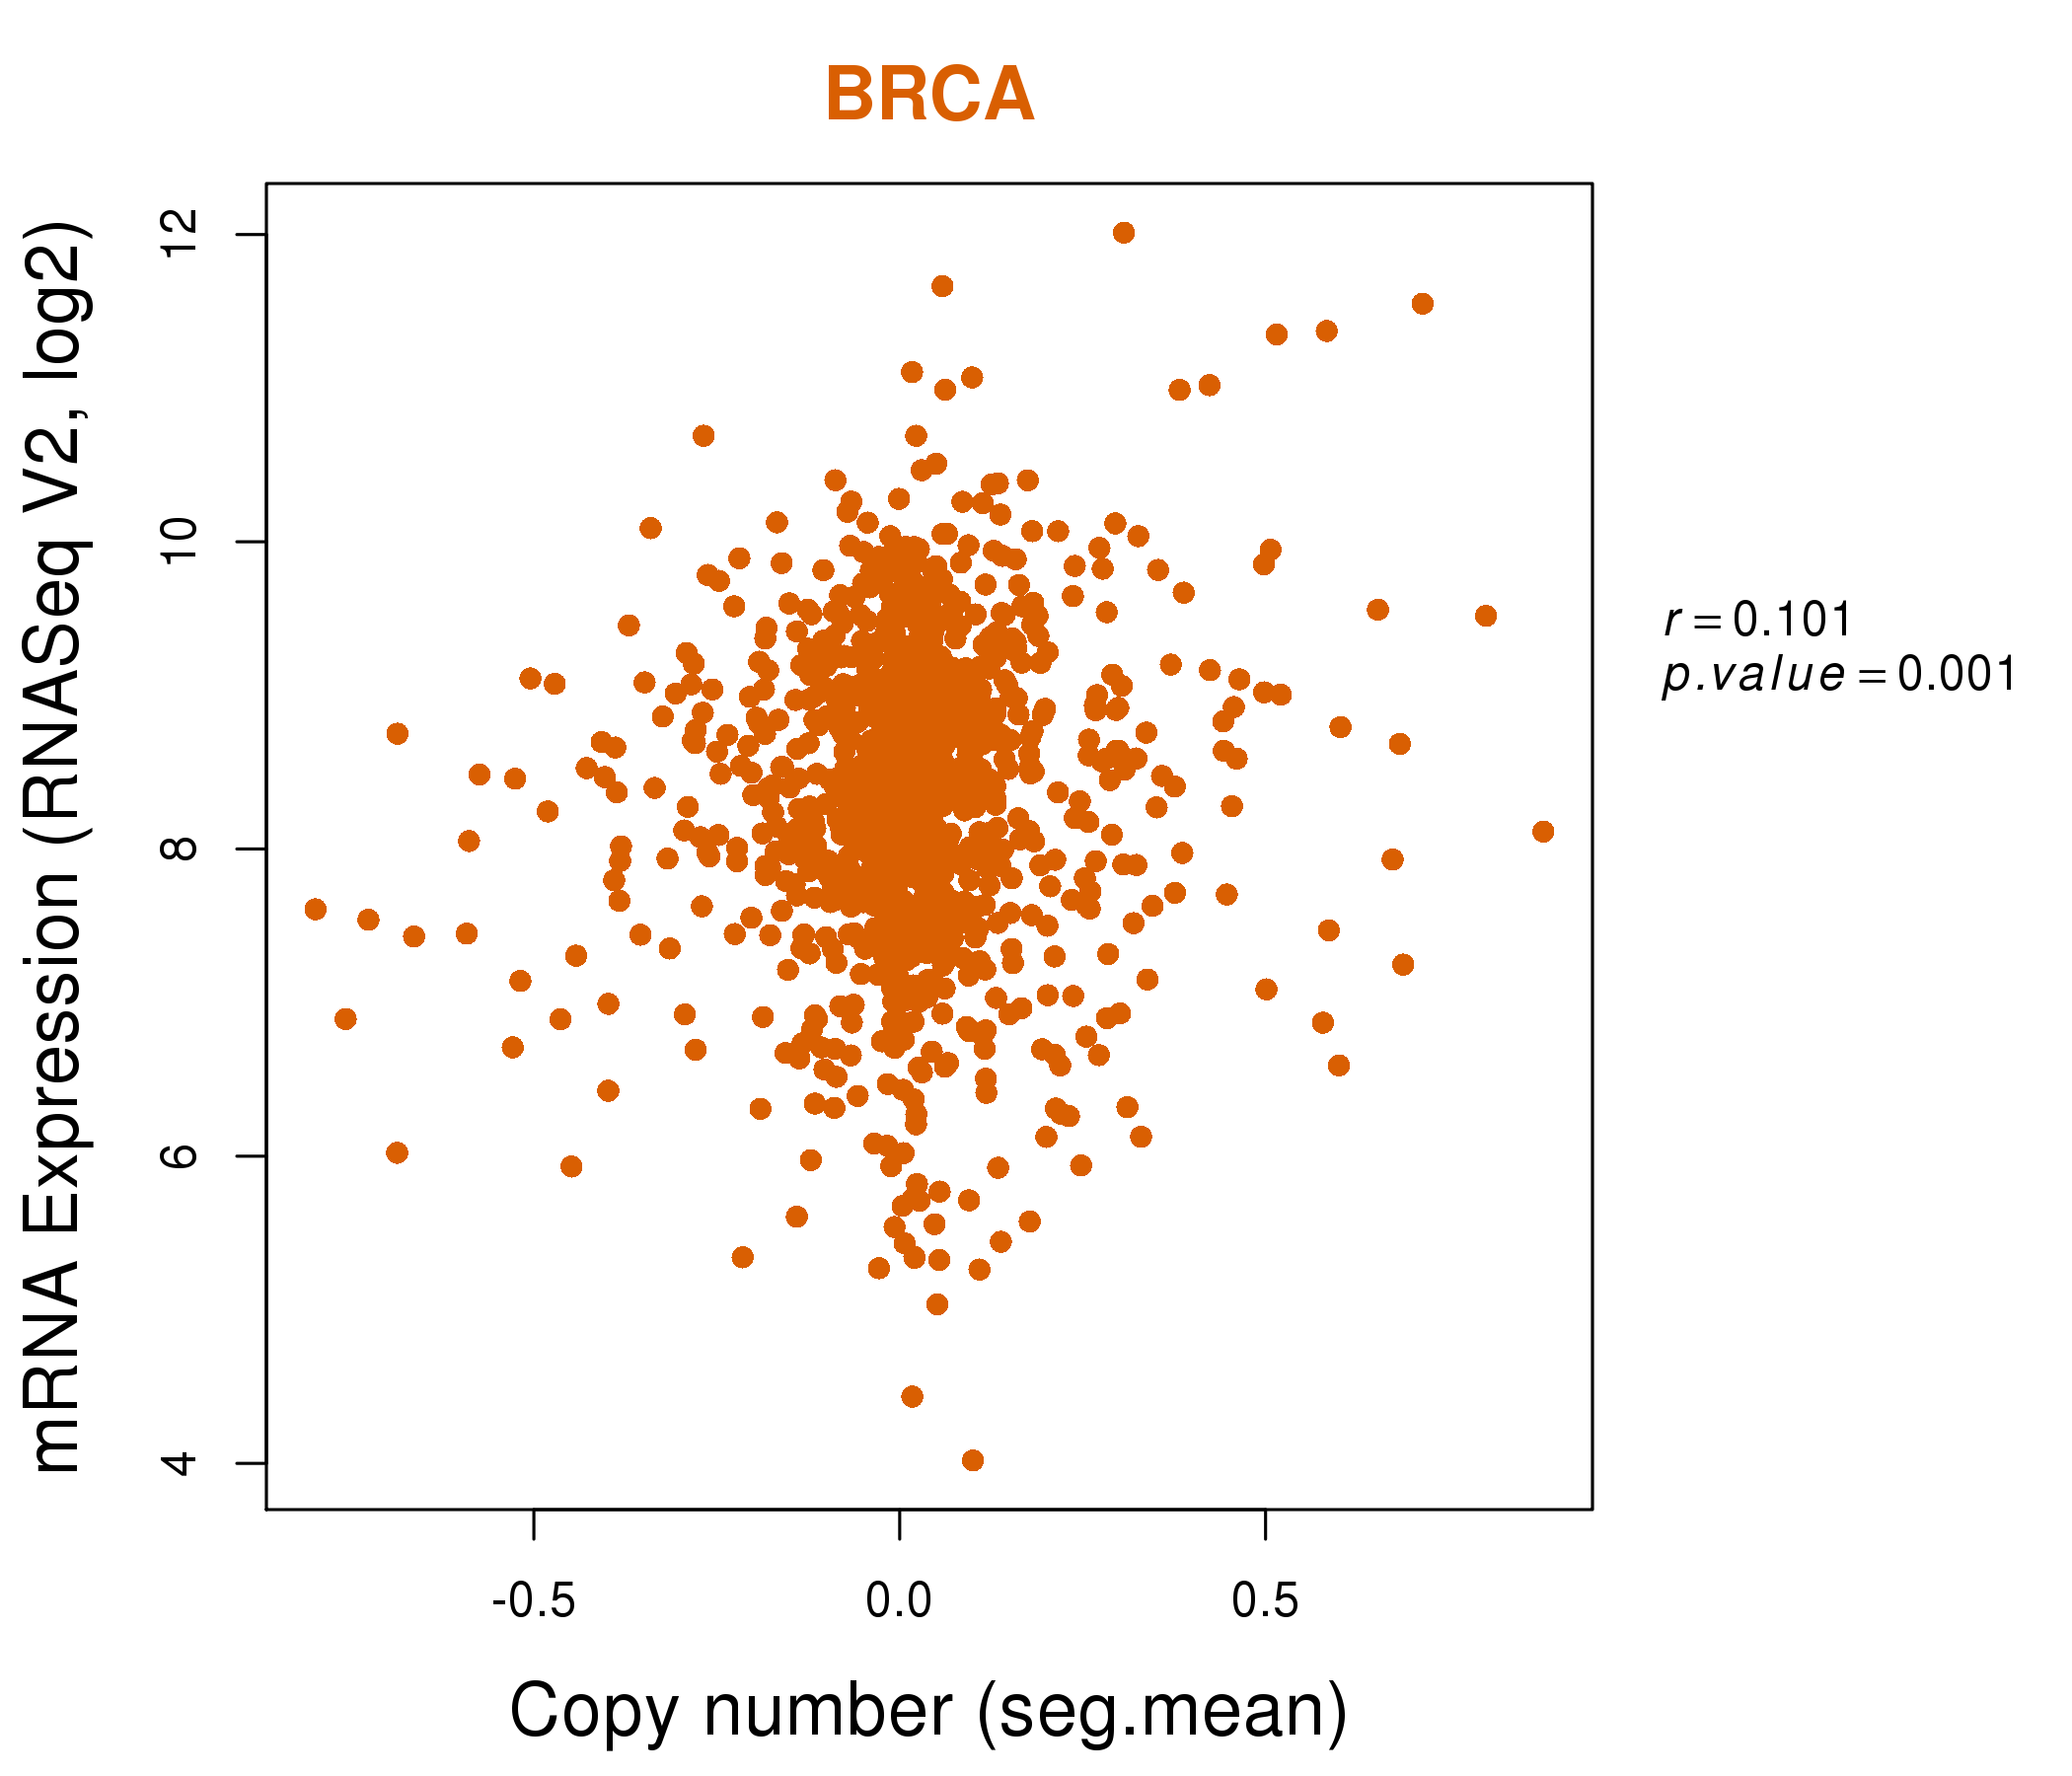
| * Normalized gene expression data of RNASeqV2 was extracted from TCGA using R package TCGA-Assembler. The URLs of all public data files on TCGA DCC data server were gathered at Jan-05-2015. Only eight cancer types have enough normal control samples for differential expression analysis. (t test, adjusted p<0.05 (using Benjamini-Hochberg FDR)) |
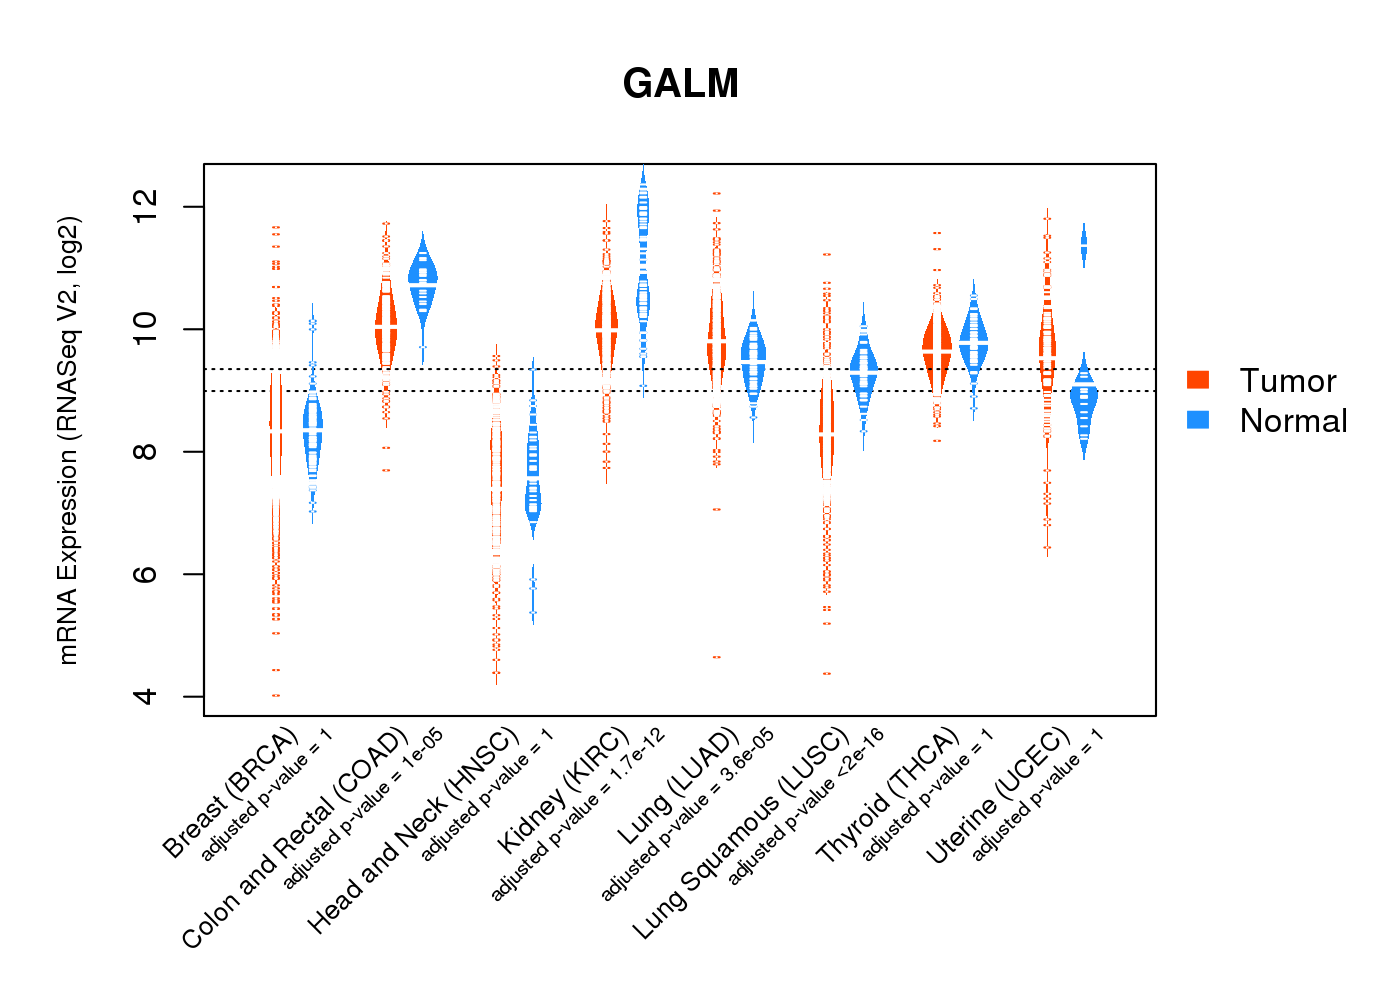 |
| Top |
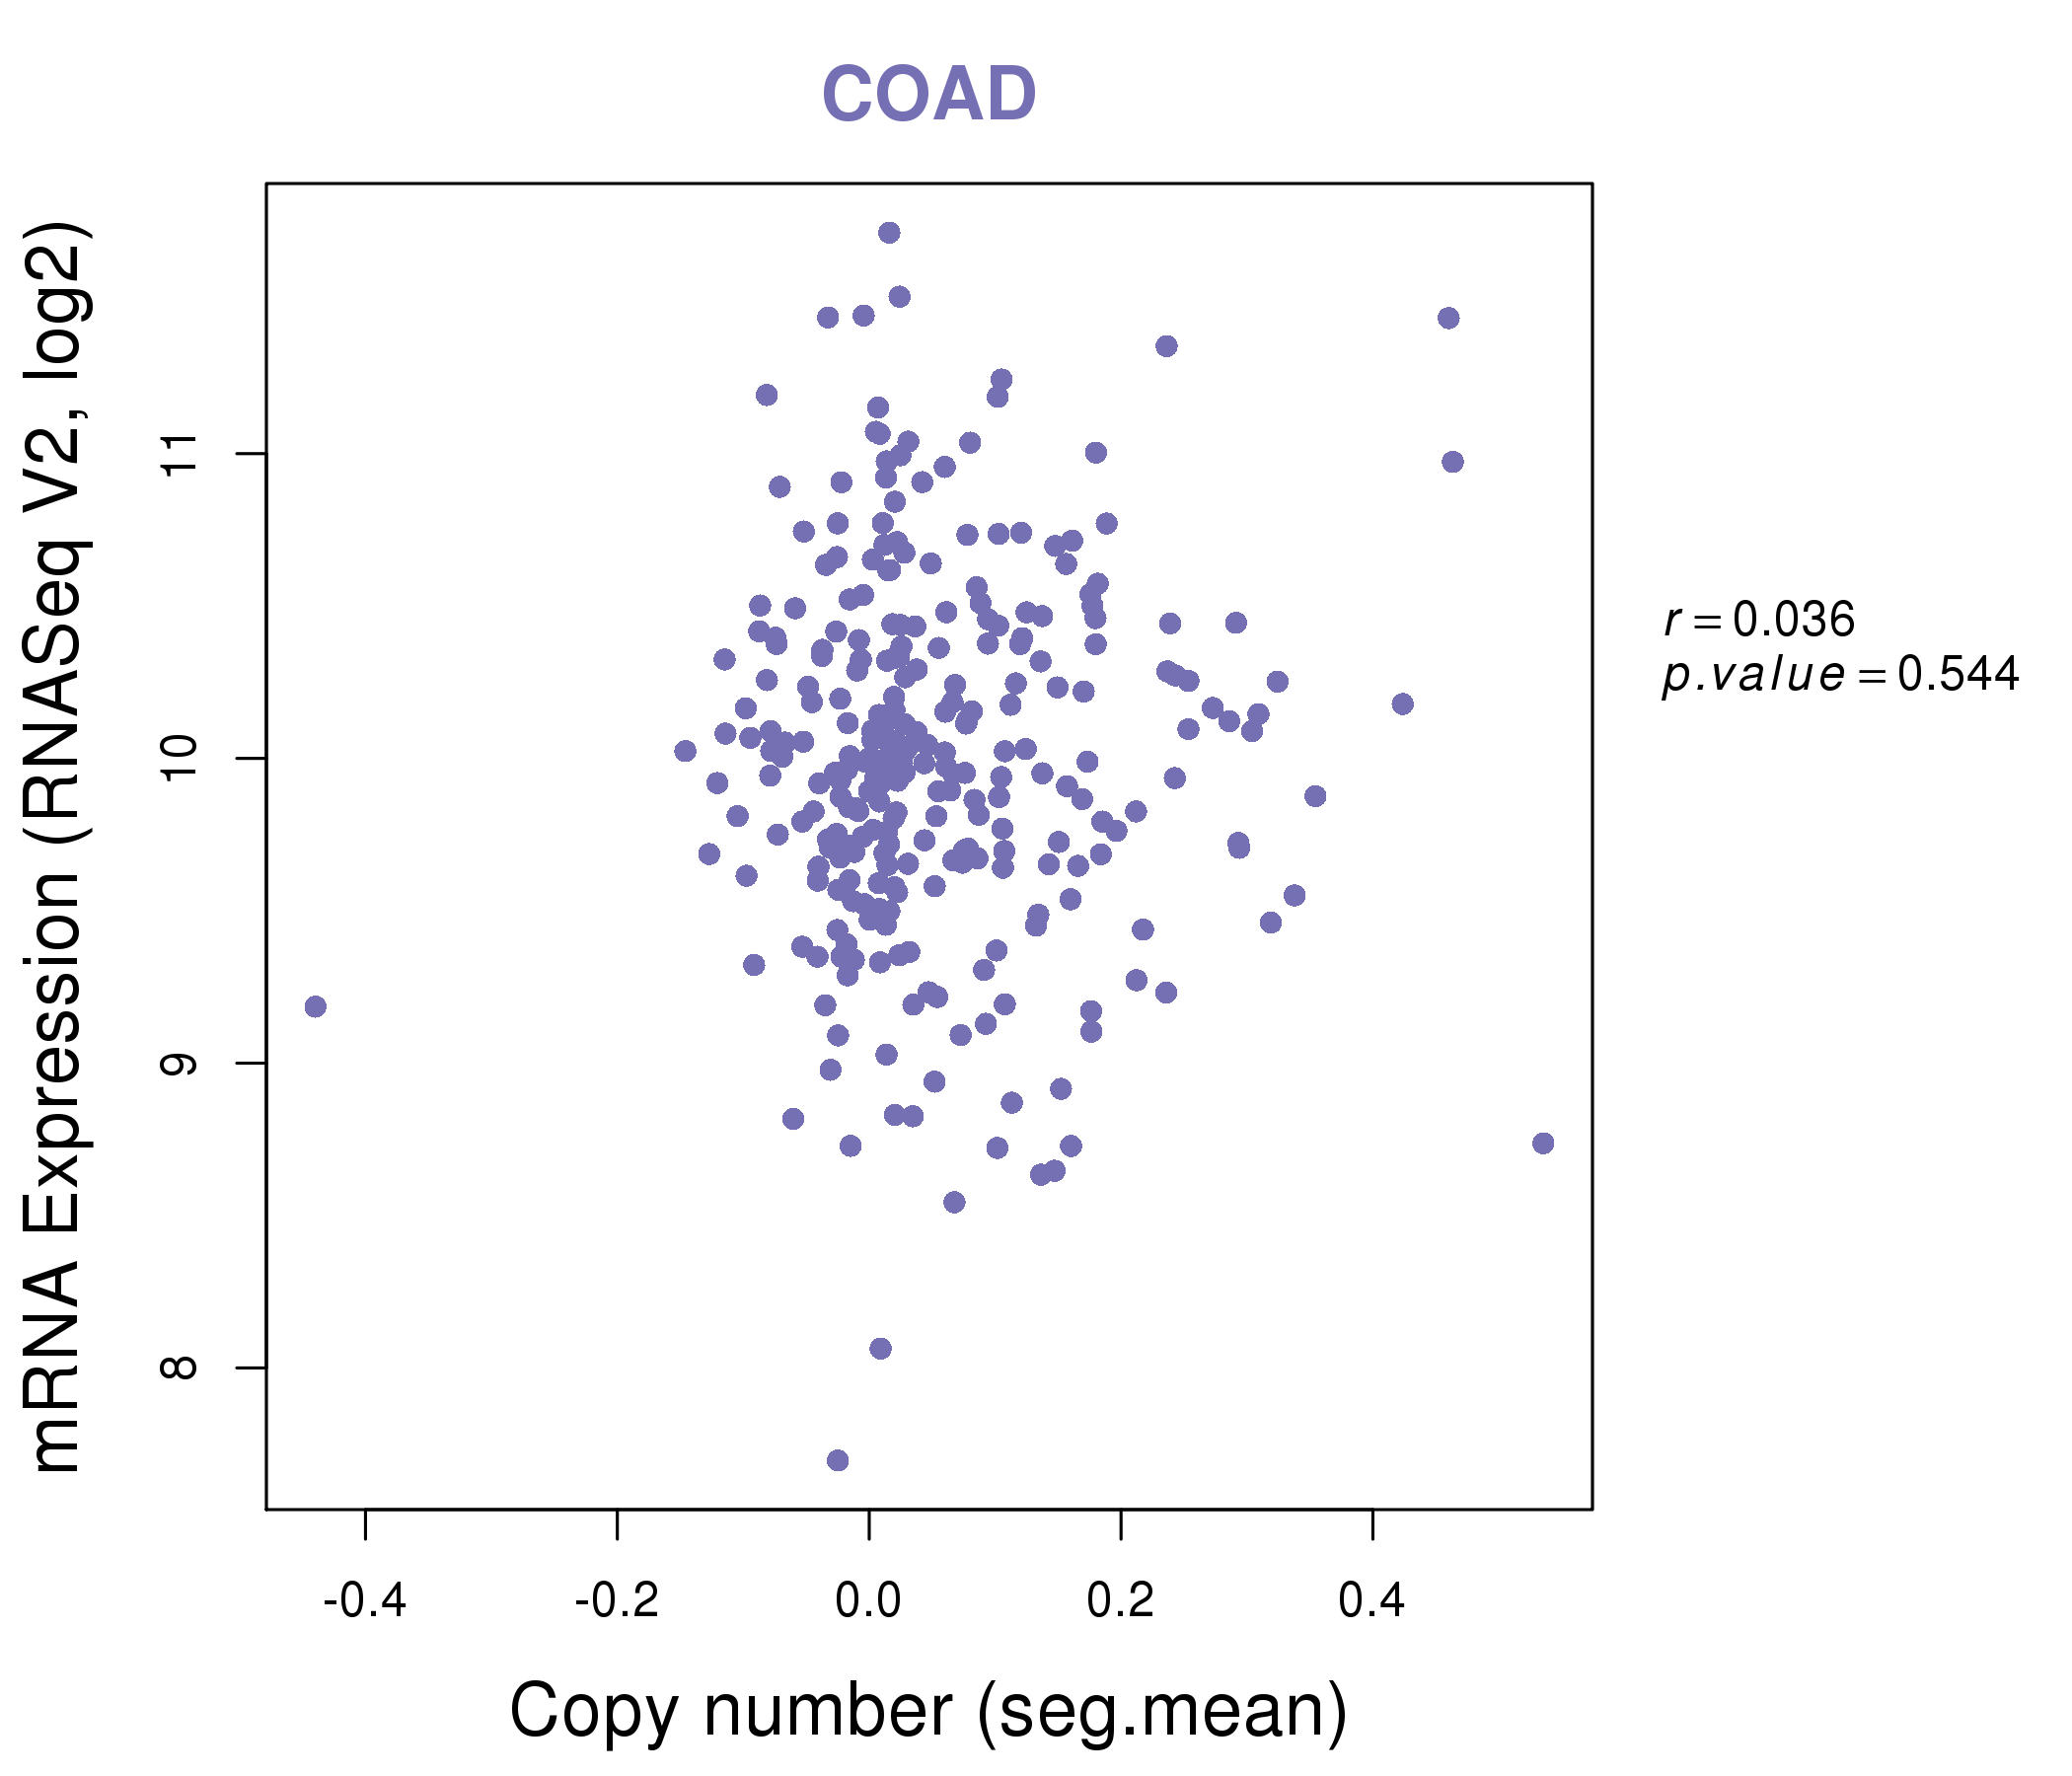
| * This plots show the correlation between CNV and gene expression. |
: Open all plots for all cancer types
 |
|
 |
|

| Top |
| Gene-Gene Network Information |
| * Co-Expression network figures were drawn using R package igraph. Only the top 20 genes with the highest correlations were shown. Red circle: input gene, orange circle: cell metabolism gene, sky circle: other gene |
: Open all plots for all cancer types
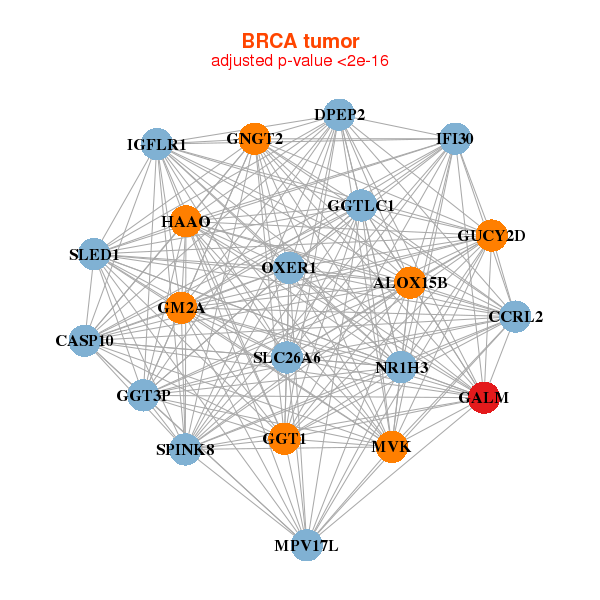 |
| ||||
| ALOX15B,CASP10,CCRL2,DPEP2,GALM,GGT1,GGT3P, GGTLC1,GM2A,GNGT2,GUCY2D,HAAO,IFI30,MPV17L, MVK,NR1H3,OXER1,SLC26A6,SLED1,SPINK8,IGFLR1 | ABCC2,ADAM2,ALOX15B,C6orf223,CLU,DHRS2,DNASE2B, G6PD,GALM,GUSB,HAAO,HPGD,HSD3B2,LST-3TM12, NUDT8,PNLIPRP3,PPAPDC1A,SCP2,SERHL2,SERHL,TARP | ||||
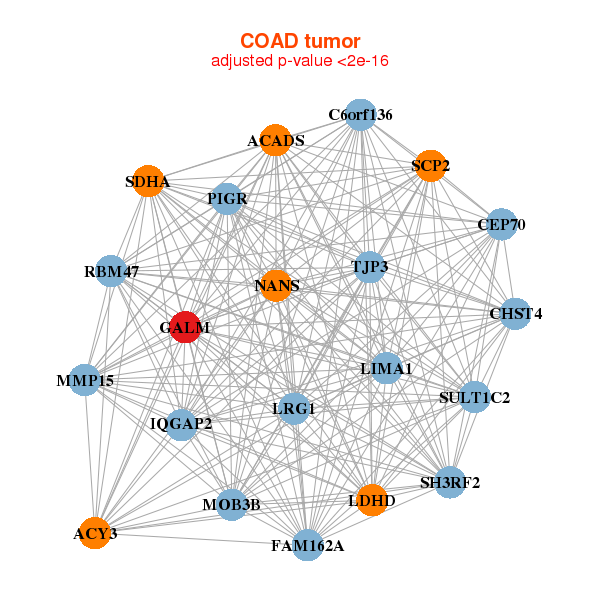 |
| ||||
| ACADS,ACY3,C6orf136,CEP70,CHST4,FAM162A,GALM, IQGAP2,LDHD,LIMA1,LRG1,MMP15,MOB3B,NANS, PIGR,RBM47,SCP2,SDHA,SH3RF2,SULT1C2,TJP3 | ACADS,ACSF3,AP1M2,KDF1,C6orf136,CBLC,CYB561A3, DCAF11,ELMO3,EPN1,ESRRA,GALM,MAP2K2,MGAT4B, MTMR14,OVOL1,PFKL,PPAP2C,PRKCZ,TMEM102,ZDHHC12 |

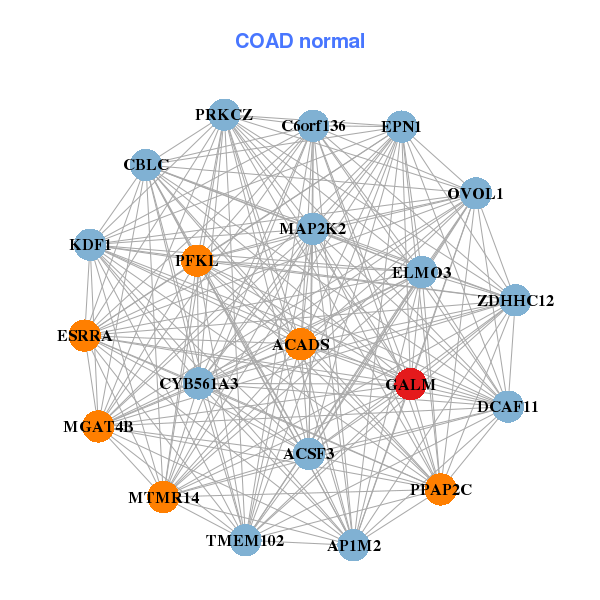
| * Co-Expression network figures were drawn using R package igraph. Only the top 20 genes with the highest correlations were shown. Red circle: input gene, orange circle: cell metabolism gene, sky circle: other gene |
: Open all plots for all cancer types
| Top |
: Open all interacting genes' information including KEGG pathway for all interacting genes from DAVID
| Top |
| Pharmacological Information for GALM |
| DB Category | DB Name | DB's ID and Url link |
| * Gene Centered Interaction Network. |
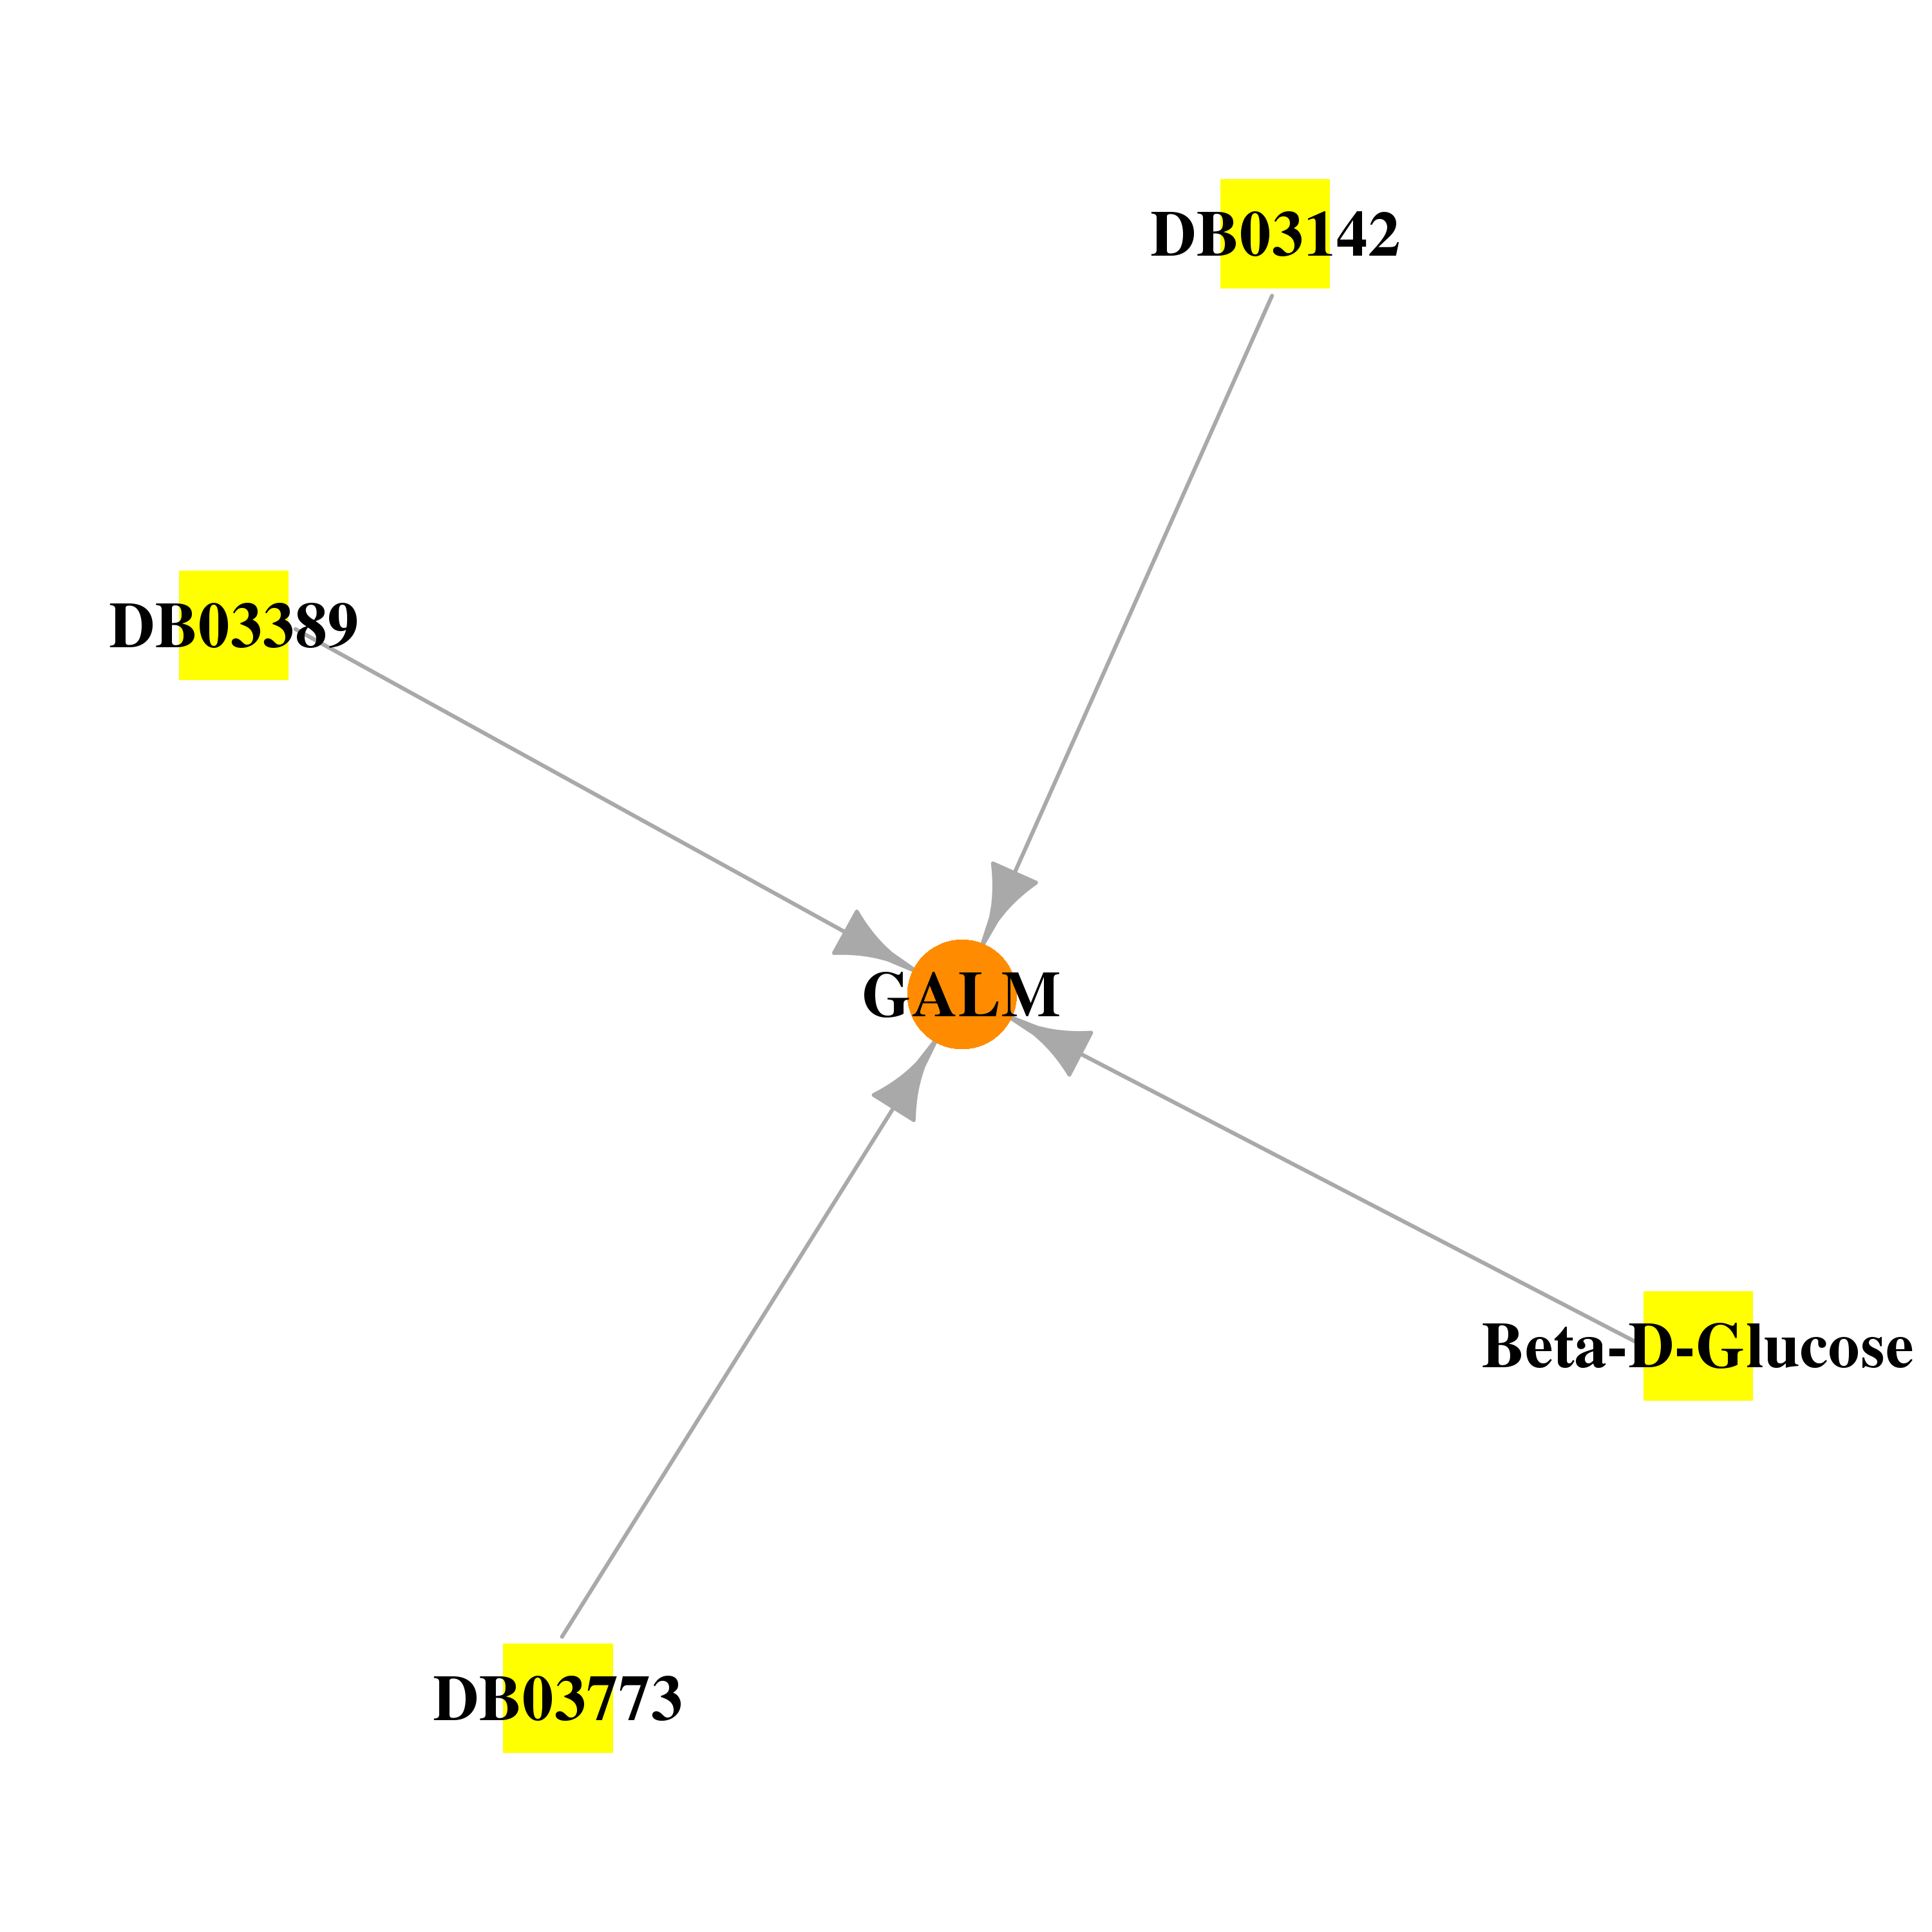 |
| * Drug Centered Interaction Network. |
| DrugBank ID | Target Name | Drug Groups | Generic Name | Drug Centered Network | Drug Structure |
| DB02379 | galactose mutarotase (aldose 1-epimerase) | experimental | Beta-D-Glucose | 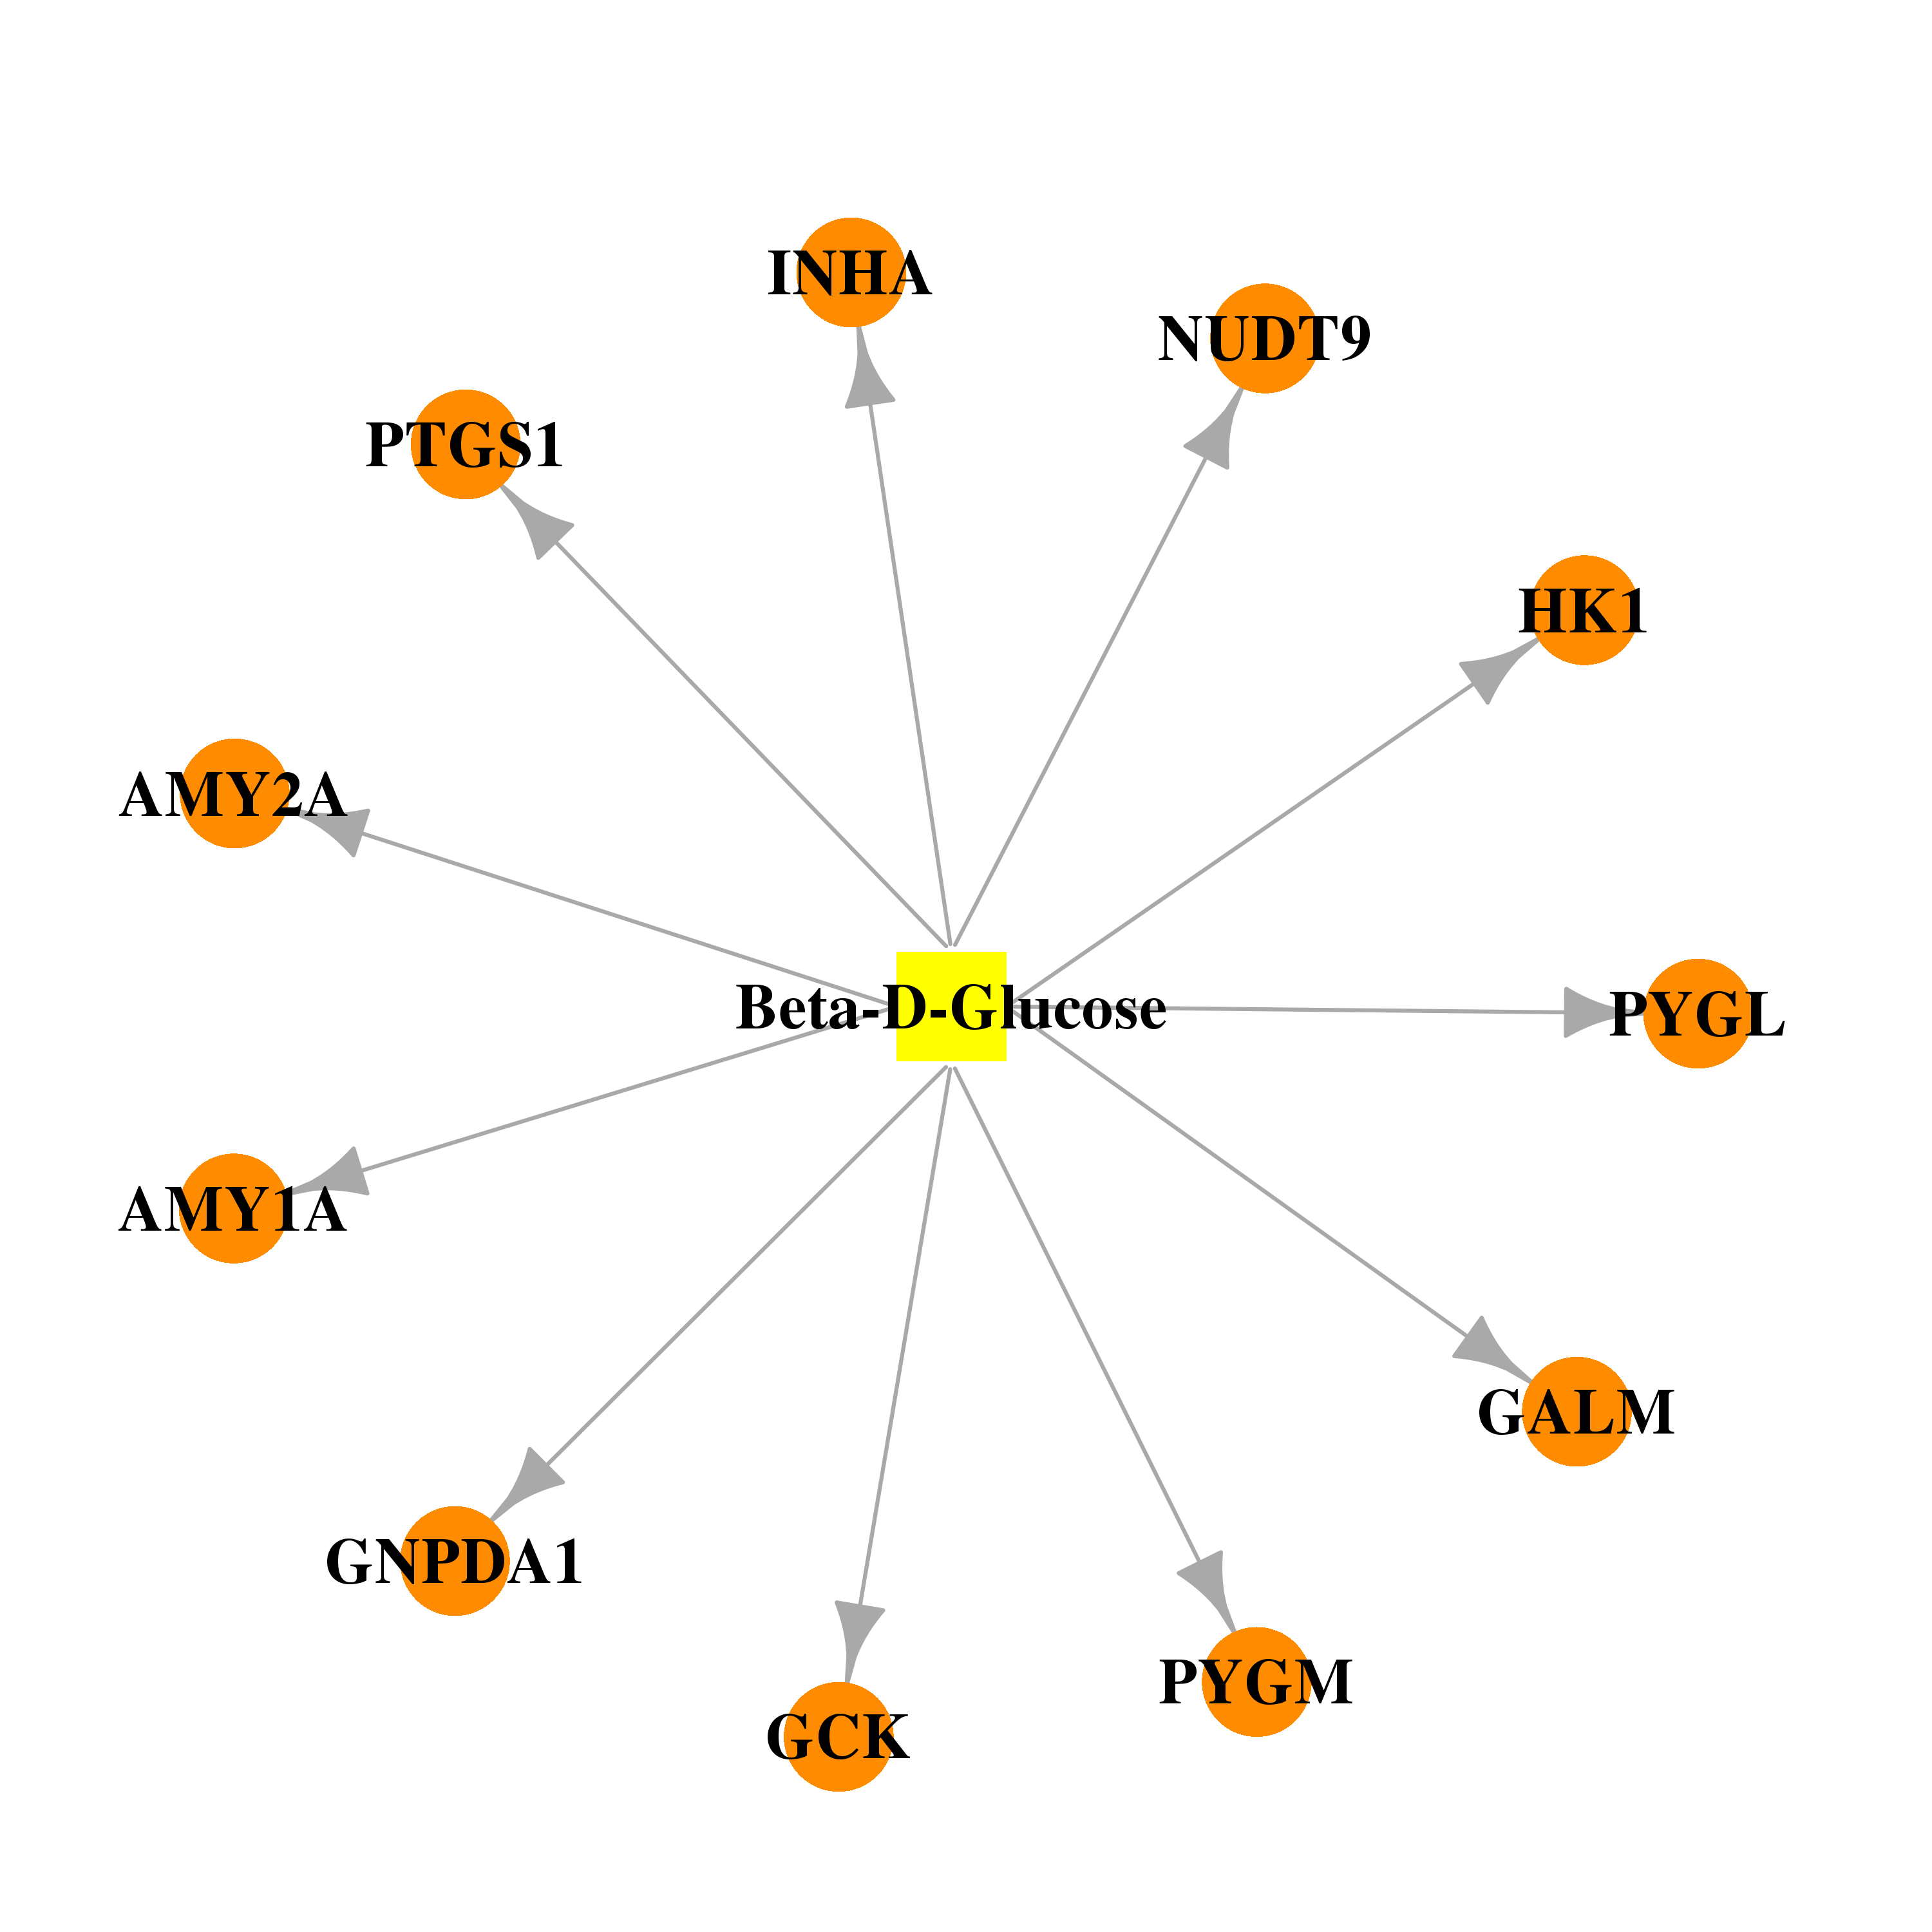 | 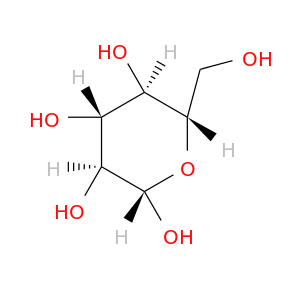 |
| DB03142 | galactose mutarotase (aldose 1-epimerase) | experimental | Alpha-L-Arabinose | 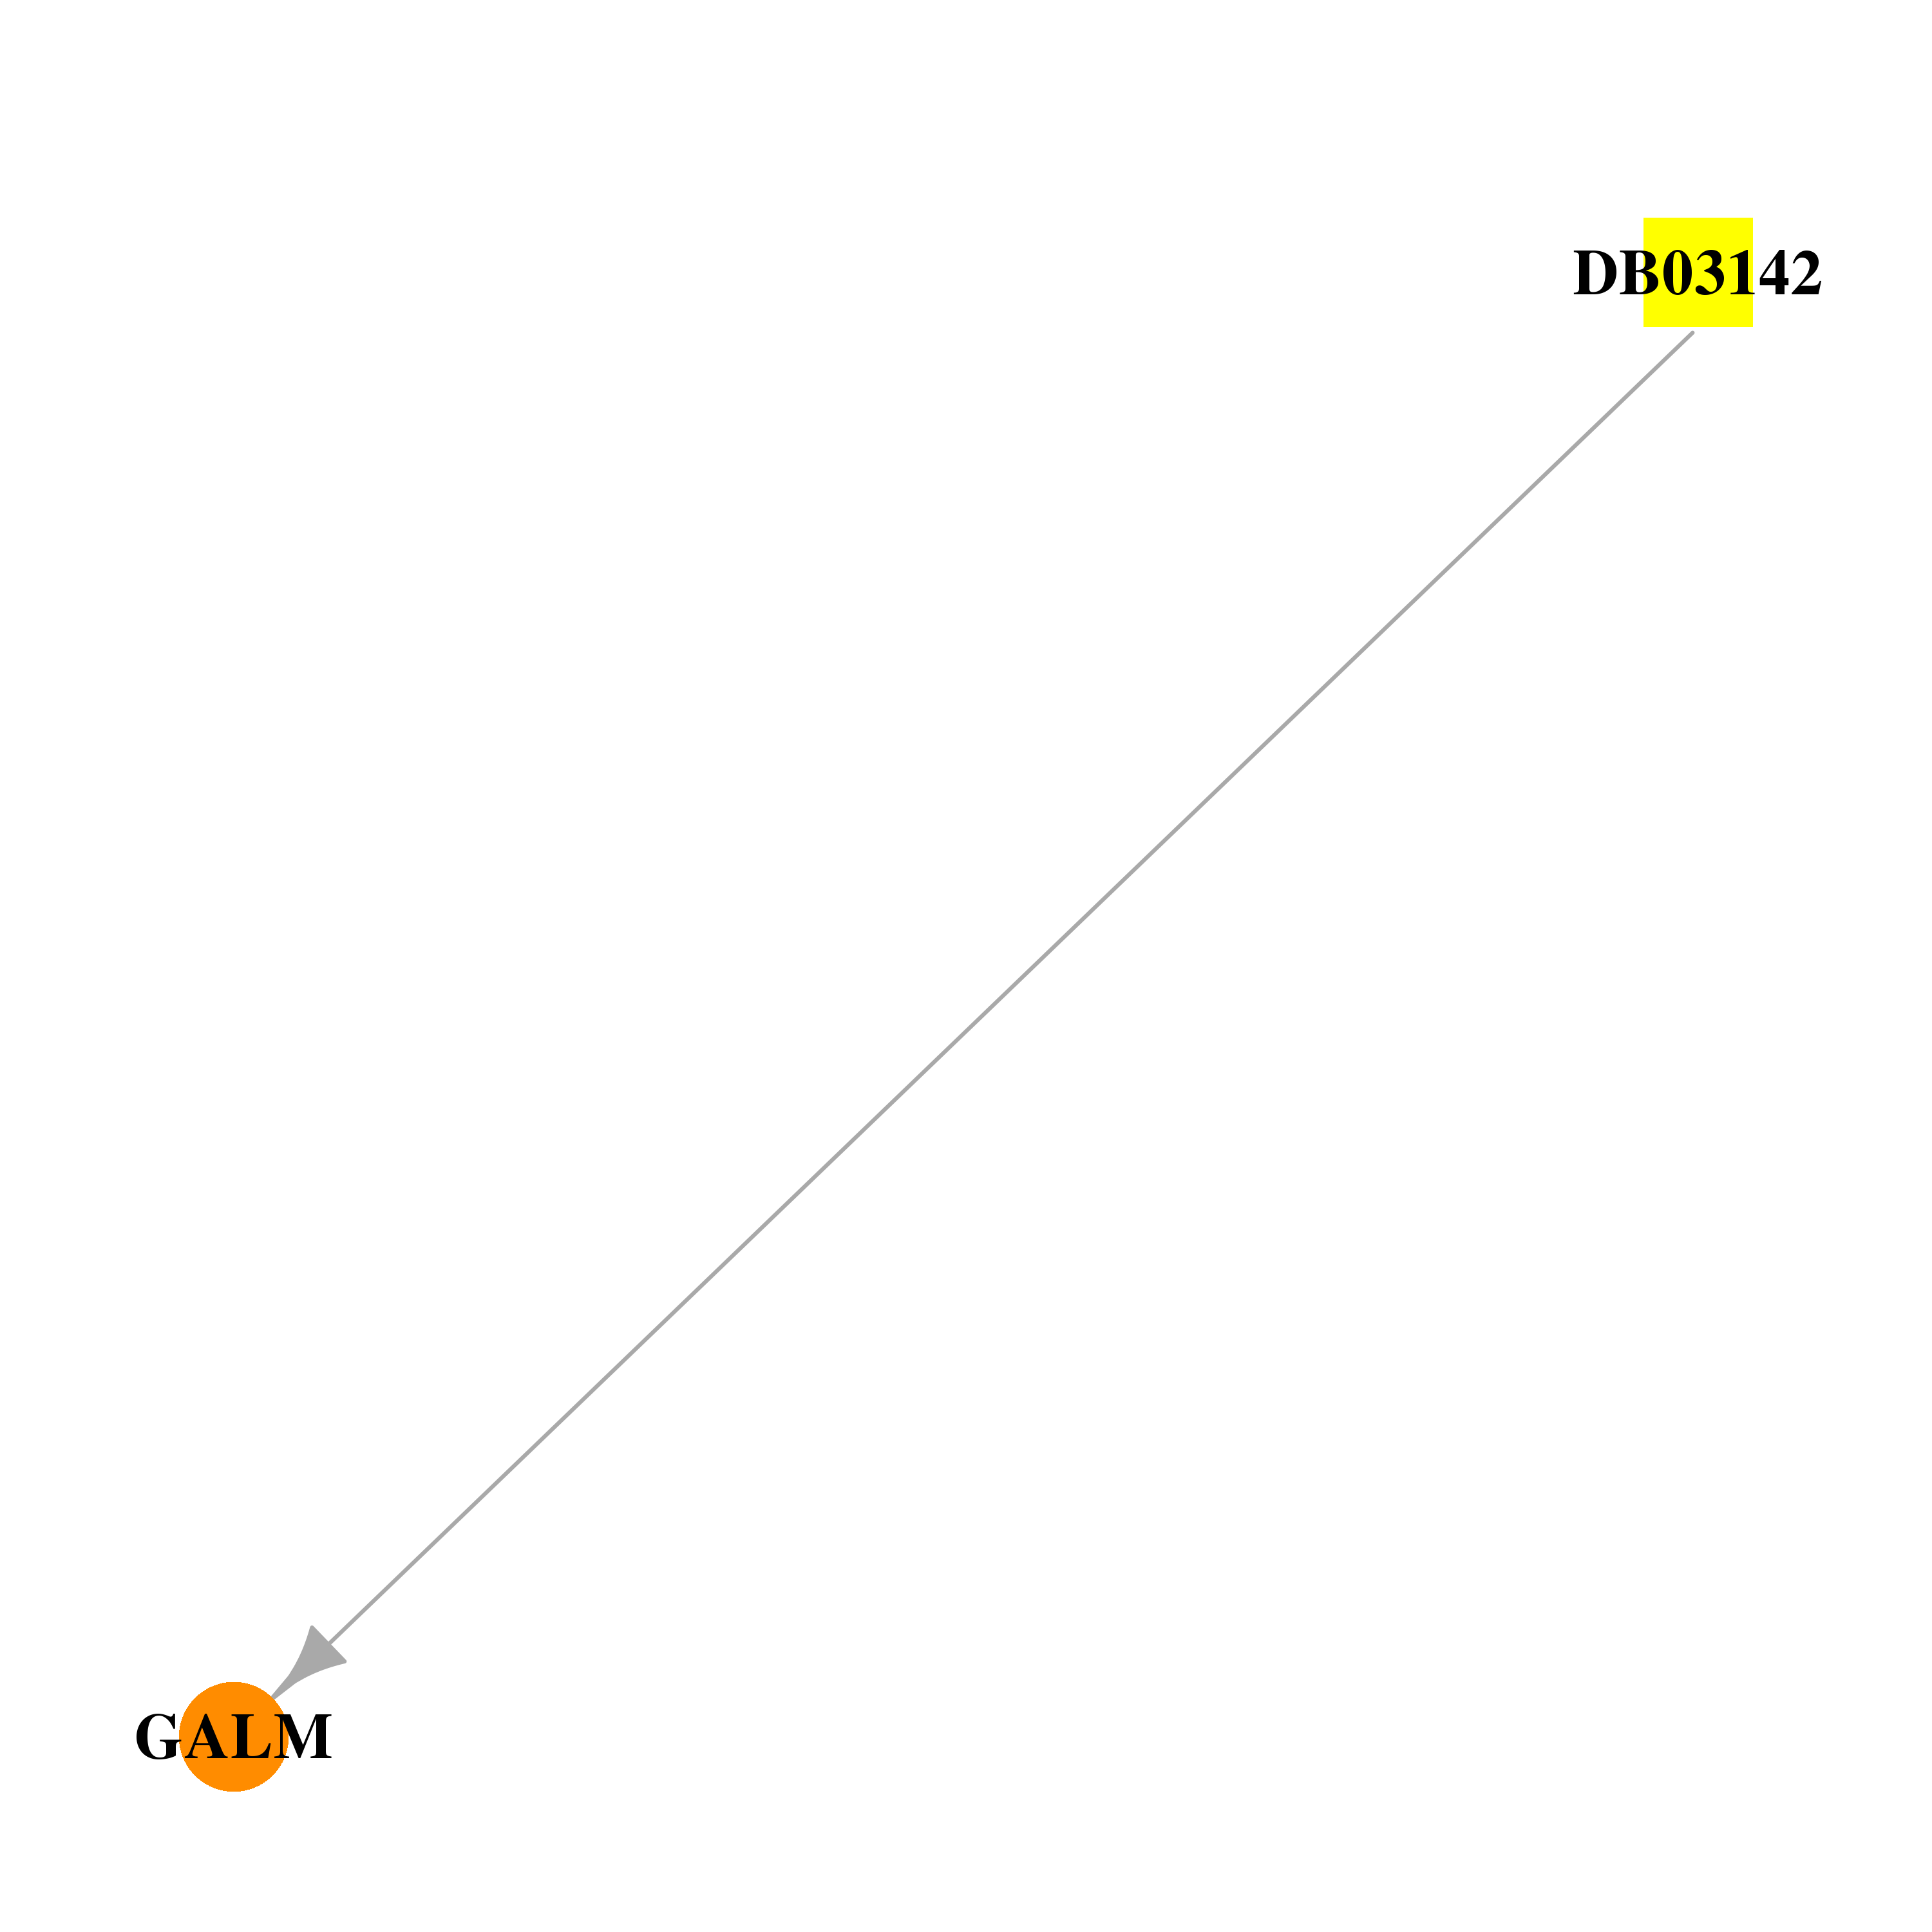 |  |
| DB03389 | galactose mutarotase (aldose 1-epimerase) | experimental | alpha-D-Xylopyranose | 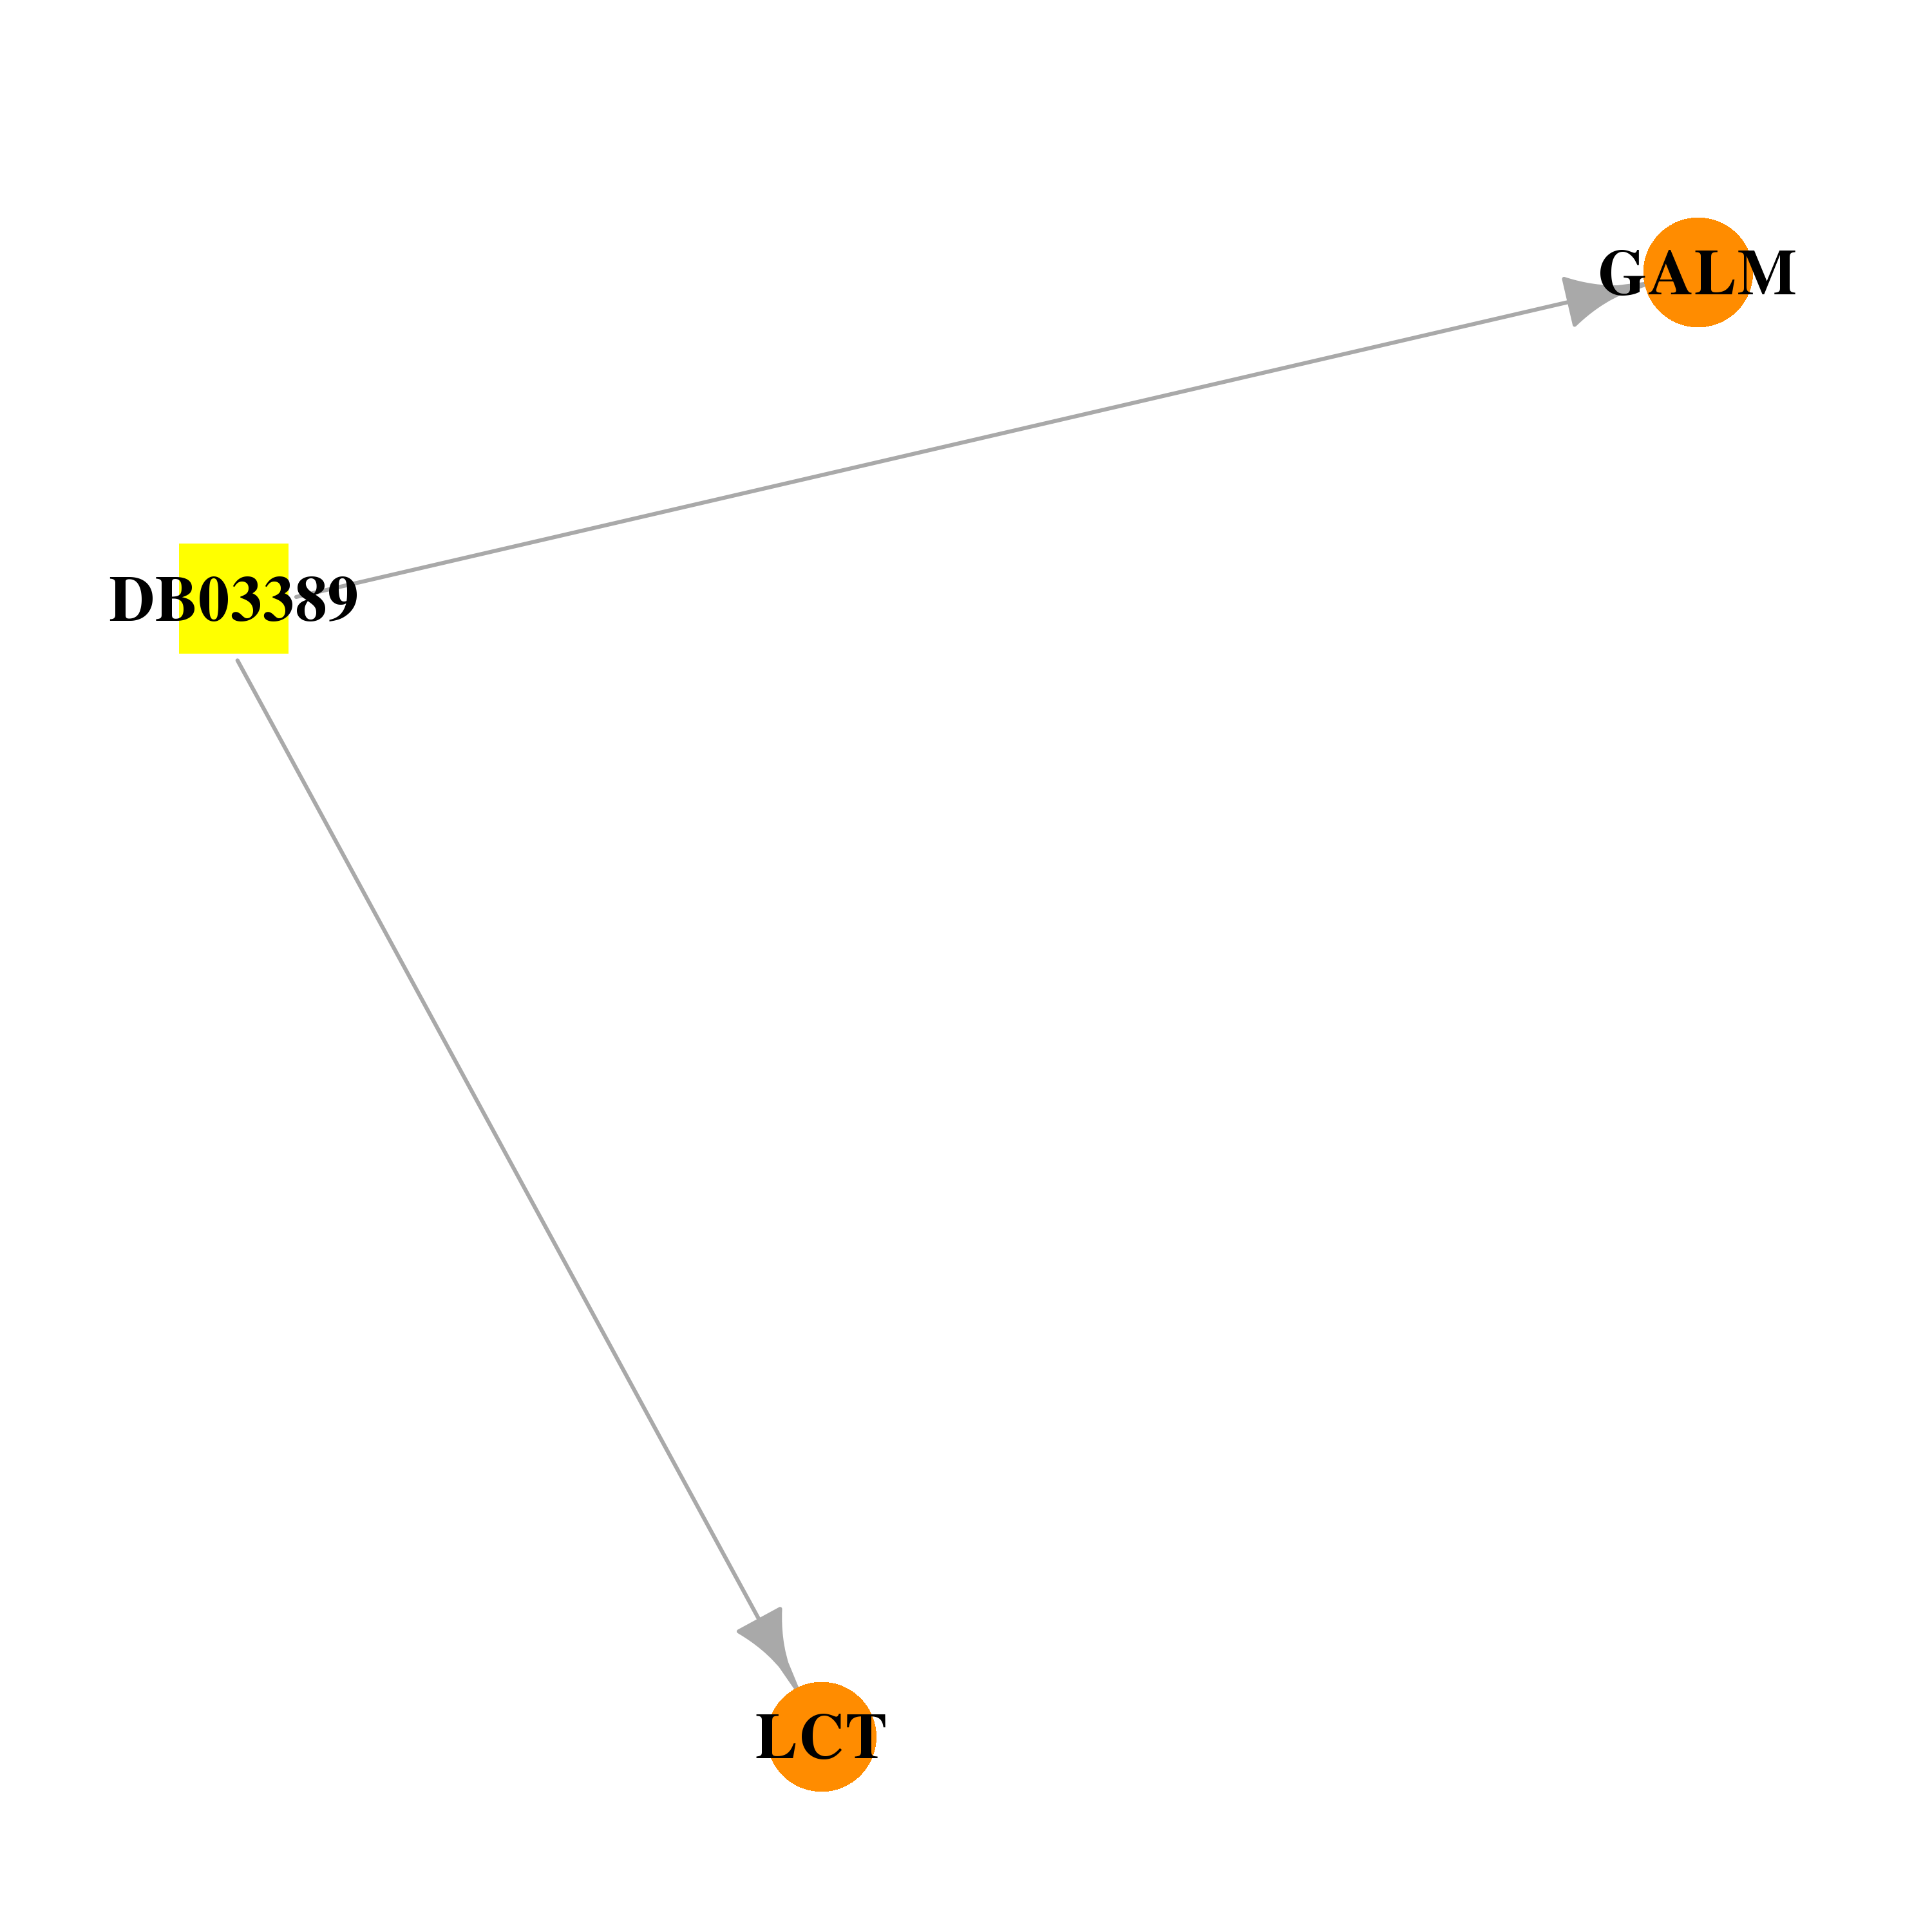 |  |
| DB03773 | galactose mutarotase (aldose 1-epimerase) | experimental | 6-Deoxy-Alpha-D-Glucose | 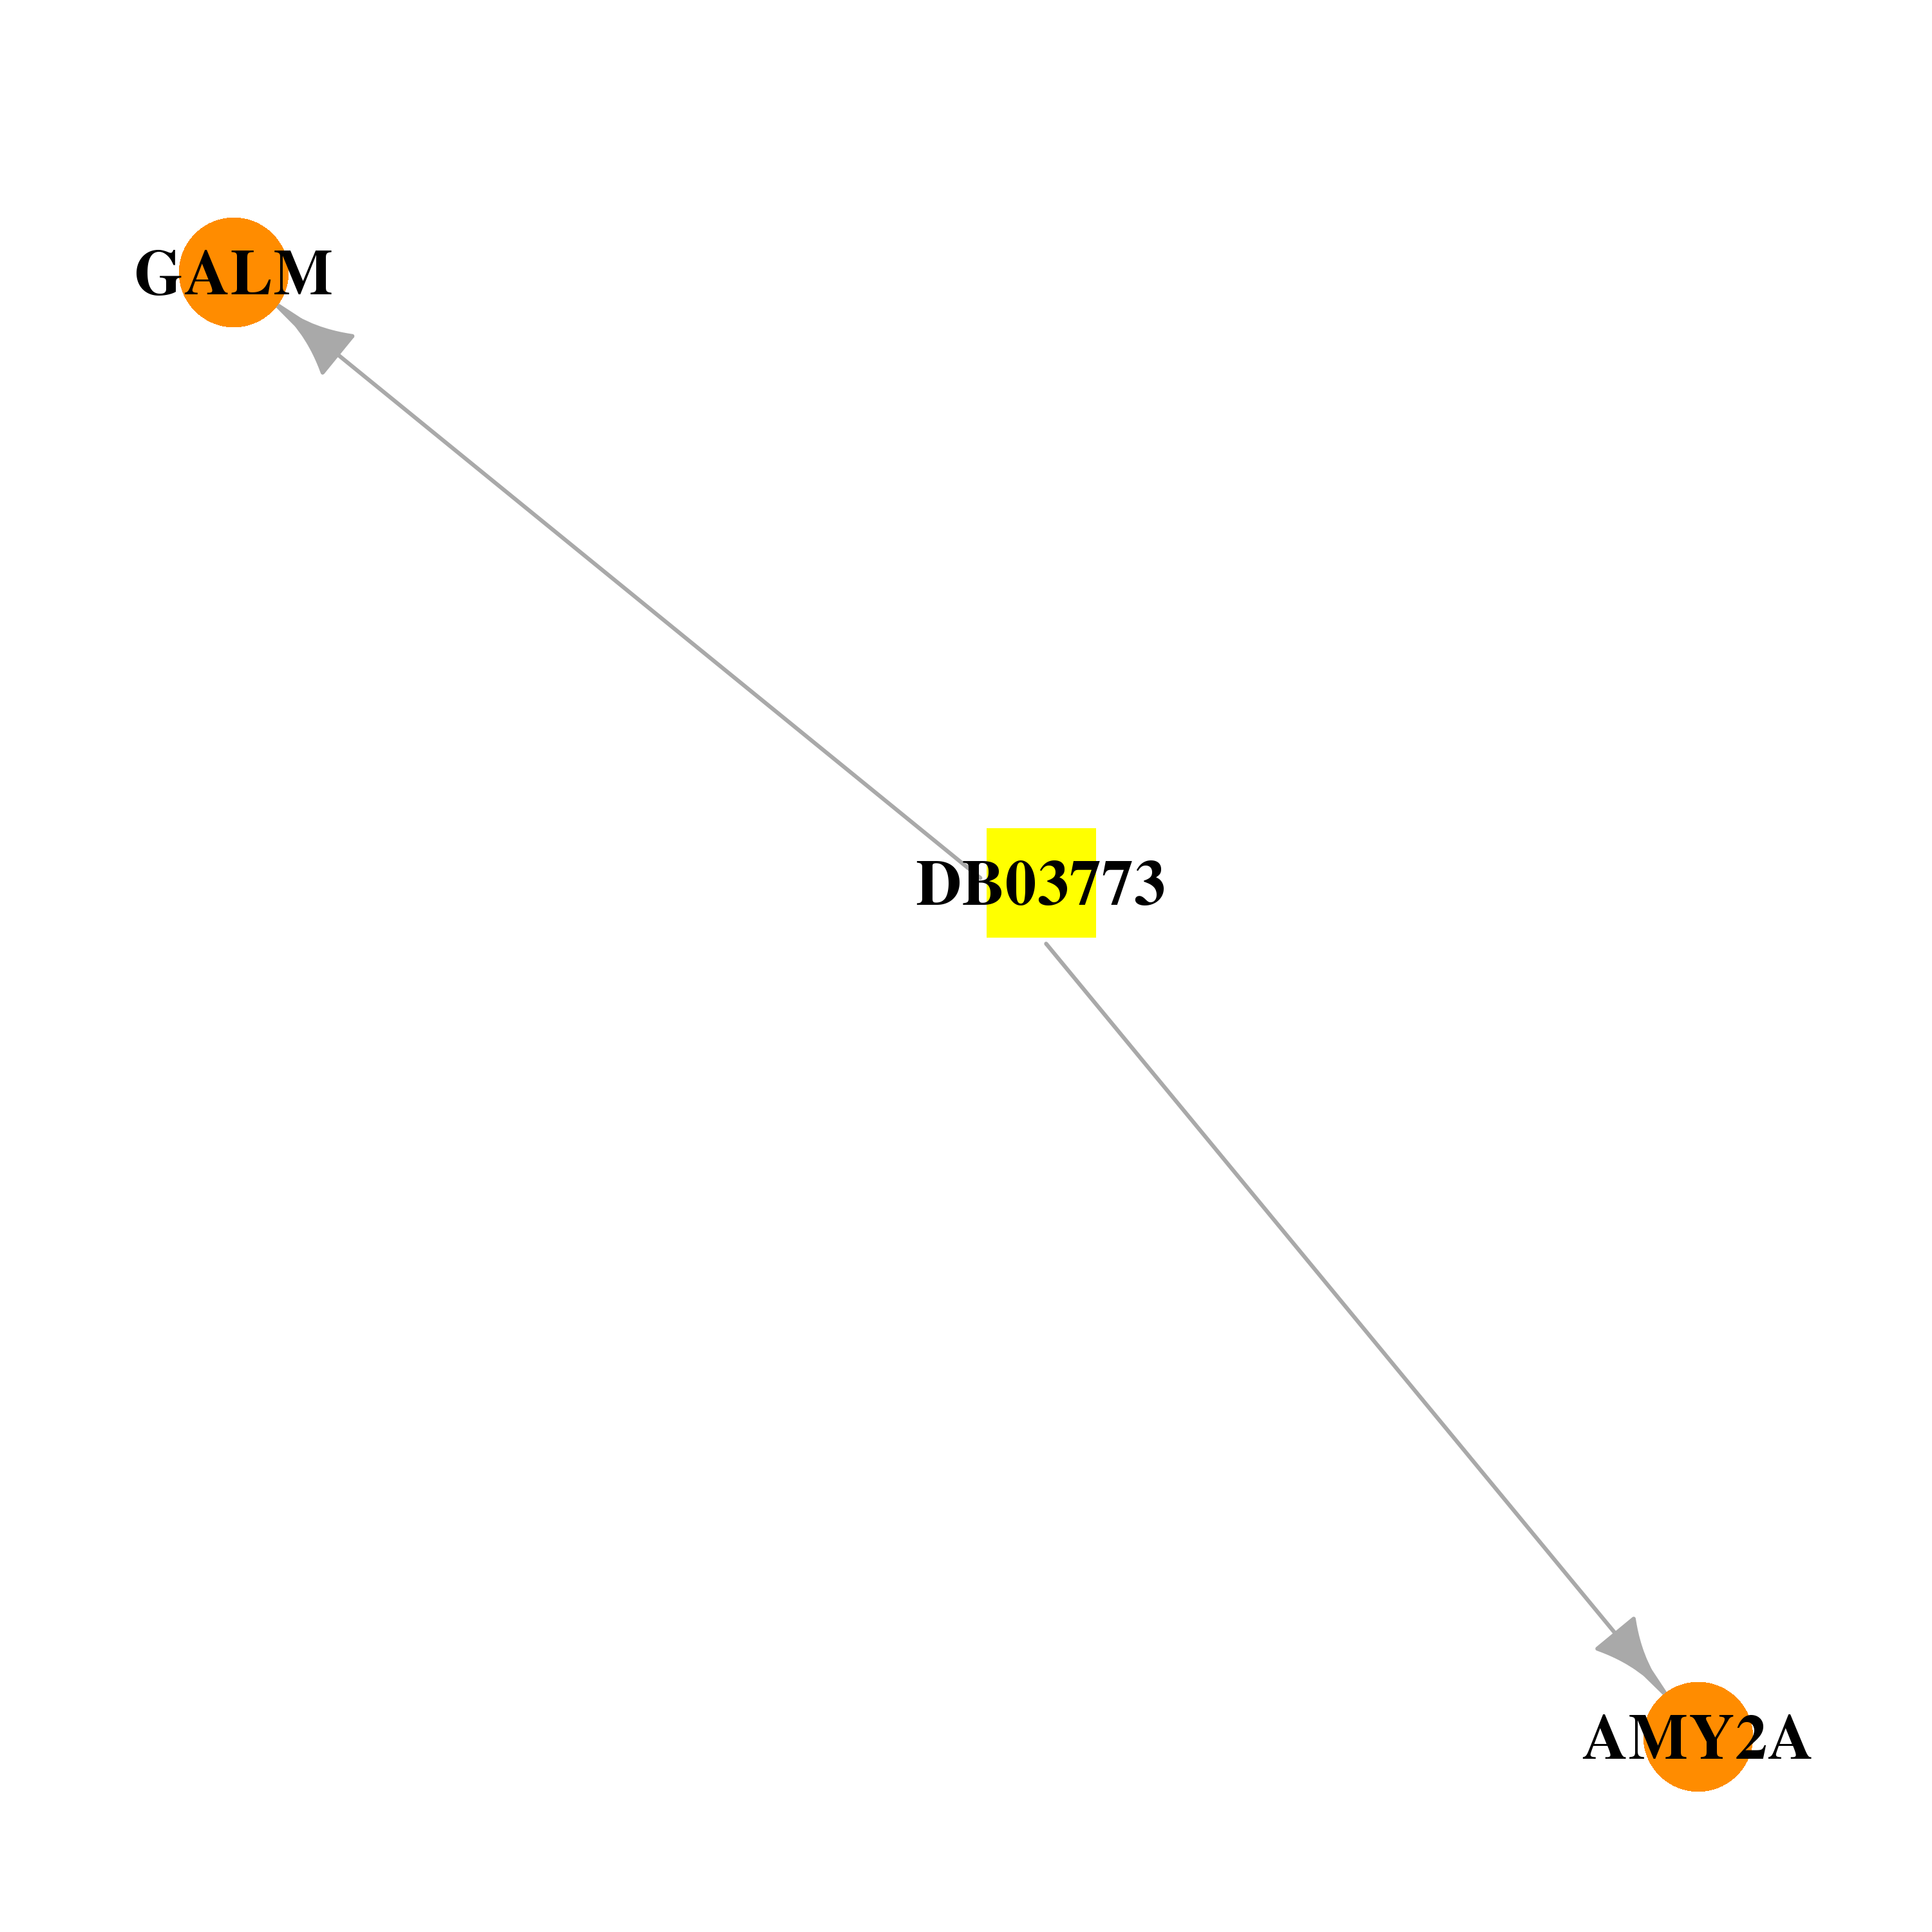 | 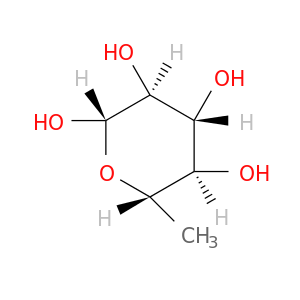 |
| Top |
| Cross referenced IDs for GALM |
| * We obtained these cross-references from Uniprot database. It covers 150 different DBs, 18 categories. http://www.uniprot.org/help/cross_references_section |
: Open all cross reference information
|
Copyright © 2016-Present - The Univsersity of Texas Health Science Center at Houston @ |