|
||||||||||||||||||||
| |
| Phenotypic Information (metabolism pathway, cancer, disease, phenome) |
| |
| |
| Gene-Gene Network Information: Co-Expression Network, Interacting Genes & KEGG |
| |
|


| Gene Summary for GRPEL2 |
| Basic gene info. | Gene symbol | GRPEL2 |
| Gene name | GrpE-like 2, mitochondrial (E. coli) | |
| Synonyms | Mt-GrpE#2 | |
| Cytomap | UCSC genome browser: 5q32 | |
| Genomic location | chr5 :148724976-148734146 | |
| Type of gene | protein-coding | |
| RefGenes | NM_152407.3, | |
| Ensembl id | ENSG00000164284 | |
| Description | grpE protein homolog 2, mitochondrial | |
| Modification date | 20141207 | |
| dbXrefs | HGNC : HGNC | |
| Ensembl : ENSG00000164284 | ||
| HPRD : 17079 | ||
| Vega : OTTHUMG00000130048 | ||
| Protein | UniProt: go to UniProt's Cross Reference DB Table | |
| Expression | CleanEX: HS_GRPEL2 | |
| BioGPS: 134266 | ||
| Gene Expression Atlas: ENSG00000164284 | ||
| The Human Protein Atlas: ENSG00000164284 | ||
| Pathway | NCI Pathway Interaction Database: GRPEL2 | |
| KEGG: GRPEL2 | ||
| REACTOME: GRPEL2 | ||
| ConsensusPathDB | ||
| Pathway Commons: GRPEL2 | ||
| Metabolism | MetaCyc: GRPEL2 | |
| HUMANCyc: GRPEL2 | ||
| Regulation | Ensembl's Regulation: ENSG00000164284 | |
| miRBase: chr5 :148,724,976-148,734,146 | ||
| TargetScan: NM_152407 | ||
| cisRED: ENSG00000164284 | ||
| Context | iHOP: GRPEL2 | |
| cancer metabolism search in PubMed: GRPEL2 | ||
| UCL Cancer Institute: GRPEL2 | ||
| Assigned class in ccmGDB | C | |
| Top |
| Phenotypic Information for GRPEL2(metabolism pathway, cancer, disease, phenome) |
| Cancer | CGAP: GRPEL2 |
| Familial Cancer Database: GRPEL2 | |
| * This gene is included in those cancer gene databases. |
|
|
|
|
|
| . | ||||||||||||||
Oncogene 1 | Significant driver gene in | |||||||||||||||||||
| cf) number; DB name 1 Oncogene; http://nar.oxfordjournals.org/content/35/suppl_1/D721.long, 2 Tumor Suppressor gene; https://bioinfo.uth.edu/TSGene/, 3 Cancer Gene Census; http://www.nature.com/nrc/journal/v4/n3/abs/nrc1299.html, 4 CancerGenes; http://nar.oxfordjournals.org/content/35/suppl_1/D721.long, 5 Network of Cancer Gene; http://ncg.kcl.ac.uk/index.php, 1Therapeutic Vulnerabilities in Cancer; http://cbio.mskcc.org/cancergenomics/statius/ |
| REACTOME_METABOLISM_OF_PROTEINS | |
| OMIM | |
| Orphanet | |
| Disease | KEGG Disease: GRPEL2 |
| MedGen: GRPEL2 (Human Medical Genetics with Condition) | |
| ClinVar: GRPEL2 | |
| Phenotype | MGI: GRPEL2 (International Mouse Phenotyping Consortium) |
| PhenomicDB: GRPEL2 | |
| Mutations for GRPEL2 |
| * Under tables are showing count per each tissue to give us broad intuition about tissue specific mutation patterns.You can go to the detailed page for each mutation database's web site. |
| There's no structural variation information in COSMIC data for this gene. |
| * From mRNA Sanger sequences, Chitars2.0 arranged chimeric transcripts. This table shows GRPEL2 related fusion information. |
| ID | Head Gene | Tail Gene | Accession | Gene_a | qStart_a | qEnd_a | Chromosome_a | tStart_a | tEnd_a | Gene_a | qStart_a | qEnd_a | Chromosome_a | tStart_a | tEnd_a |
| N40724 | GRPEL2 | 1 | 291 | 5 | 148733379 | 148733669 | GRPEL2 | 282 | 429 | 5 | 148733855 | 148734002 | |
| Top |
| There's no copy number variation information in COSMIC data for this gene. |
| Top |
|
 |
| Top |
| Stat. for Non-Synonymous SNVs (# total SNVs=13) | (# total SNVs=8) |
 |  |
(# total SNVs=2) | (# total SNVs=0) |
 |
| Top |
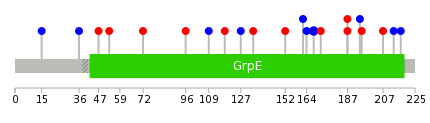
| * When you move the cursor on each content, you can see more deailed mutation information on the Tooltip. Those are primary_site,primary_histology,mutation(aa),pubmedID. |
| GRCh37 position | Mutation(aa) | Unique sampleID count |
| chr5:148730567-148730567 | p.E134K | 2 |
| chr5:148730671-148730671 | p.P168P | 2 |
| chr5:148730548-148730548 | p.I127I | 1 |
| chr5:148730727-148730727 | p.G187V | 1 |
| chr5:148730749-148730749 | p.T194T | 1 |
| chr5:148725147-148725147 | p.R15R | 1 |
| chr5:148730599-148730599 | p.R145fs*6 | 1 |
| chr5:148730750-148730750 | p.V195M | 1 |
| chr5:148727865-148727865 | p.T36T | 1 |
| chr5:148730600-148730600 | p.R145* | 1 |
| Top |
|
 |
| Point Mutation/ Tissue ID | 1 | 2 | 3 | 4 | 5 | 6 | 7 | 8 | 9 | 10 | 11 | 12 | 13 | 14 | 15 | 16 | 17 | 18 | 19 | 20 |
| # sample | 1 | 1 | 2 | 1 | 1 | 1 | 2 | 1 | 2 | |||||||||||
| # mutation | 1 | 1 | 2 | 1 | 1 | 1 | 2 | 1 | 2 | |||||||||||
| nonsynonymous SNV | 1 | 1 | 1 | 2 | 1 | 1 | ||||||||||||||
| synonymous SNV | 2 | 1 | 1 | 1 |
| cf) Tissue ID; Tissue type (1; BLCA[Bladder Urothelial Carcinoma], 2; BRCA[Breast invasive carcinoma], 3; CESC[Cervical squamous cell carcinoma and endocervical adenocarcinoma], 4; COAD[Colon adenocarcinoma], 5; GBM[Glioblastoma multiforme], 6; Glioma Low Grade, 7; HNSC[Head and Neck squamous cell carcinoma], 8; KICH[Kidney Chromophobe], 9; KIRC[Kidney renal clear cell carcinoma], 10; KIRP[Kidney renal papillary cell carcinoma], 11; LAML[Acute Myeloid Leukemia], 12; LUAD[Lung adenocarcinoma], 13; LUSC[Lung squamous cell carcinoma], 14; OV[Ovarian serous cystadenocarcinoma ], 15; PAAD[Pancreatic adenocarcinoma], 16; PRAD[Prostate adenocarcinoma], 17; SKCM[Skin Cutaneous Melanoma], 18:STAD[Stomach adenocarcinoma], 19:THCA[Thyroid carcinoma], 20:UCEC[Uterine Corpus Endometrial Carcinoma]) |
| Top |
| * We represented just top 10 SNVs. When you move the cursor on each content, you can see more deailed mutation information on the Tooltip. Those are primary_site, primary_histology, mutation(aa), pubmedID. |
| Genomic Position | Mutation(aa) | Unique sampleID count |
| chr5:148730727 | p.G207S | 1 |
| chr5:148730749 | p.P29S | 1 |
| chr5:148730750 | p.T36T | 1 |
| chr5:148727842 | p.E47Q | 1 |
| chr5:148730755 | p.E72V | 1 |
| chr5:148727865 | p.A152V | 1 |
| chr5:148730786 | p.G162G | 1 |
| chr5:148727896 | p.E164E | 1 |
| chr5:148727972 | p.G187C | 1 |
| chr5:148730622 | p.G187V | 1 |
| * Copy number data were extracted from TCGA using R package TCGA-Assembler. The URLs of all public data files on TCGA DCC data server were gathered on Jan-05-2015. Function ProcessCNAData in TCGA-Assembler package was used to obtain gene-level copy number value which is calculated as the average copy number of the genomic region of a gene. |
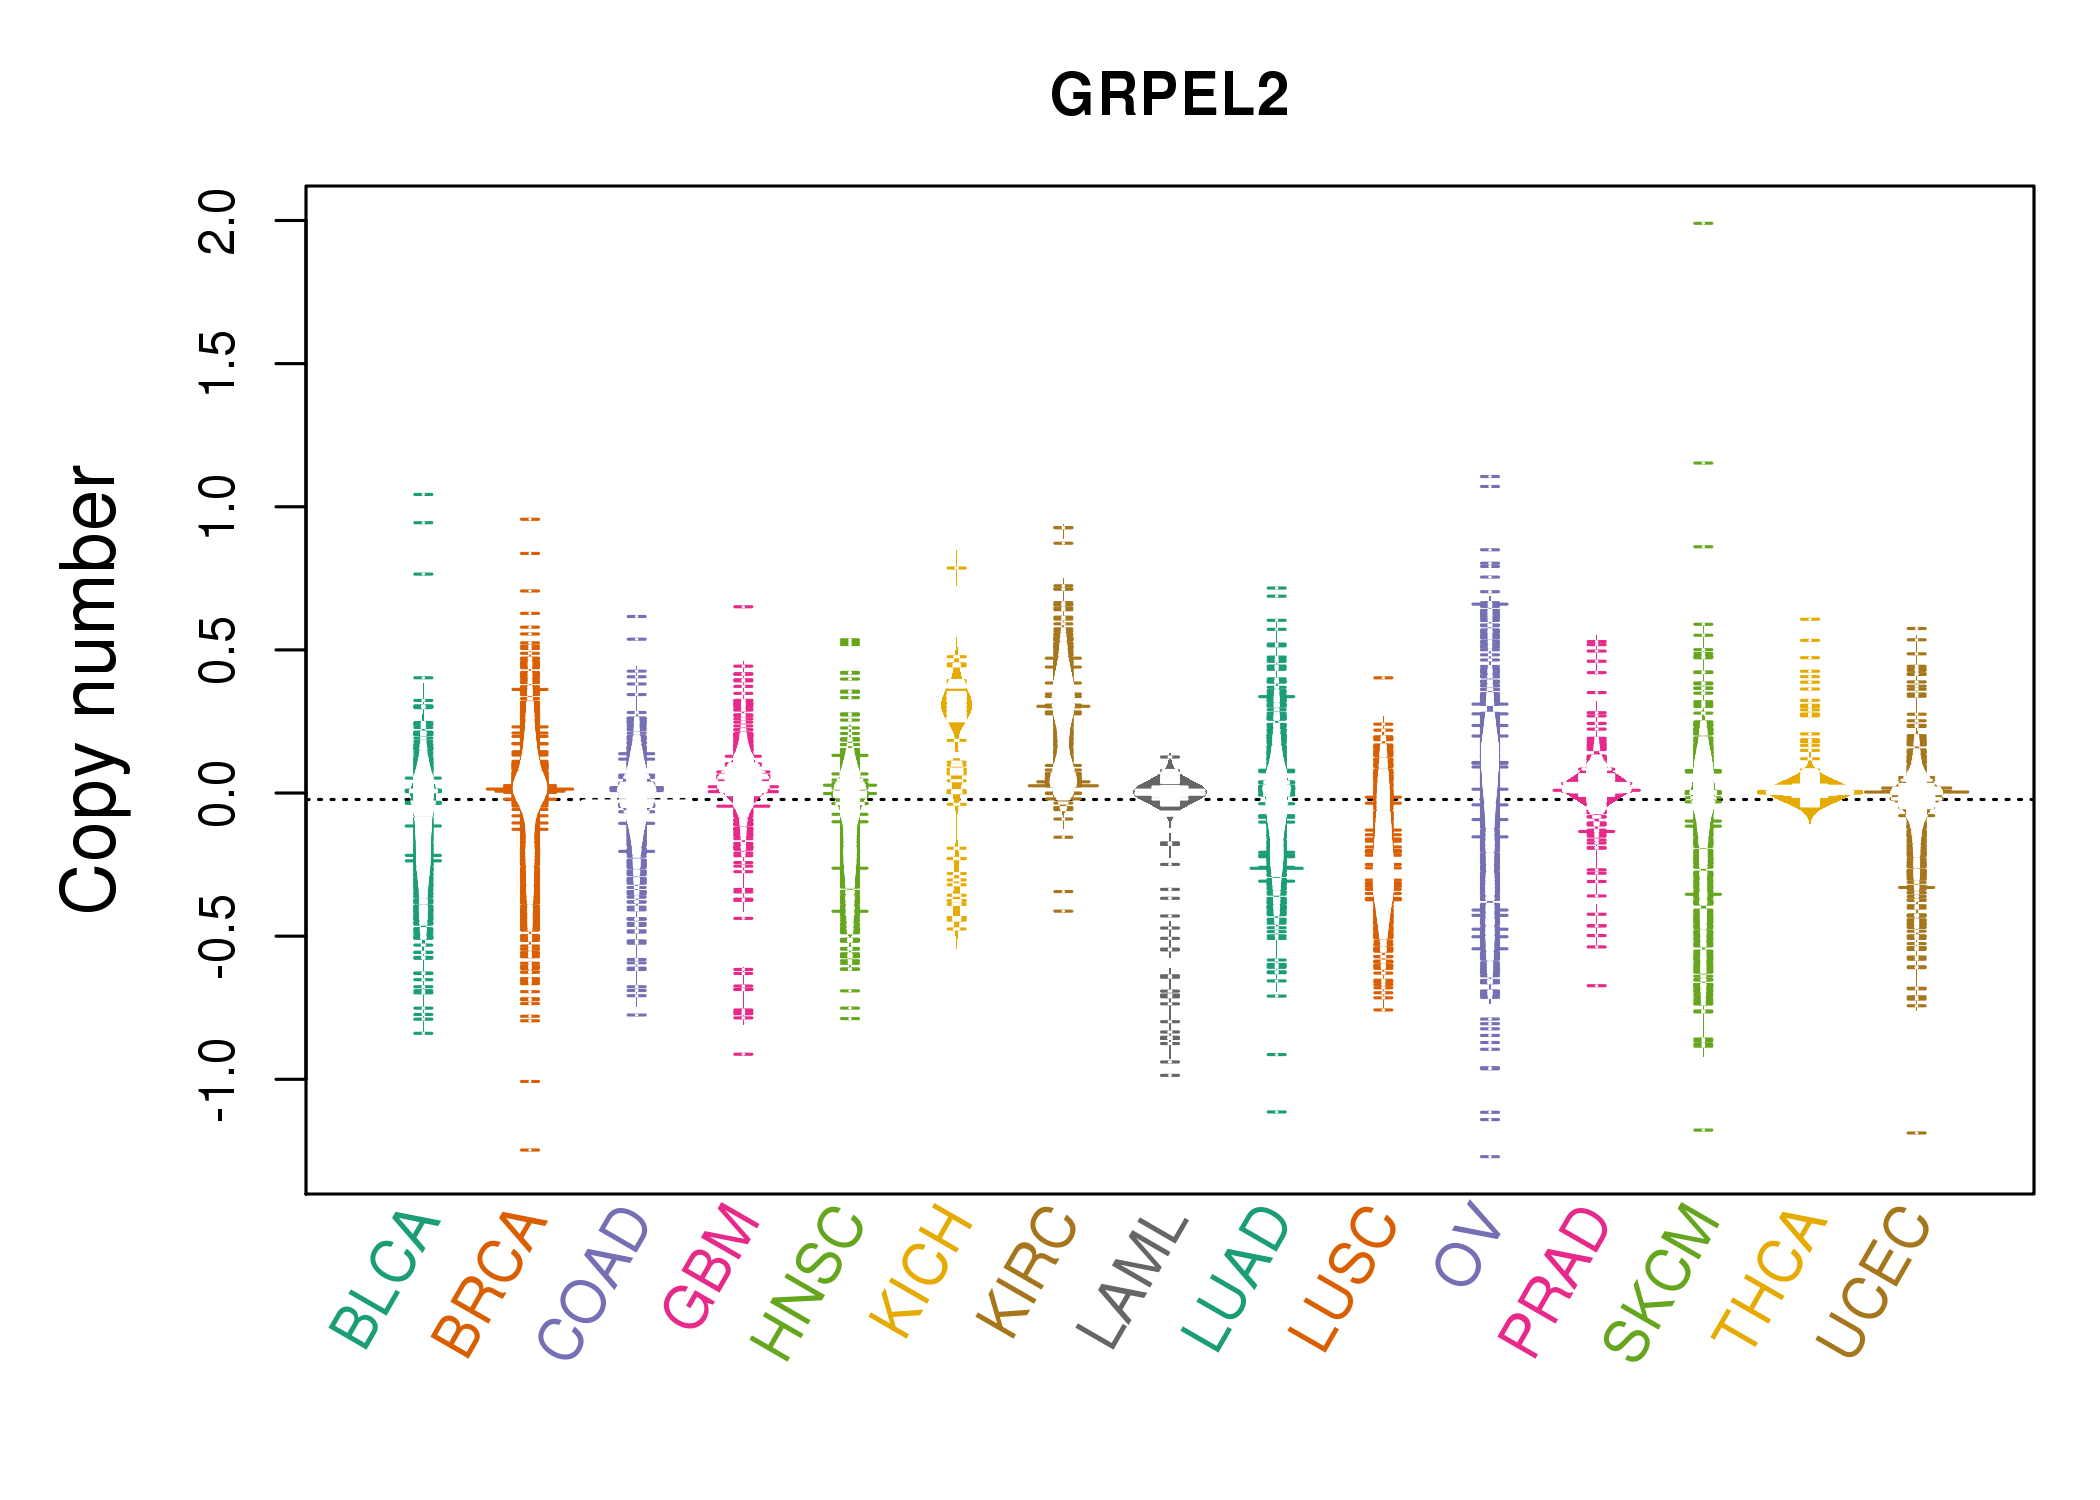 |
| cf) Tissue ID[Tissue type]: BLCA[Bladder Urothelial Carcinoma], BRCA[Breast invasive carcinoma], CESC[Cervical squamous cell carcinoma and endocervical adenocarcinoma], COAD[Colon adenocarcinoma], GBM[Glioblastoma multiforme], Glioma Low Grade, HNSC[Head and Neck squamous cell carcinoma], KICH[Kidney Chromophobe], KIRC[Kidney renal clear cell carcinoma], KIRP[Kidney renal papillary cell carcinoma], LAML[Acute Myeloid Leukemia], LUAD[Lung adenocarcinoma], LUSC[Lung squamous cell carcinoma], OV[Ovarian serous cystadenocarcinoma ], PAAD[Pancreatic adenocarcinoma], PRAD[Prostate adenocarcinoma], SKCM[Skin Cutaneous Melanoma], STAD[Stomach adenocarcinoma], THCA[Thyroid carcinoma], UCEC[Uterine Corpus Endometrial Carcinoma] |
| Top |
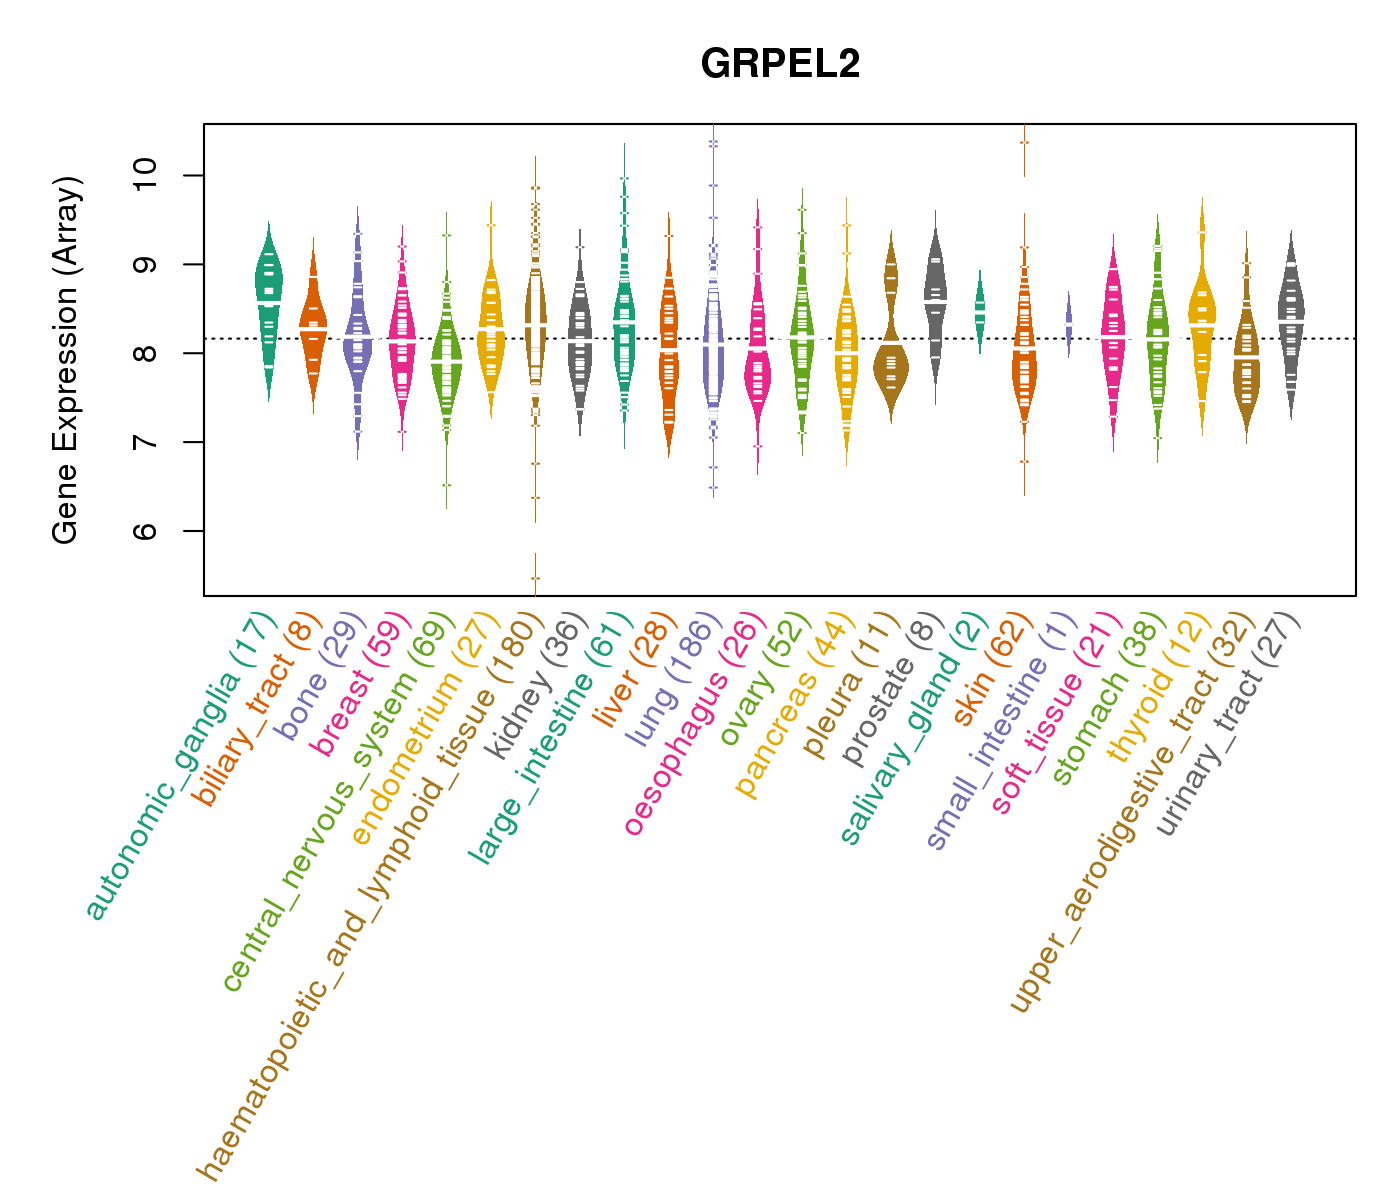
| Gene Expression for GRPEL2 |
| * CCLE gene expression data were extracted from CCLE_Expression_Entrez_2012-10-18.res: Gene-centric RMA-normalized mRNA expression data. |
 |
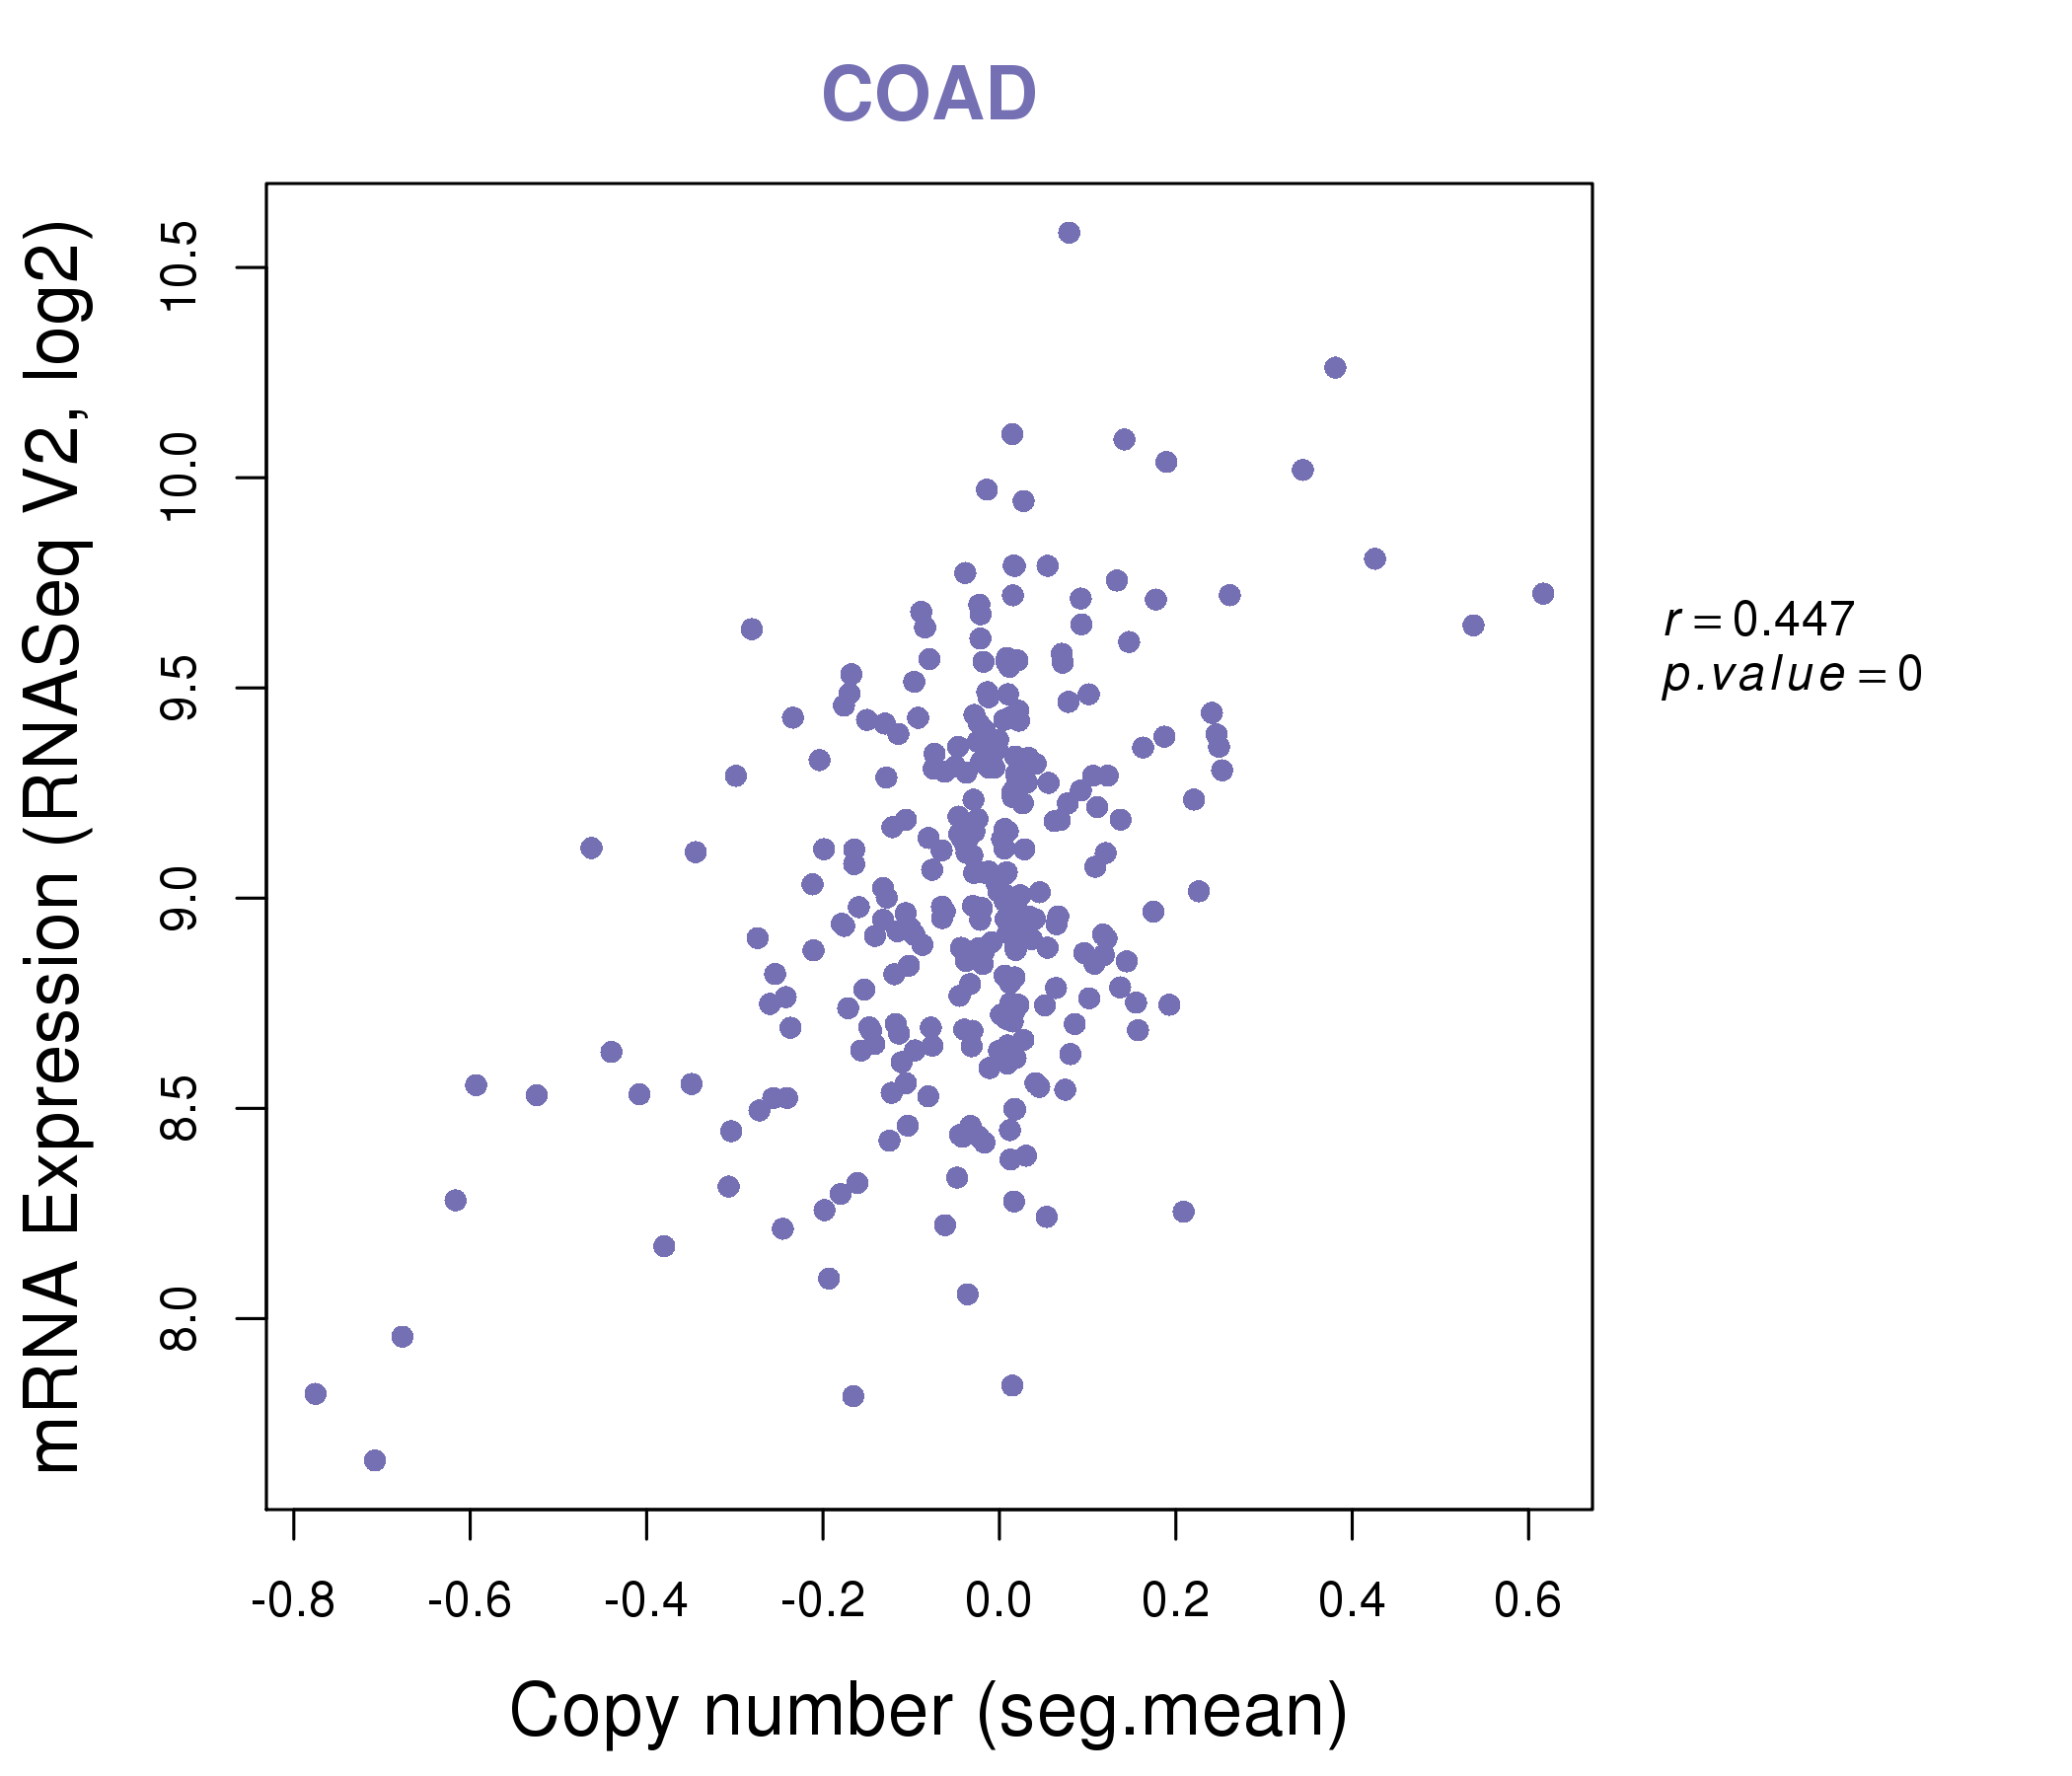
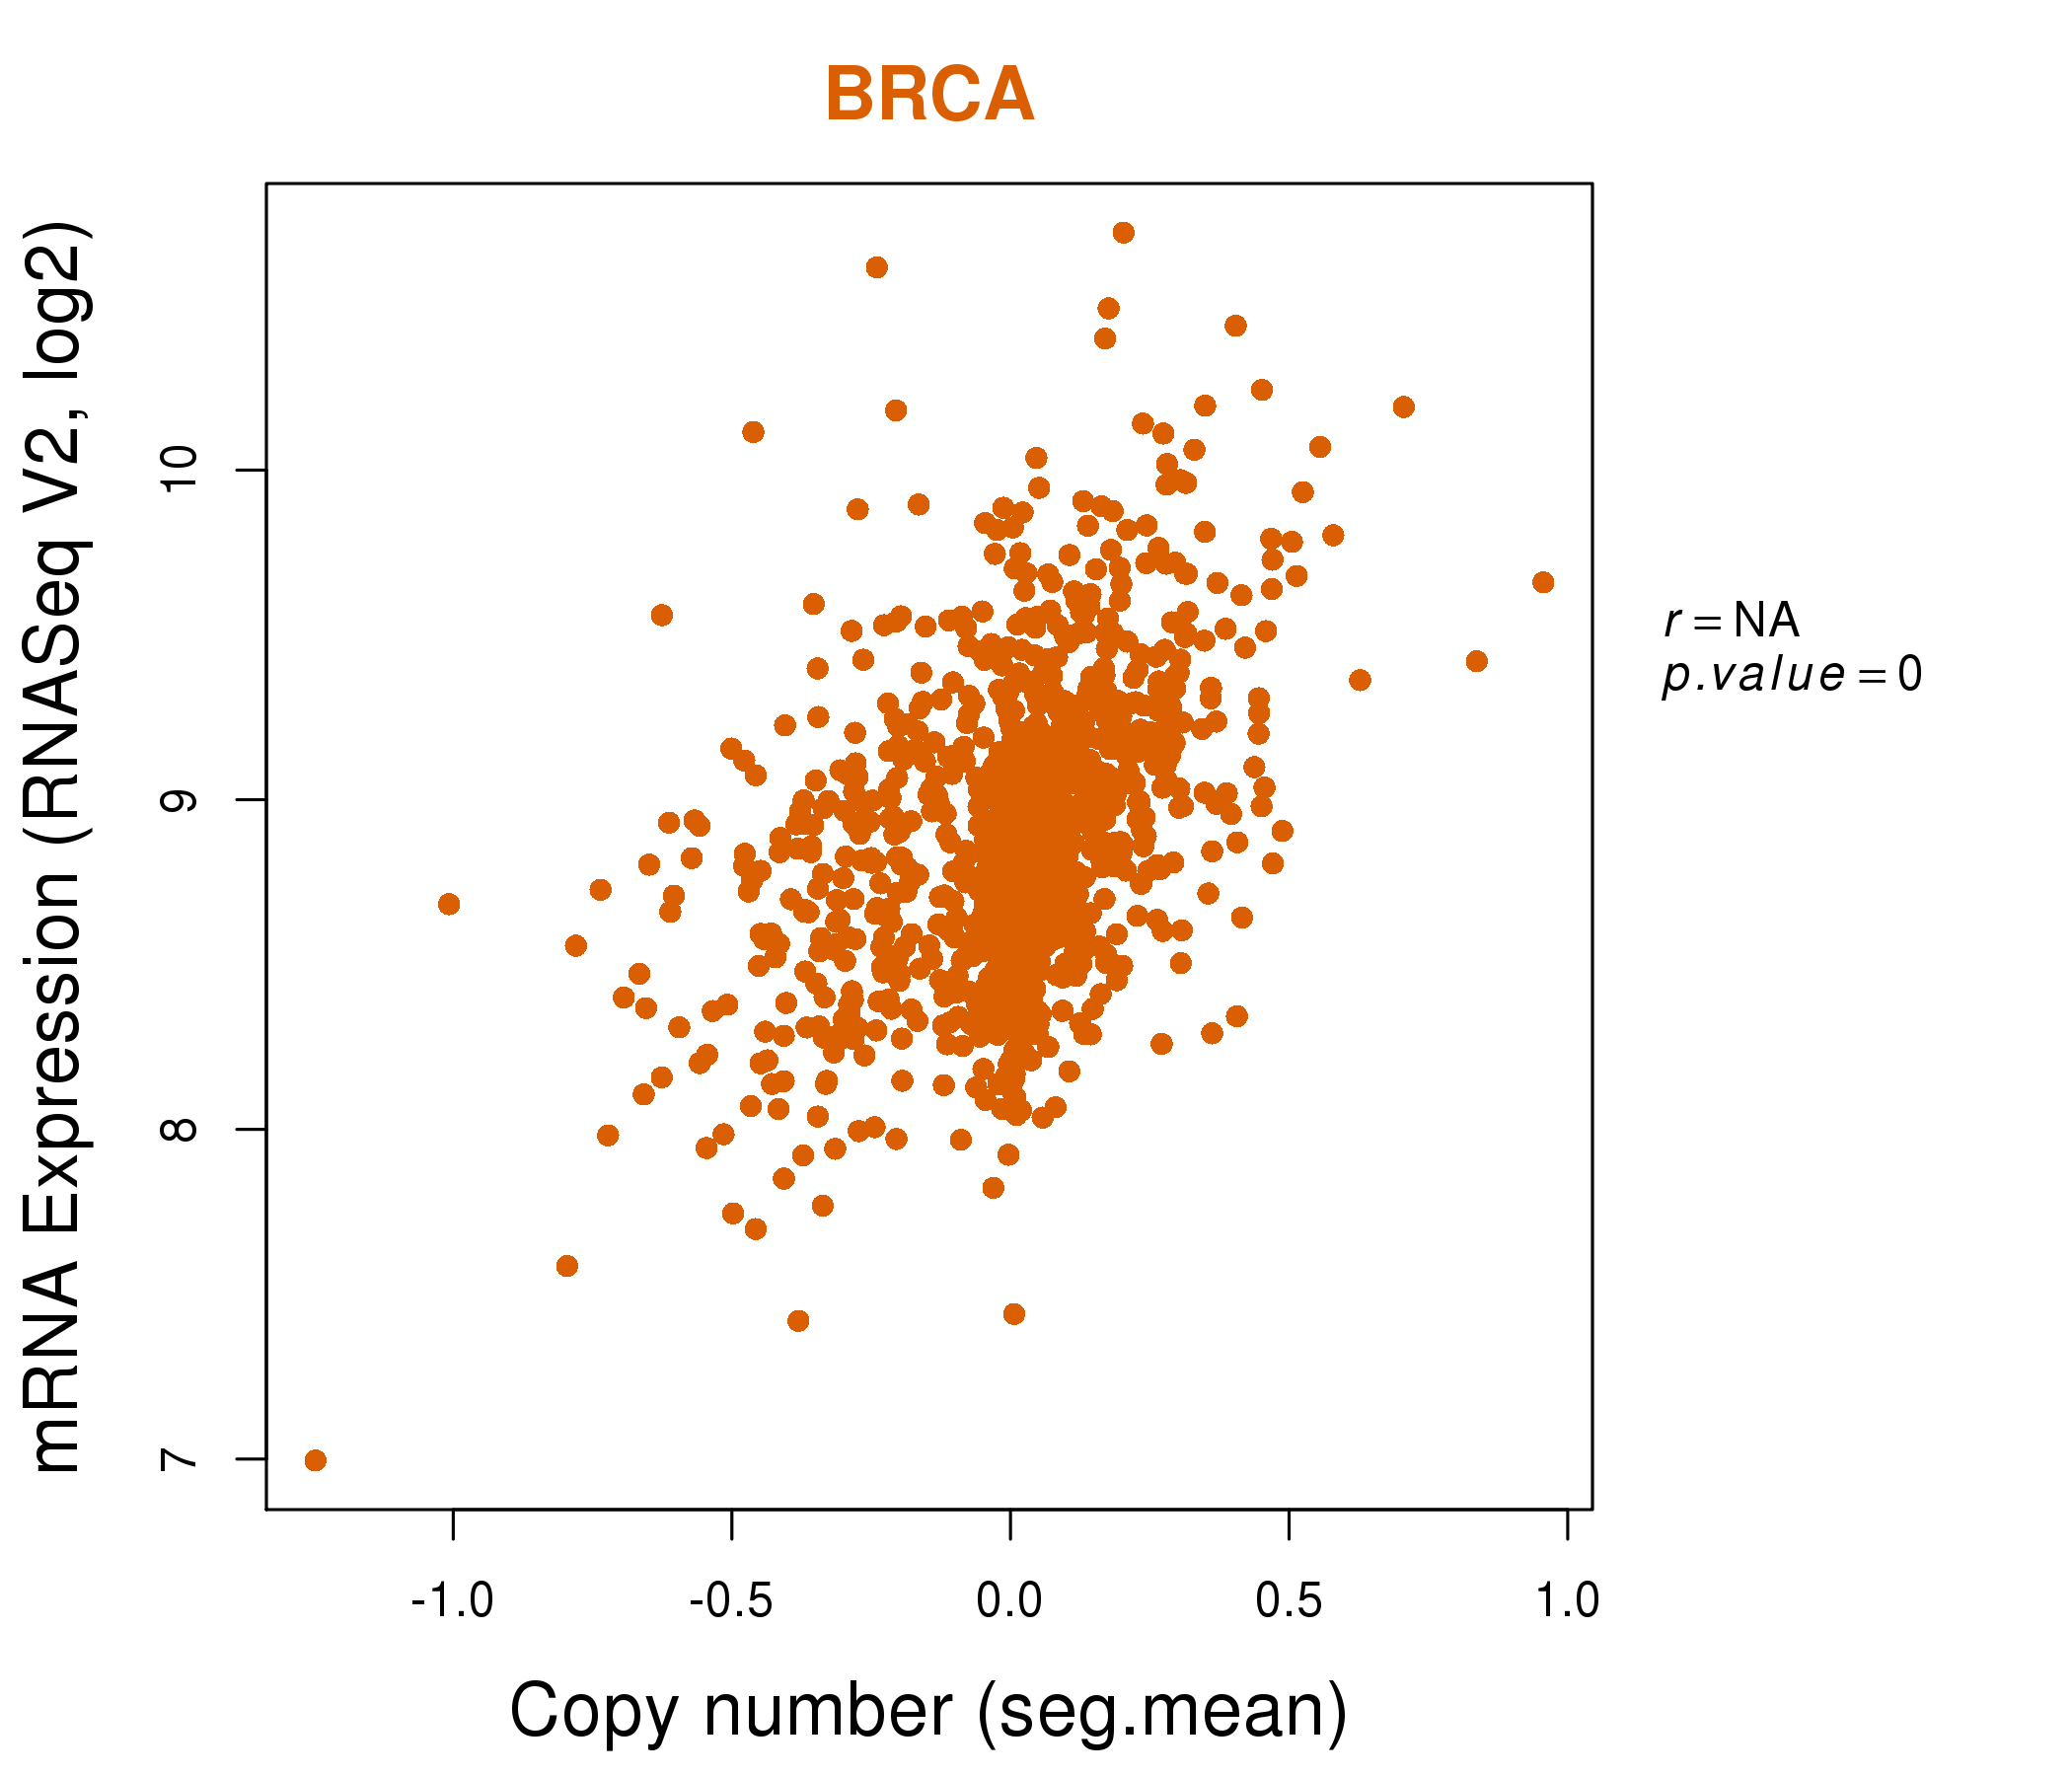
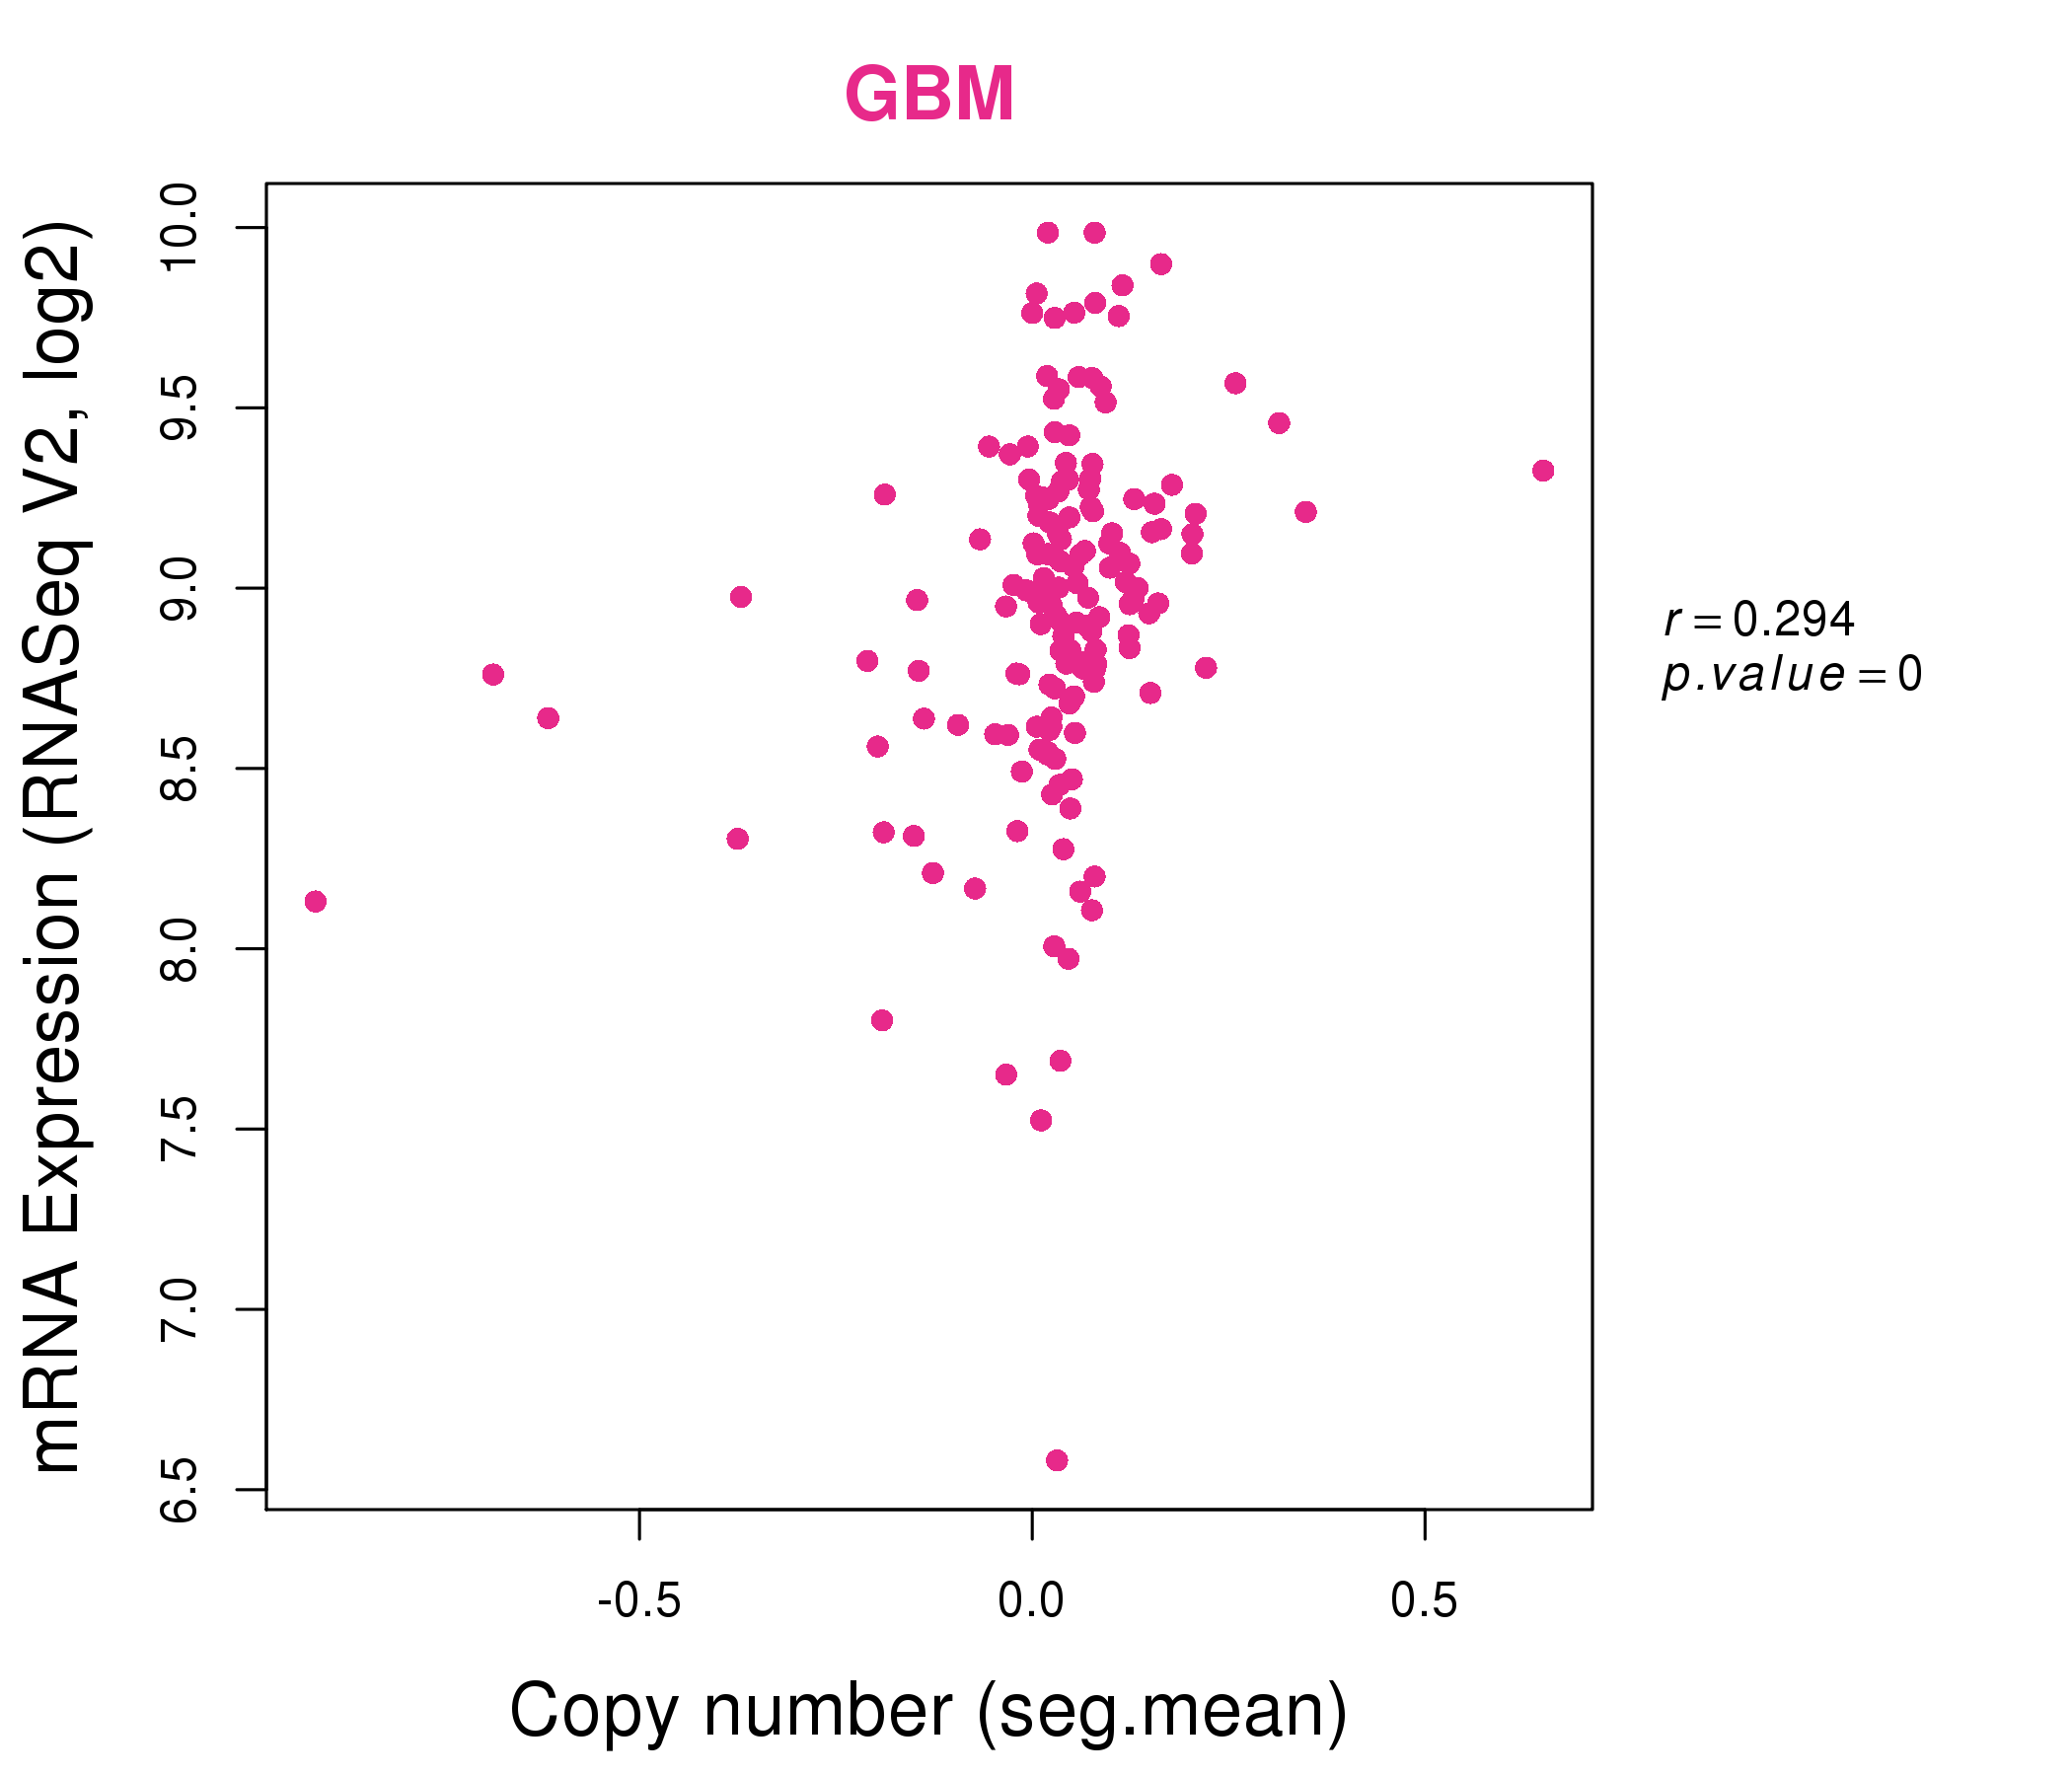
| * Normalized gene expression data of RNASeqV2 was extracted from TCGA using R package TCGA-Assembler. The URLs of all public data files on TCGA DCC data server were gathered at Jan-05-2015. Only eight cancer types have enough normal control samples for differential expression analysis. (t test, adjusted p<0.05 (using Benjamini-Hochberg FDR)) |
 |
| Top |
| * This plots show the correlation between CNV and gene expression. |
: Open all plots for all cancer types
 |
|
 |
|
| Top |
| Gene-Gene Network Information |
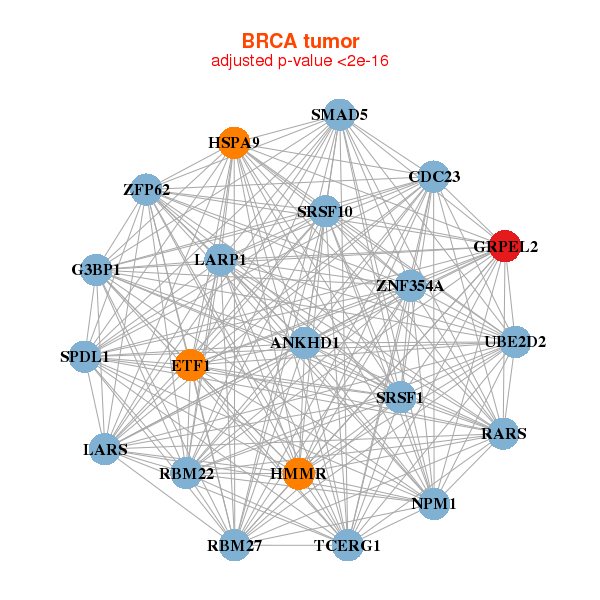
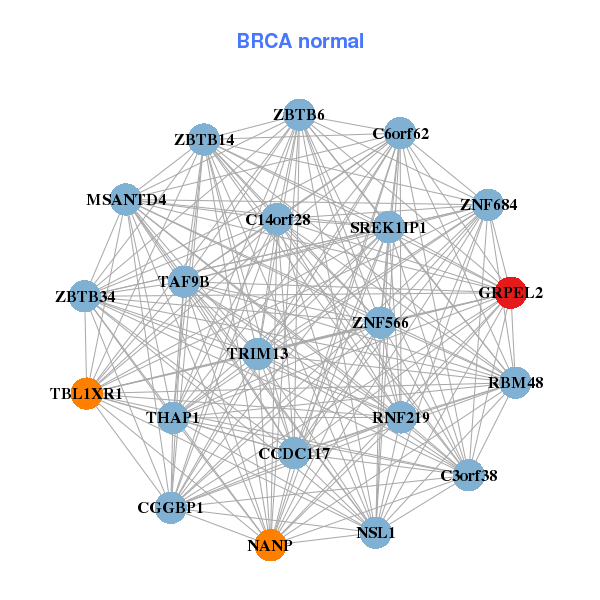
| * Co-Expression network figures were drawn using R package igraph. Only the top 20 genes with the highest correlations were shown. Red circle: input gene, orange circle: cell metabolism gene, sky circle: other gene |
: Open all plots for all cancer types
 |
|
| ANKHD1,SPDL1,CDC23,ETF1,G3BP1,GRPEL2,HMMR, HSPA9,LARP1,LARS,NPM1,RARS,RBM22,RBM27, SRSF10,SRSF1,SMAD5,TCERG1,UBE2D2,ZFP62,ZNF354A | C14orf28,C3orf38,C6orf62,RBM48,CCDC117,CGGBP1,GRPEL2, MSANTD4,NANP,NSL1,RNF219,SREK1IP1,TAF9B,TBL1XR1, THAP1,TRIM13,ZBTB34,ZBTB6,ZBTB14,ZNF566,ZNF684 |
 |
|
| PARPBP,CCDC59,CCNB1,CCNH,CCT2,CDK1,CENPK, GRPEL2,HINT1,MAD2L1,MRPL22,MRPL42,MRPS27,NPM1, PPP2CA,RIOK2,SREK1IP1,TAF9,TBCA,UBE2N,ZCCHC9 | ARL5A,ATG3,BET1,BUD13,CBX3,PBDC1,ENOPH1, FOXN2,GLO1,GRPEL2,LSM6,OSTC,PEX3,TRMT10A, RIOK2,SEC22B,SMS,SVIP,UCHL5,ZC3H15,ZCCHC9 |
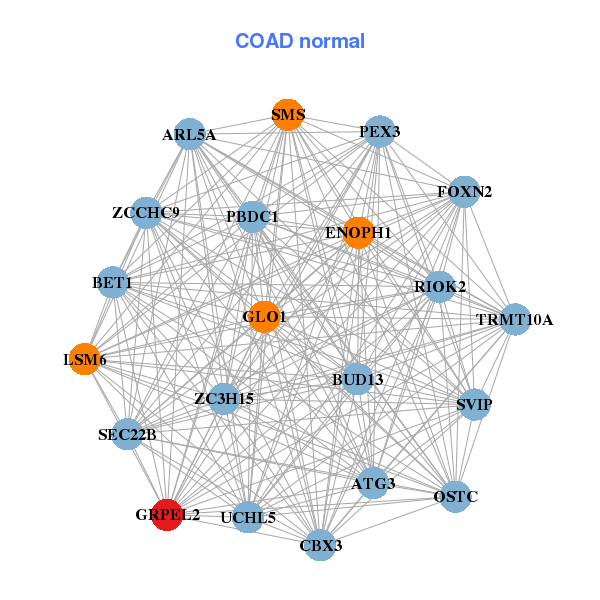
| * Co-Expression network figures were drawn using R package igraph. Only the top 20 genes with the highest correlations were shown. Red circle: input gene, orange circle: cell metabolism gene, sky circle: other gene |
: Open all plots for all cancer types
| Top |
: Open all interacting genes' information including KEGG pathway for all interacting genes from DAVID
| Top |
| Pharmacological Information for GRPEL2 |
| There's no related Drug. |
| Top |
| Cross referenced IDs for GRPEL2 |
| * We obtained these cross-references from Uniprot database. It covers 150 different DBs, 18 categories. http://www.uniprot.org/help/cross_references_section |
: Open all cross reference information
|
Copyright © 2016-Present - The Univsersity of Texas Health Science Center at Houston @ |