|
||||||||||||||||||||
| |
| Phenotypic Information (metabolism pathway, cancer, disease, phenome) |
| |
| |
| Gene-Gene Network Information: Co-Expression Network, Interacting Genes & KEGG |
| |
|


| Gene Summary for STARD4 |
| Basic gene info. | Gene symbol | STARD4 |
| Gene name | StAR-related lipid transfer (START) domain containing 4 | |
| Synonyms | - | |
| Cytomap | UCSC genome browser: 5q22.1 | |
| Genomic location | chr5 :110834021-110848157 | |
| Type of gene | protein-coding | |
| RefGenes | NM_139164.1, | |
| Ensembl id | ENSG00000164211 | |
| Description | START domain containing 4 sterol-regulatedSTART domain containing 4, sterol regulatedSTART domain-containing protein 4stAR-related lipid transfer protein 4 | |
| Modification date | 20141207 | |
| dbXrefs | MIM : 607049 | |
| HGNC : HGNC | ||
| Ensembl : ENSG00000164211 | ||
| HPRD : 06133 | ||
| Vega : OTTHUMG00000128793 | ||
| Protein | UniProt: go to UniProt's Cross Reference DB Table | |
| Expression | CleanEX: HS_STARD4 | |
| BioGPS: 134429 | ||
| Gene Expression Atlas: ENSG00000164211 | ||
| The Human Protein Atlas: ENSG00000164211 | ||
| Pathway | NCI Pathway Interaction Database: STARD4 | |
| KEGG: STARD4 | ||
| REACTOME: STARD4 | ||
| ConsensusPathDB | ||
| Pathway Commons: STARD4 | ||
| Metabolism | MetaCyc: STARD4 | |
| HUMANCyc: STARD4 | ||
| Regulation | Ensembl's Regulation: ENSG00000164211 | |
| miRBase: chr5 :110,834,021-110,848,157 | ||
| TargetScan: NM_139164 | ||
| cisRED: ENSG00000164211 | ||
| Context | iHOP: STARD4 | |
| cancer metabolism search in PubMed: STARD4 | ||
| UCL Cancer Institute: STARD4 | ||
| Assigned class in ccmGDB | C | |
| Top |
| Phenotypic Information for STARD4(metabolism pathway, cancer, disease, phenome) |
| Cancer | CGAP: STARD4 |
| Familial Cancer Database: STARD4 | |
| * This gene is included in those cancer gene databases. |
|
|
|
|
|
| . | ||||||||||||||
Oncogene 1 | Significant driver gene in | |||||||||||||||||||
| cf) number; DB name 1 Oncogene; http://nar.oxfordjournals.org/content/35/suppl_1/D721.long, 2 Tumor Suppressor gene; https://bioinfo.uth.edu/TSGene/, 3 Cancer Gene Census; http://www.nature.com/nrc/journal/v4/n3/abs/nrc1299.html, 4 CancerGenes; http://nar.oxfordjournals.org/content/35/suppl_1/D721.long, 5 Network of Cancer Gene; http://ncg.kcl.ac.uk/index.php, 1Therapeutic Vulnerabilities in Cancer; http://cbio.mskcc.org/cancergenomics/statius/ |
| REACTOME_METABOLISM_OF_STEROID_HORMONES_AND_VITAMINS_A_AND_D REACTOME_METABOLISM_OF_LIPIDS_AND_LIPOPROTEINS | |
| OMIM | |
| Orphanet | |
| Disease | KEGG Disease: STARD4 |
| MedGen: STARD4 (Human Medical Genetics with Condition) | |
| ClinVar: STARD4 | |
| Phenotype | MGI: STARD4 (International Mouse Phenotyping Consortium) |
| PhenomicDB: STARD4 | |
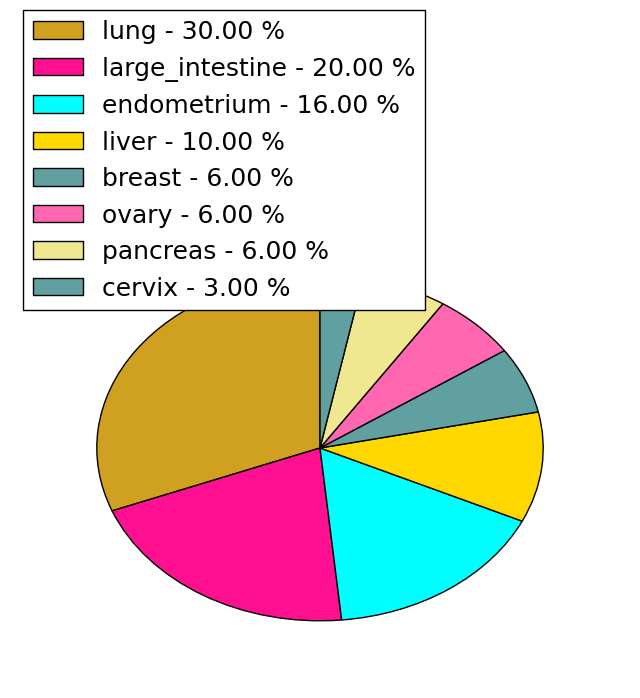
| Mutations for STARD4 |
| * Under tables are showing count per each tissue to give us broad intuition about tissue specific mutation patterns.You can go to the detailed page for each mutation database's web site. |
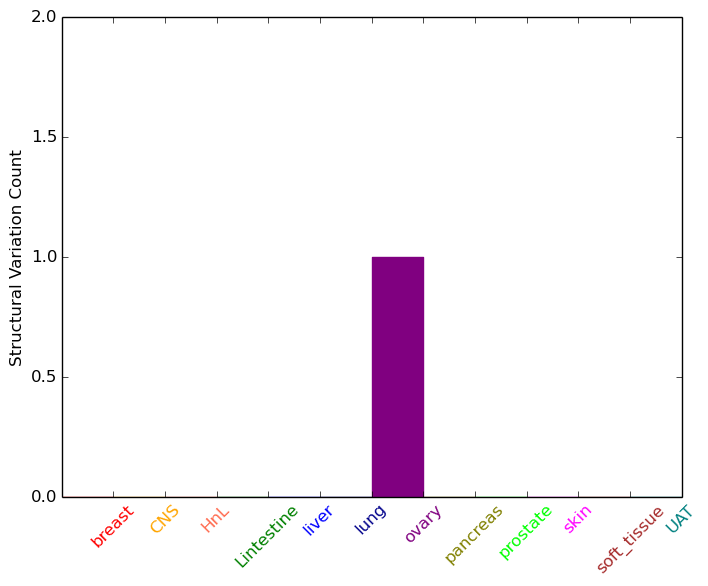
| - Statistics for Tissue and Mutation type | Top |
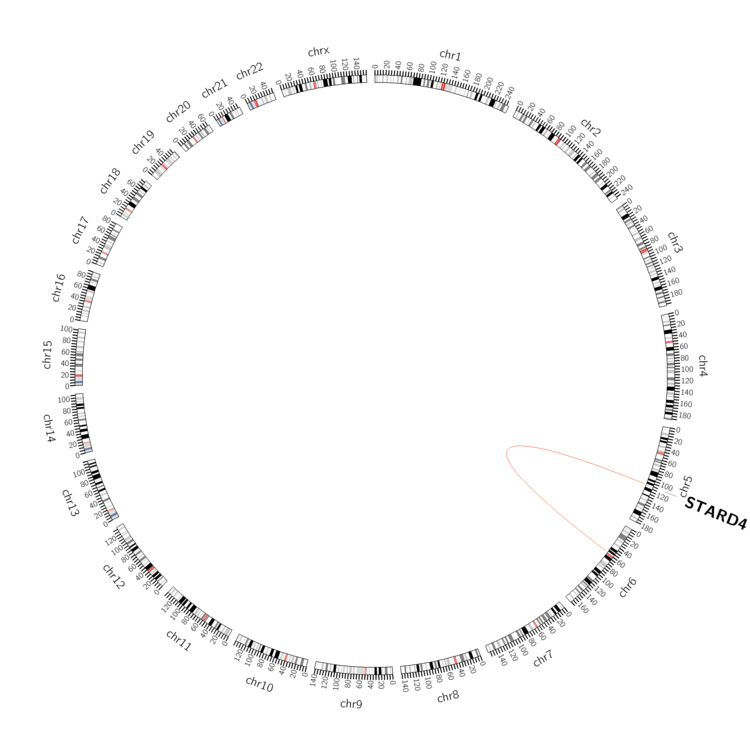 |
| - For Inter-chromosomal Variations |
| * Inter-chromosomal variantions includes 'interchromosomal amplicon to amplicon', 'interchromosomal amplicon to non-amplified dna', 'interchromosomal insertion', 'Interchromosomal unknown type'. |
 |
| - For Intra-chromosomal Variations |
| There's no intra-chromosomal structural variation. |
| Sample | Symbol_a | Chr_a | Start_a | End_a | Symbol_b | Chr_b | Start_b | End_b |
| ovary | STARD4 | chr5 | 110842441 | 110842461 | chr6 | 58738155 | 58738175 |
| cf) Tissue number; Tissue name (1;Breast, 2;Central_nervous_system, 3;Haematopoietic_and_lymphoid_tissue, 4;Large_intestine, 5;Liver, 6;Lung, 7;Ovary, 8;Pancreas, 9;Prostate, 10;Skin, 11;Soft_tissue, 12;Upper_aerodigestive_tract) |
| * From mRNA Sanger sequences, Chitars2.0 arranged chimeric transcripts. This table shows STARD4 related fusion information. |
| ID | Head Gene | Tail Gene | Accession | Gene_a | qStart_a | qEnd_a | Chromosome_a | tStart_a | tEnd_a | Gene_a | qStart_a | qEnd_a | Chromosome_a | tStart_a | tEnd_a |
| Top |
| There's no copy number variation information in COSMIC data for this gene. |
| Top |
|
 |
| Top |
| Stat. for Non-Synonymous SNVs (# total SNVs=30) | (# total SNVs=6) |
 |  |
(# total SNVs=1) | (# total SNVs=0) |
 |
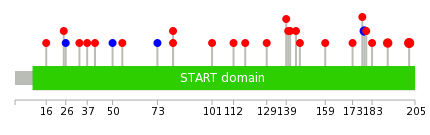
| Top |
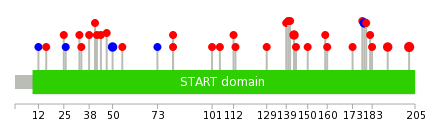
| * When you move the cursor on each content, you can see more deailed mutation information on the Tooltip. Those are primary_site,primary_histology,mutation(aa),pubmedID. |
| GRCh37 position | Mutation(aa) | Unique sampleID count |
| chr5:110835763-110835763 | p.R147* | 4 |
| chr5:110835597-110835597 | p.R202Q | 3 |
| chr5:110835631-110835631 | p.A191T | 2 |
| chr5:110835774-110835774 | p.P143L | 2 |
| chr5:110835665-110835665 | p.G179G | 2 |
| chr5:110842033-110842033 | p.G50G | 2 |
| chr5:110836754-110836754 | p.E115* | 2 |
| chr5:110842052-110842052 | p.P44L | 1 |
| chr5:110835726-110835726 | p.P159L | 1 |
| chr5:110843096-110843096 | p.T12T | 1 |
| Top |
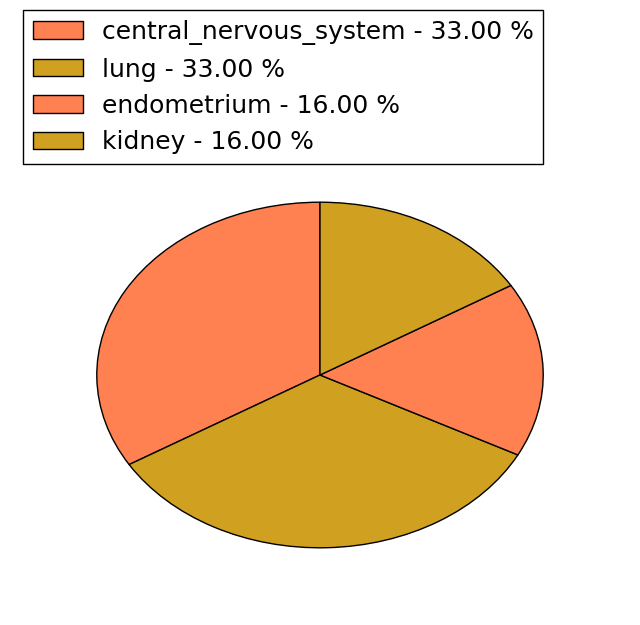
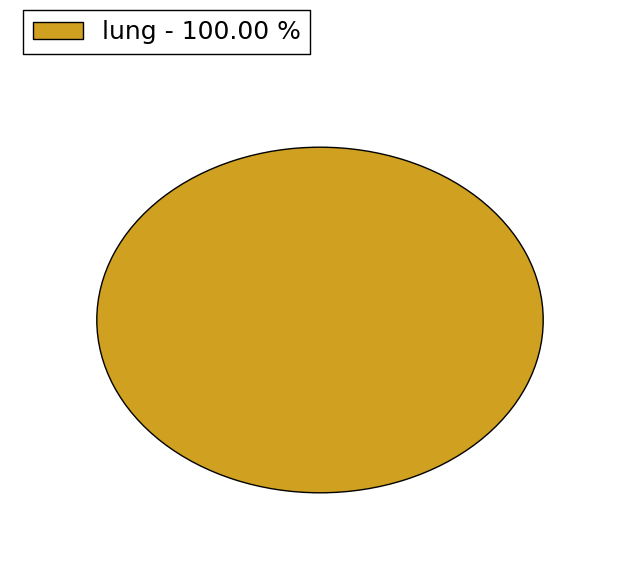
|
 |
| Point Mutation/ Tissue ID | 1 | 2 | 3 | 4 | 5 | 6 | 7 | 8 | 9 | 10 | 11 | 12 | 13 | 14 | 15 | 16 | 17 | 18 | 19 | 20 |
| # sample | 1 | 2 | 1 | 4 | 1 | 2 | 2 | 1 | 3 | 2 | 9 | 3 | ||||||||
| # mutation | 1 | 2 | 1 | 4 | 1 | 2 | 2 | 1 | 3 | 2 | 8 | 3 | ||||||||
| nonsynonymous SNV | 1 | 2 | 1 | 4 | 2 | 1 | 1 | 2 | 2 | 7 | 2 | |||||||||
| synonymous SNV | 1 | 1 | 1 | 1 | 1 |
| cf) Tissue ID; Tissue type (1; BLCA[Bladder Urothelial Carcinoma], 2; BRCA[Breast invasive carcinoma], 3; CESC[Cervical squamous cell carcinoma and endocervical adenocarcinoma], 4; COAD[Colon adenocarcinoma], 5; GBM[Glioblastoma multiforme], 6; Glioma Low Grade, 7; HNSC[Head and Neck squamous cell carcinoma], 8; KICH[Kidney Chromophobe], 9; KIRC[Kidney renal clear cell carcinoma], 10; KIRP[Kidney renal papillary cell carcinoma], 11; LAML[Acute Myeloid Leukemia], 12; LUAD[Lung adenocarcinoma], 13; LUSC[Lung squamous cell carcinoma], 14; OV[Ovarian serous cystadenocarcinoma ], 15; PAAD[Pancreatic adenocarcinoma], 16; PRAD[Prostate adenocarcinoma], 17; SKCM[Skin Cutaneous Melanoma], 18:STAD[Stomach adenocarcinoma], 19:THCA[Thyroid carcinoma], 20:UCEC[Uterine Corpus Endometrial Carcinoma]) |
| Top |
| * We represented just top 10 SNVs. When you move the cursor on each content, you can see more deailed mutation information on the Tooltip. Those are primary_site, primary_histology, mutation(aa), pubmedID. |
| Genomic Position | Mutation(aa) | Unique sampleID count |
| chr5:110835597 | p.R202Q | 3 |
| chr5:110835631 | p.A191T | 2 |
| chr5:110835665 | p.G179G | 2 |
| chr5:110835772 | p.L129P | 1 |
| chr5:110837779 | p.D118H | 1 |
| chr5:110835779 | p.S112F | 1 |
| chr5:110842033 | p.Y101C | 1 |
| chr5:110835784 | p.S81R | 1 |
| chr5:110842061 | p.Q183E | 1 |
| chr5:110835787 | p.S81N | 1 |
| * Copy number data were extracted from TCGA using R package TCGA-Assembler. The URLs of all public data files on TCGA DCC data server were gathered on Jan-05-2015. Function ProcessCNAData in TCGA-Assembler package was used to obtain gene-level copy number value which is calculated as the average copy number of the genomic region of a gene. |
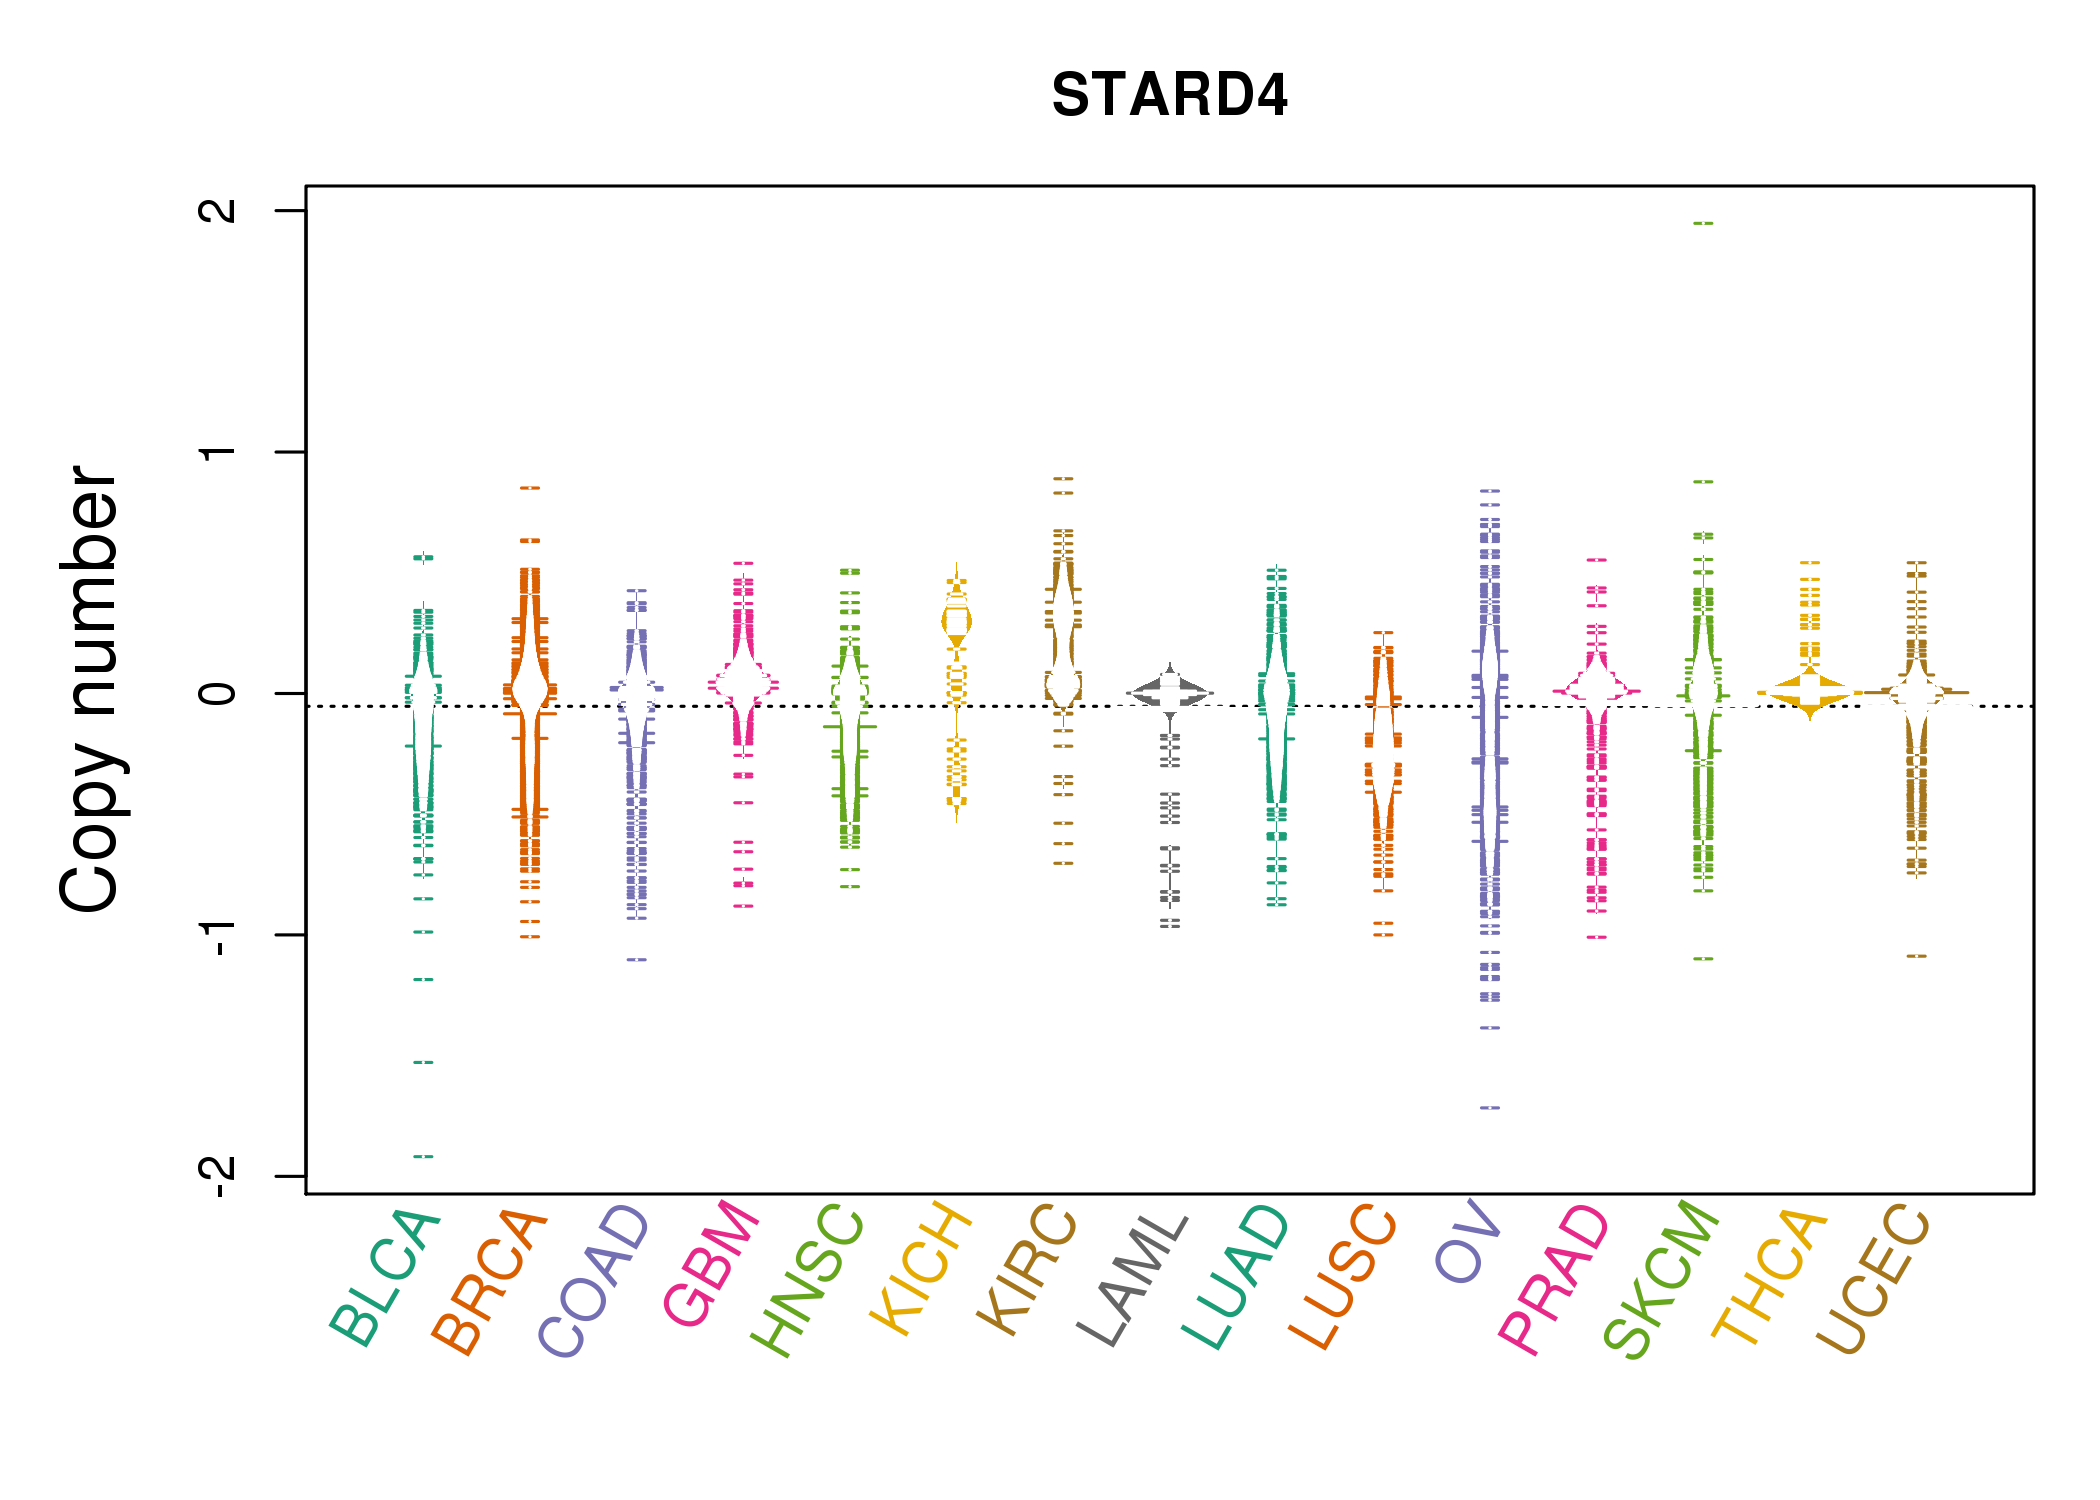 |
| cf) Tissue ID[Tissue type]: BLCA[Bladder Urothelial Carcinoma], BRCA[Breast invasive carcinoma], CESC[Cervical squamous cell carcinoma and endocervical adenocarcinoma], COAD[Colon adenocarcinoma], GBM[Glioblastoma multiforme], Glioma Low Grade, HNSC[Head and Neck squamous cell carcinoma], KICH[Kidney Chromophobe], KIRC[Kidney renal clear cell carcinoma], KIRP[Kidney renal papillary cell carcinoma], LAML[Acute Myeloid Leukemia], LUAD[Lung adenocarcinoma], LUSC[Lung squamous cell carcinoma], OV[Ovarian serous cystadenocarcinoma ], PAAD[Pancreatic adenocarcinoma], PRAD[Prostate adenocarcinoma], SKCM[Skin Cutaneous Melanoma], STAD[Stomach adenocarcinoma], THCA[Thyroid carcinoma], UCEC[Uterine Corpus Endometrial Carcinoma] |
| Top |
| Gene Expression for STARD4 |
| * CCLE gene expression data were extracted from CCLE_Expression_Entrez_2012-10-18.res: Gene-centric RMA-normalized mRNA expression data. |
 |
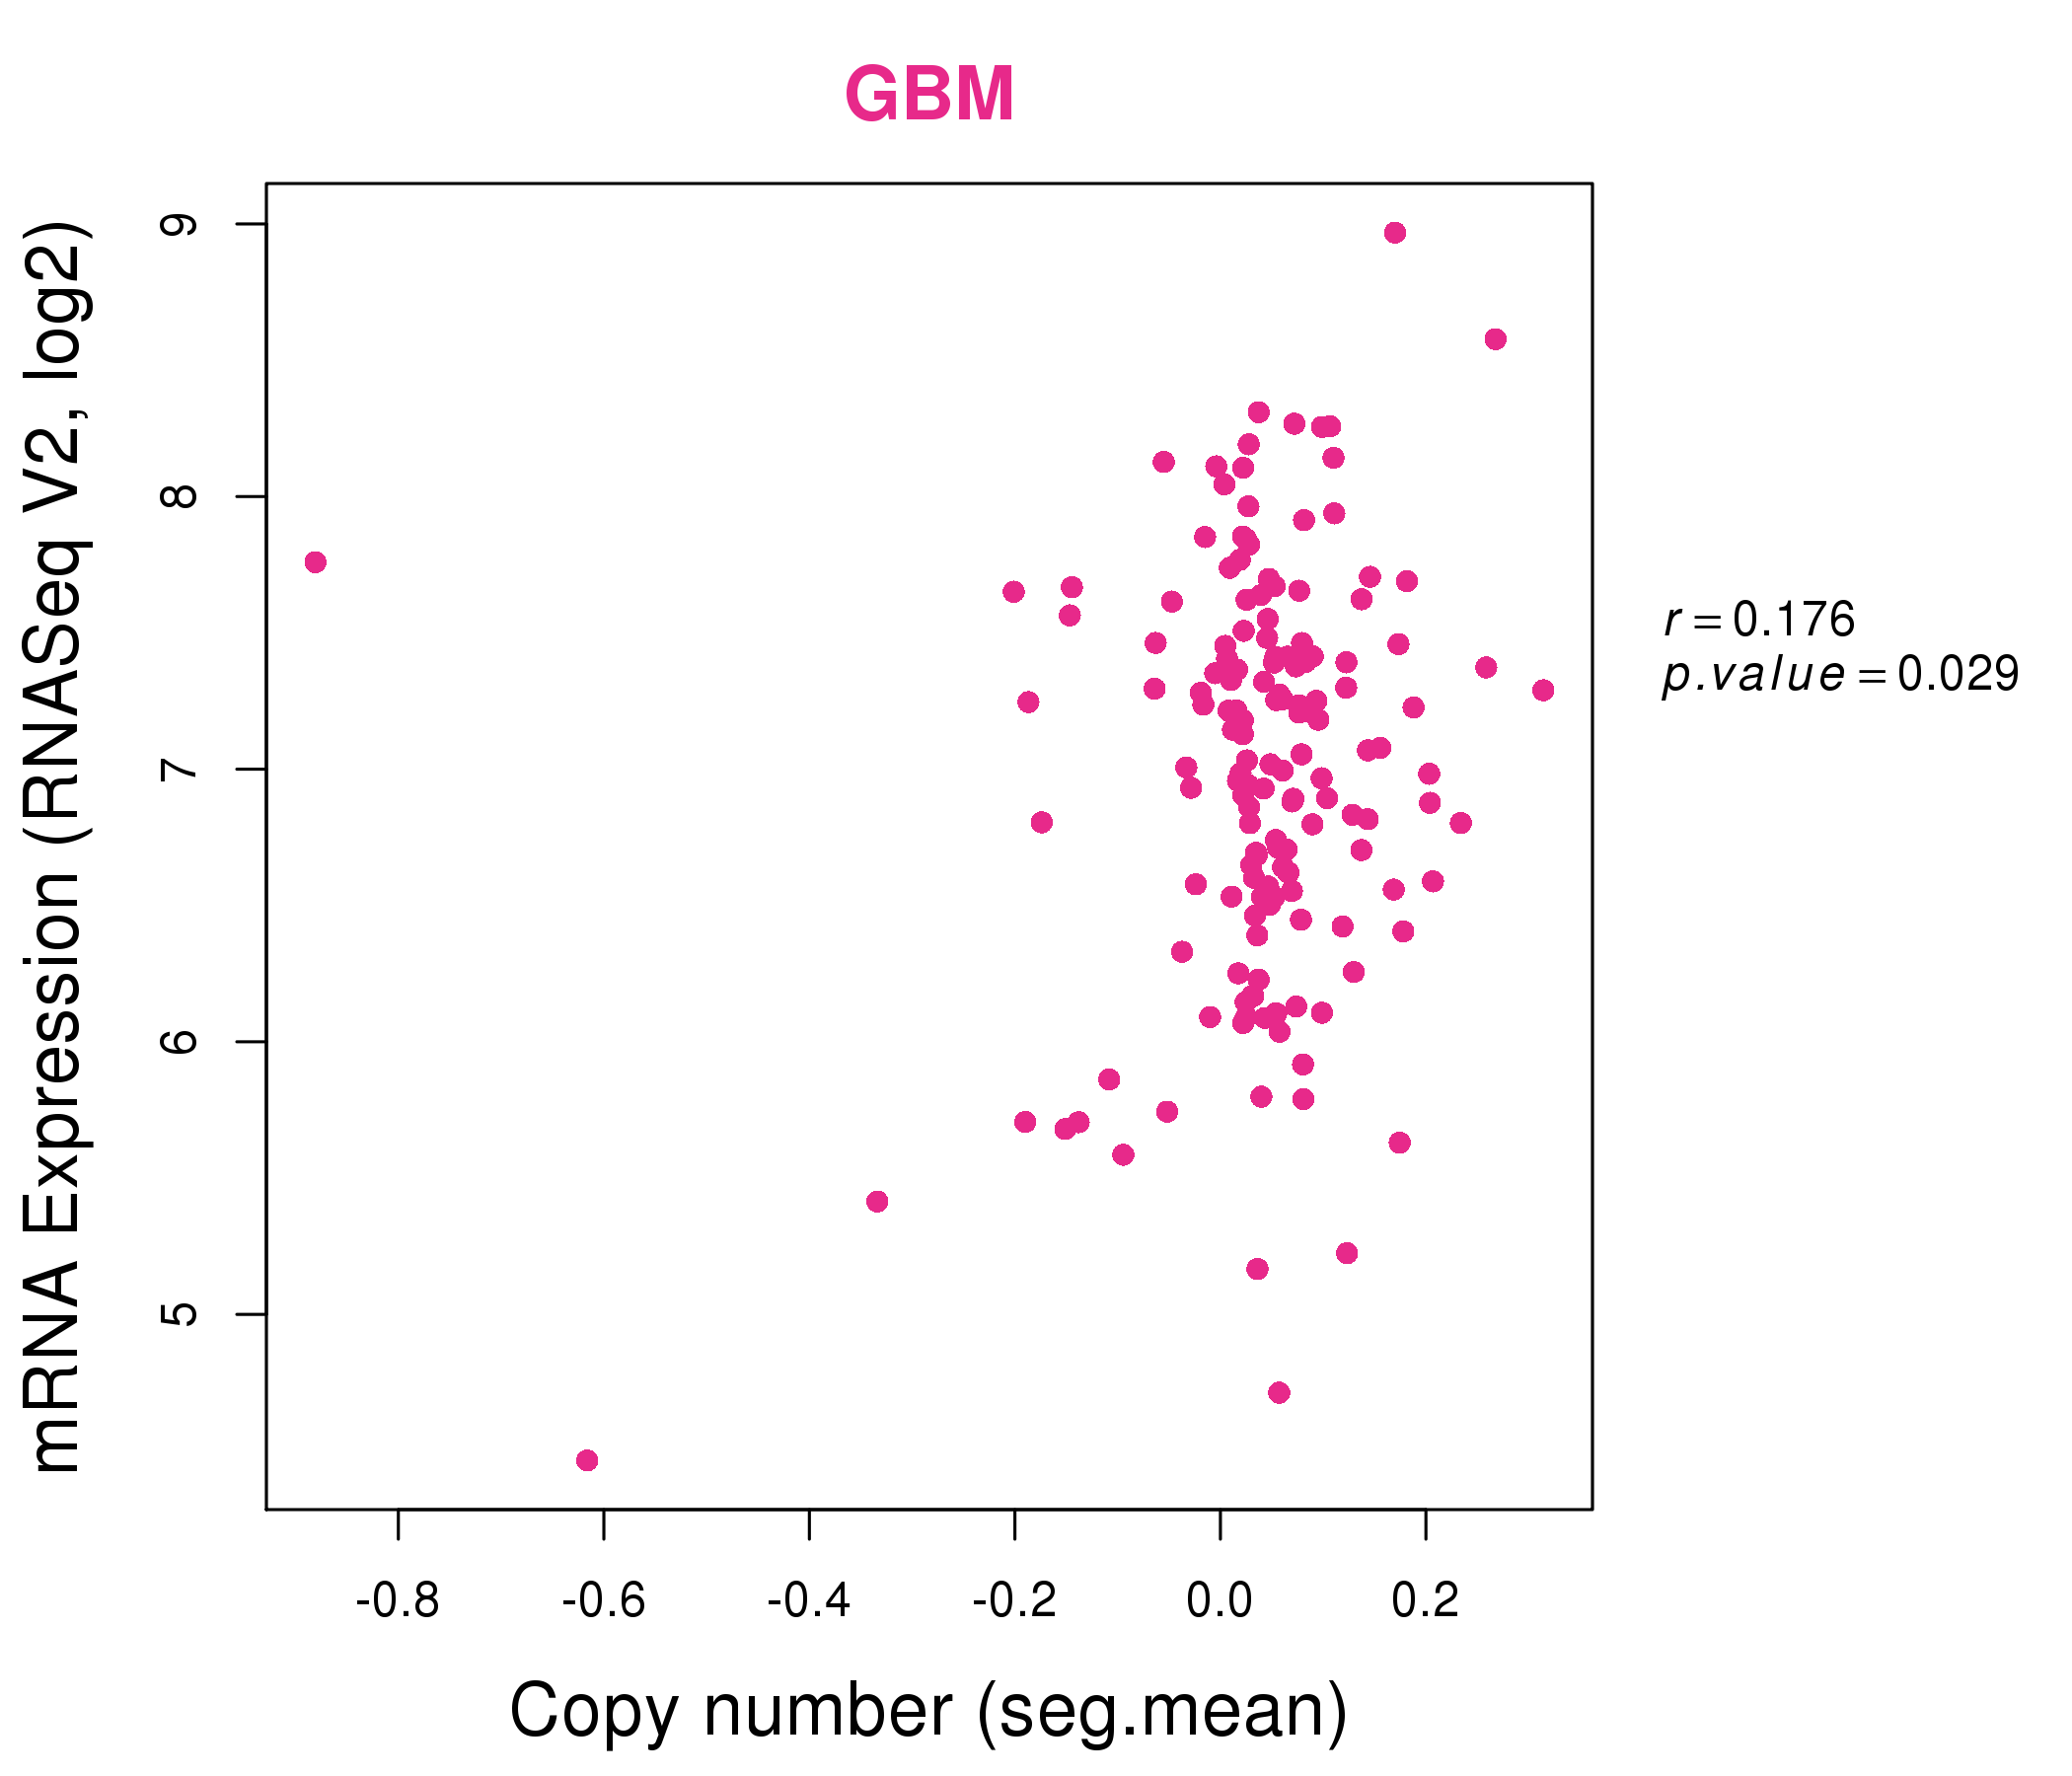
| * Normalized gene expression data of RNASeqV2 was extracted from TCGA using R package TCGA-Assembler. The URLs of all public data files on TCGA DCC data server were gathered at Jan-05-2015. Only eight cancer types have enough normal control samples for differential expression analysis. (t test, adjusted p<0.05 (using Benjamini-Hochberg FDR)) |
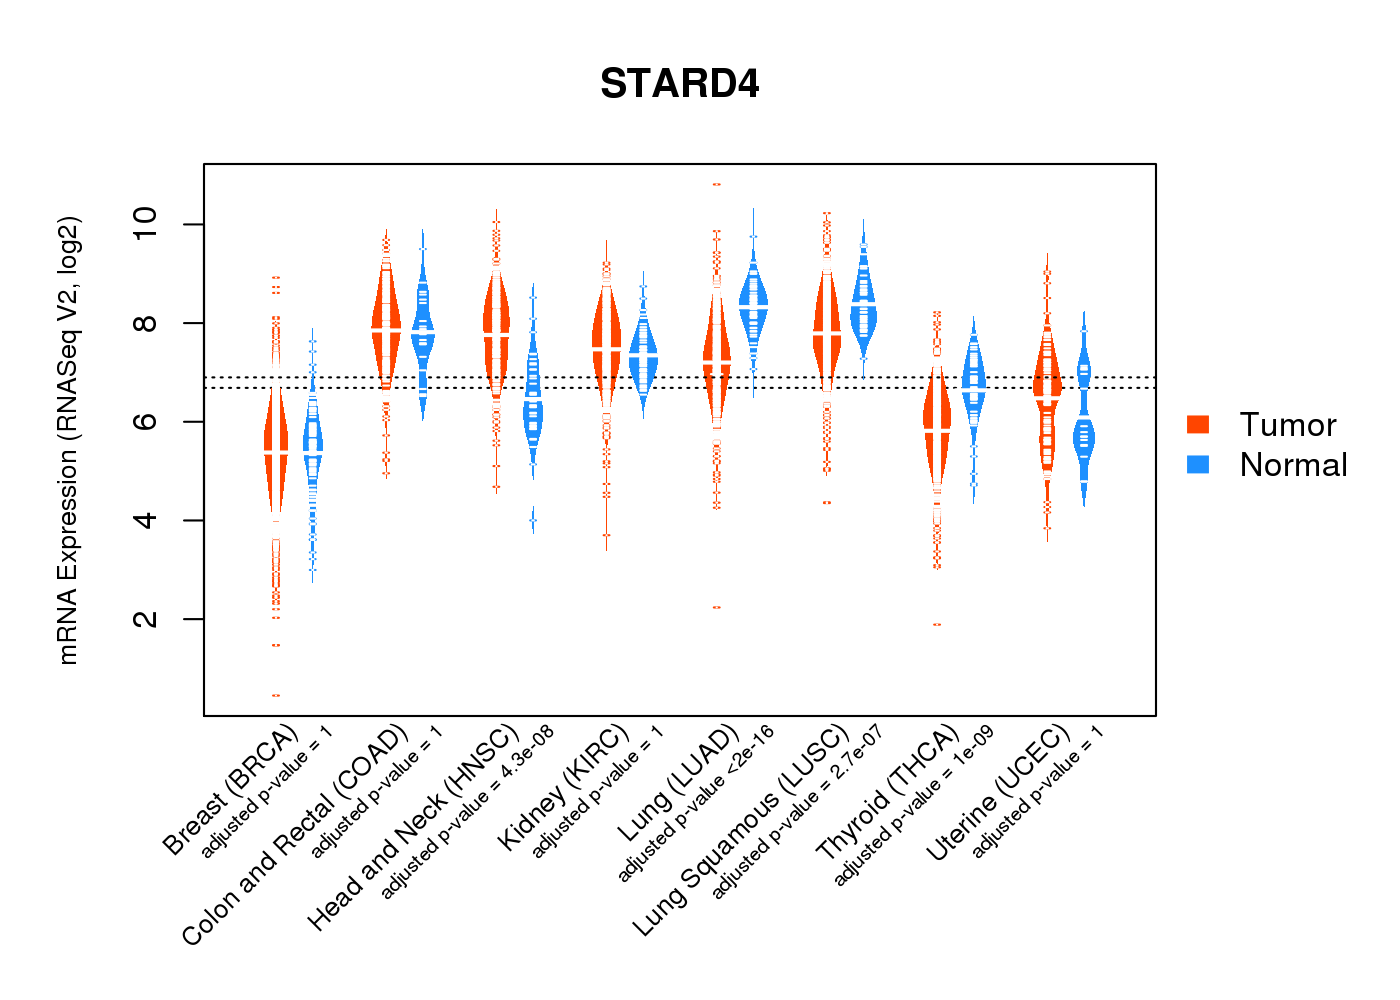 |
| Top |
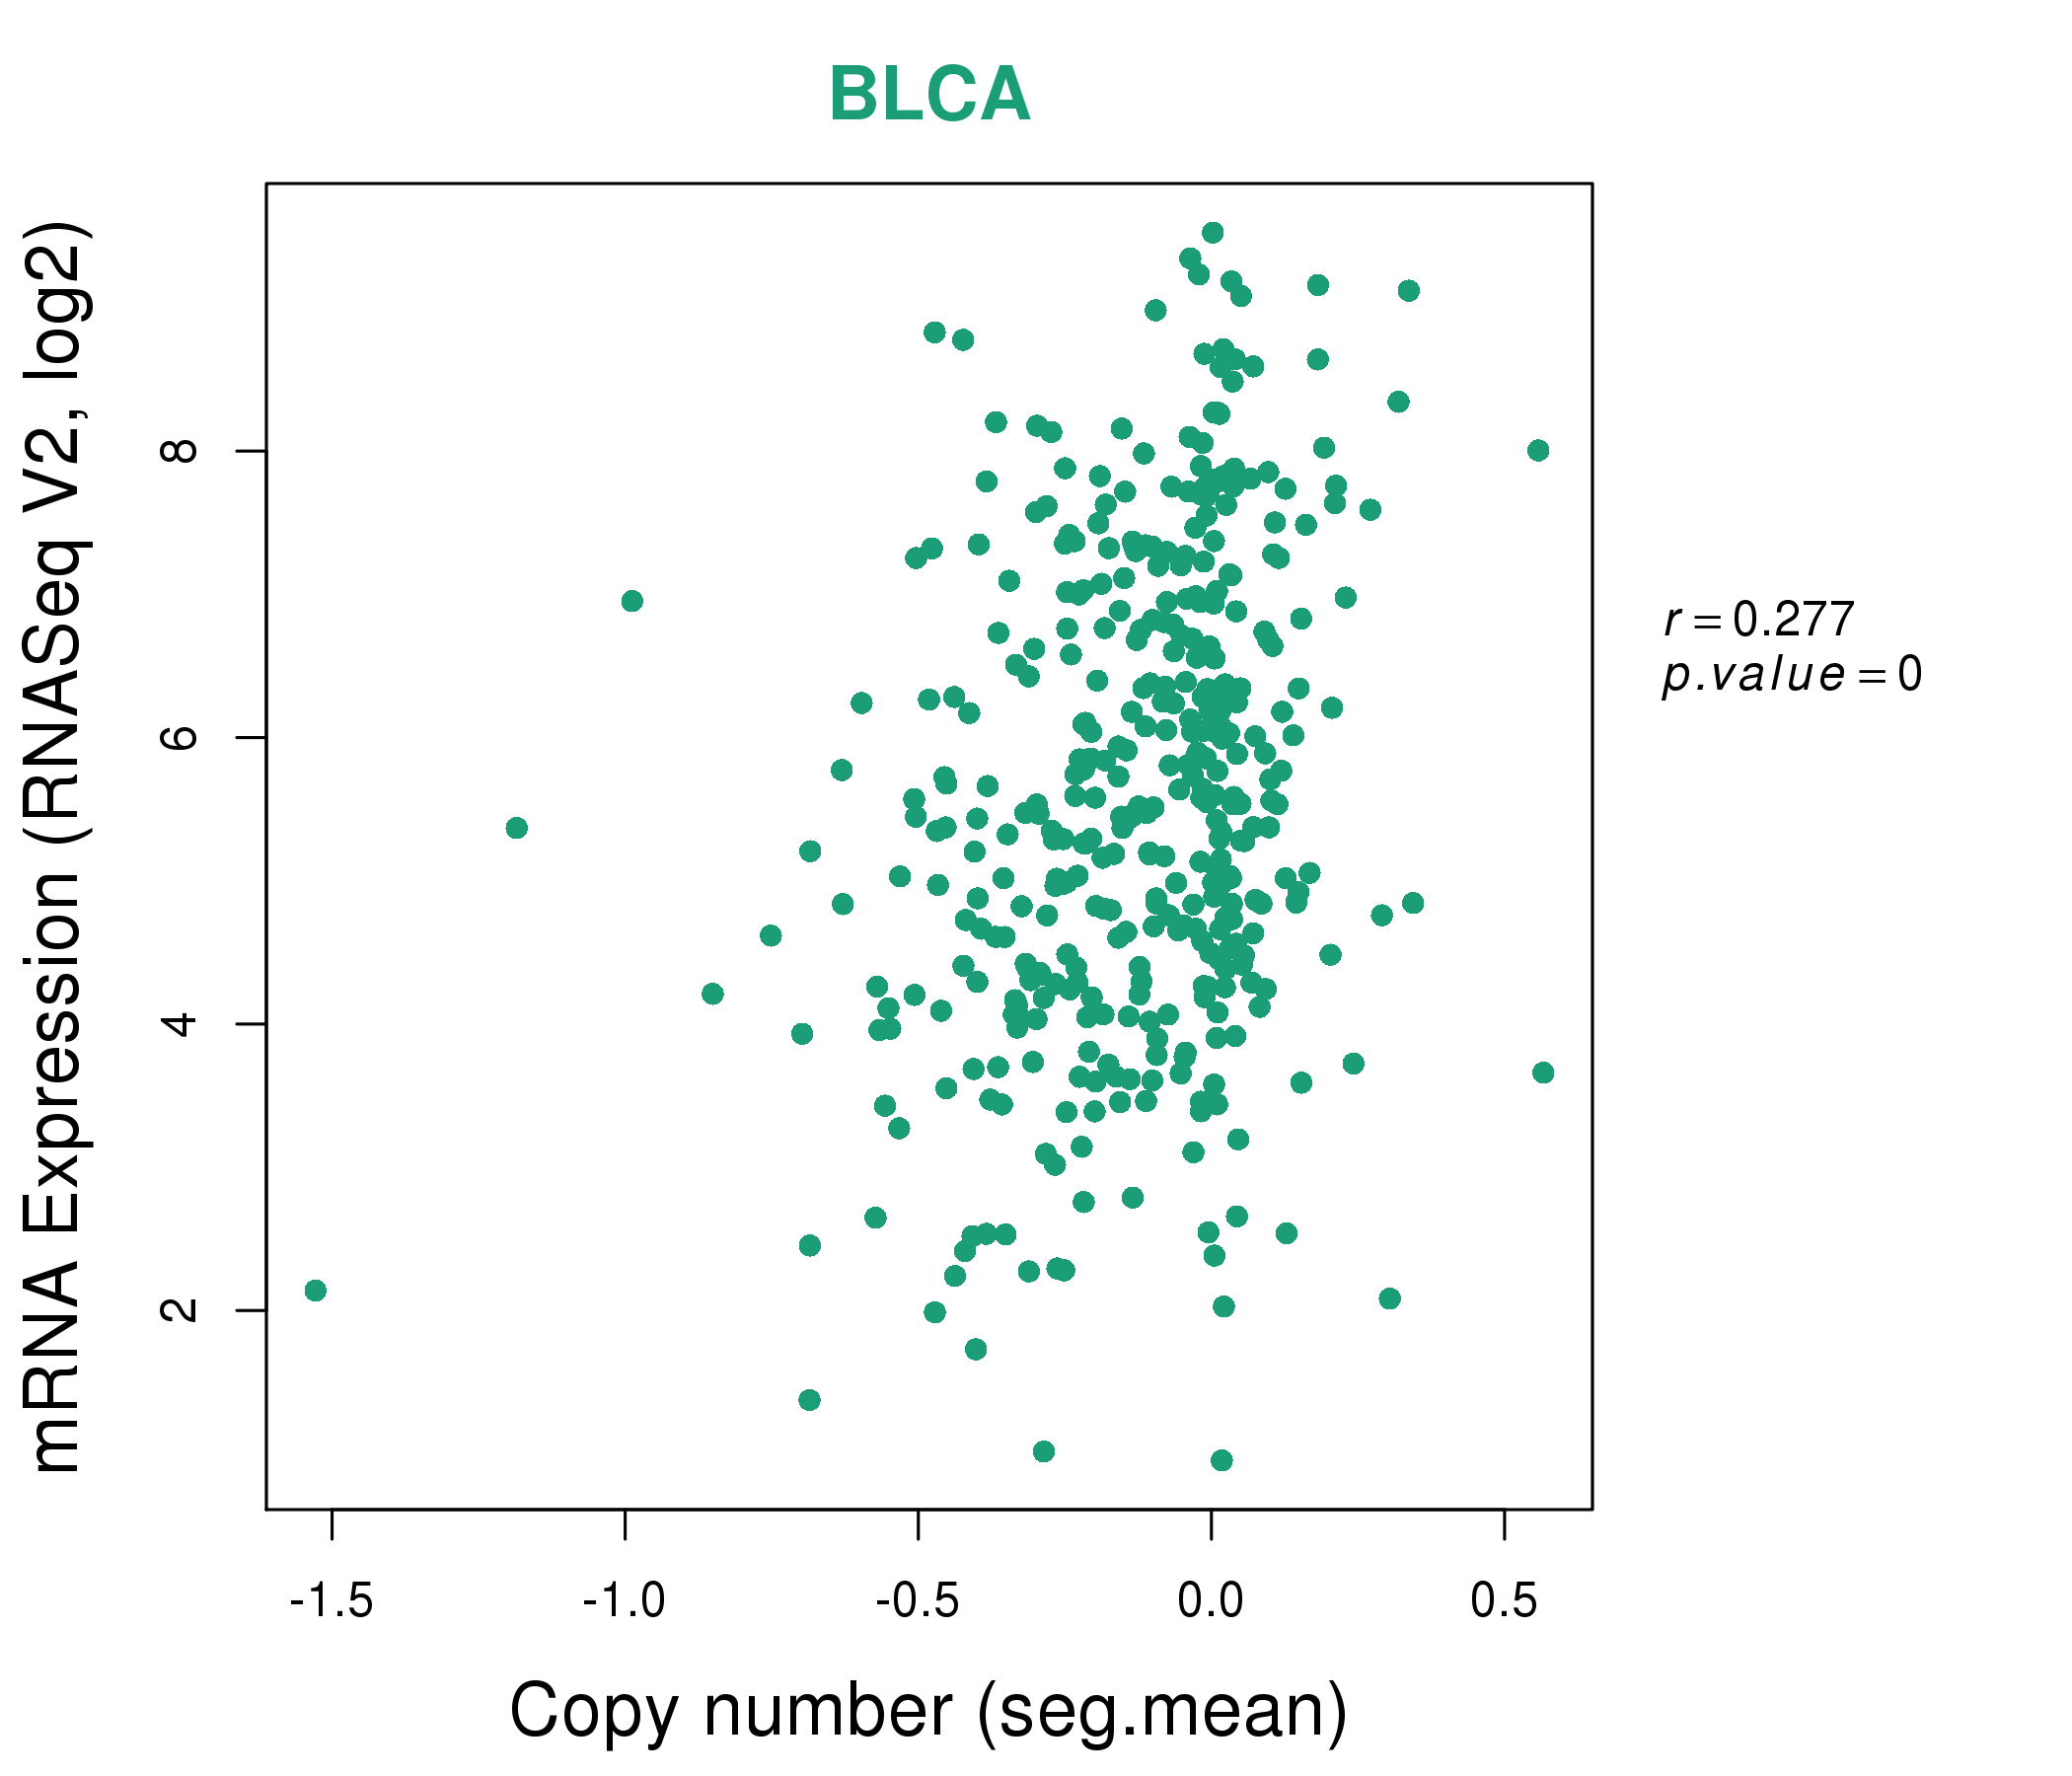
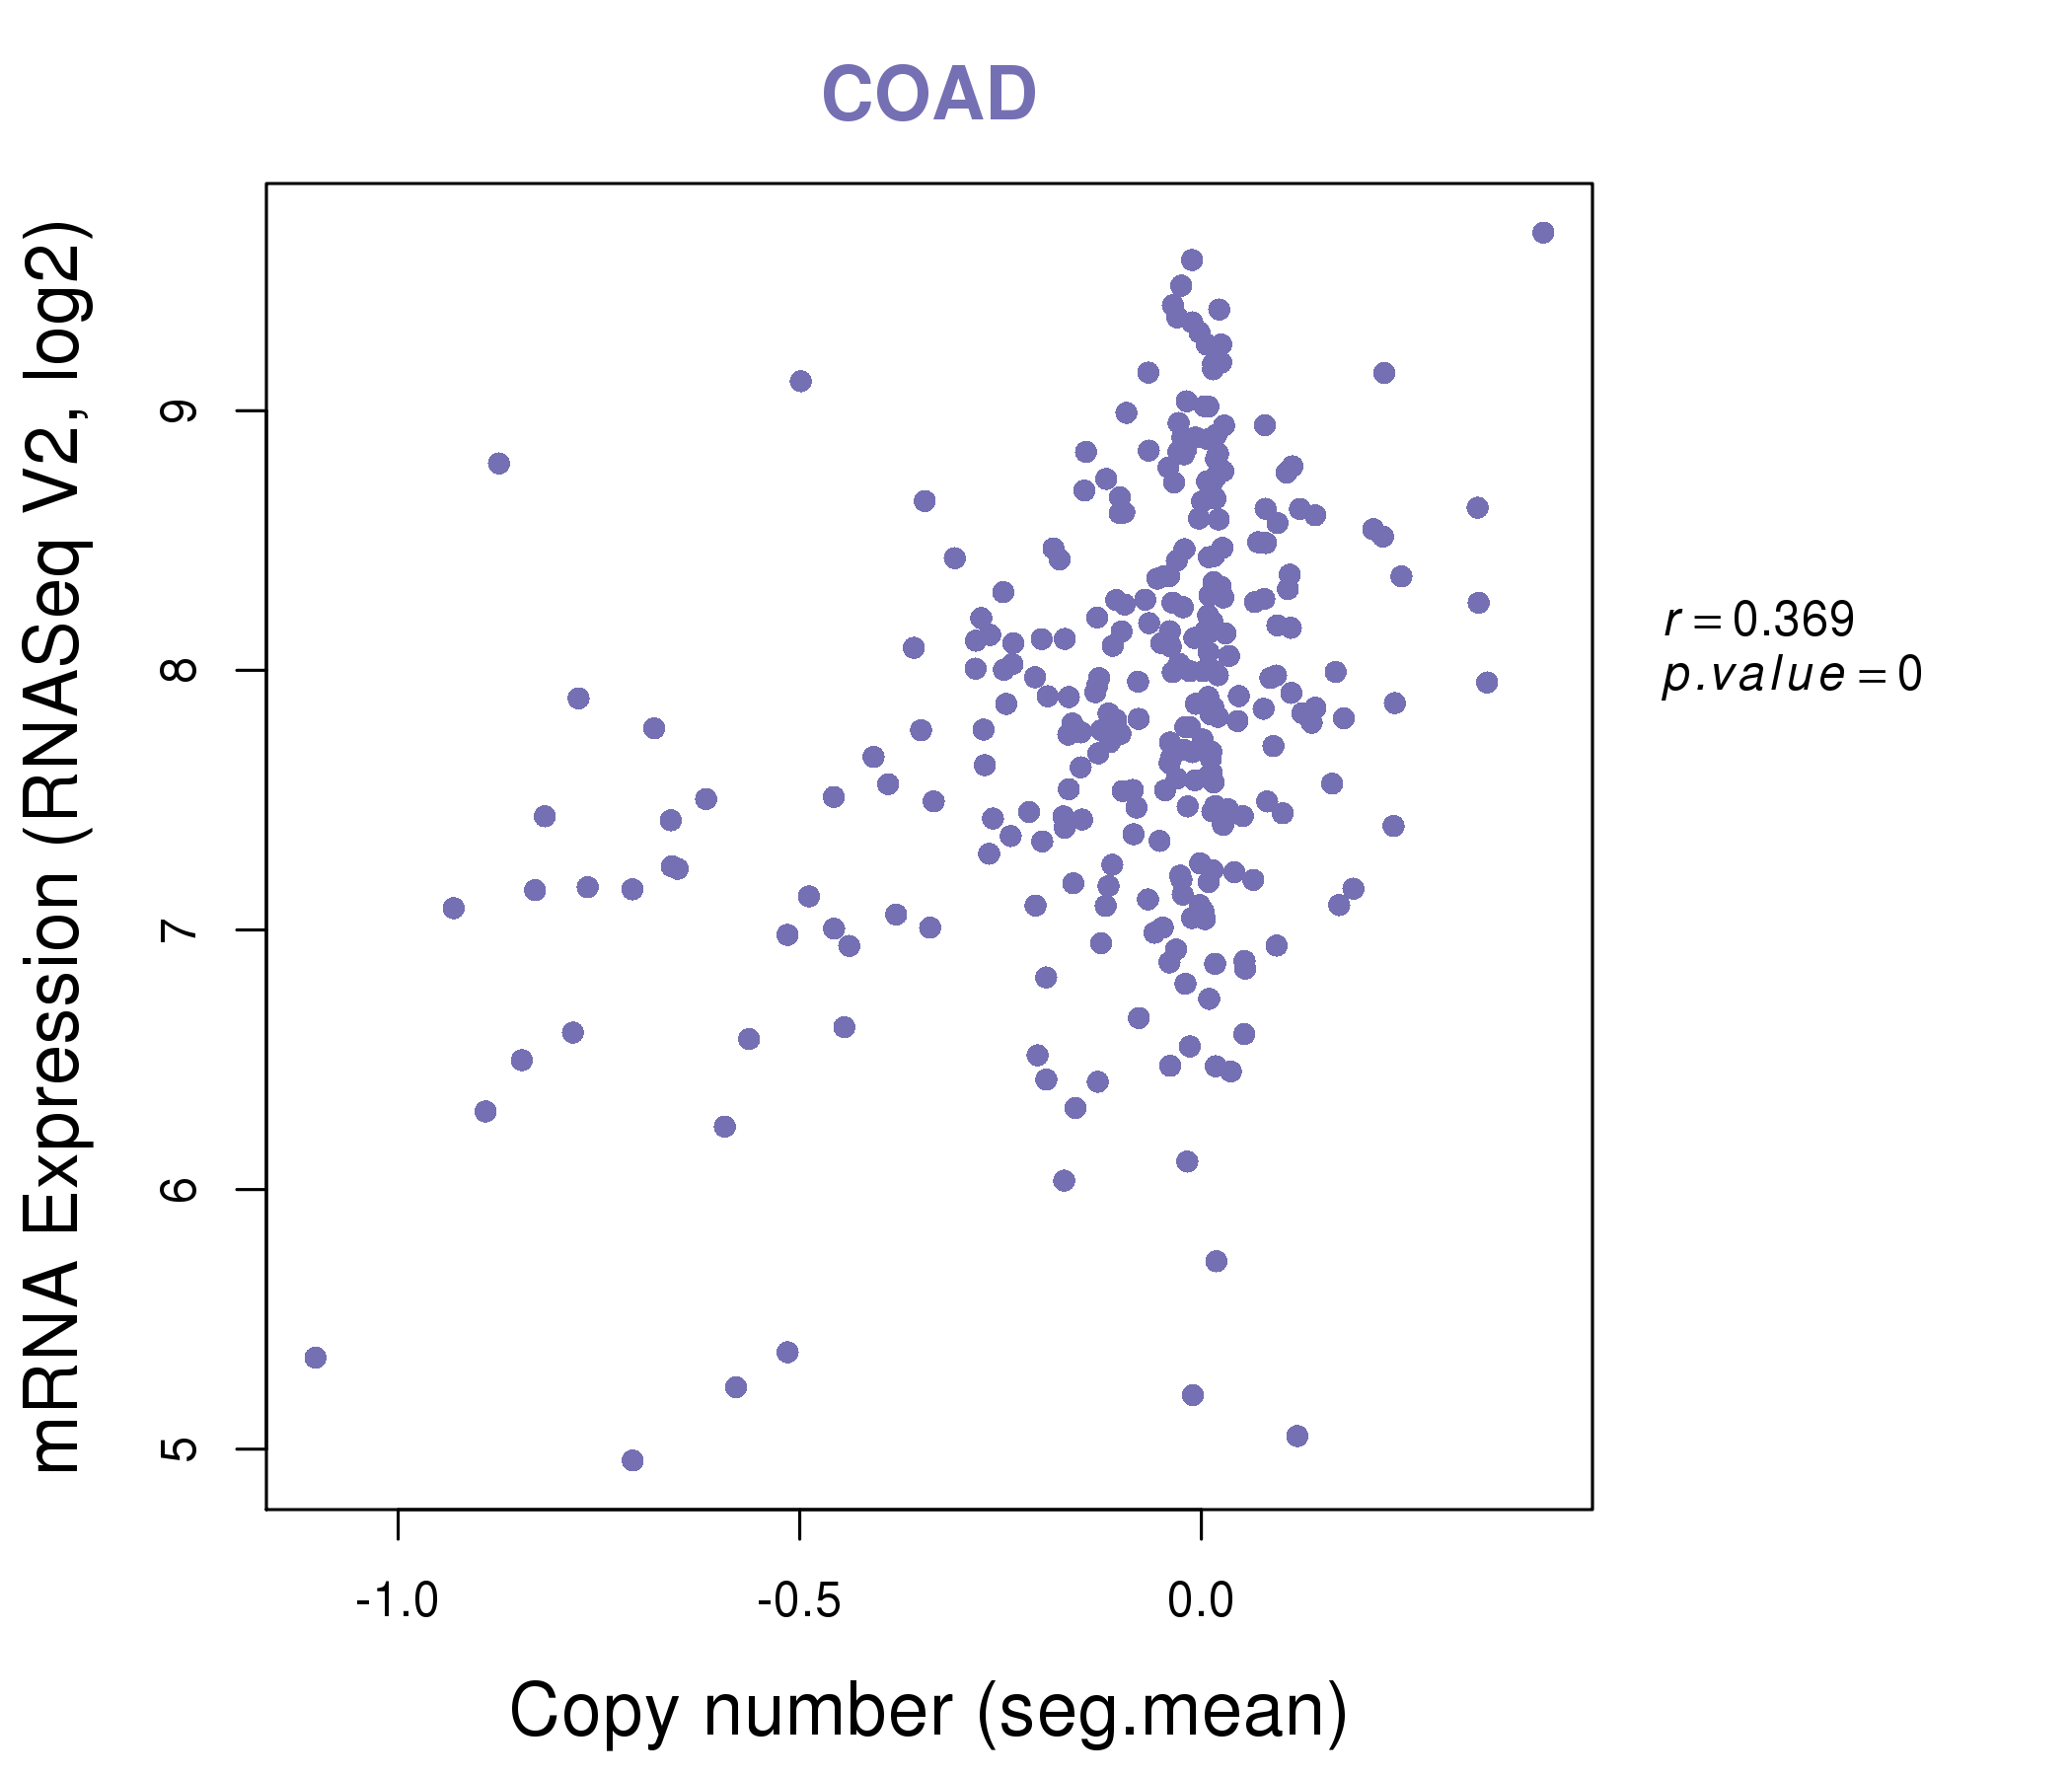
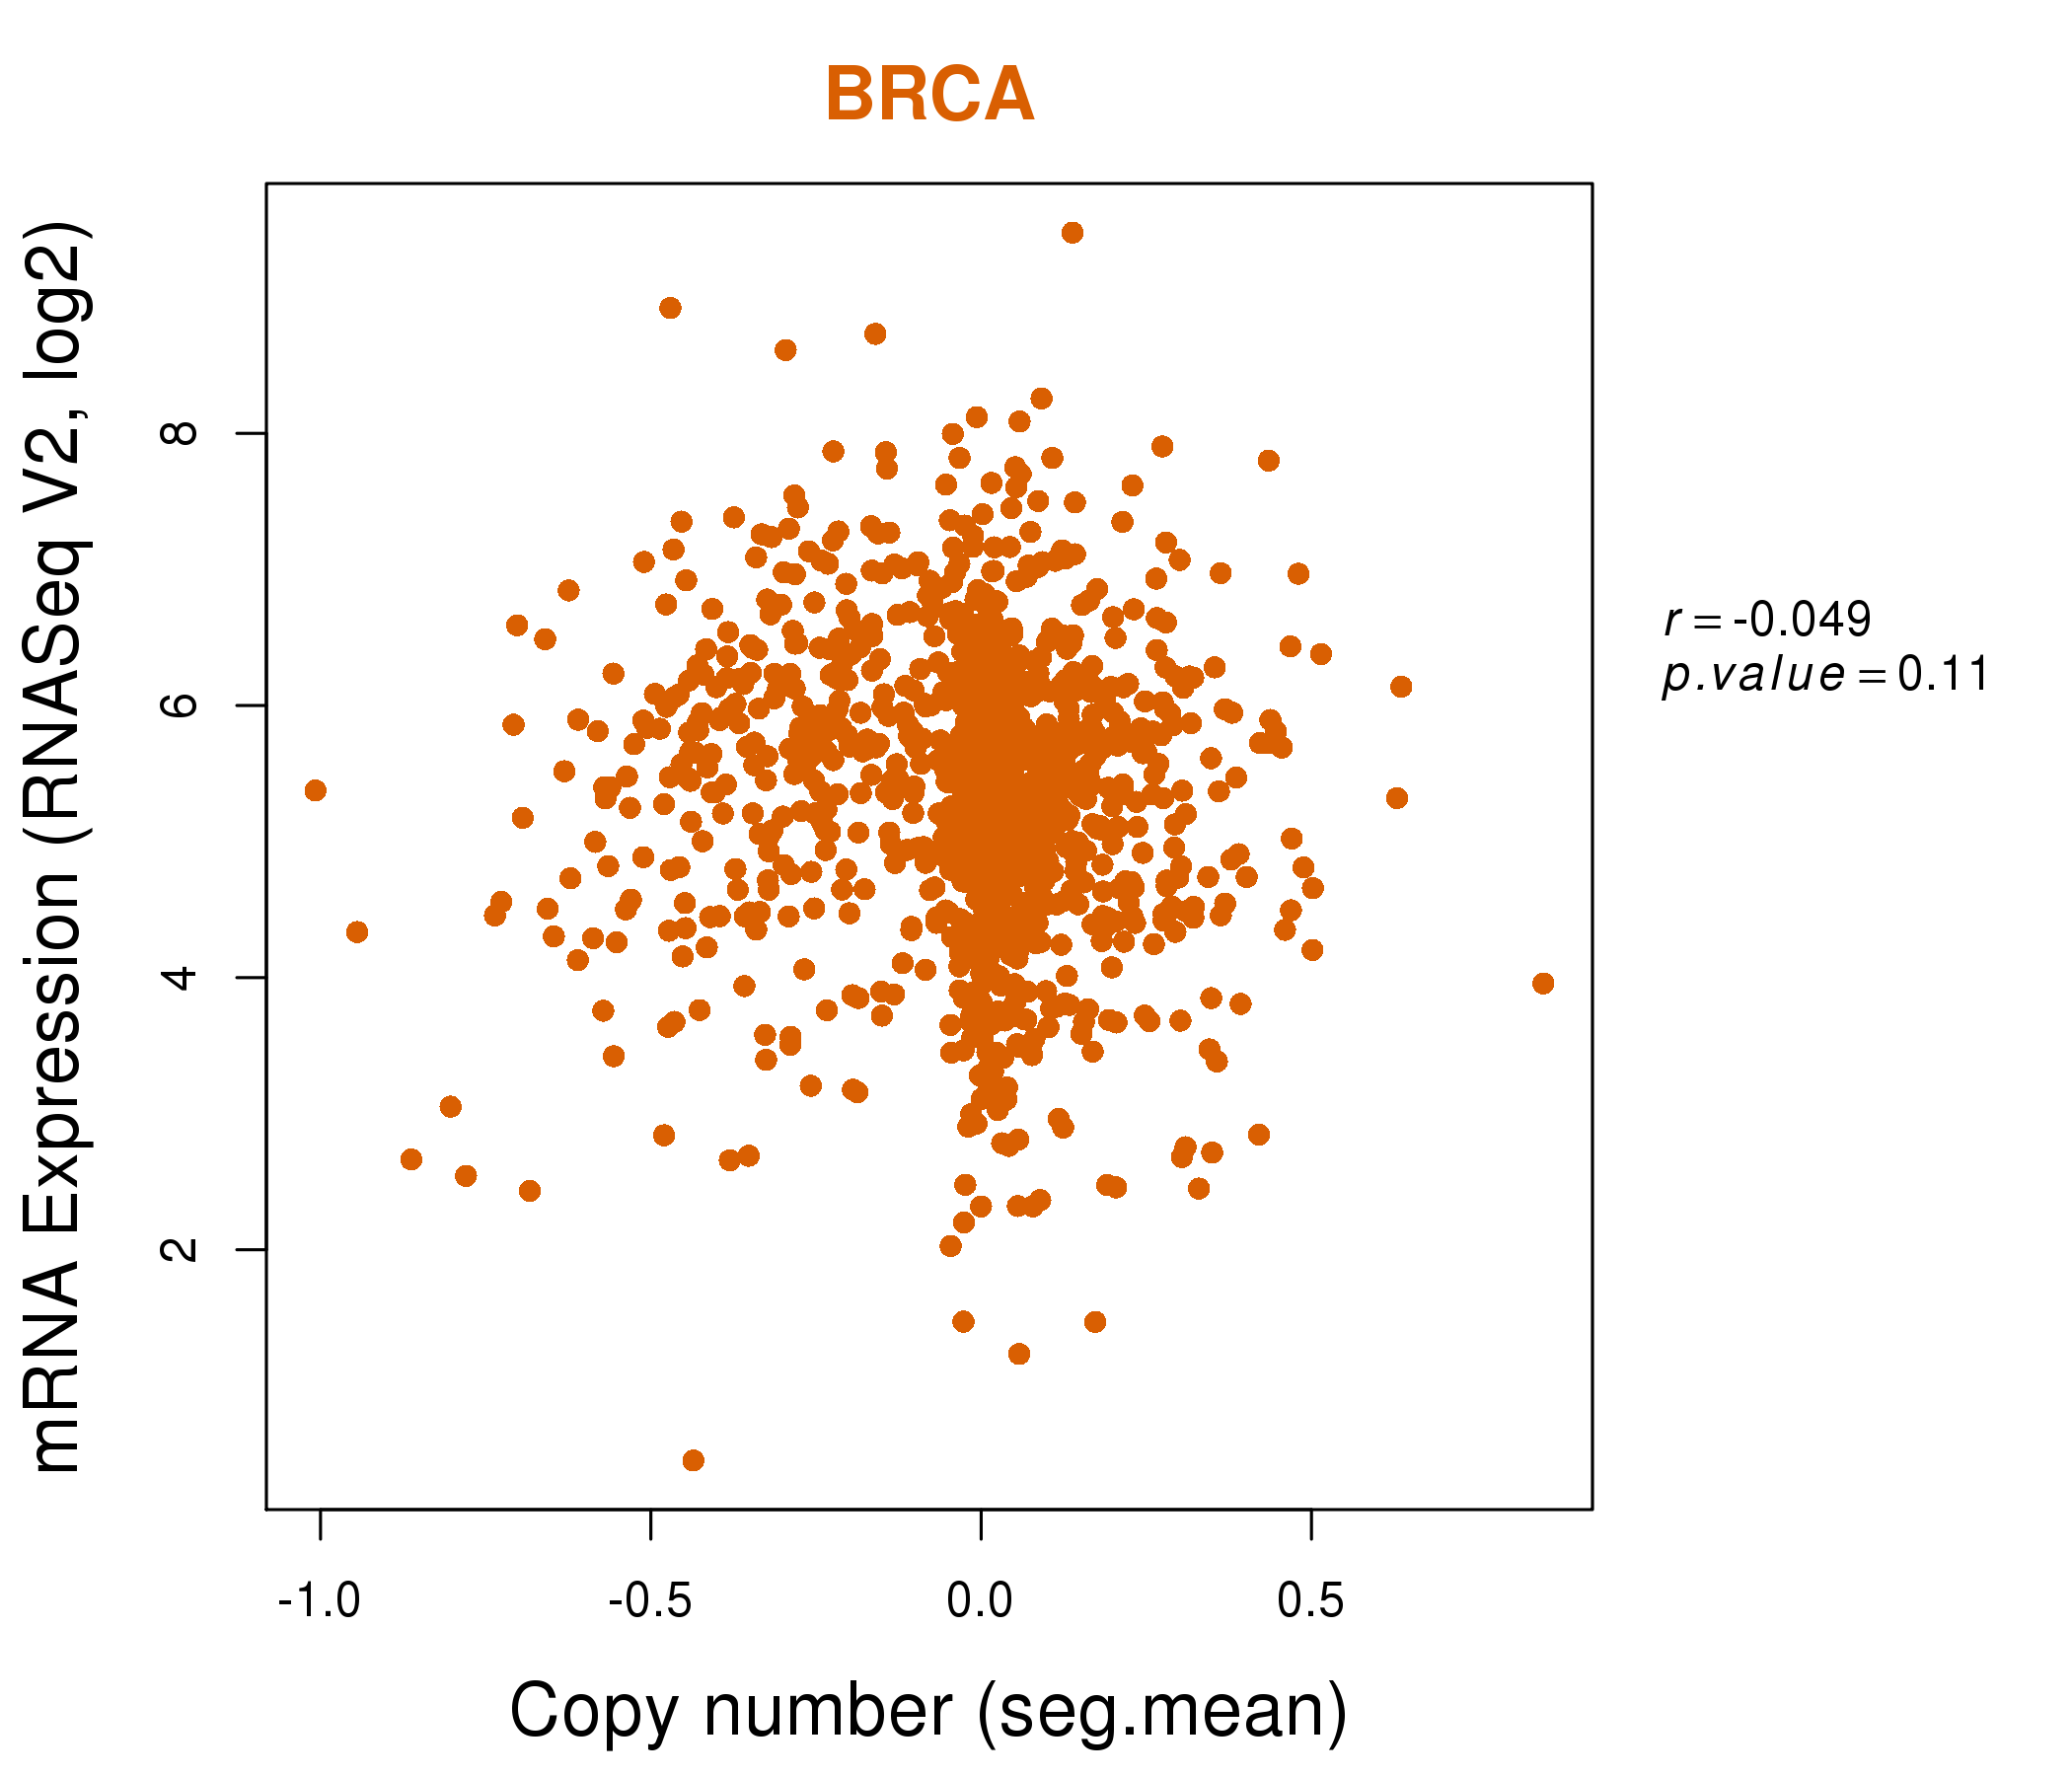
| * This plots show the correlation between CNV and gene expression. |
: Open all plots for all cancer types
 |
|
 |
|
| Top |
| Gene-Gene Network Information |
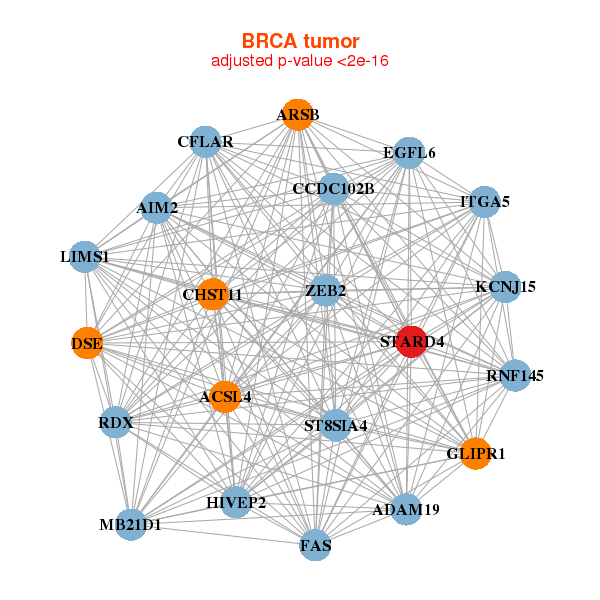
| * Co-Expression network figures were drawn using R package igraph. Only the top 20 genes with the highest correlations were shown. Red circle: input gene, orange circle: cell metabolism gene, sky circle: other gene |
: Open all plots for all cancer types
 |
|
| ACSL4,ADAM19,AIM2,ARSB,MB21D1,CCDC102B,CFLAR, CHST11,DSE,EGFL6,FAS,GLIPR1,HIVEP2,ITGA5, KCNJ15,LIMS1,RDX,RNF145,ST8SIA4,STARD4,ZEB2 | ABCC2,ABCC4,ADD3,C6orf223,CCDC15,HIF1A,HMGCR, HMGCS1,HPGD,KIAA1919,LONP2,PNLIPRP3,PPAPDC1A,SLC41A2, SLC5A11,ST6GAL1,STARD4,TARP,TLR7,UGT2B28,ZNF518B |
 |
|
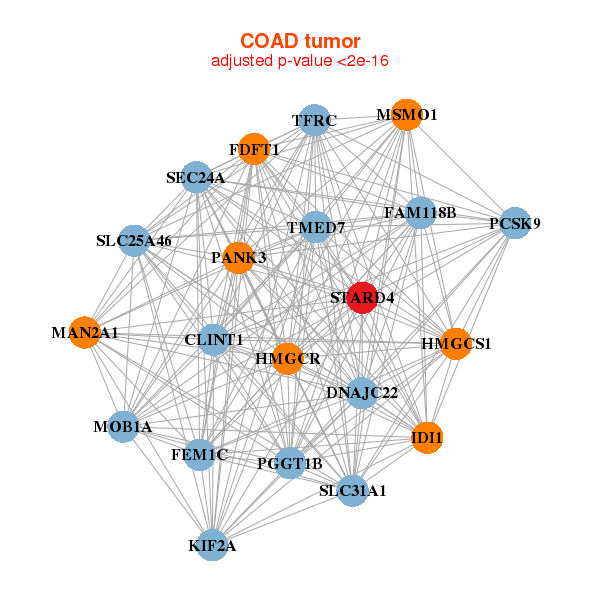
| CLINT1,DNAJC22,FAM118B,FDFT1,FEM1C,HMGCR,HMGCS1, IDI1,KIF2A,MAN2A1,MOB1A,PANK3,PCSK9,PGGT1B, MSMO1,SEC24A,SLC25A46,SLC31A1,STARD4,TFRC,TMED7 | BATF3,C6orf223,CCL2,FDPS,HSD17B7,IDI1,INSIG1, MMAB,MVK,NSDHL,PAQR9,PLA2G2A,PLA2G3,PPA1, RARRES1,RDH11,MSMO1,SC5D,STARD4,TEAD4,TMPRSS11F |
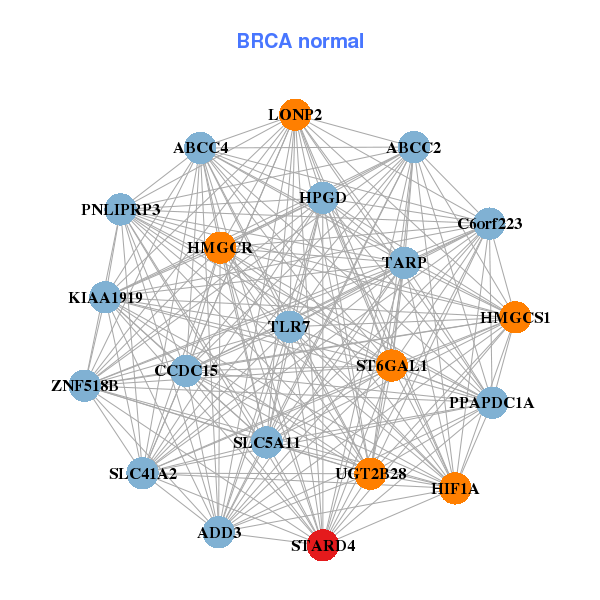
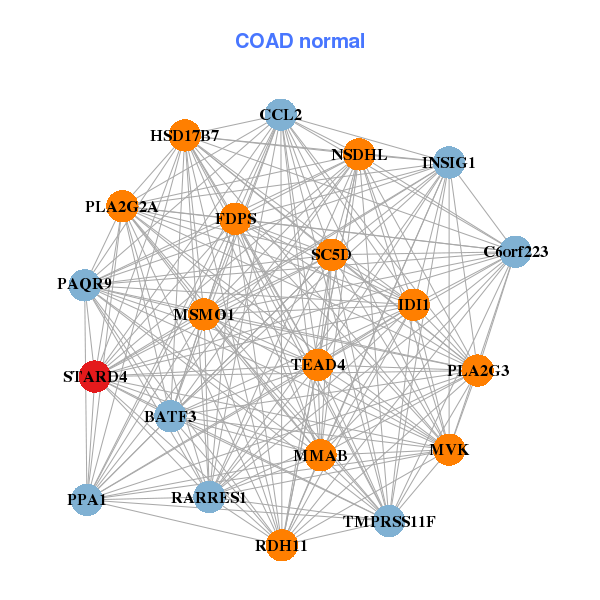
| * Co-Expression network figures were drawn using R package igraph. Only the top 20 genes with the highest correlations were shown. Red circle: input gene, orange circle: cell metabolism gene, sky circle: other gene |
: Open all plots for all cancer types
| Top |
: Open all interacting genes' information including KEGG pathway for all interacting genes from DAVID
| Top |
| Pharmacological Information for STARD4 |
| There's no related Drug. |
| Top |
| Cross referenced IDs for STARD4 |
| * We obtained these cross-references from Uniprot database. It covers 150 different DBs, 18 categories. http://www.uniprot.org/help/cross_references_section |
: Open all cross reference information
|
Copyright © 2016-Present - The Univsersity of Texas Health Science Center at Houston @ |