|
||||||||||||||||||||||||||||||||||||||||||||||||||||||||||||||||||||||||||||||||||||||||||||||||||||||||||||||||||||||||||||||||||||||||||||||||||||||||||||||||||||||||||||||||||||||||||||||||||||||||||||||||||||||||||||||||||||||||||||||||||||||||||||||||||||||||||||||||||||||||||||||||||||||||||||||||||||||||||
| |
| Phenotypic Information (metabolism pathway, cancer, disease, phenome) |
| |
| |
| Gene-Gene Network Information: Co-Expression Network, Interacting Genes & KEGG |
| |
|


| Gene Summary for B3GAT2 |
| Basic gene info. | Gene symbol | B3GAT2 |
| Gene name | beta-1,3-glucuronyltransferase 2 | |
| Synonyms | GLCATS | |
| Cytomap | UCSC genome browser: 6q13 | |
| Genomic location | chr6 :71571068-71666788 | |
| Type of gene | protein-coding | |
| RefGenes | NM_080742.2, | |
| Ensembl id | ENSG00000112309 | |
| Description | UDP-glucuronosyltransferase SUDP-glucuronyltransferase Sgalactosylgalactosylxylosylprotein 3-beta-glucuronosyltransferase 2glcAT-Dglucuronosyltransferase Suridine diphosphate glucuronic acid:acceptor glucuronosyltransferase | |
| Modification date | 20141207 | |
| dbXrefs | MIM : 607497 | |
| HGNC : HGNC | ||
| HPRD : 06325 | ||
| Protein | UniProt: go to UniProt's Cross Reference DB Table | |
| Expression | CleanEX: HS_B3GAT2 | |
| BioGPS: 135152 | ||
| Gene Expression Atlas: ENSG00000112309 | ||
| The Human Protein Atlas: ENSG00000112309 | ||
| Pathway | NCI Pathway Interaction Database: B3GAT2 | |
| KEGG: B3GAT2 | ||
| REACTOME: B3GAT2 | ||
| ConsensusPathDB | ||
| Pathway Commons: B3GAT2 | ||
| Metabolism | MetaCyc: B3GAT2 | |
| HUMANCyc: B3GAT2 | ||
| Regulation | Ensembl's Regulation: ENSG00000112309 | |
| miRBase: chr6 :71,571,068-71,666,788 | ||
| TargetScan: NM_080742 | ||
| cisRED: ENSG00000112309 | ||
| Context | iHOP: B3GAT2 | |
| cancer metabolism search in PubMed: B3GAT2 | ||
| UCL Cancer Institute: B3GAT2 | ||
| Assigned class in ccmGDB | C | |
| Top |
| Phenotypic Information for B3GAT2(metabolism pathway, cancer, disease, phenome) |
| Cancer | CGAP: B3GAT2 |
| Familial Cancer Database: B3GAT2 | |
| * This gene is included in those cancer gene databases. |
|
|
|
|
|
|
| ||||||||||||||||||||||||||||||||||||||||||||||||||||||||||||||||||||||||||||||||||||||||||||||||||||||||||||||||||||||||||||||||||||||||||||||||||||||||||||||||||||||||||||||||||||||||||||||||||||||||||||||||||||||||||||||||||||||||||||||||||||||||||||||||||||||||||||||||||||||||||||||||||||||||||||||||||||
Oncogene 1 | Significant driver gene in | |||||||||||||||||||||||||||||||||||||||||||||||||||||||||||||||||||||||||||||||||||||||||||||||||||||||||||||||||||||||||||||||||||||||||||||||||||||||||||||||||||||||||||||||||||||||||||||||||||||||||||||||||||||||||||||||||||||||||||||||||||||||||||||||||||||||||||||||||||||||||||||||||||||||||||||||||||||||||
| cf) number; DB name 1 Oncogene; http://nar.oxfordjournals.org/content/35/suppl_1/D721.long, 2 Tumor Suppressor gene; https://bioinfo.uth.edu/TSGene/, 3 Cancer Gene Census; http://www.nature.com/nrc/journal/v4/n3/abs/nrc1299.html, 4 CancerGenes; http://nar.oxfordjournals.org/content/35/suppl_1/D721.long, 5 Network of Cancer Gene; http://ncg.kcl.ac.uk/index.php, 1Therapeutic Vulnerabilities in Cancer; http://cbio.mskcc.org/cancergenomics/statius/ |
| REACTOME_METABOLISM_OF_CARBOHYDRATES | |
| OMIM | |
| Orphanet | |
| Disease | KEGG Disease: B3GAT2 |
| MedGen: B3GAT2 (Human Medical Genetics with Condition) | |
| ClinVar: B3GAT2 | |
| Phenotype | MGI: B3GAT2 (International Mouse Phenotyping Consortium) |
| PhenomicDB: B3GAT2 | |
| Mutations for B3GAT2 |
| * Under tables are showing count per each tissue to give us broad intuition about tissue specific mutation patterns.You can go to the detailed page for each mutation database's web site. |
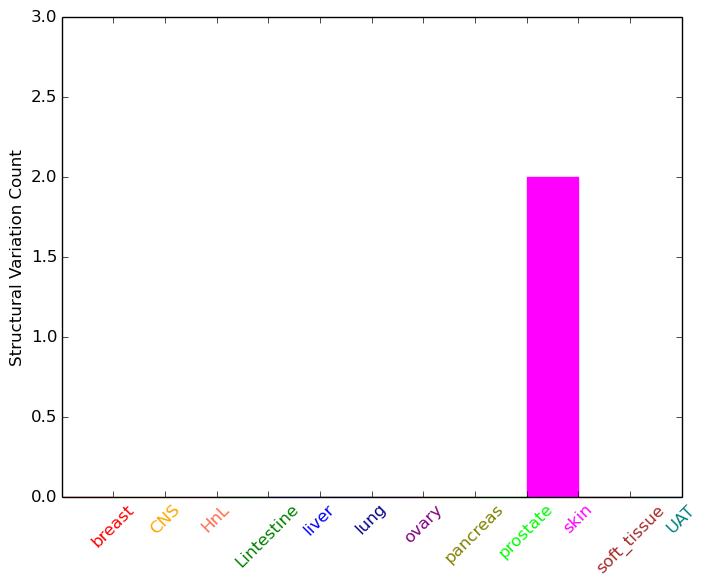
| - Statistics for Tissue and Mutation type | Top |
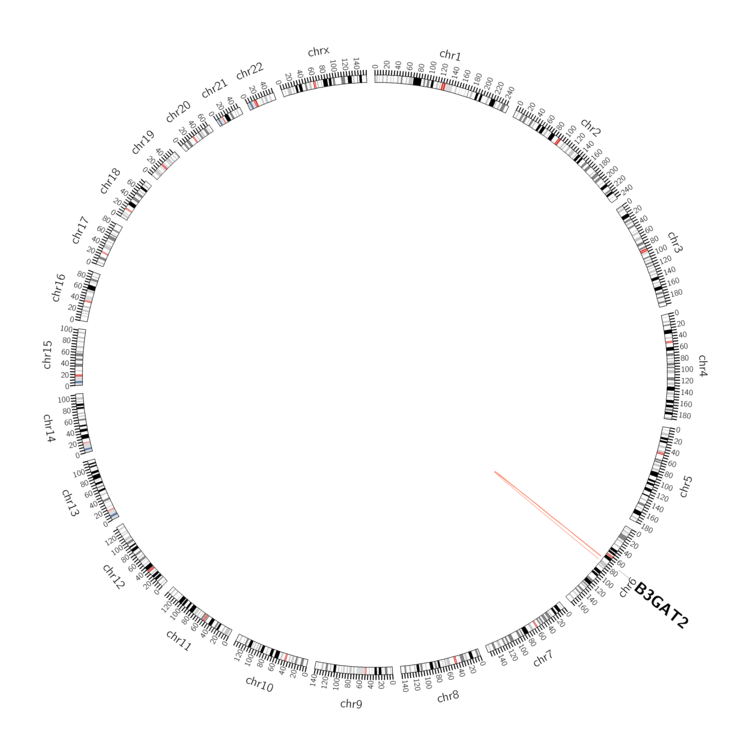 |
| - For Inter-chromosomal Variations |
| There's no inter-chromosomal structural variation. |
| - For Intra-chromosomal Variations |
| * Intra-chromosomal variantions includes 'intrachromosomal amplicon to amplicon', 'intrachromosomal amplicon to non-amplified dna', 'intrachromosomal deletion', 'intrachromosomal fold-back inversion', 'intrachromosomal inversion', 'intrachromosomal tandem duplication', 'Intrachromosomal unknown type', 'intrachromosomal with inverted orientation', 'intrachromosomal with non-inverted orientation'. |
 |
| Sample | Symbol_a | Chr_a | Start_a | End_a | Symbol_b | Chr_b | Start_b | End_b |
| skin | B3GAT2 | chr6 | 71593671 | 71593671 | chr6 | 72403200 | 72403200 | |
| skin | B3GAT2 | chr6 | 71598378 | 71598378 | chr6 | 79050534 | 79050534 |
| cf) Tissue number; Tissue name (1;Breast, 2;Central_nervous_system, 3;Haematopoietic_and_lymphoid_tissue, 4;Large_intestine, 5;Liver, 6;Lung, 7;Ovary, 8;Pancreas, 9;Prostate, 10;Skin, 11;Soft_tissue, 12;Upper_aerodigestive_tract) |
| * From mRNA Sanger sequences, Chitars2.0 arranged chimeric transcripts. This table shows B3GAT2 related fusion information. |
| ID | Head Gene | Tail Gene | Accession | Gene_a | qStart_a | qEnd_a | Chromosome_a | tStart_a | tEnd_a | Gene_a | qStart_a | qEnd_a | Chromosome_a | tStart_a | tEnd_a |
| DR002957 | B3GAT2 | 3 | 232 | 6 | 71666019 | 71666248 | SMAP1 | 226 | 553 | 6 | 71571544 | 71665584 | |
| Top |
| Mutation type/ Tissue ID | brca | cns | cerv | endome | haematopo | kidn | Lintest | liver | lung | ns | ovary | pancre | prost | skin | stoma | thyro | urina | |||
| Total # sample | 2 | 1 | ||||||||||||||||||
| GAIN (# sample) | 2 | 1 | ||||||||||||||||||
| LOSS (# sample) |
| cf) Tissue ID; Tissue type (1; Breast, 2; Central_nervous_system, 3; Cervix, 4; Endometrium, 5; Haematopoietic_and_lymphoid_tissue, 6; Kidney, 7; Large_intestine, 8; Liver, 9; Lung, 10; NS, 11; Ovary, 12; Pancreas, 13; Prostate, 14; Skin, 15; Stomach, 16; Thyroid, 17; Urinary_tract) |
| Top |
|
 |
| Top |
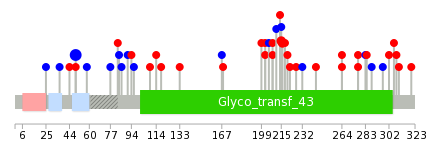
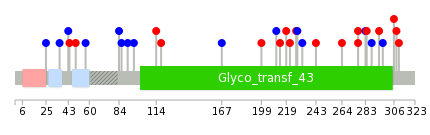
| Stat. for Non-Synonymous SNVs (# total SNVs=24) | (# total SNVs=17) |
 |  |
(# total SNVs=0) | (# total SNVs=0) |
| Top |
| * When you move the cursor on each content, you can see more deailed mutation information on the Tooltip. Those are primary_site,primary_histology,mutation(aa),pubmedID. |
| GRCh37 position | Mutation(aa) | Unique sampleID count |
| chr6:71665986-71665986 | p.G49G | 7 |
| chr6:71603924-71603924 | p.R215R | 3 |
| chr6:71603921-71603921 | p.R216C | 2 |
| chr6:71665632-71665632 | p.L167L | 1 |
| chr6:71571589-71571589 | p.L277V | 1 |
| chr6:71665902-71665902 | p.P77P | 1 |
| chr6:71571379-71571379 | p.K320I | 1 |
| chr6:71665735-71665735 | p.A133D | 1 |
| chr6:71571616-71571616 | p.Q268* | 1 |
| chr6:71665959-71665959 | p.G58G | 1 |
| Top |
|
 |
| Point Mutation/ Tissue ID | 1 | 2 | 3 | 4 | 5 | 6 | 7 | 8 | 9 | 10 | 11 | 12 | 13 | 14 | 15 | 16 | 17 | 18 | 19 | 20 |
| # sample | 3 | 1 | 4 | 2 | 6 | 2 | 2 | 2 | 6 | 4 | ||||||||||
| # mutation | 3 | 1 | 5 | 2 | 6 | 2 | 2 | 2 | 6 | 4 | ||||||||||
| nonsynonymous SNV | 2 | 1 | 1 | 1 | 4 | 2 | 1 | 2 | 3 | 1 | ||||||||||
| synonymous SNV | 1 | 4 | 1 | 2 | 1 | 3 | 3 |
| cf) Tissue ID; Tissue type (1; BLCA[Bladder Urothelial Carcinoma], 2; BRCA[Breast invasive carcinoma], 3; CESC[Cervical squamous cell carcinoma and endocervical adenocarcinoma], 4; COAD[Colon adenocarcinoma], 5; GBM[Glioblastoma multiforme], 6; Glioma Low Grade, 7; HNSC[Head and Neck squamous cell carcinoma], 8; KICH[Kidney Chromophobe], 9; KIRC[Kidney renal clear cell carcinoma], 10; KIRP[Kidney renal papillary cell carcinoma], 11; LAML[Acute Myeloid Leukemia], 12; LUAD[Lung adenocarcinoma], 13; LUSC[Lung squamous cell carcinoma], 14; OV[Ovarian serous cystadenocarcinoma ], 15; PAAD[Pancreatic adenocarcinoma], 16; PRAD[Prostate adenocarcinoma], 17; SKCM[Skin Cutaneous Melanoma], 18:STAD[Stomach adenocarcinoma], 19:THCA[Thyroid carcinoma], 20:UCEC[Uterine Corpus Endometrial Carcinoma]) |
| Top |
| * We represented just top 10 SNVs. When you move the cursor on each content, you can see more deailed mutation information on the Tooltip. Those are primary_site, primary_histology, mutation(aa), pubmedID. |
| Genomic Position | Mutation(aa) | Unique sampleID count |
| chr6:71665632 | p.V227L | 1 |
| chr6:71666025 | p.Y43Y | 1 |
| chr6:71571627 | p.V222A | 1 |
| chr6:71665781 | p.P36P | 1 |
| chr6:71571408 | p.N310K | 1 |
| chr6:71666058 | p.R219H | 1 |
| chr6:71603840 | p.V25V | 1 |
| chr6:71665793 | p.L308I | 1 |
| chr6:71571416 | p.G214V | 1 |
| chr6:71603871 | p.V306I | 1 |
| * Copy number data were extracted from TCGA using R package TCGA-Assembler. The URLs of all public data files on TCGA DCC data server were gathered on Jan-05-2015. Function ProcessCNAData in TCGA-Assembler package was used to obtain gene-level copy number value which is calculated as the average copy number of the genomic region of a gene. |
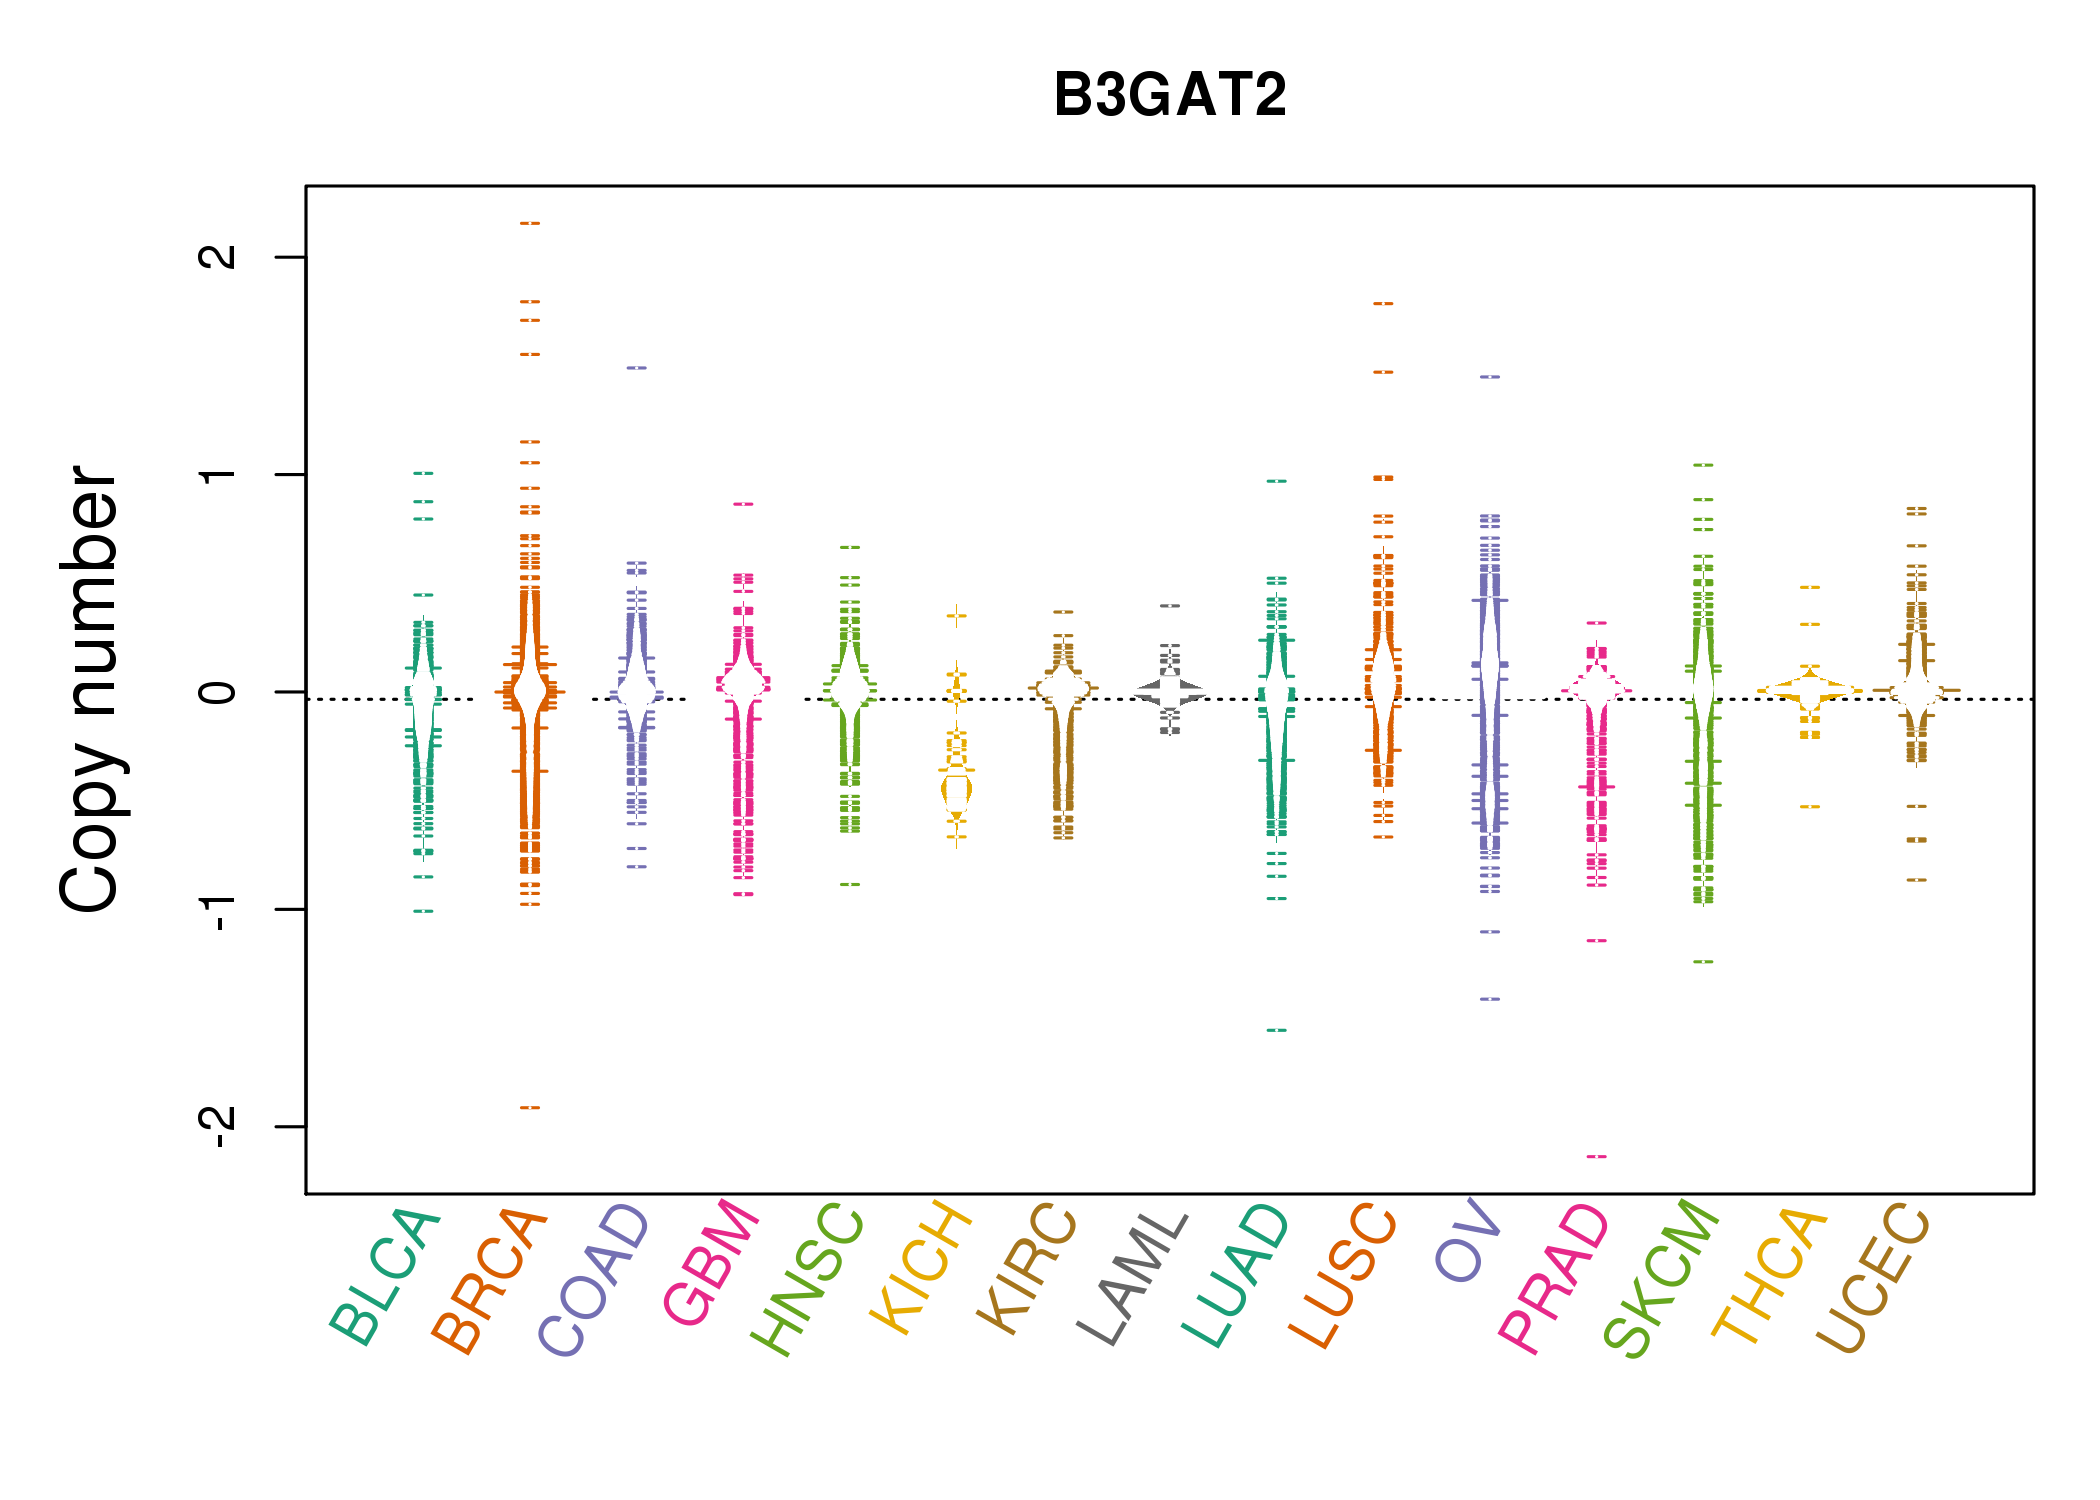 |
| cf) Tissue ID[Tissue type]: BLCA[Bladder Urothelial Carcinoma], BRCA[Breast invasive carcinoma], CESC[Cervical squamous cell carcinoma and endocervical adenocarcinoma], COAD[Colon adenocarcinoma], GBM[Glioblastoma multiforme], Glioma Low Grade, HNSC[Head and Neck squamous cell carcinoma], KICH[Kidney Chromophobe], KIRC[Kidney renal clear cell carcinoma], KIRP[Kidney renal papillary cell carcinoma], LAML[Acute Myeloid Leukemia], LUAD[Lung adenocarcinoma], LUSC[Lung squamous cell carcinoma], OV[Ovarian serous cystadenocarcinoma ], PAAD[Pancreatic adenocarcinoma], PRAD[Prostate adenocarcinoma], SKCM[Skin Cutaneous Melanoma], STAD[Stomach adenocarcinoma], THCA[Thyroid carcinoma], UCEC[Uterine Corpus Endometrial Carcinoma] |
| Top |
| Gene Expression for B3GAT2 |
| * CCLE gene expression data were extracted from CCLE_Expression_Entrez_2012-10-18.res: Gene-centric RMA-normalized mRNA expression data. |
 |
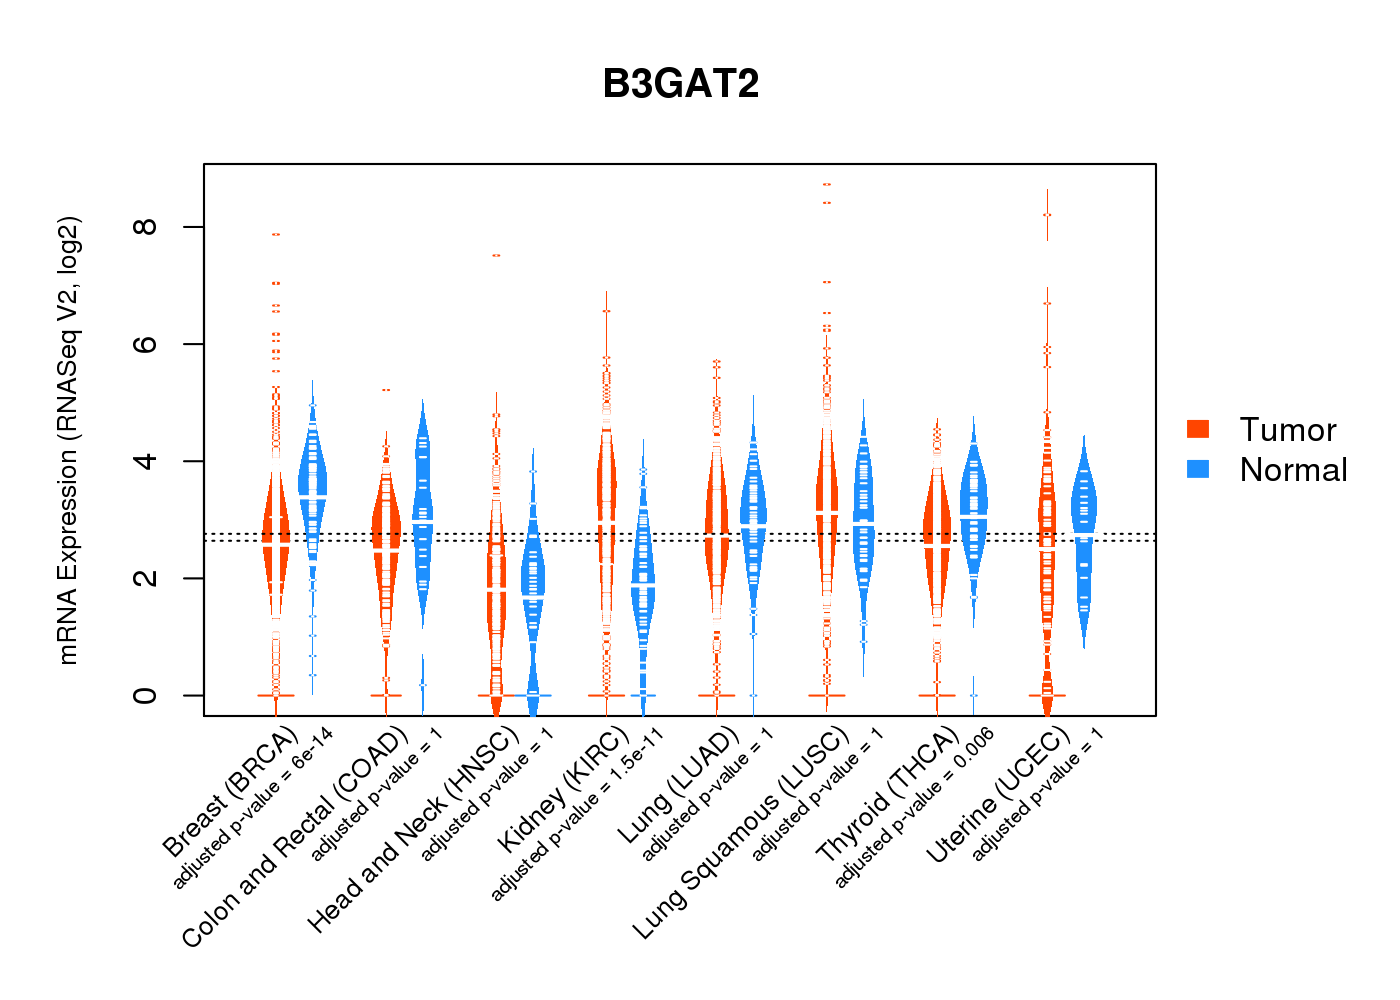
| * Normalized gene expression data of RNASeqV2 was extracted from TCGA using R package TCGA-Assembler. The URLs of all public data files on TCGA DCC data server were gathered at Jan-05-2015. Only eight cancer types have enough normal control samples for differential expression analysis. (t test, adjusted p<0.05 (using Benjamini-Hochberg FDR)) |
 |
| Top |
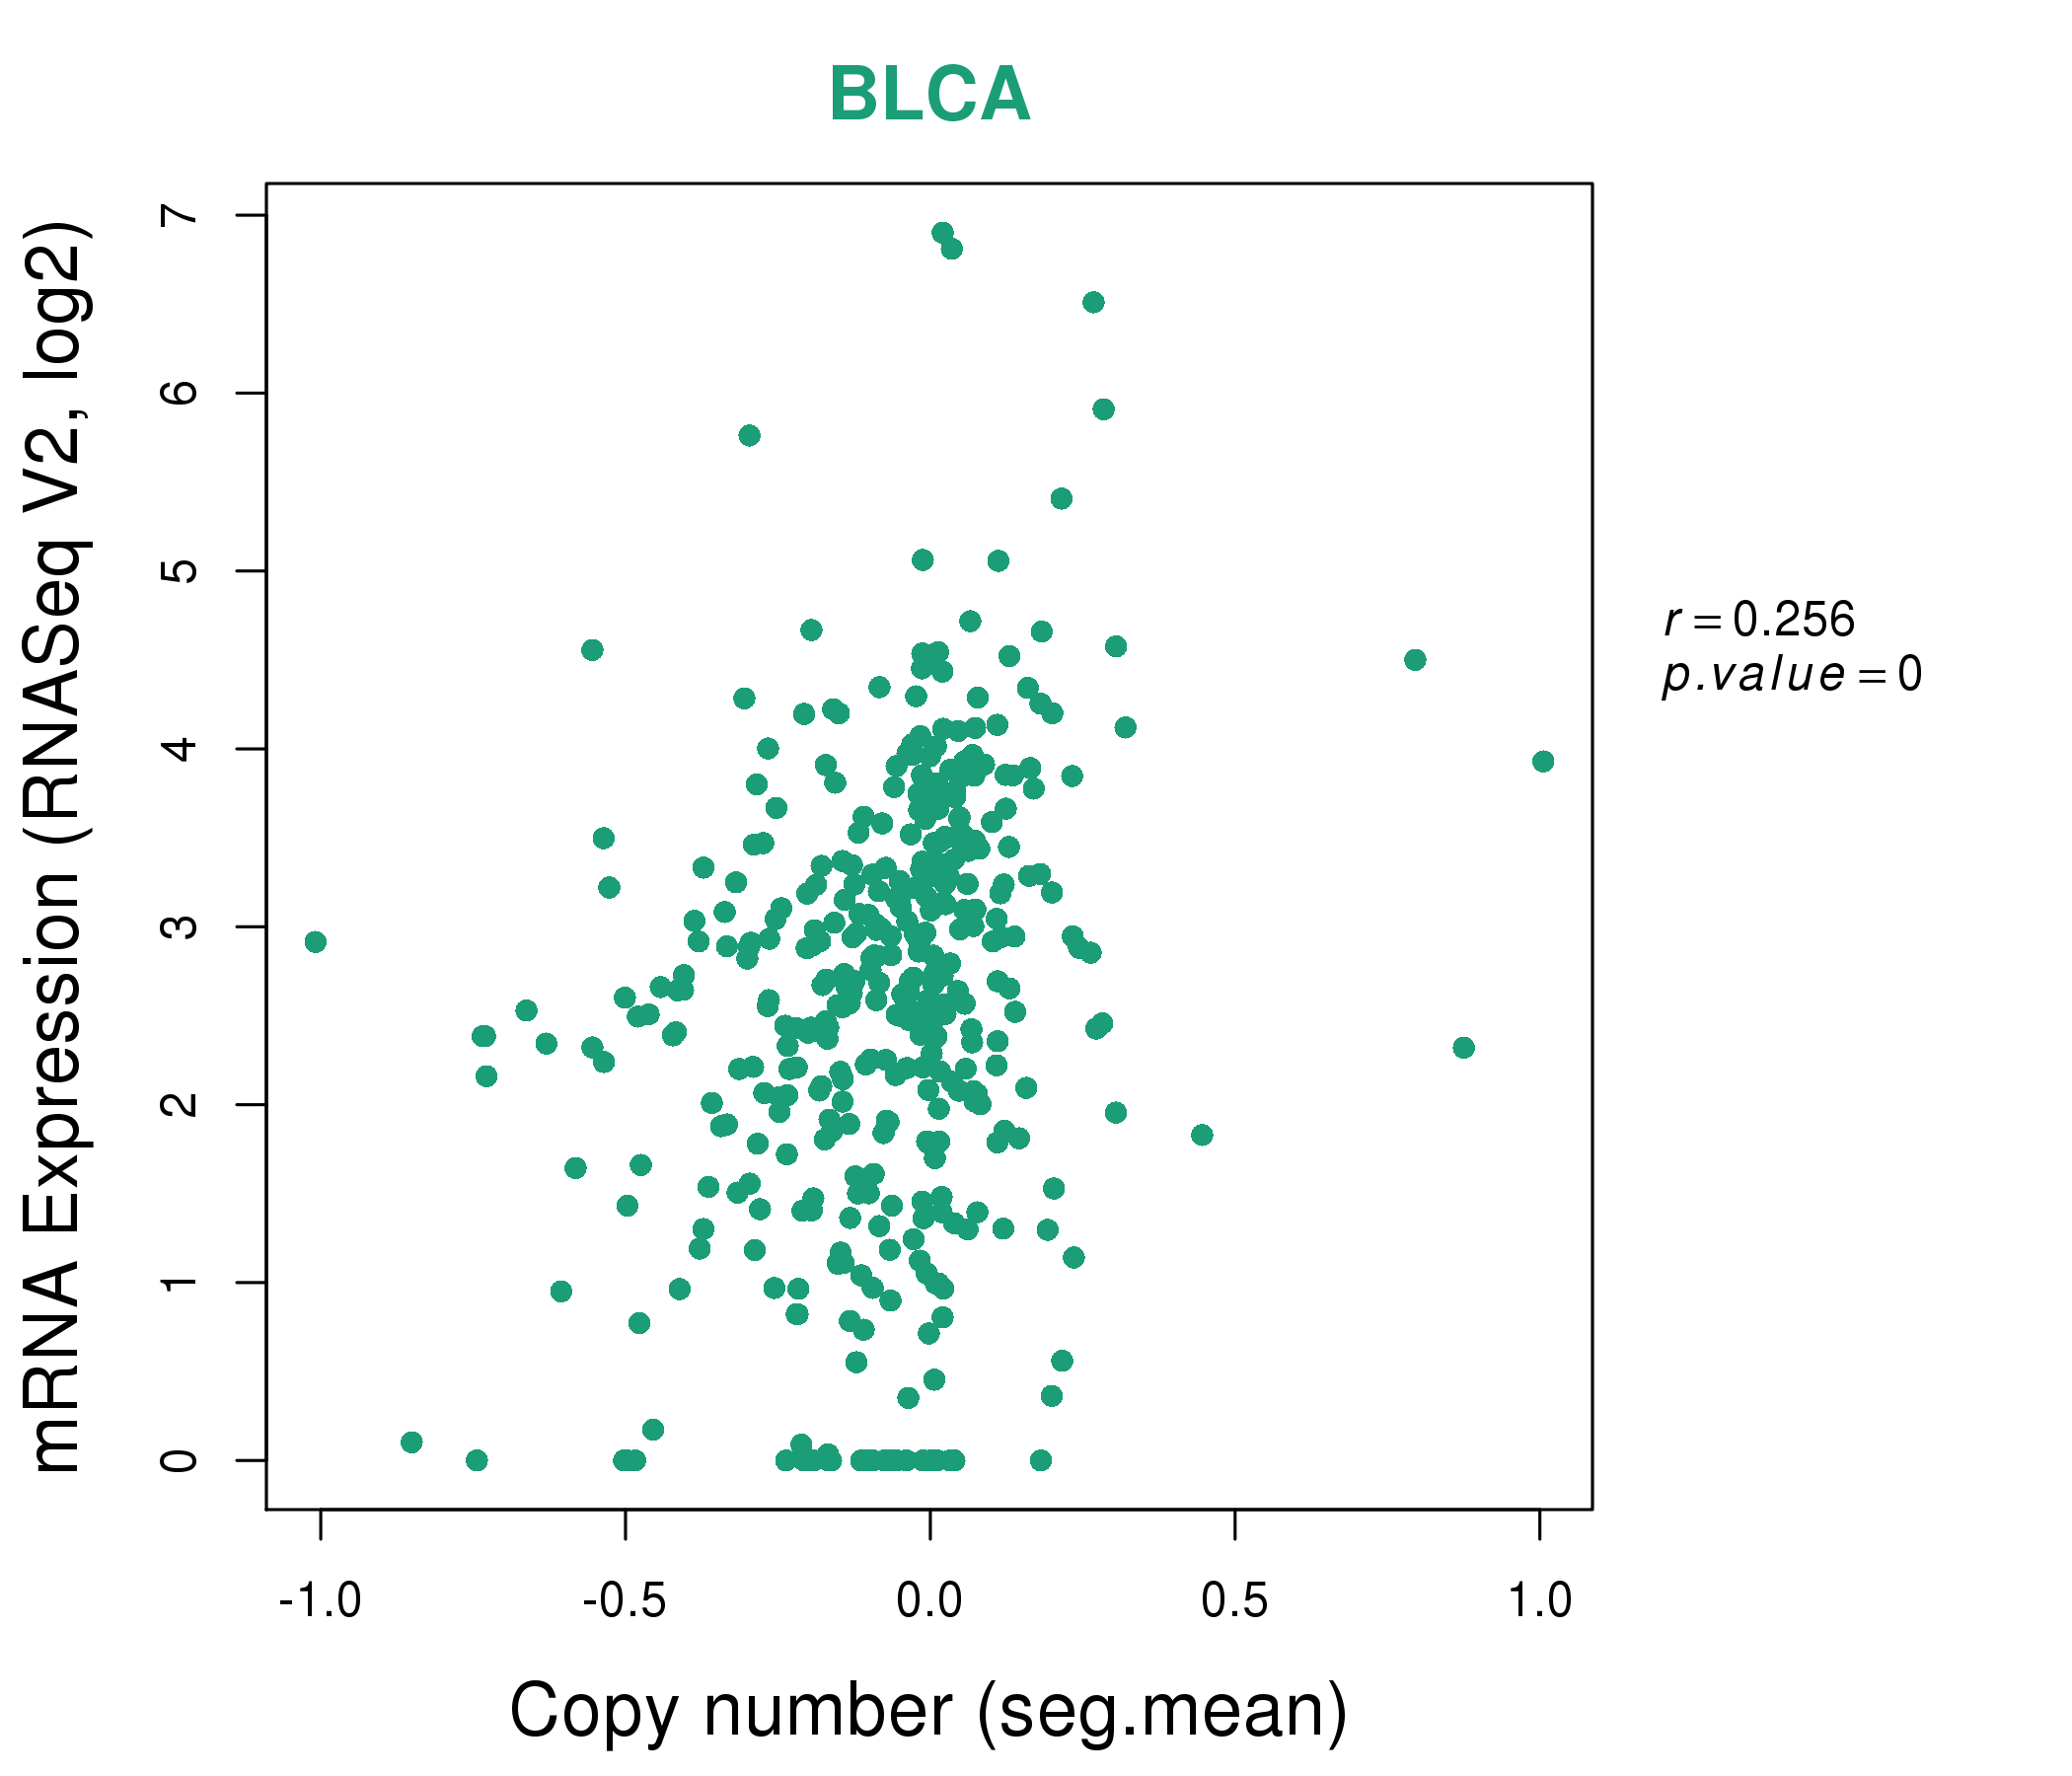
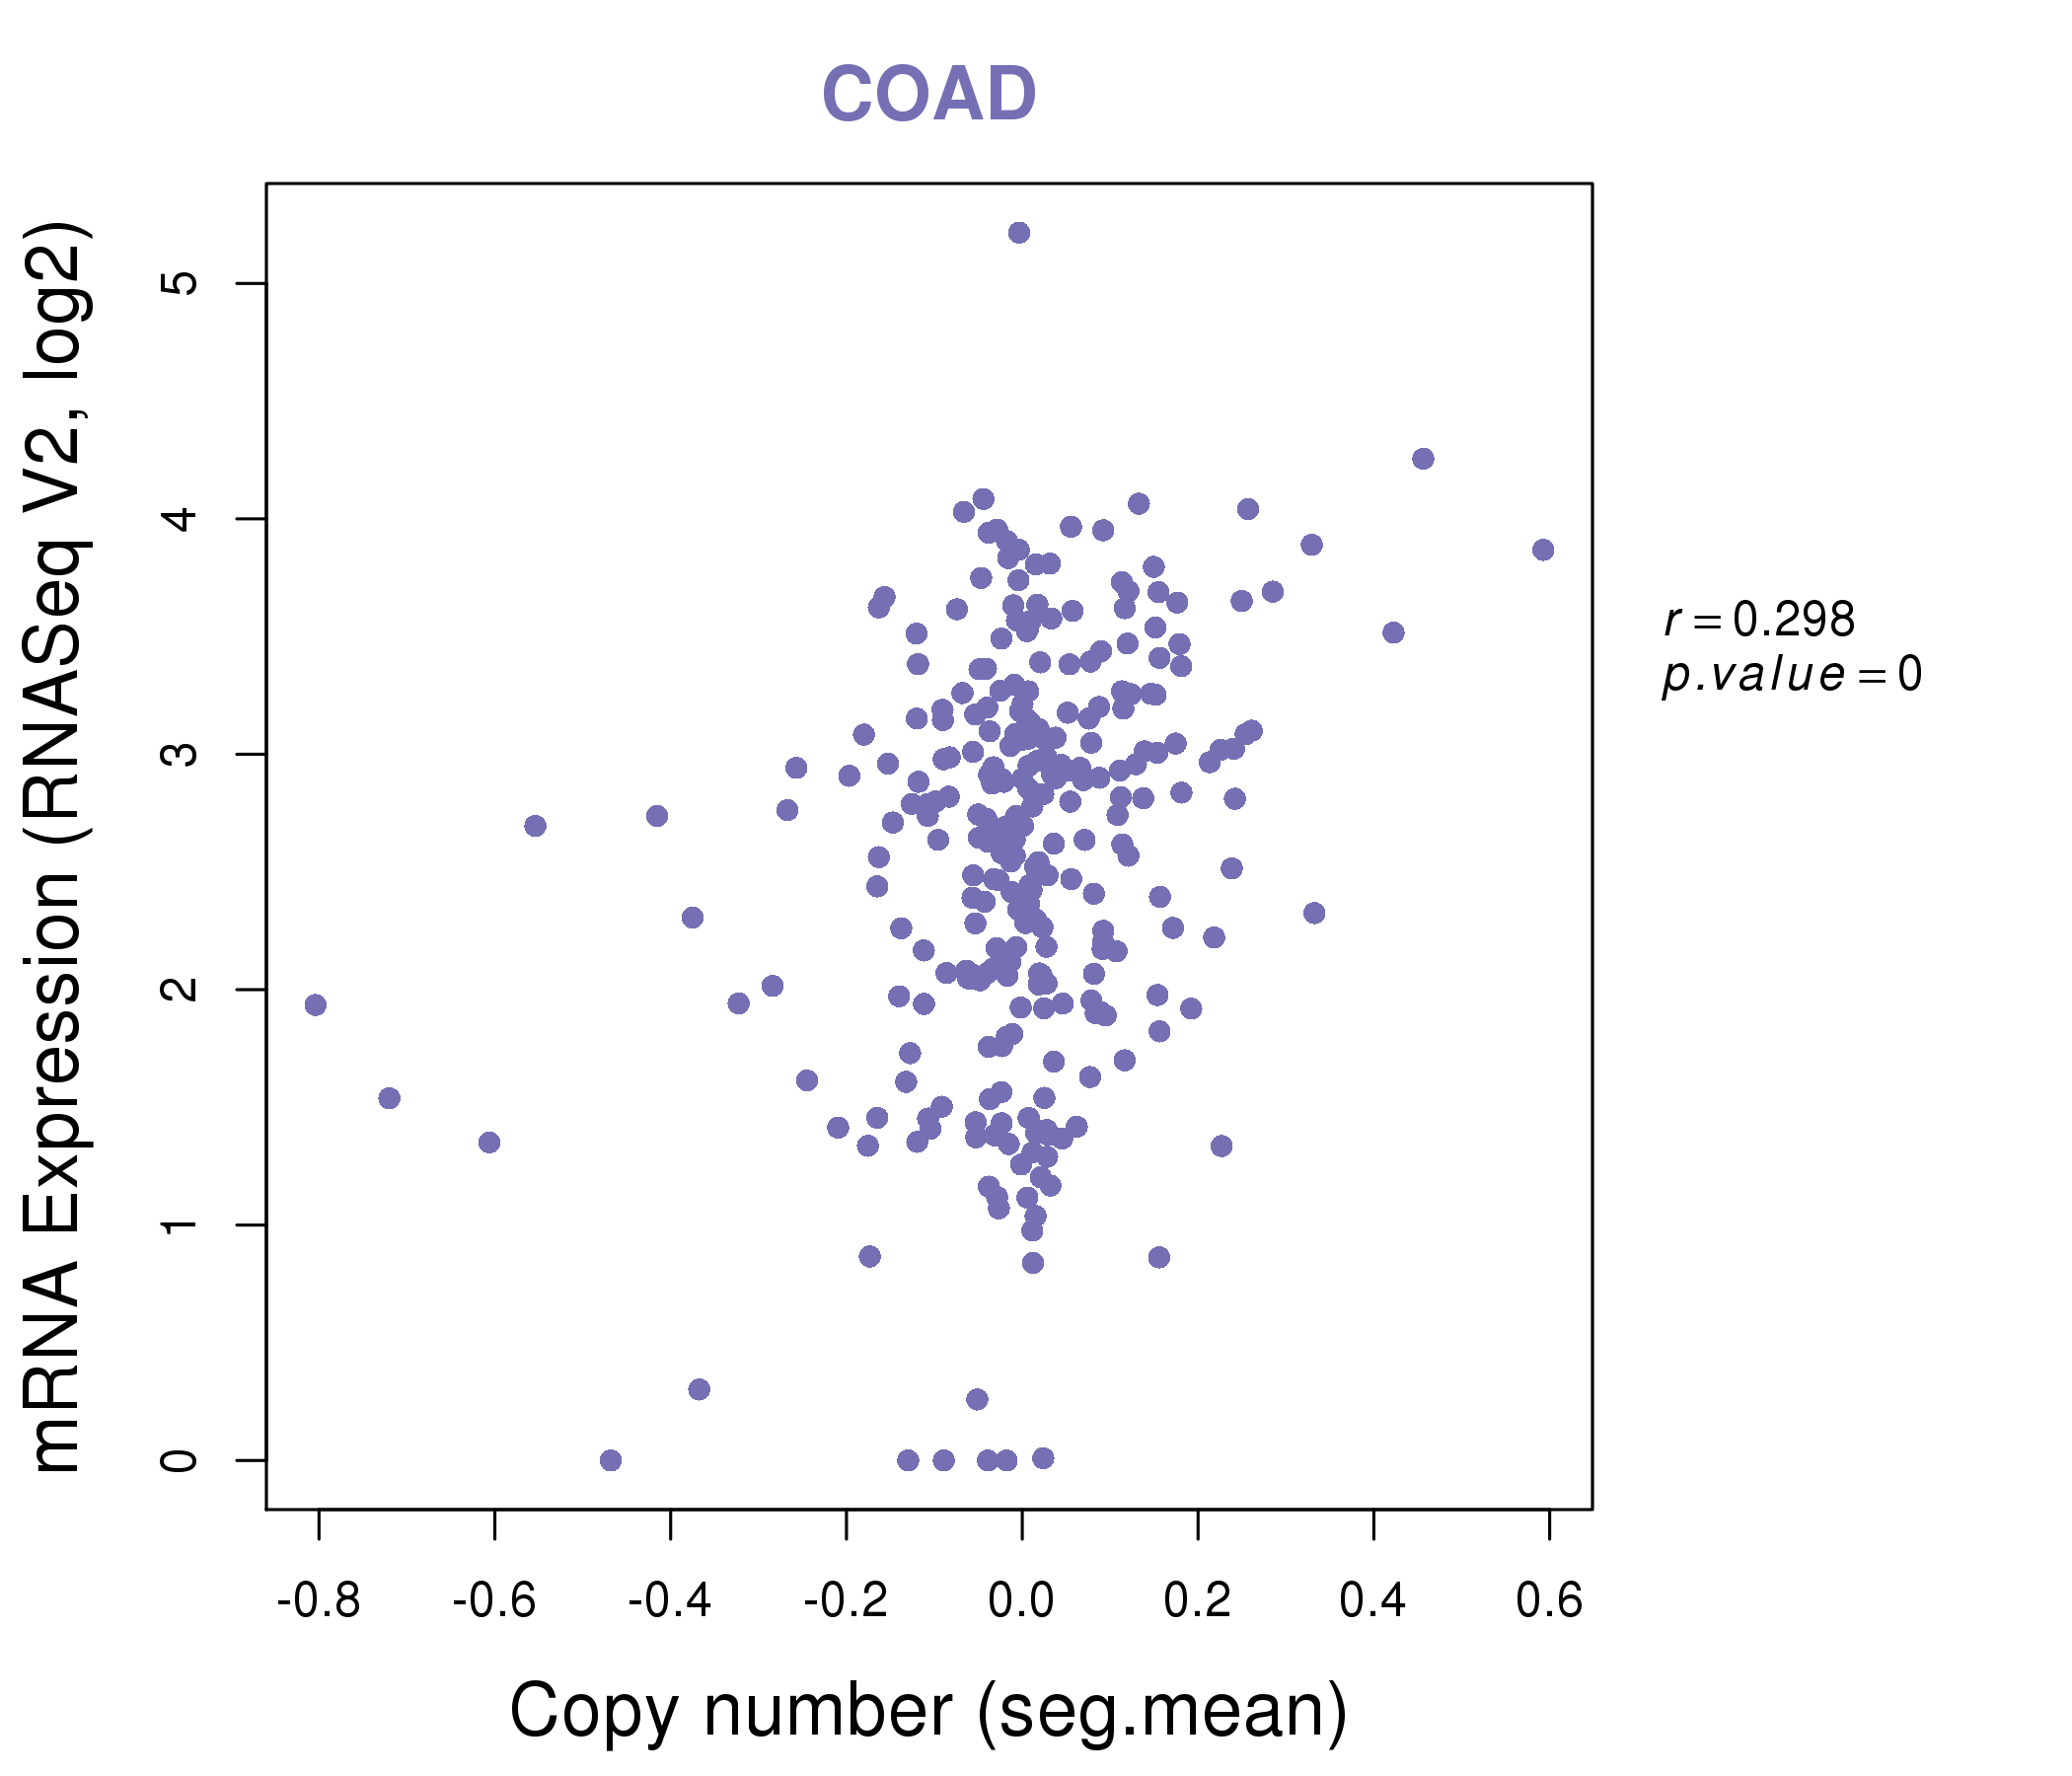
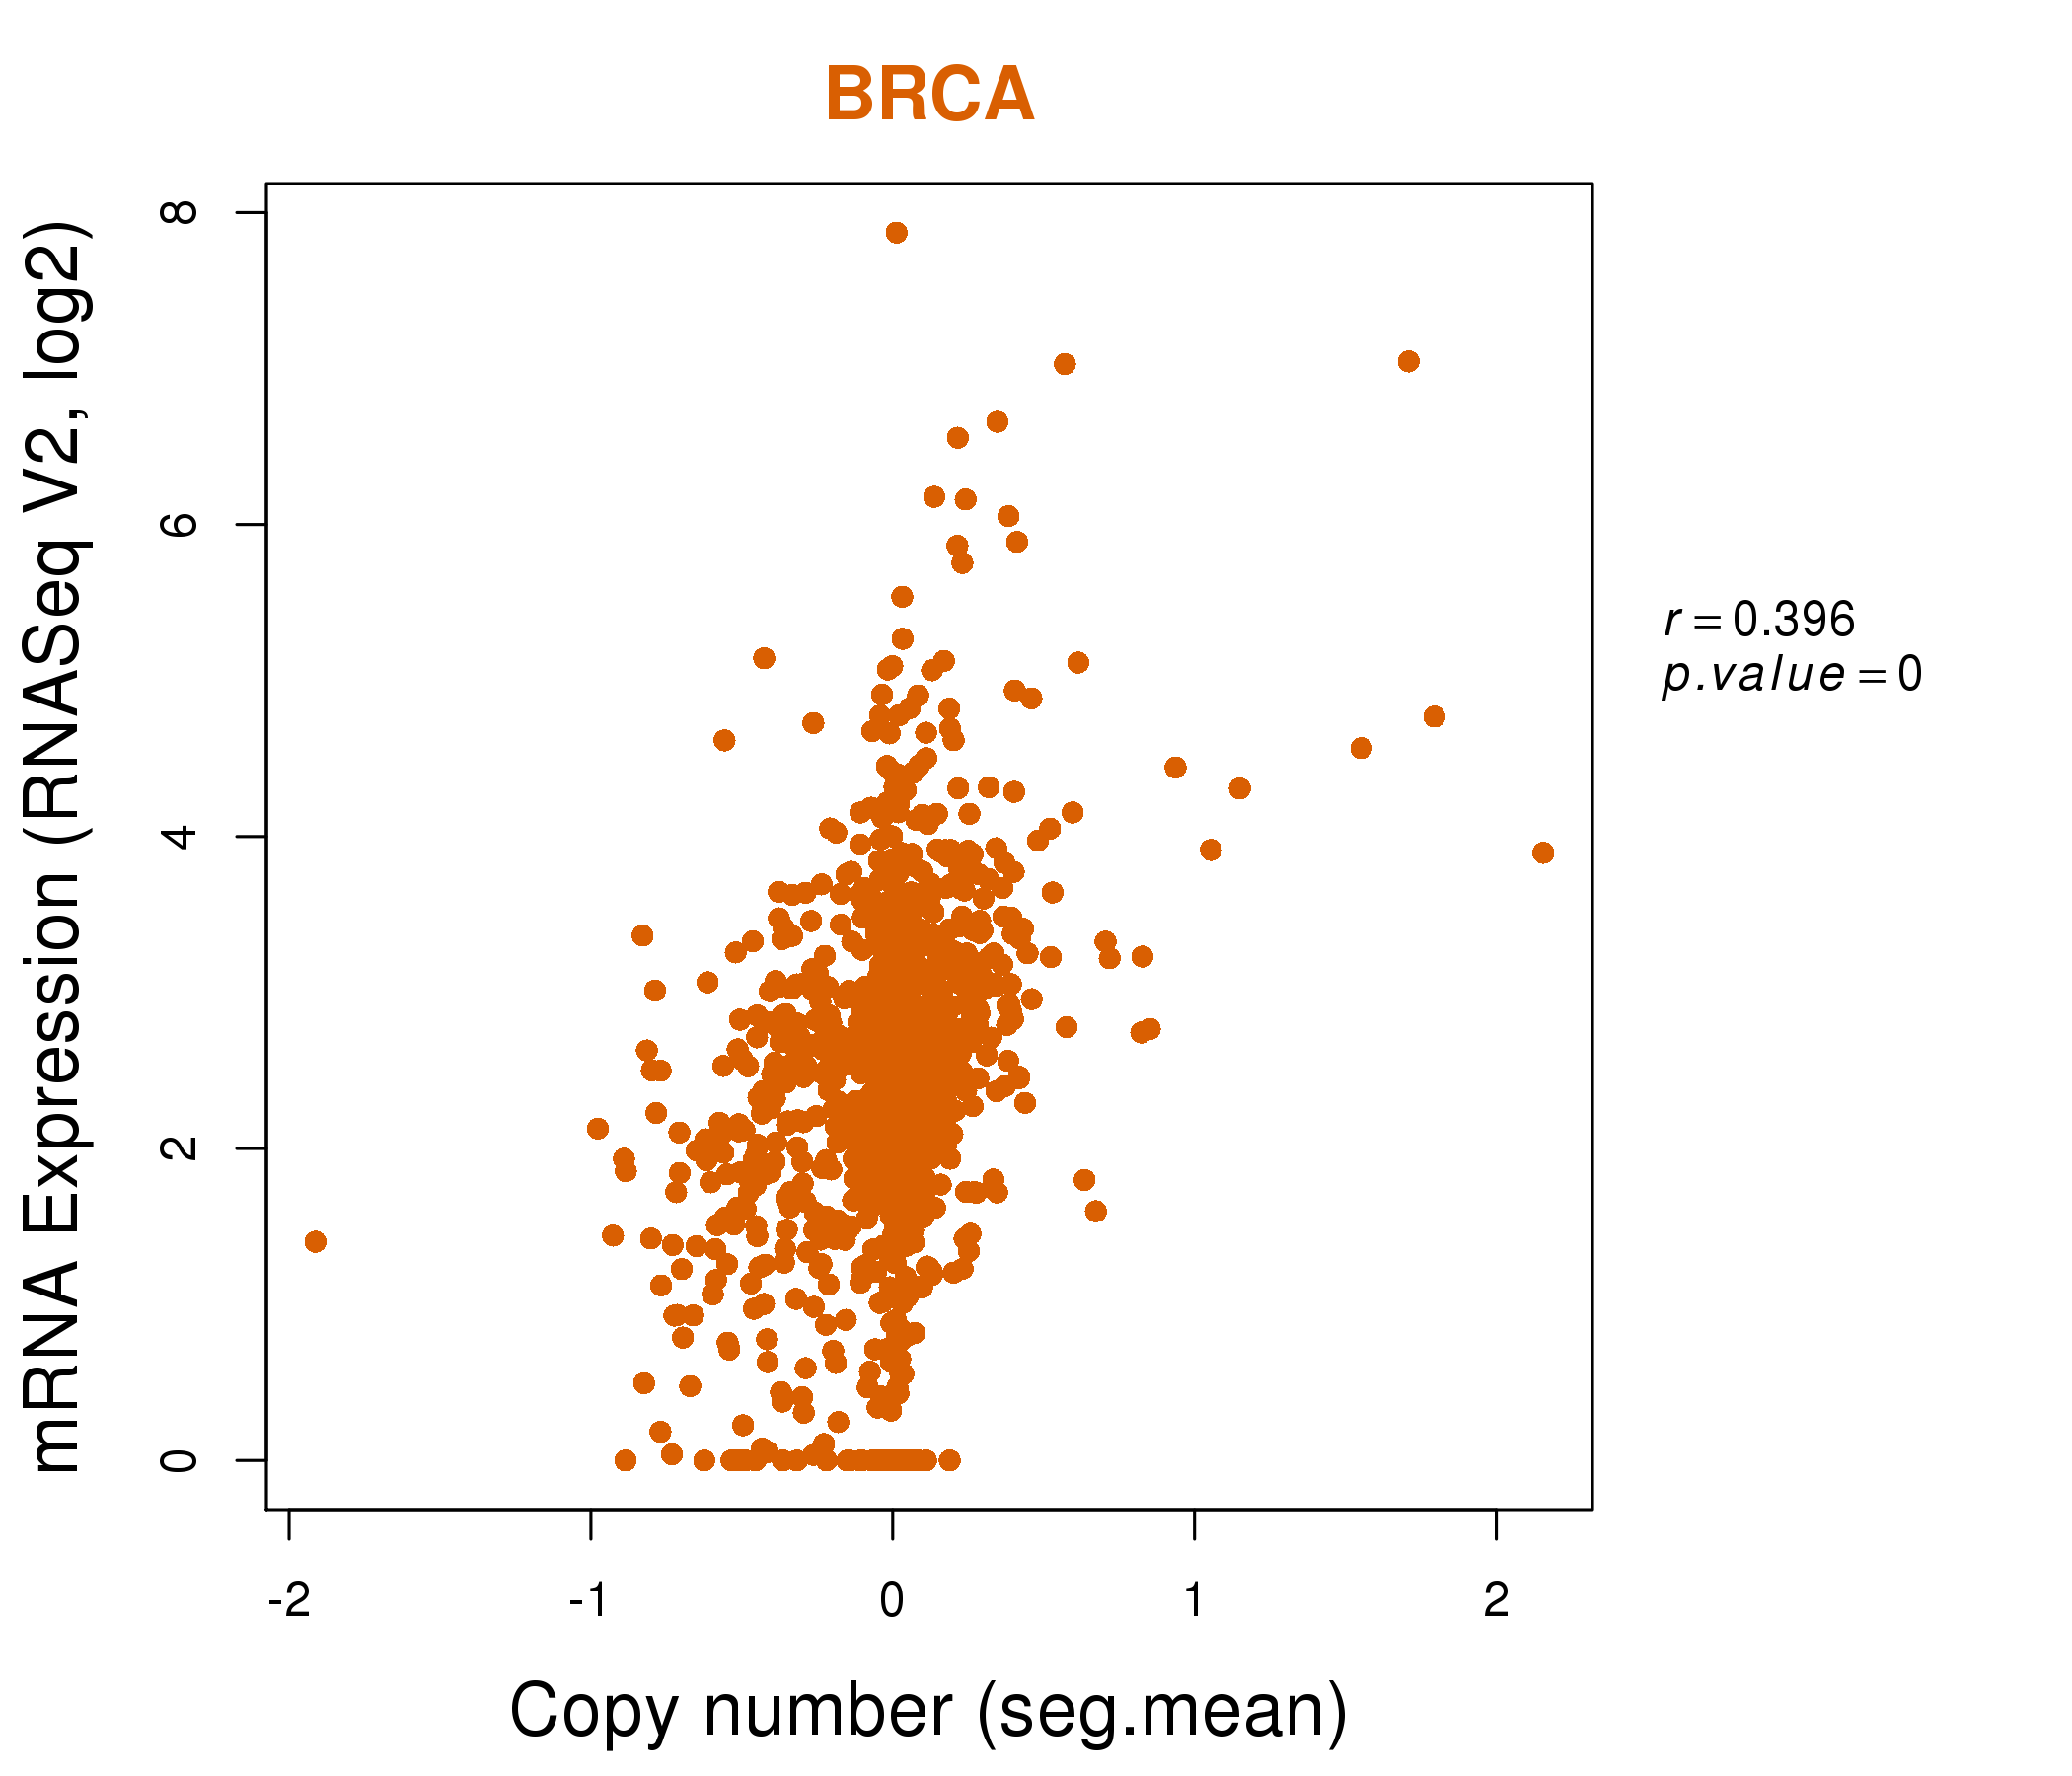
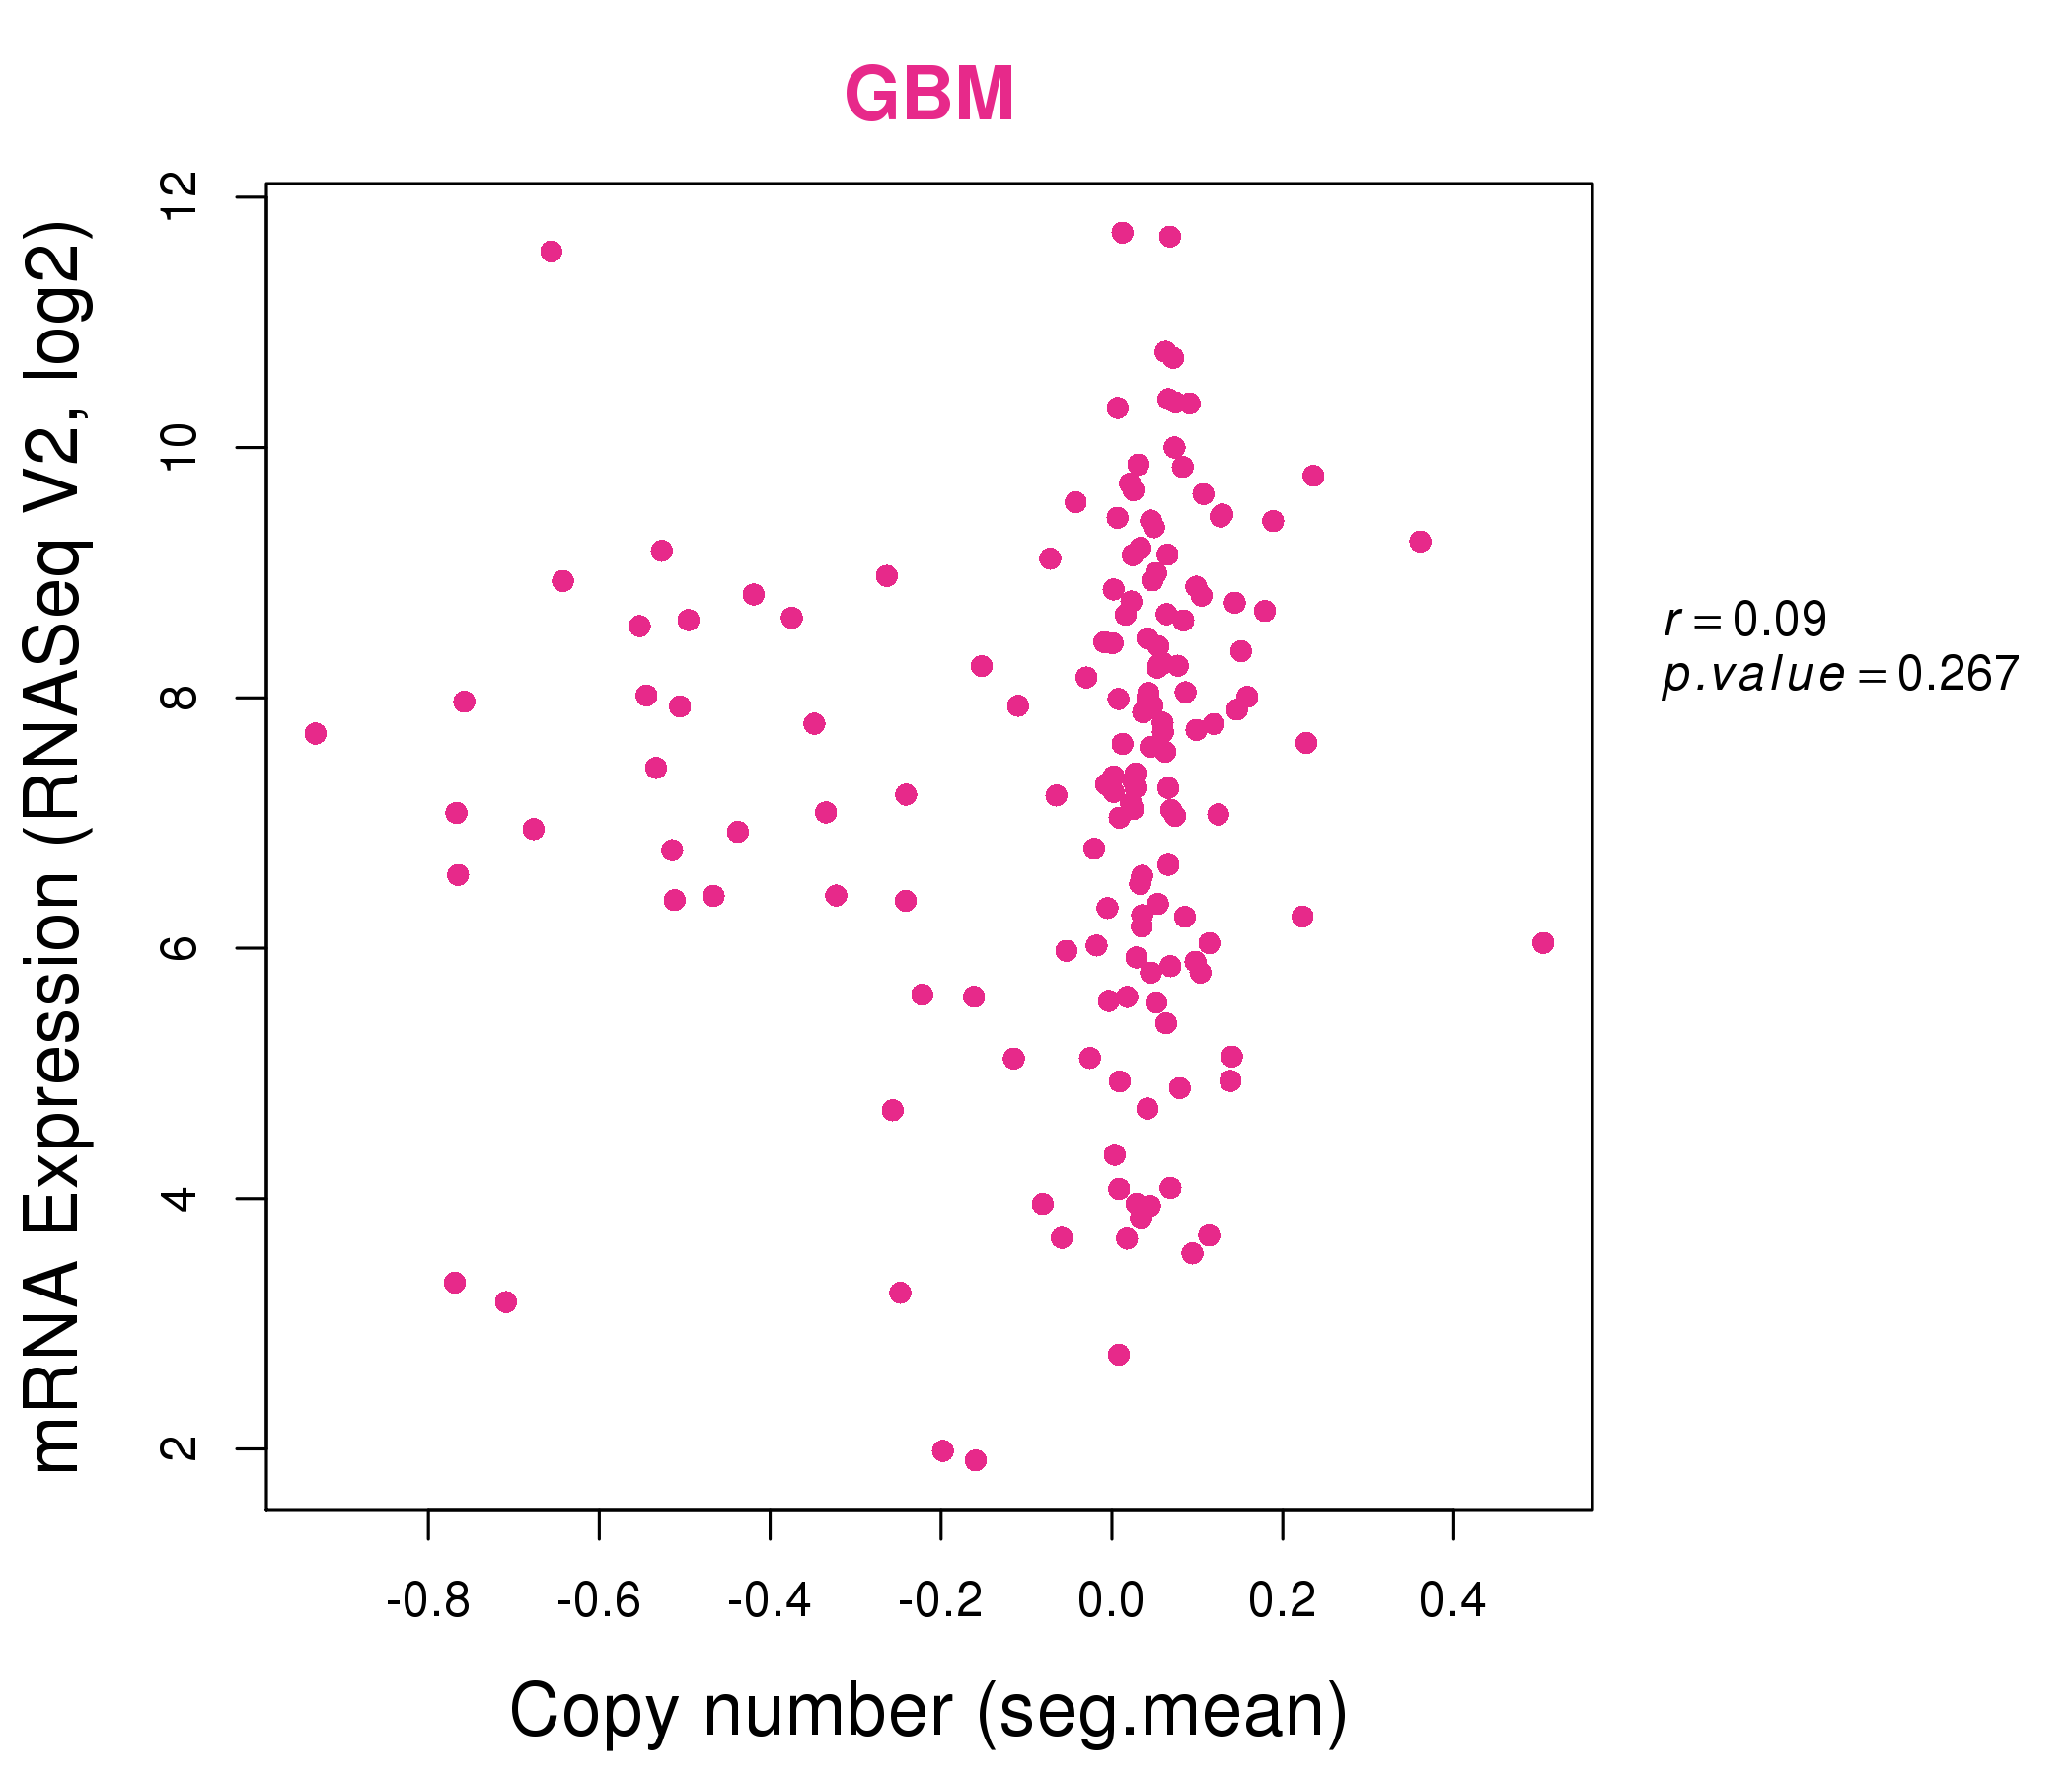
| * This plots show the correlation between CNV and gene expression. |
: Open all plots for all cancer types
 |
|
 |
|
| Top |
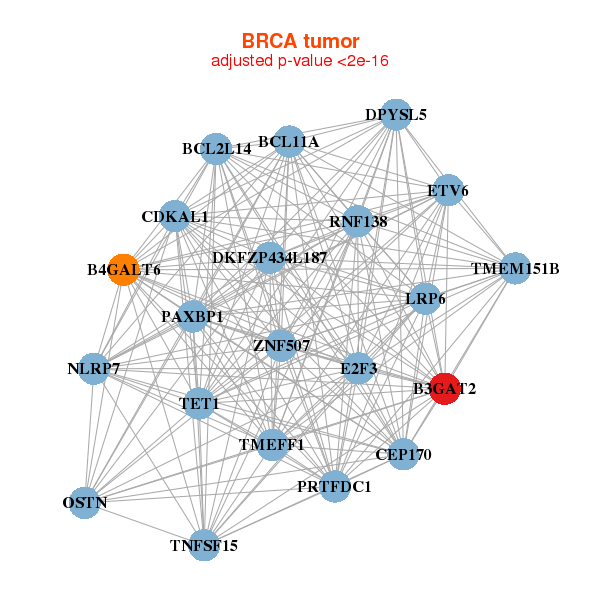
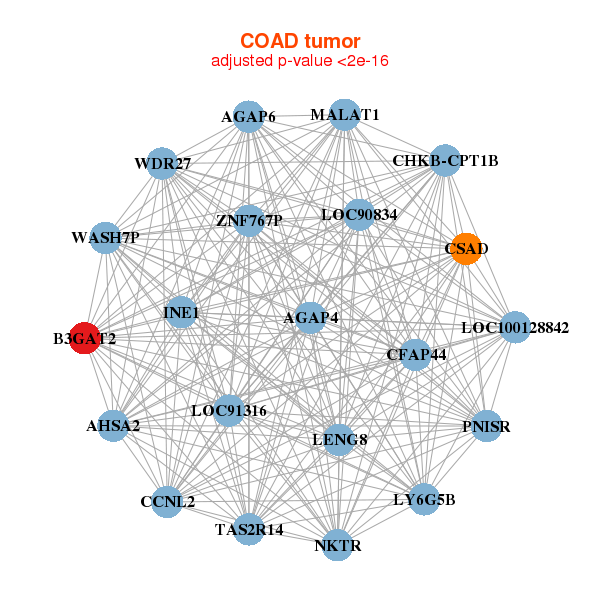
| Gene-Gene Network Information |
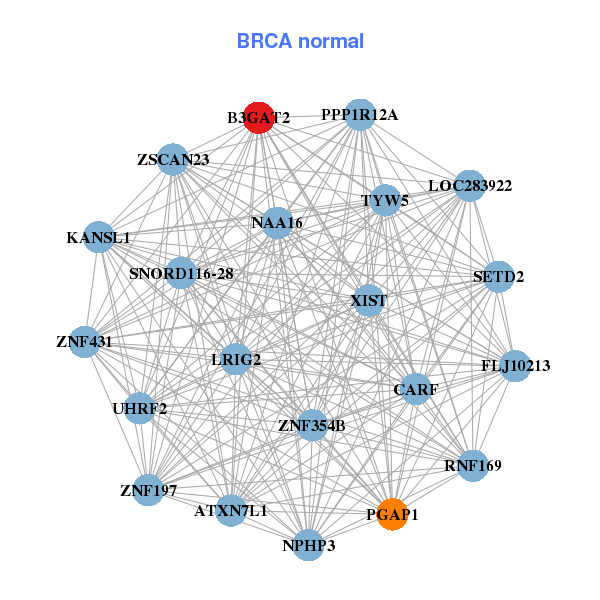
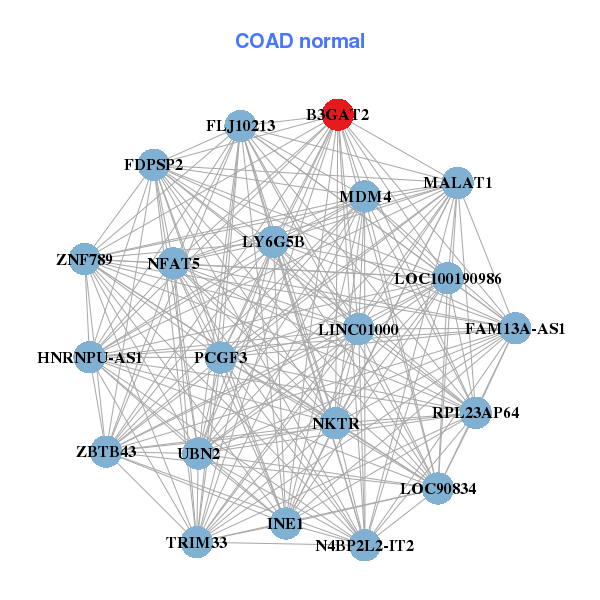
| * Co-Expression network figures were drawn using R package igraph. Only the top 20 genes with the highest correlations were shown. Red circle: input gene, orange circle: cell metabolism gene, sky circle: other gene |
: Open all plots for all cancer types
 |
|
| B3GAT2,B4GALT6,BCL11A,BCL2L14,CDKAL1,CEP170,DKFZP434L187, DPYSL5,E2F3,ETV6,PAXBP1,LRP6,NLRP7,OSTN, PRTFDC1,RNF138,TET1,TMEFF1,TMEM151B,TNFSF15,ZNF507 | CARF,ATXN7L1,B3GAT2,TYW5,FLJ10213,KANSL1,LOC283922, LRIG2,NAA16,NPHP3,PGAP1,PPP1R12A,RNF169,SETD2, SNORD116-28,UHRF2,XIST,ZNF197,ZNF354B,ZNF431,ZSCAN23 |
 |
|
| AGAP4,AGAP6,AHSA2,B3GAT2,CCNL2,CHKB-CPT1B,CSAD, INE1,LENG8,LOC100128842,LOC90834,LOC91316,LY6G5B,MALAT1, NKTR,PNISR,TAS2R14,WASH7P,WDR27,CFAP44,ZNF767P | B3GAT2,N4BP2L2-IT2,FAM13A-AS1,FDPSP2,FLJ10213,LINC01000,INE1, LOC100190986,LOC90834,LY6G5B,MALAT1,MDM4,HNRNPU-AS1,NFAT5, NKTR,PCGF3,RPL23AP64,TRIM33,UBN2,ZBTB43,ZNF789 |
| * Co-Expression network figures were drawn using R package igraph. Only the top 20 genes with the highest correlations were shown. Red circle: input gene, orange circle: cell metabolism gene, sky circle: other gene |
: Open all plots for all cancer types
| Top |
: Open all interacting genes' information including KEGG pathway for all interacting genes from DAVID
| Top |
| Pharmacological Information for B3GAT2 |
| There's no related Drug. |
| Top |
| Cross referenced IDs for B3GAT2 |
| * We obtained these cross-references from Uniprot database. It covers 150 different DBs, 18 categories. http://www.uniprot.org/help/cross_references_section |
: Open all cross reference information
|
Copyright © 2016-Present - The Univsersity of Texas Health Science Center at Houston @ |