|
||||||||||||||||||||||||||||||||||||||||||||||||||||||||||||||||||||||||||||||||||||||||||||||||||||||||||||||||||||||||||||||||||||||||||||||||||||||||||||||||||||||||||||||||||||||||||||||||||||||||||||||||||||||||||||||||||||||||||||||||||||||||||||||||||||||||||||||||||||||||||||||||||||||||||||||||||||||||||
| |
| Phenotypic Information (metabolism pathway, cancer, disease, phenome) |
| |
| |
| Gene-Gene Network Information: Co-Expression Network, Interacting Genes & KEGG |
| |
|


| Gene Summary for COX10 |
| Basic gene info. | Gene symbol | COX10 |
| Gene name | COX10 heme A:farnesyltransferase cytochrome c oxidase assembly factor | |
| Synonyms | - | |
| Cytomap | UCSC genome browser: 17p12 | |
| Genomic location | chr17 :13972718-14111996 | |
| Type of gene | protein-coding | |
| RefGenes | NM_001303.3, | |
| Ensembl id | ENSG00000006695 | |
| Description | COX10 homolog, cytochrome c oxidase assembly protein, heme A: farnesyltransferasecytochrome c oxidase assembly homolog 10cytochrome c oxidase assembly proteincytochrome c oxidase subunit Xheme A: farnesyltransferaseheme O synthaseprotoheme IX farnes | |
| Modification date | 20141207 | |
| dbXrefs | MIM : 602125 | |
| HGNC : HGNC | ||
| Ensembl : ENSG00000006695 | ||
| HPRD : 03673 | ||
| Vega : OTTHUMG00000058814 | ||
| Protein | UniProt: go to UniProt's Cross Reference DB Table | |
| Expression | CleanEX: HS_COX10 | |
| BioGPS: 1352 | ||
| Gene Expression Atlas: ENSG00000006695 | ||
| The Human Protein Atlas: ENSG00000006695 | ||
| Pathway | NCI Pathway Interaction Database: COX10 | |
| KEGG: COX10 | ||
| REACTOME: COX10 | ||
| ConsensusPathDB | ||
| Pathway Commons: COX10 | ||
| Metabolism | MetaCyc: COX10 | |
| HUMANCyc: COX10 | ||
| Regulation | Ensembl's Regulation: ENSG00000006695 | |
| miRBase: chr17 :13,972,718-14,111,996 | ||
| TargetScan: NM_001303 | ||
| cisRED: ENSG00000006695 | ||
| Context | iHOP: COX10 | |
| cancer metabolism search in PubMed: COX10 | ||
| UCL Cancer Institute: COX10 | ||
| Assigned class in ccmGDB | C | |
| Top |
| Phenotypic Information for COX10(metabolism pathway, cancer, disease, phenome) |
| Cancer | CGAP: COX10 |
| Familial Cancer Database: COX10 | |
| * This gene is included in those cancer gene databases. |
|
|
|
|
|
| . | ||||||||||||||||||||||||||||||||||||||||||||||||||||||||||||||||||||||||||||||||||||||||||||||||||||||||||||||||||||||||||||||||||||||||||||||||||||||||||||||||||||||||||||||||||||||||||||||||||||||||||||||||||||||||||||||||||||||||||||||||||||||||||||||||||||||||||||||||||||||||||||||||||||||||||||||||||||
Oncogene 1 | Significant driver gene in | |||||||||||||||||||||||||||||||||||||||||||||||||||||||||||||||||||||||||||||||||||||||||||||||||||||||||||||||||||||||||||||||||||||||||||||||||||||||||||||||||||||||||||||||||||||||||||||||||||||||||||||||||||||||||||||||||||||||||||||||||||||||||||||||||||||||||||||||||||||||||||||||||||||||||||||||||||||||||
| cf) number; DB name 1 Oncogene; http://nar.oxfordjournals.org/content/35/suppl_1/D721.long, 2 Tumor Suppressor gene; https://bioinfo.uth.edu/TSGene/, 3 Cancer Gene Census; http://www.nature.com/nrc/journal/v4/n3/abs/nrc1299.html, 4 CancerGenes; http://nar.oxfordjournals.org/content/35/suppl_1/D721.long, 5 Network of Cancer Gene; http://ncg.kcl.ac.uk/index.php, 1Therapeutic Vulnerabilities in Cancer; http://cbio.mskcc.org/cancergenomics/statius/ |
| KEGG_PORPHYRIN_AND_CHLOROPHYLL_METABOLISM | |
| OMIM | |
| Orphanet | |
| Disease | KEGG Disease: COX10 |
| MedGen: COX10 (Human Medical Genetics with Condition) | |
| ClinVar: COX10 | |
| Phenotype | MGI: COX10 (International Mouse Phenotyping Consortium) |
| PhenomicDB: COX10 | |
| Mutations for COX10 |
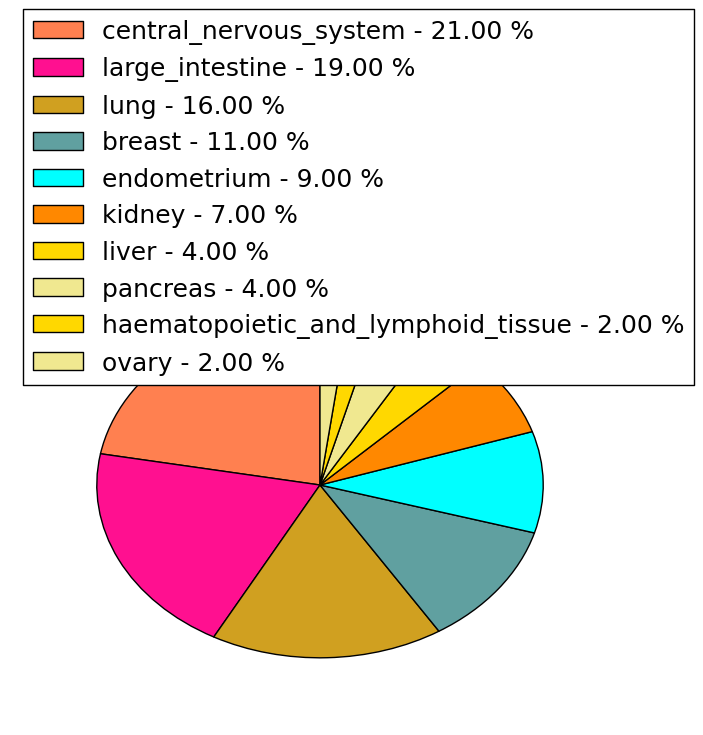
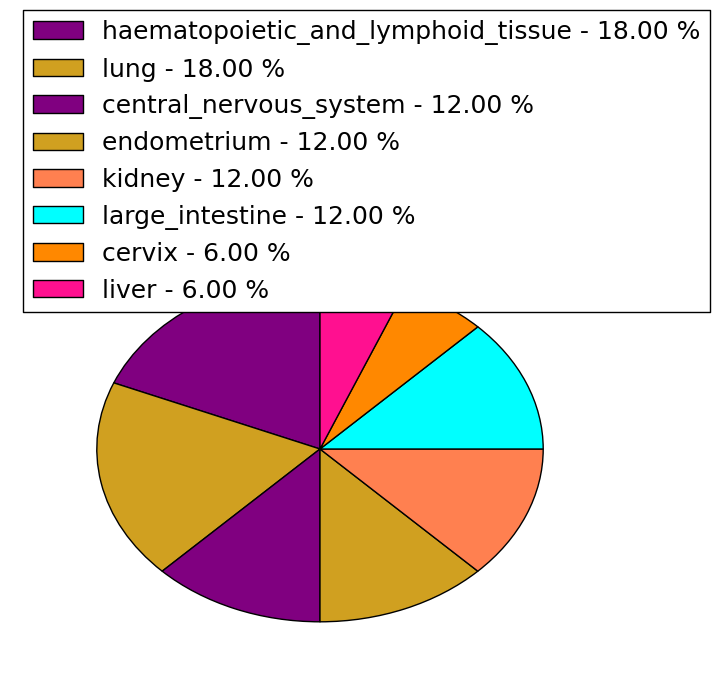
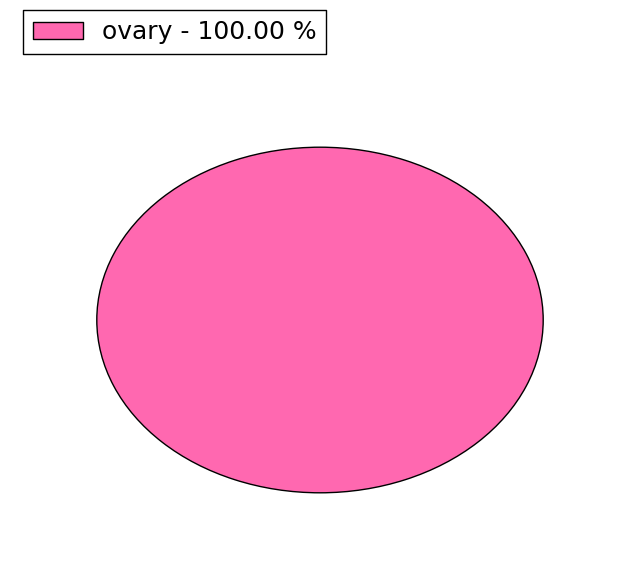
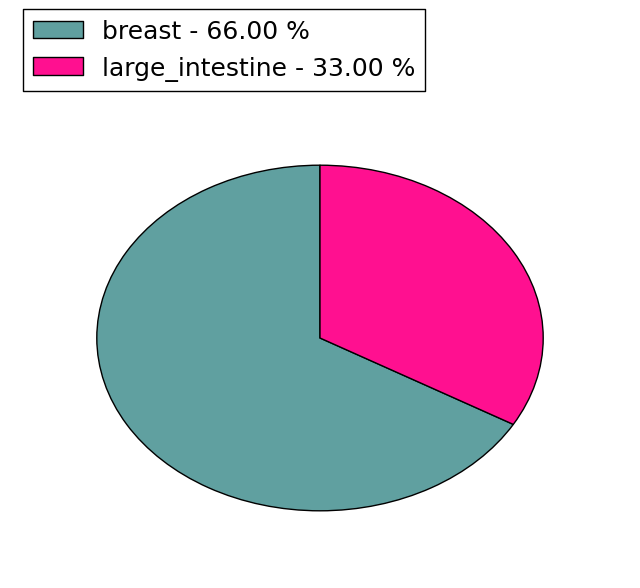
| * Under tables are showing count per each tissue to give us broad intuition about tissue specific mutation patterns.You can go to the detailed page for each mutation database's web site. |
| - Statistics for Tissue and Mutation type | Top |
 |
| - For Inter-chromosomal Variations |
| * Inter-chromosomal variantions includes 'interchromosomal amplicon to amplicon', 'interchromosomal amplicon to non-amplified dna', 'interchromosomal insertion', 'Interchromosomal unknown type'. |
 |
| - For Intra-chromosomal Variations |
| There's no intra-chromosomal structural variation. |
| Sample | Symbol_a | Chr_a | Start_a | End_a | Symbol_b | Chr_b | Start_b | End_b |
| cf) Tissue number; Tissue name (1;Breast, 2;Central_nervous_system, 3;Haematopoietic_and_lymphoid_tissue, 4;Large_intestine, 5;Liver, 6;Lung, 7;Ovary, 8;Pancreas, 9;Prostate, 10;Skin, 11;Soft_tissue, 12;Upper_aerodigestive_tract) |
| * From mRNA Sanger sequences, Chitars2.0 arranged chimeric transcripts. This table shows COX10 related fusion information. |
| ID | Head Gene | Tail Gene | Accession | Gene_a | qStart_a | qEnd_a | Chromosome_a | tStart_a | tEnd_a | Gene_a | qStart_a | qEnd_a | Chromosome_a | tStart_a | tEnd_a |
| DB233923 | COX10 | 1 | 464 | 17 | 13982204 | 13982667 | PCGF3 | 458 | 600 | 4 | 760119 | 760261 | |
| Top |
| Mutation type/ Tissue ID | brca | cns | cerv | endome | haematopo | kidn | Lintest | liver | lung | ns | ovary | pancre | prost | skin | stoma | thyro | urina | |||
| Total # sample | 2 | 1 | 1 | |||||||||||||||||
| GAIN (# sample) | 1 | |||||||||||||||||||
| LOSS (# sample) | 1 | 1 | 1 |
| cf) Tissue ID; Tissue type (1; Breast, 2; Central_nervous_system, 3; Cervix, 4; Endometrium, 5; Haematopoietic_and_lymphoid_tissue, 6; Kidney, 7; Large_intestine, 8; Liver, 9; Lung, 10; NS, 11; Ovary, 12; Pancreas, 13; Prostate, 14; Skin, 15; Stomach, 16; Thyroid, 17; Urinary_tract) |
| Top |
|
 |
| Top |
| Stat. for Non-Synonymous SNVs (# total SNVs=42) | (# total SNVs=16) |
 |  |
(# total SNVs=1) | (# total SNVs=3) |
 |  |
| Top |
| * When you move the cursor on each content, you can see more deailed mutation information on the Tooltip. Those are primary_site,primary_histology,mutation(aa),pubmedID. |
| GRCh37 position | Mutation(aa) | Unique sampleID count |
| chr17:14095532-14095532 | p.D308N | 2 |
| chr17:14095347-14095347 | p.P246L | 2 |
| chr17:14005439-14005439 | p.L168L | 2 |
| chr17:14110262-14110262 | p.R355H | 2 |
| chr17:14110263-14110263 | p.R355R | 2 |
| chr17:14110273-14110273 | p.R359C | 2 |
| chr17:13980228-13980228 | p.L118F | 2 |
| chr17:14110524-14110524 | p.P442P | 2 |
| chr17:13980058-13980058 | p.T62S | 1 |
| chr17:13980289-13980289 | p.E139* | 1 |
| Top |
|
 |
| Point Mutation/ Tissue ID | 1 | 2 | 3 | 4 | 5 | 6 | 7 | 8 | 9 | 10 | 11 | 12 | 13 | 14 | 15 | 16 | 17 | 18 | 19 | 20 |
| # sample | 2 | 1 | 1 | 5 | 2 | 2 | 2 | 1 | 5 | 4 | 1 | 6 | 5 | 5 | ||||||
| # mutation | 2 | 1 | 1 | 5 | 2 | 2 | 2 | 1 | 5 | 4 | 1 | 6 | 5 | 5 | ||||||
| nonsynonymous SNV | 2 | 1 | 5 | 2 | 1 | 1 | 4 | 2 | 4 | 2 | 3 | |||||||||
| synonymous SNV | 1 | 1 | 1 | 1 | 1 | 2 | 1 | 2 | 3 | 2 |
| cf) Tissue ID; Tissue type (1; BLCA[Bladder Urothelial Carcinoma], 2; BRCA[Breast invasive carcinoma], 3; CESC[Cervical squamous cell carcinoma and endocervical adenocarcinoma], 4; COAD[Colon adenocarcinoma], 5; GBM[Glioblastoma multiforme], 6; Glioma Low Grade, 7; HNSC[Head and Neck squamous cell carcinoma], 8; KICH[Kidney Chromophobe], 9; KIRC[Kidney renal clear cell carcinoma], 10; KIRP[Kidney renal papillary cell carcinoma], 11; LAML[Acute Myeloid Leukemia], 12; LUAD[Lung adenocarcinoma], 13; LUSC[Lung squamous cell carcinoma], 14; OV[Ovarian serous cystadenocarcinoma ], 15; PAAD[Pancreatic adenocarcinoma], 16; PRAD[Prostate adenocarcinoma], 17; SKCM[Skin Cutaneous Melanoma], 18:STAD[Stomach adenocarcinoma], 19:THCA[Thyroid carcinoma], 20:UCEC[Uterine Corpus Endometrial Carcinoma]) |
| Top |
| * We represented just top 10 SNVs. When you move the cursor on each content, you can see more deailed mutation information on the Tooltip. Those are primary_site, primary_histology, mutation(aa), pubmedID. |
| Genomic Position | Mutation(aa) | Unique sampleID count |
| chr17:14095532 | p.D308N | 2 |
| chr17:13980228 | p.L118F | 2 |
| chr17:14095386 | p.E120V | 1 |
| chr17:14110287 | p.A363A | 1 |
| chr17:13980184 | p.P181P | 1 |
| chr17:14095434 | p.P382S | 1 |
| chr17:14110342 | p.C16C | 1 |
| chr17:13977644 | p.Q30Q | 1 |
| chr17:13980191 | p.L191L | 1 |
| chr17:14095457 | p.G396D | 1 |
| * Copy number data were extracted from TCGA using R package TCGA-Assembler. The URLs of all public data files on TCGA DCC data server were gathered on Jan-05-2015. Function ProcessCNAData in TCGA-Assembler package was used to obtain gene-level copy number value which is calculated as the average copy number of the genomic region of a gene. |
 |
| cf) Tissue ID[Tissue type]: BLCA[Bladder Urothelial Carcinoma], BRCA[Breast invasive carcinoma], CESC[Cervical squamous cell carcinoma and endocervical adenocarcinoma], COAD[Colon adenocarcinoma], GBM[Glioblastoma multiforme], Glioma Low Grade, HNSC[Head and Neck squamous cell carcinoma], KICH[Kidney Chromophobe], KIRC[Kidney renal clear cell carcinoma], KIRP[Kidney renal papillary cell carcinoma], LAML[Acute Myeloid Leukemia], LUAD[Lung adenocarcinoma], LUSC[Lung squamous cell carcinoma], OV[Ovarian serous cystadenocarcinoma ], PAAD[Pancreatic adenocarcinoma], PRAD[Prostate adenocarcinoma], SKCM[Skin Cutaneous Melanoma], STAD[Stomach adenocarcinoma], THCA[Thyroid carcinoma], UCEC[Uterine Corpus Endometrial Carcinoma] |
| Top |
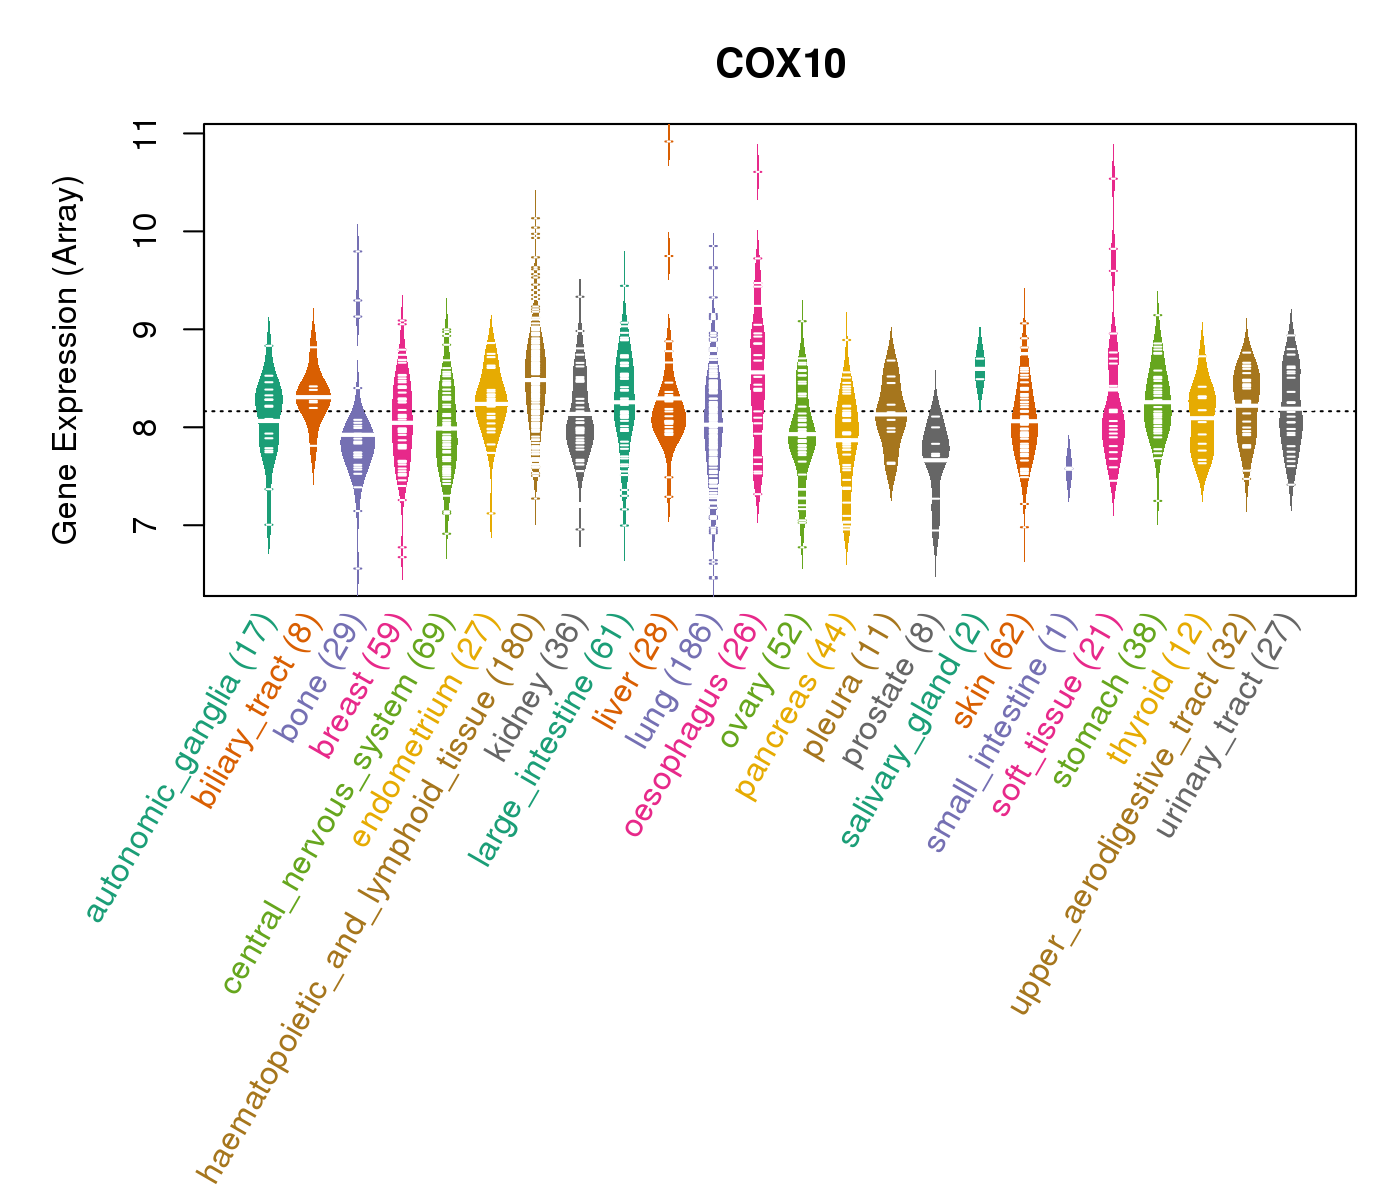
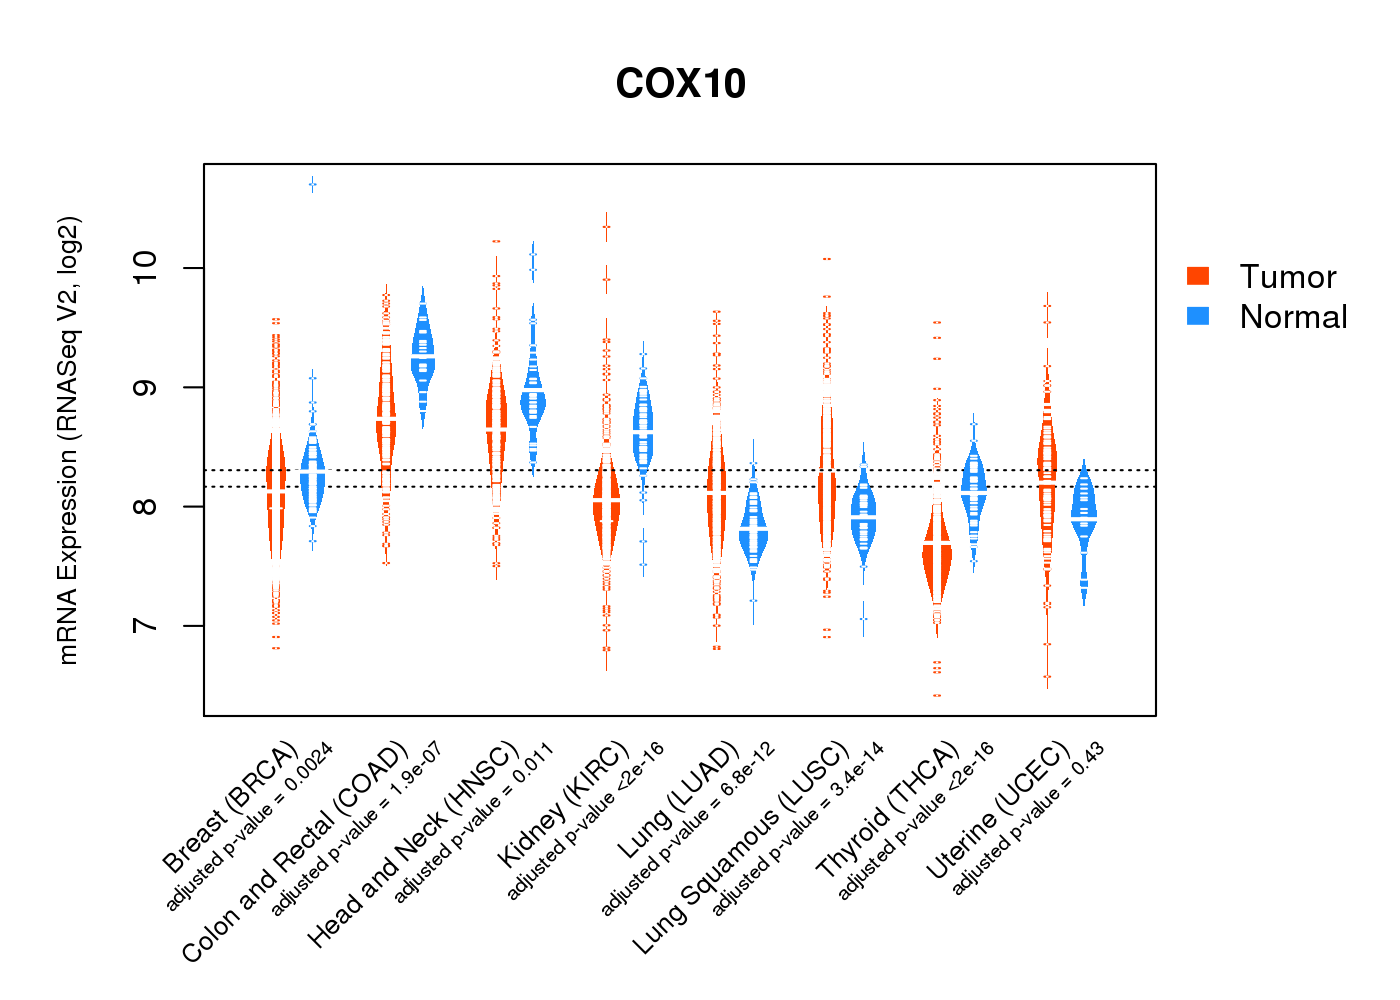
| Gene Expression for COX10 |
| * CCLE gene expression data were extracted from CCLE_Expression_Entrez_2012-10-18.res: Gene-centric RMA-normalized mRNA expression data. |
 |
| * Normalized gene expression data of RNASeqV2 was extracted from TCGA using R package TCGA-Assembler. The URLs of all public data files on TCGA DCC data server were gathered at Jan-05-2015. Only eight cancer types have enough normal control samples for differential expression analysis. (t test, adjusted p<0.05 (using Benjamini-Hochberg FDR)) |
 |
| Top |
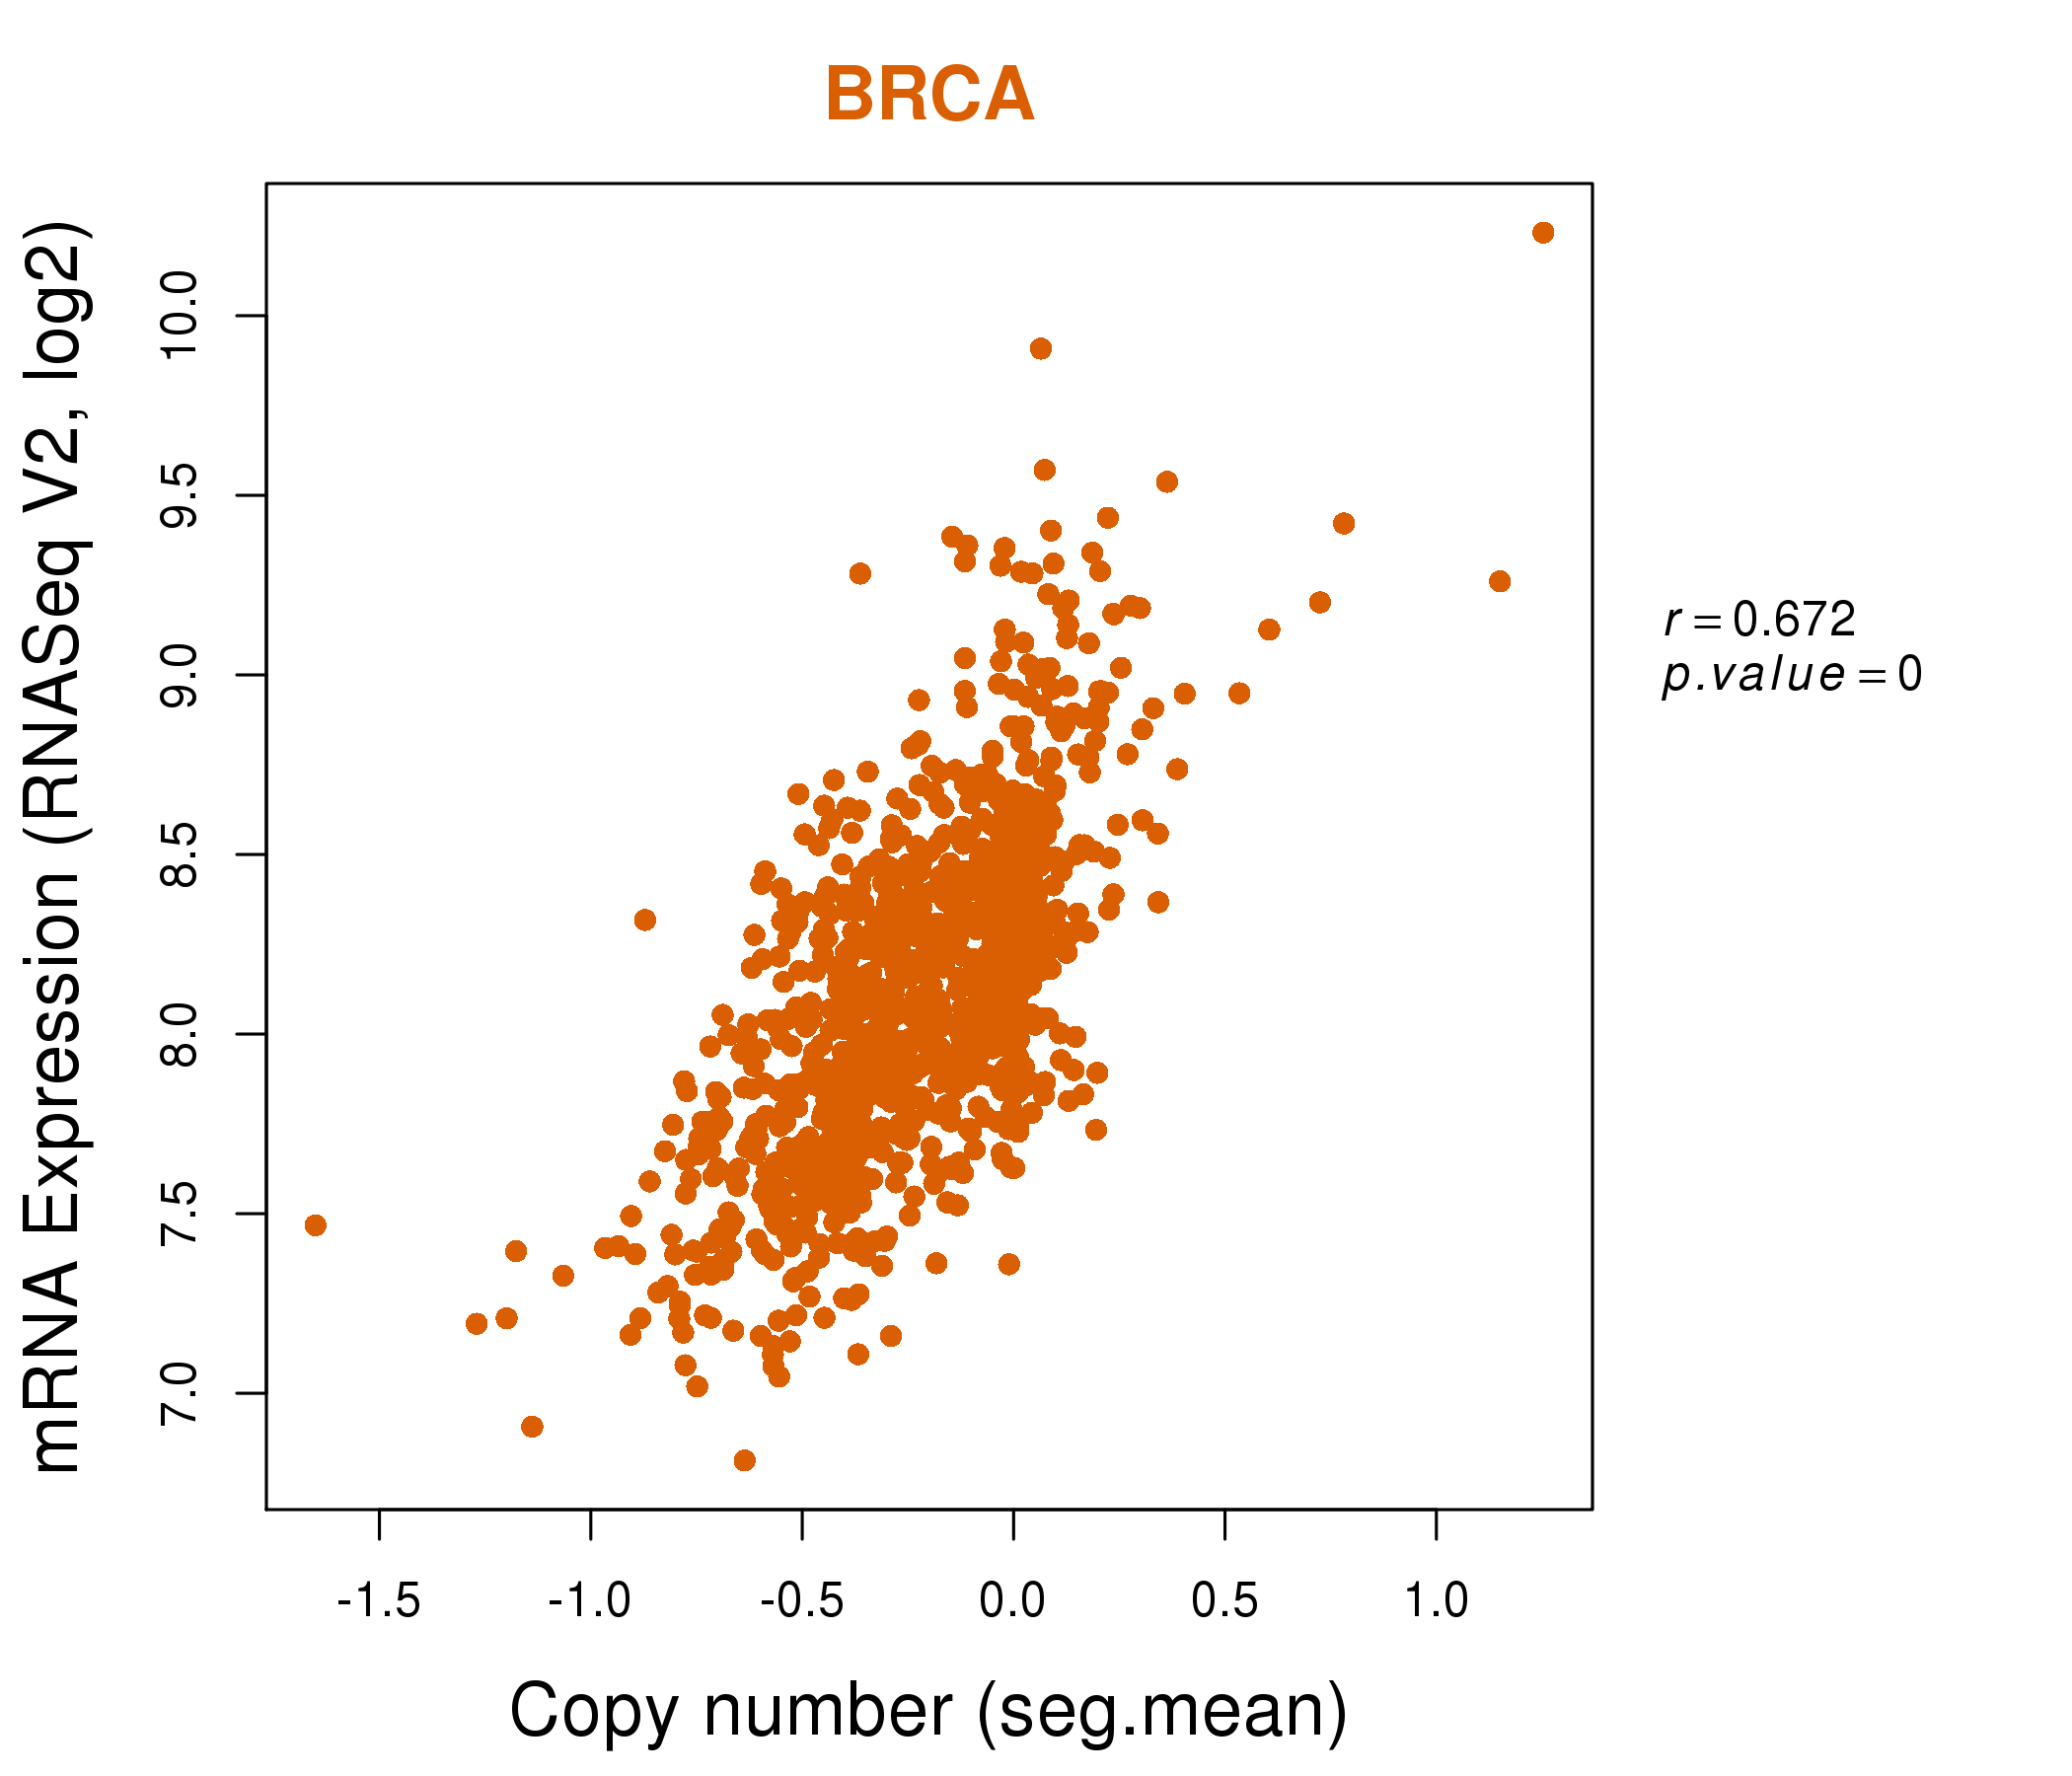
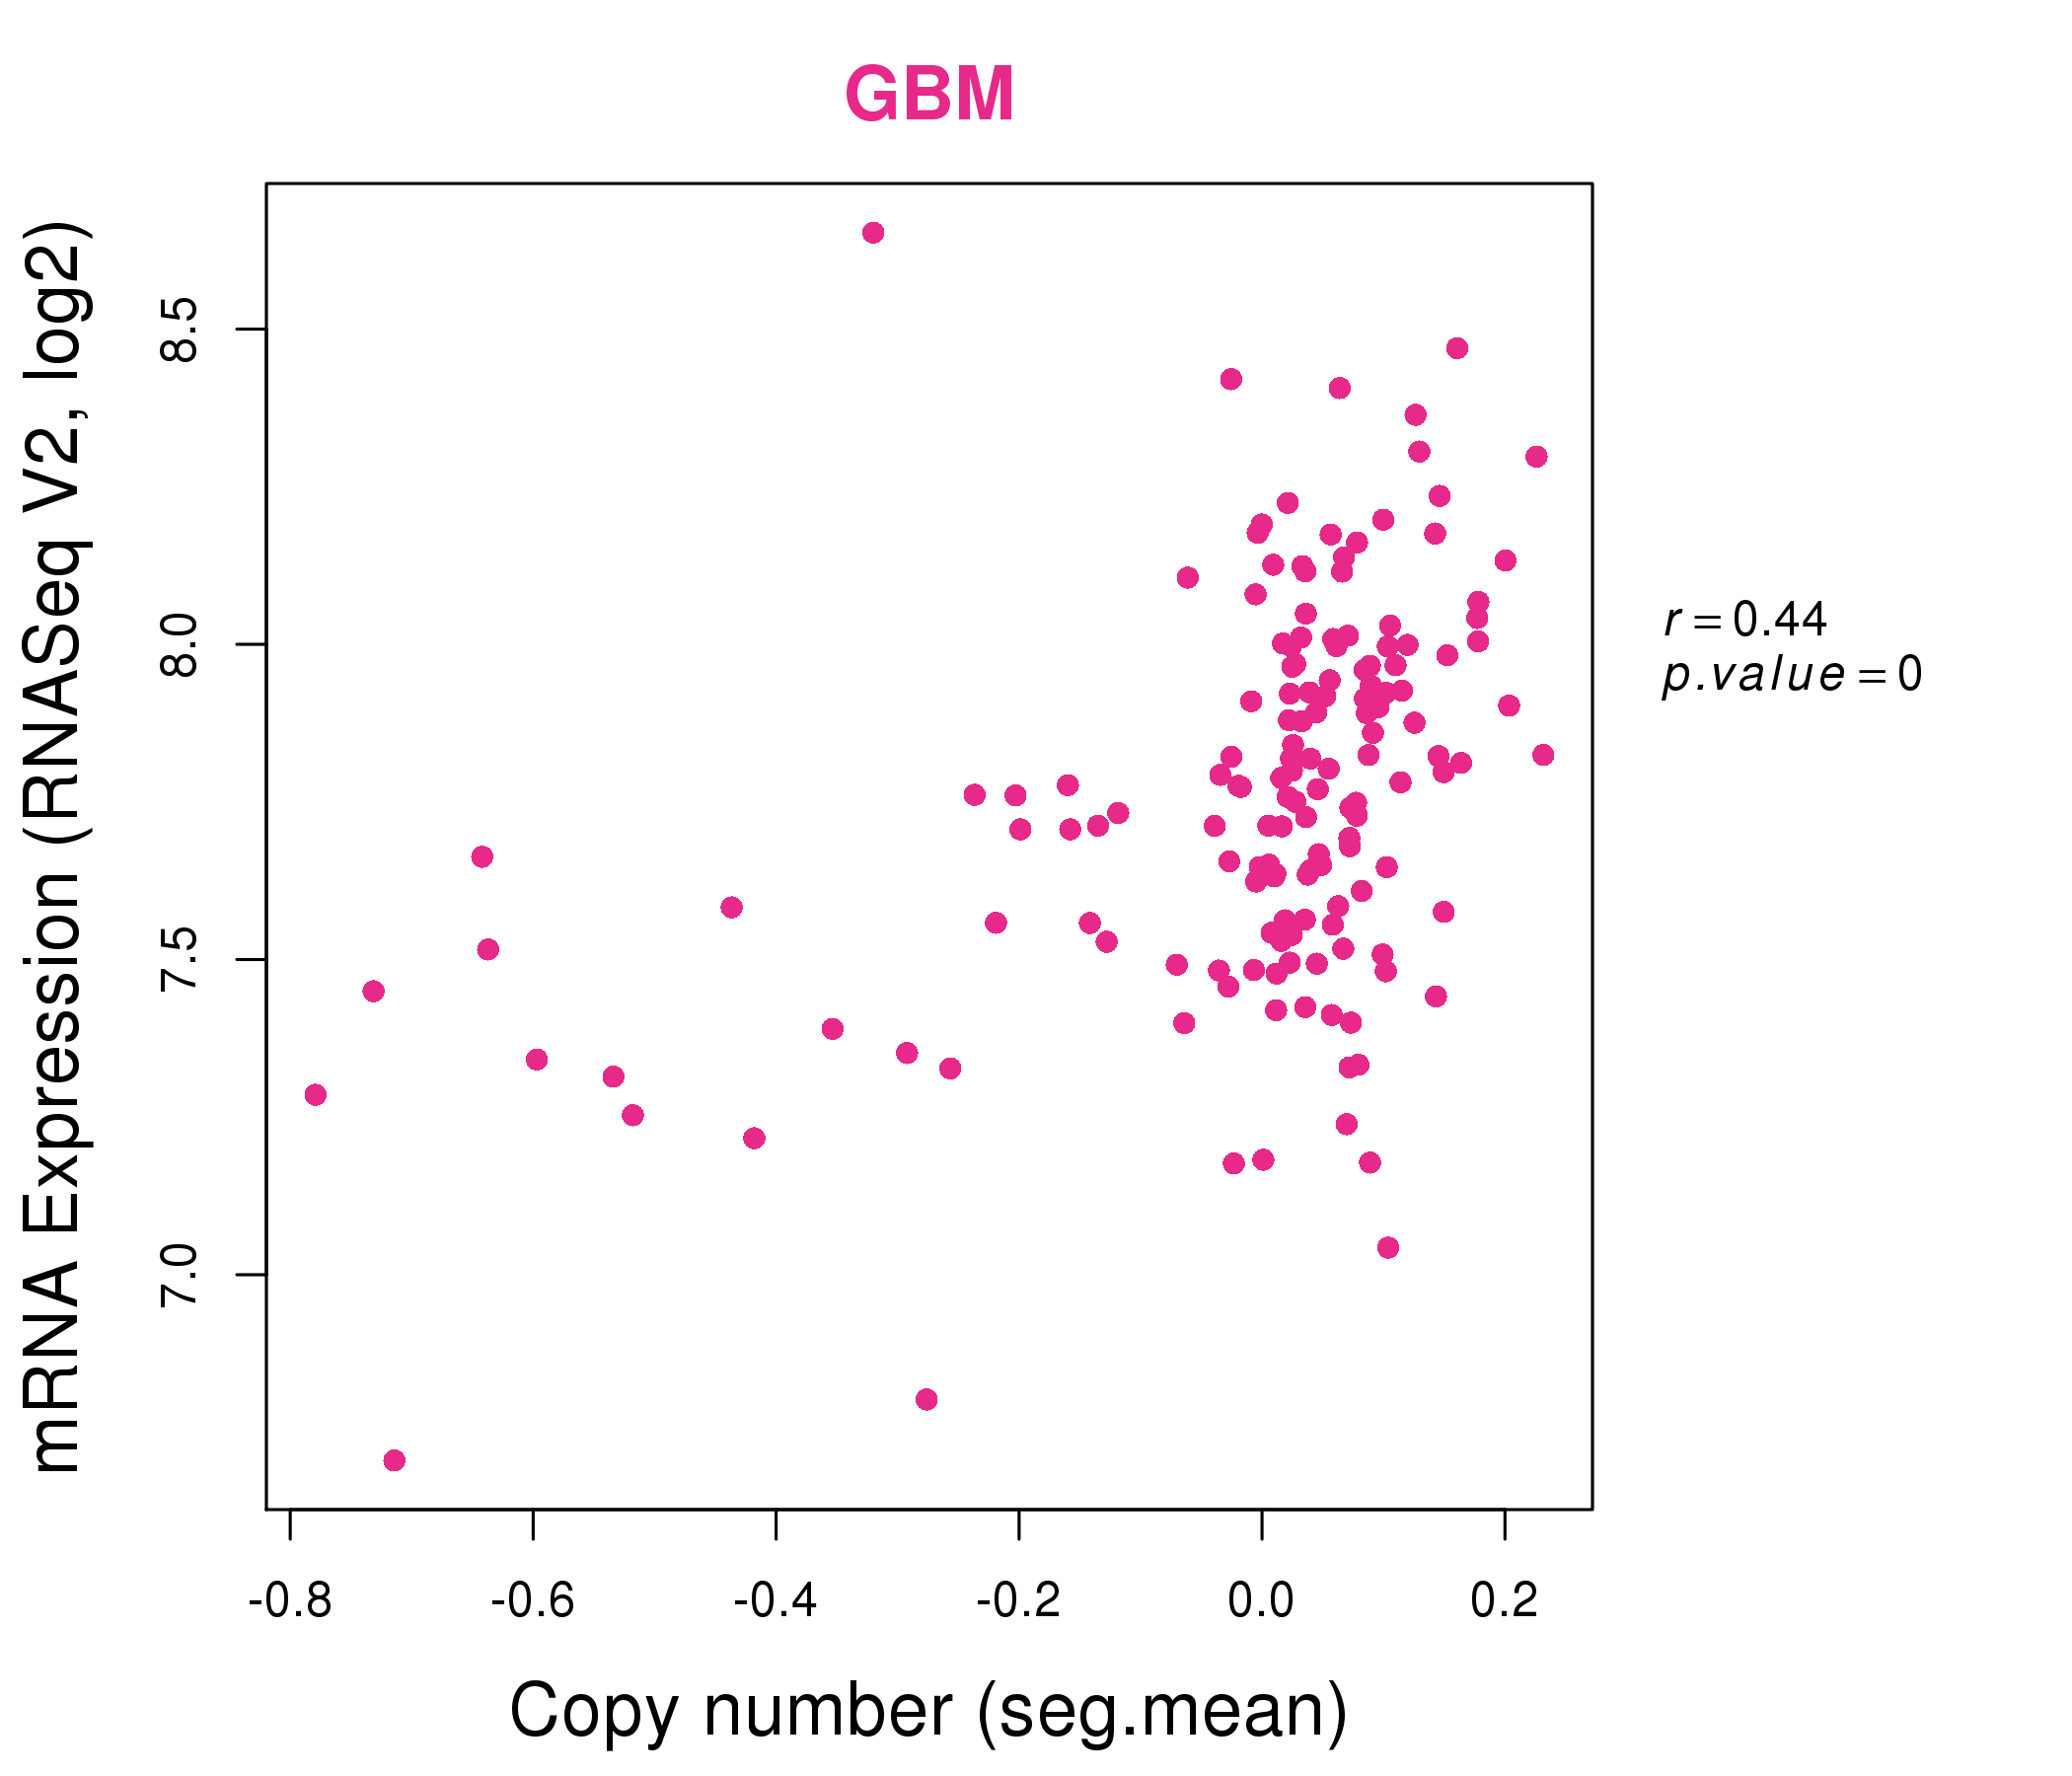
| * This plots show the correlation between CNV and gene expression. |
: Open all plots for all cancer types
 |
|
 |
|
| Top |
| Gene-Gene Network Information |
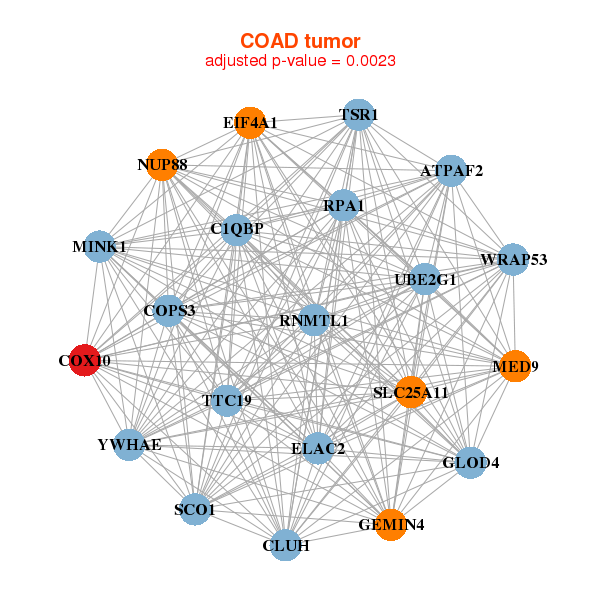
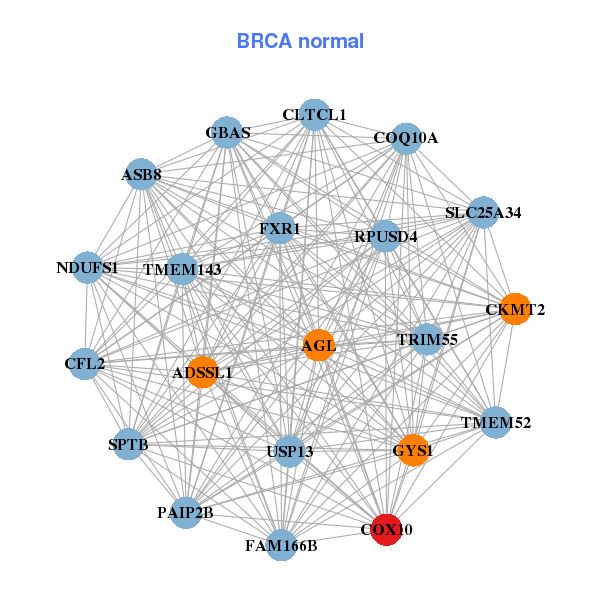
| * Co-Expression network figures were drawn using R package igraph. Only the top 20 genes with the highest correlations were shown. Red circle: input gene, orange circle: cell metabolism gene, sky circle: other gene |
: Open all plots for all cancer types
 |
|
| GID4,C1QBP,COPS3,COX10,DHX33,EIF4A1,EIF5AL1, ELAC2,FAM64A,GEMIN4,GSG2,CLUH,MYBBP1A,NUP88, RPA1,SCO1,SENP3,TSR1,TTC19,YWHAE,ZNF286A | ADSSL1,AGL,ASB8,CFL2,CKMT2,CLTCL1,COQ10A, COX10,FAM166B,FXR1,GBAS,GYS1,NDUFS1,PAIP2B, RPUSD4,SLC25A34,SPTB,TMEM143,TMEM52,TRIM55,USP13 |
 |
|
| ATPAF2,C1QBP,COPS3,COX10,EIF4A1,ELAC2,GEMIN4, GLOD4,CLUH,MED9,MINK1,NUP88,RNMTL1,RPA1, SCO1,SLC25A11,TSR1,TTC19,UBE2G1,WRAP53,YWHAE | ACTR5,FAM210A,C19orf57,COX10,DLAT,ERAL1,GOT1, HN1L,MARS2,MCCC1,MEST,MLYCD,MRPS30,PDHA1, PTCD3,QRSL1,RCL1,SHQ1,STARD7,SUPV3L1,TBRG4 |

| * Co-Expression network figures were drawn using R package igraph. Only the top 20 genes with the highest correlations were shown. Red circle: input gene, orange circle: cell metabolism gene, sky circle: other gene |
: Open all plots for all cancer types
| Top |
: Open all interacting genes' information including KEGG pathway for all interacting genes from DAVID
| Top |
| Pharmacological Information for COX10 |
| There's no related Drug. |
| Top |
| Cross referenced IDs for COX10 |
| * We obtained these cross-references from Uniprot database. It covers 150 different DBs, 18 categories. http://www.uniprot.org/help/cross_references_section |
: Open all cross reference information
|
Copyright © 2016-Present - The Univsersity of Texas Health Science Center at Houston @ |