|
||||||||||||||||||||
| |
| Phenotypic Information (metabolism pathway, cancer, disease, phenome) |
| |
| |
| Gene-Gene Network Information: Co-Expression Network, Interacting Genes & KEGG |
| |
|


| Gene Summary for CP |
| Basic gene info. | Gene symbol | CP |
| Gene name | ceruloplasmin (ferroxidase) | |
| Synonyms | CP-2 | |
| Cytomap | UCSC genome browser: 3q23-q25 | |
| Genomic location | chr3 :148880196-148939832 | |
| Type of gene | protein-coding | |
| RefGenes | NM_000096.3, NR_046371.1, | |
| Ensembl id | ENSG00000047457 | |
| Description | ceruloplasmin | |
| Modification date | 20141219 | |
| dbXrefs | MIM : 117700 | |
| HGNC : HGNC | ||
| Ensembl : ENSG00000047457 | ||
| HPRD : 00317 | ||
| Vega : OTTHUMG00000159563 | ||
| Protein | UniProt: P00450 go to UniProt's Cross Reference DB Table | |
| Expression | CleanEX: HS_CP | |
| BioGPS: 1356 | ||
| Gene Expression Atlas: ENSG00000047457 | ||
| The Human Protein Atlas: ENSG00000047457 | ||
| Pathway | NCI Pathway Interaction Database: CP | |
| KEGG: CP | ||
| REACTOME: CP | ||
| ConsensusPathDB | ||
| Pathway Commons: CP | ||
| Metabolism | MetaCyc: CP | |
| HUMANCyc: CP | ||
| Regulation | Ensembl's Regulation: ENSG00000047457 | |
| miRBase: chr3 :148,880,196-148,939,832 | ||
| TargetScan: NM_000096 | ||
| cisRED: ENSG00000047457 | ||
| Context | iHOP: CP | |
| cancer metabolism search in PubMed: CP | ||
| UCL Cancer Institute: CP | ||
| Assigned class in ccmGDB | A - This gene has a literature evidence and it belongs to cancer gene. | |
| References showing role of CP in cancer cell metabolism | 1. Lokamani I, Looi ML, Md Ali SA, Mohd Dali AZ, Ahmad Annuar MA, et al. (2014) Gelsolin and ceruloplasmin as potential predictive biomarkers for cervical cancer by 2D-DIGE proteomics analysis. Pathol Oncol Res 20: 119-129. doi: 10.1007/s12253-013-9670-9. go to article 2. Babich PS, Skvortsov AN, Rusconi P, Tsymbalenko NV, Mutanen M, et al. (2013) Non-hepatic tumors change the activity of genes encoding copper trafficking proteins in the liver. Cancer Biol Ther 14: 614-624. doi: 10.4161/cbt.24594. pmid: 3742491. go to article | |
| Top |
| Phenotypic Information for CP(metabolism pathway, cancer, disease, phenome) |
| Cancer | CGAP: CP |
| Familial Cancer Database: CP | |
| * This gene is included in those cancer gene databases. |
|
|
|
|
|
|
| ||||||||||||||
Oncogene 1 | Significant driver gene in | |||||||||||||||||||
| cf) number; DB name 1 Oncogene; http://nar.oxfordjournals.org/content/35/suppl_1/D721.long, 2 Tumor Suppressor gene; https://bioinfo.uth.edu/TSGene/, 3 Cancer Gene Census; http://www.nature.com/nrc/journal/v4/n3/abs/nrc1299.html, 4 CancerGenes; http://nar.oxfordjournals.org/content/35/suppl_1/D721.long, 5 Network of Cancer Gene; http://ncg.kcl.ac.uk/index.php, 1Therapeutic Vulnerabilities in Cancer; http://cbio.mskcc.org/cancergenomics/statius/ |
| KEGG_PORPHYRIN_AND_CHLOROPHYLL_METABOLISM | |
| OMIM | 117700; gene. 604290; phenotype. |
| Orphanet | 48818; Aceruloplasminemia. |
| Disease | KEGG Disease: CP |
| MedGen: CP (Human Medical Genetics with Condition) | |
| ClinVar: CP | |
| Phenotype | MGI: CP (International Mouse Phenotyping Consortium) |
| PhenomicDB: CP | |
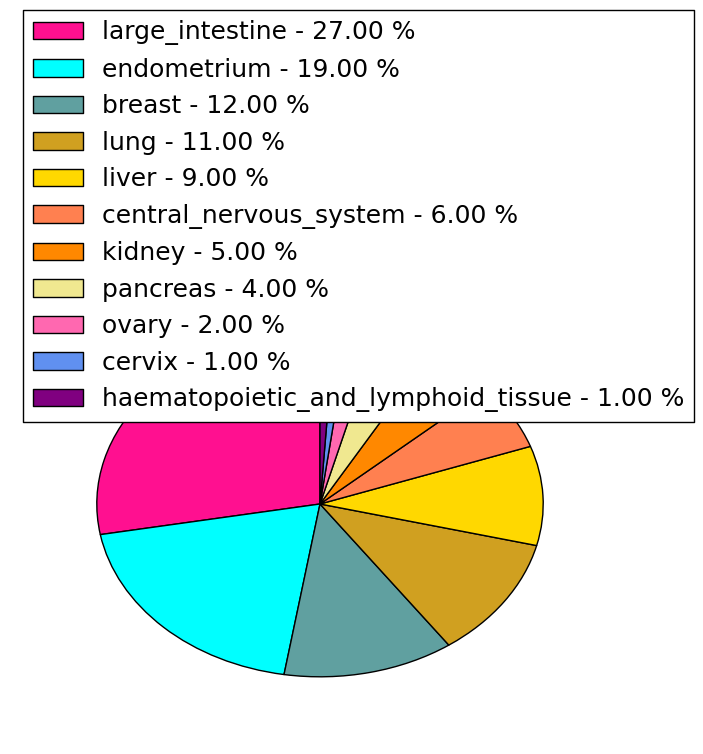
| Mutations for CP |
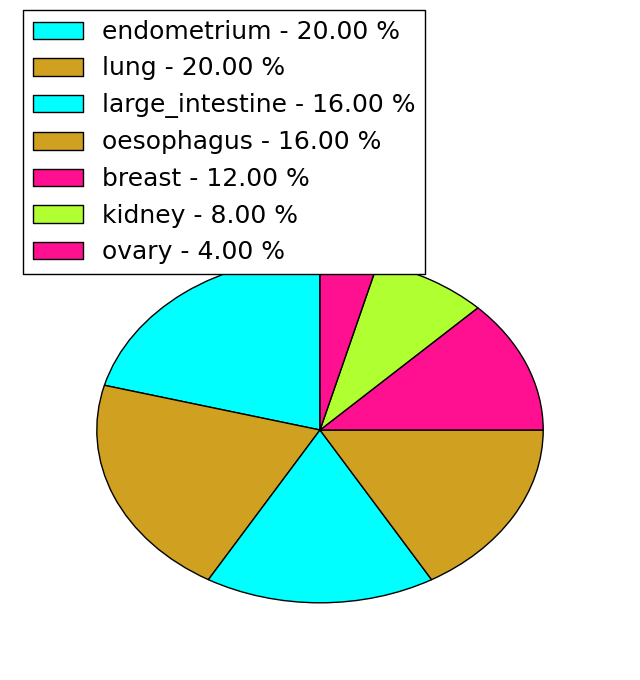
| * Under tables are showing count per each tissue to give us broad intuition about tissue specific mutation patterns.You can go to the detailed page for each mutation database's web site. |
| - Statistics for Tissue and Mutation type | Top |
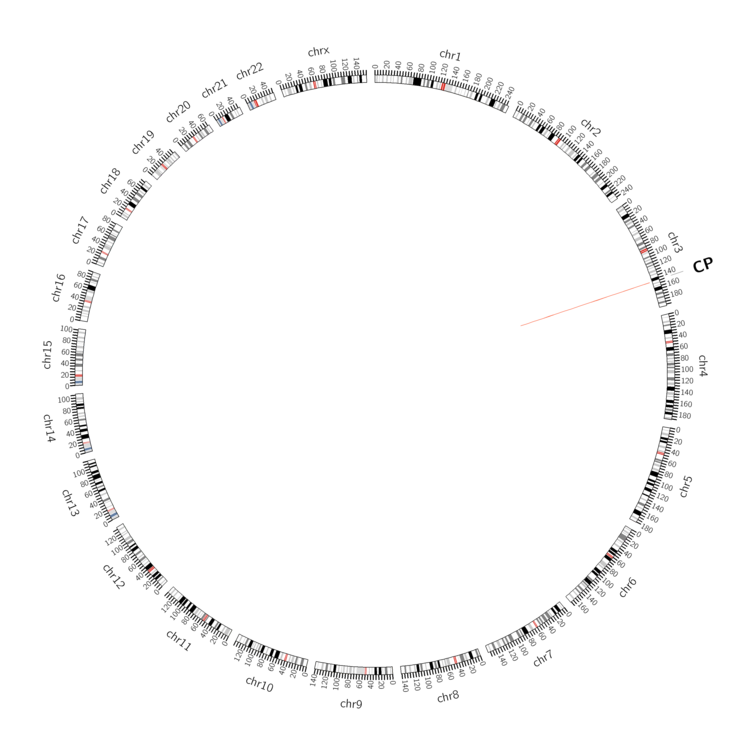 |
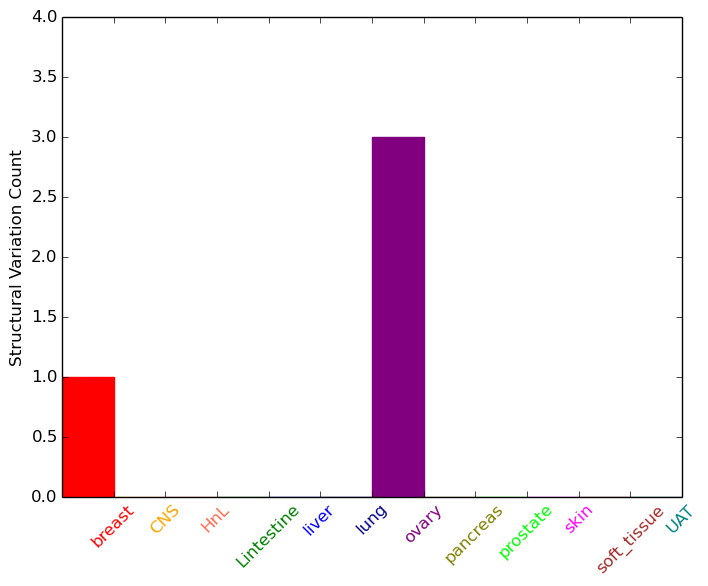
| - For Inter-chromosomal Variations |
| * Inter-chromosomal variantions includes 'interchromosomal amplicon to amplicon', 'interchromosomal amplicon to non-amplified dna', 'interchromosomal insertion', 'Interchromosomal unknown type'. |
 |
| - For Intra-chromosomal Variations |
| * Intra-chromosomal variantions includes 'intrachromosomal amplicon to amplicon', 'intrachromosomal amplicon to non-amplified dna', 'intrachromosomal deletion', 'intrachromosomal fold-back inversion', 'intrachromosomal inversion', 'intrachromosomal tandem duplication', 'Intrachromosomal unknown type', 'intrachromosomal with inverted orientation', 'intrachromosomal with non-inverted orientation'. |
 |
| Sample | Symbol_a | Chr_a | Start_a | End_a | Symbol_b | Chr_b | Start_b | End_b |
| breast | CP | chr3 | 148913662 | 148913662 | CP | chr3 | 148921377 | 148921377 |
| ovary | CP | chr3 | 148901465 | 148901485 | PHF16 | chr23 | 46843716 | 46843736 |
| ovary | CP | chr3 | 148914523 | 148914543 | CP | chr3 | 148921744 | 148921764 |
| ovary | CP | chr3 | 148925430 | 148925450 | chr3 | 149063055 | 149063075 |
| cf) Tissue number; Tissue name (1;Breast, 2;Central_nervous_system, 3;Haematopoietic_and_lymphoid_tissue, 4;Large_intestine, 5;Liver, 6;Lung, 7;Ovary, 8;Pancreas, 9;Prostate, 10;Skin, 11;Soft_tissue, 12;Upper_aerodigestive_tract) |
| * From mRNA Sanger sequences, Chitars2.0 arranged chimeric transcripts. This table shows CP related fusion information. |
| ID | Head Gene | Tail Gene | Accession | Gene_a | qStart_a | qEnd_a | Chromosome_a | tStart_a | tEnd_a | Gene_a | qStart_a | qEnd_a | Chromosome_a | tStart_a | tEnd_a |
| BG945303 | ATXN7 | 1 | 436 | 3 | 63950706 | 63951571 | CP | 434 | 453 | 3 | 148911232 | 148911251 | |
| Top |
| There's no copy number variation information in COSMIC data for this gene. |
| Top |
|
 |
| Top |
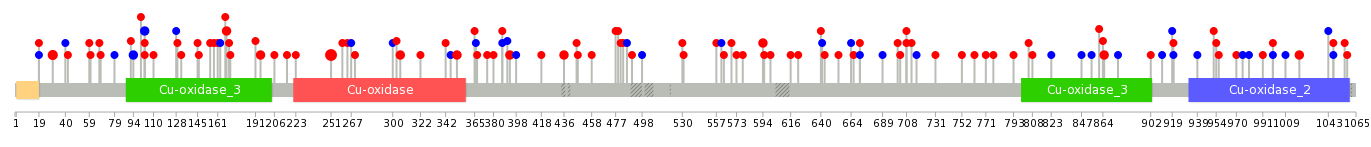
| Stat. for Non-Synonymous SNVs (# total SNVs=96) | (# total SNVs=24) |
 |  |
(# total SNVs=2) | (# total SNVs=0) |
 |
| Top |
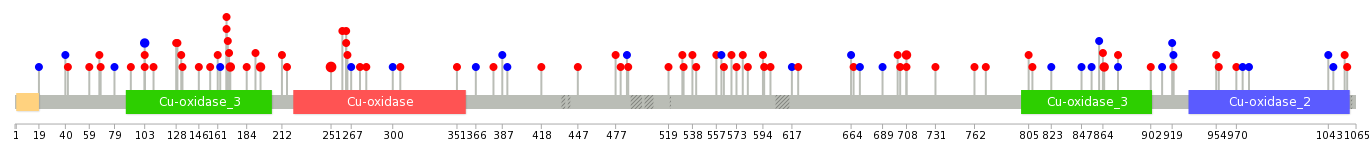
| * When you move the cursor on each content, you can see more deailed mutation information on the Tooltip. Those are primary_site,primary_histology,mutation(aa),pubmedID. |
| GRCh37 position | Mutation(aa) | Unique sampleID count |
| chr3:148927028-148927028 | p.E251K | 7 |
| chr3:148939579-148939579 | p.? | 4 |
| chr3:148939490-148939490 | p.E30D | 3 |
| chr3:148927989-148927989 | p.S191* | 3 |
| chr3:148928058-148928058 | p.G168A | 2 |
| chr3:148897410-148897410 | p.S865F | 2 |
| chr3:148925268-148925268 | p.N306K | 2 |
| chr3:148927133-148927133 | p.E216* | 2 |
| chr3:148896220-148896220 | p.E954K | 2 |
| chr3:148930323-148930323 | p.D103D | 2 |
| Top |
|
 |
| Point Mutation/ Tissue ID | 1 | 2 | 3 | 4 | 5 | 6 | 7 | 8 | 9 | 10 | 11 | 12 | 13 | 14 | 15 | 16 | 17 | 18 | 19 | 20 |
| # sample | 1 | 6 | 2 | 14 | 5 | 4 | 2 | 2 | 8 | 8 | 2 | 1 | 14 | 9 | 17 | |||||
| # mutation | 1 | 6 | 2 | 17 | 5 | 4 | 2 | 2 | 8 | 8 | 2 | 1 | 15 | 13 | 19 | |||||
| nonsynonymous SNV | 1 | 3 | 2 | 13 | 5 | 4 | 1 | 2 | 7 | 3 | 1 | 1 | 11 | 8 | 14 | |||||
| synonymous SNV | 3 | 4 | 1 | 1 | 5 | 1 | 4 | 5 | 5 |
| cf) Tissue ID; Tissue type (1; BLCA[Bladder Urothelial Carcinoma], 2; BRCA[Breast invasive carcinoma], 3; CESC[Cervical squamous cell carcinoma and endocervical adenocarcinoma], 4; COAD[Colon adenocarcinoma], 5; GBM[Glioblastoma multiforme], 6; Glioma Low Grade, 7; HNSC[Head and Neck squamous cell carcinoma], 8; KICH[Kidney Chromophobe], 9; KIRC[Kidney renal clear cell carcinoma], 10; KIRP[Kidney renal papillary cell carcinoma], 11; LAML[Acute Myeloid Leukemia], 12; LUAD[Lung adenocarcinoma], 13; LUSC[Lung squamous cell carcinoma], 14; OV[Ovarian serous cystadenocarcinoma ], 15; PAAD[Pancreatic adenocarcinoma], 16; PRAD[Prostate adenocarcinoma], 17; SKCM[Skin Cutaneous Melanoma], 18:STAD[Stomach adenocarcinoma], 19:THCA[Thyroid carcinoma], 20:UCEC[Uterine Corpus Endometrial Carcinoma]) |
| Top |
| * We represented just top 10 SNVs. When you move the cursor on each content, you can see more deailed mutation information on the Tooltip. Those are primary_site, primary_histology, mutation(aa), pubmedID. |
| Genomic Position | Mutation(aa) | Unique sampleID count |
| chr3:148927028 | p.E251K | 4 |
| chr3:148928050 | p.G195R | 2 |
| chr3:148897410 | p.D103D | 2 |
| chr3:148930323 | p.G708D | 2 |
| chr3:148903188 | p.D171N | 2 |
| chr3:148928058 | p.S865F | 2 |
| chr3:148927978 | p.G168V | 2 |
| chr3:148919898 | p.F600V | 1 |
| chr3:148930247 | p.N486N | 1 |
| chr3:148901366 | p.N263S | 1 |
| * Copy number data were extracted from TCGA using R package TCGA-Assembler. The URLs of all public data files on TCGA DCC data server were gathered on Jan-05-2015. Function ProcessCNAData in TCGA-Assembler package was used to obtain gene-level copy number value which is calculated as the average copy number of the genomic region of a gene. |
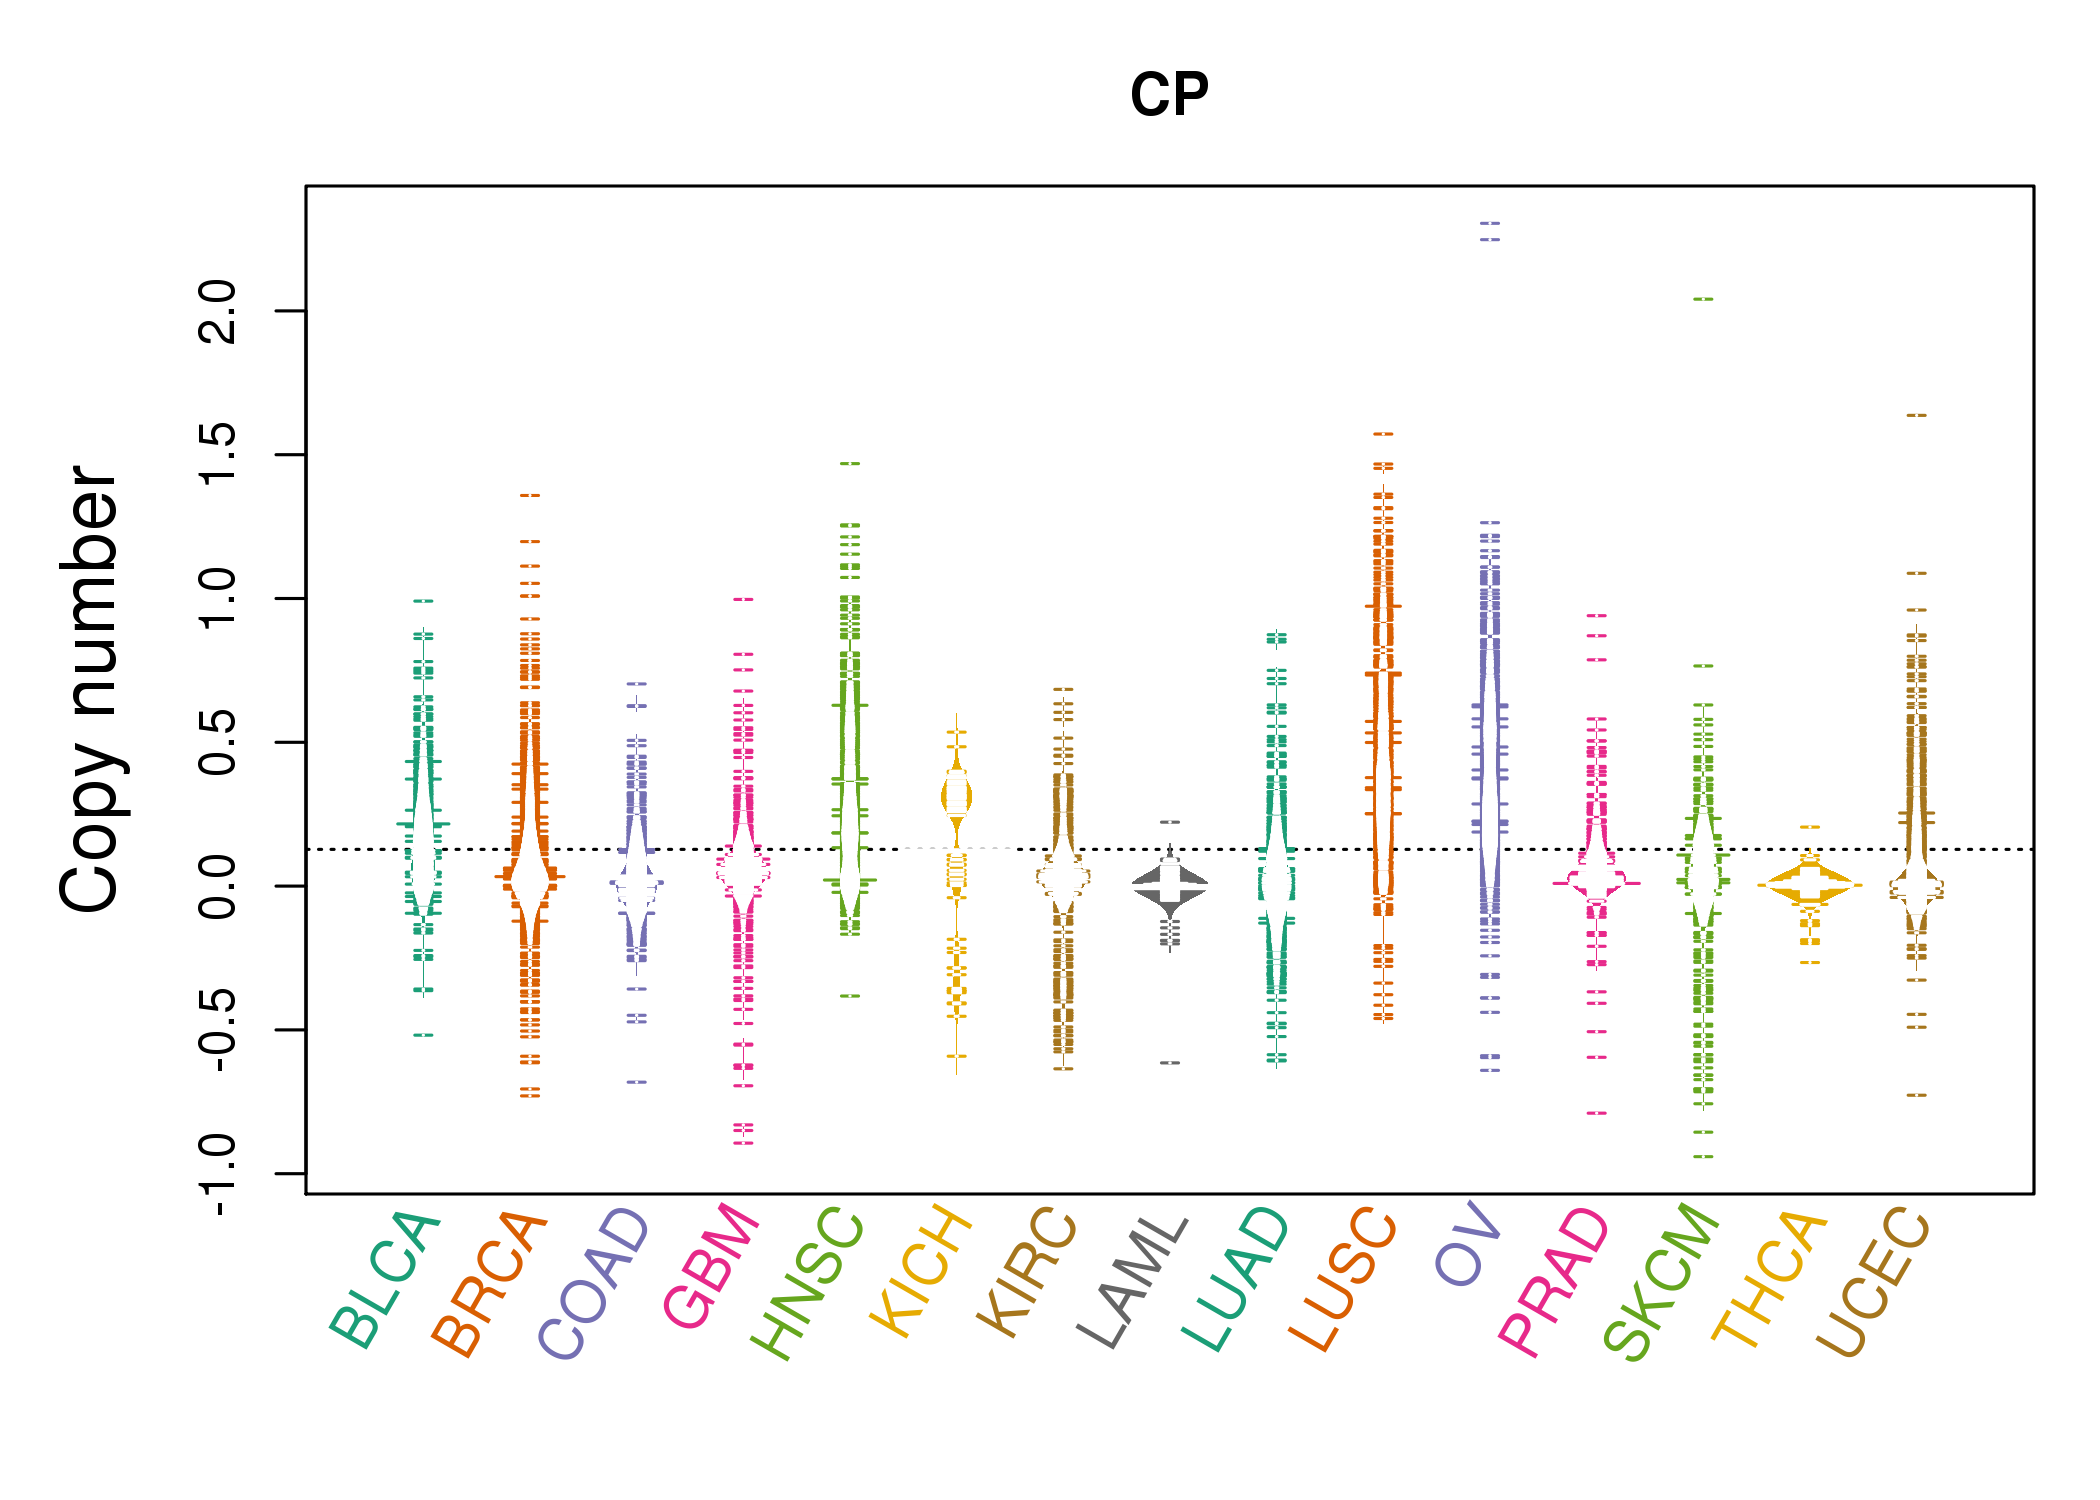 |
| cf) Tissue ID[Tissue type]: BLCA[Bladder Urothelial Carcinoma], BRCA[Breast invasive carcinoma], CESC[Cervical squamous cell carcinoma and endocervical adenocarcinoma], COAD[Colon adenocarcinoma], GBM[Glioblastoma multiforme], Glioma Low Grade, HNSC[Head and Neck squamous cell carcinoma], KICH[Kidney Chromophobe], KIRC[Kidney renal clear cell carcinoma], KIRP[Kidney renal papillary cell carcinoma], LAML[Acute Myeloid Leukemia], LUAD[Lung adenocarcinoma], LUSC[Lung squamous cell carcinoma], OV[Ovarian serous cystadenocarcinoma ], PAAD[Pancreatic adenocarcinoma], PRAD[Prostate adenocarcinoma], SKCM[Skin Cutaneous Melanoma], STAD[Stomach adenocarcinoma], THCA[Thyroid carcinoma], UCEC[Uterine Corpus Endometrial Carcinoma] |
| Top |
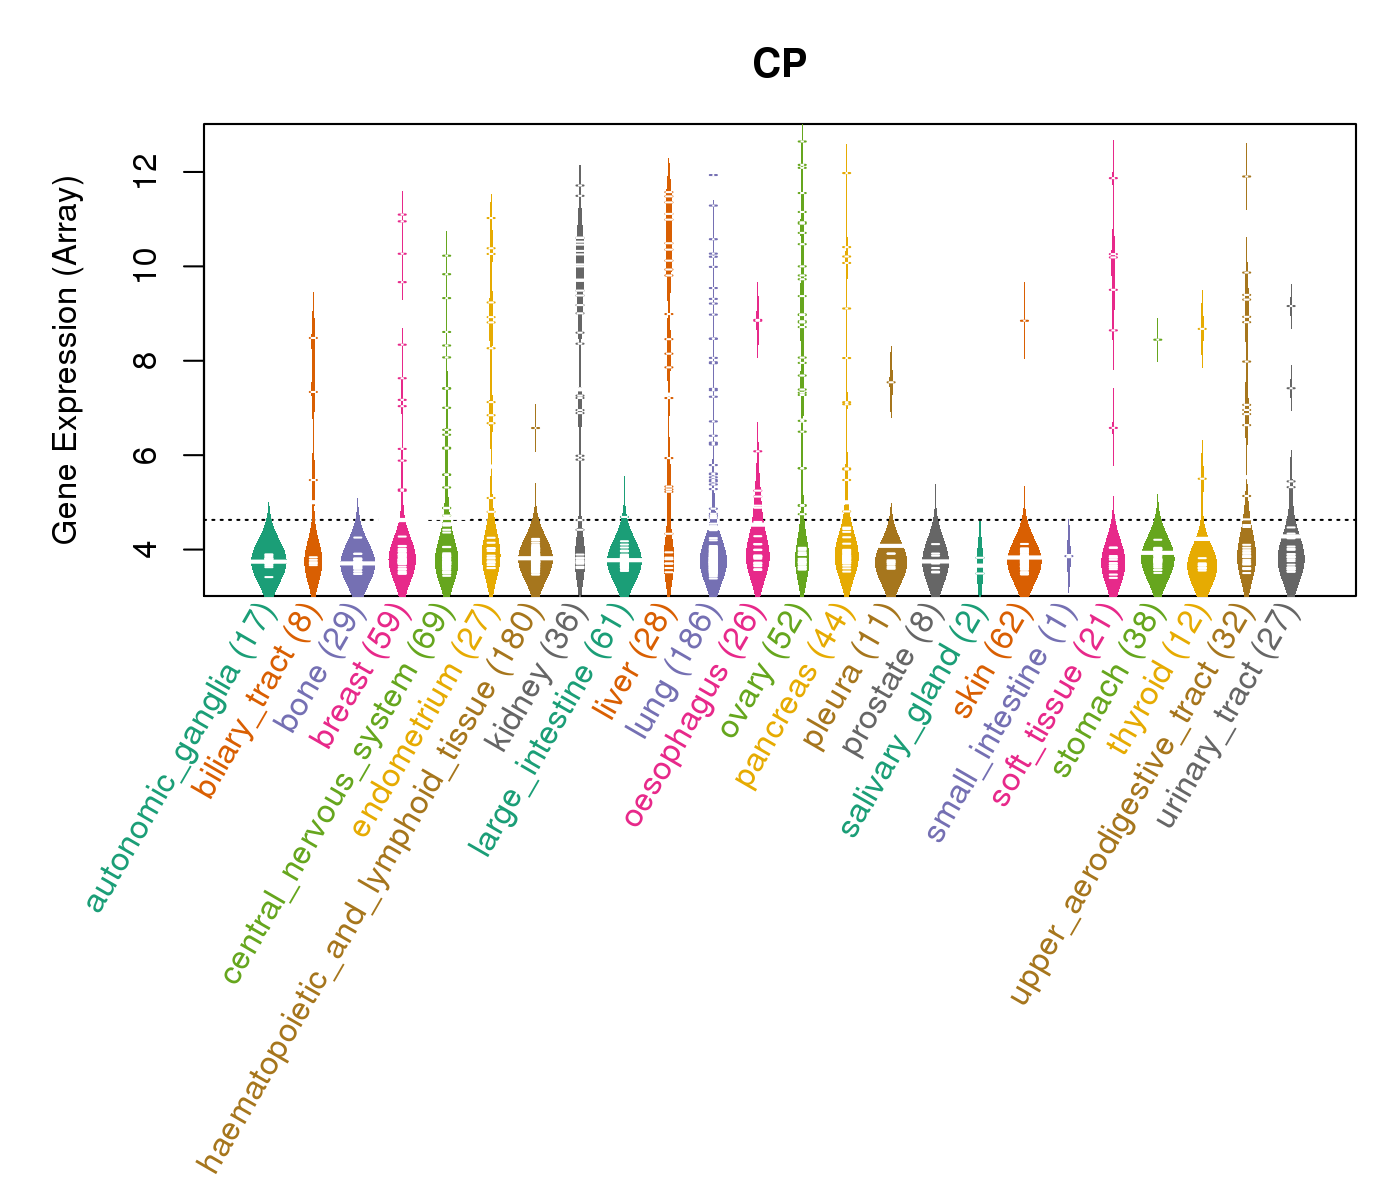
| Gene Expression for CP |
| * CCLE gene expression data were extracted from CCLE_Expression_Entrez_2012-10-18.res: Gene-centric RMA-normalized mRNA expression data. |
 |
| * Normalized gene expression data of RNASeqV2 was extracted from TCGA using R package TCGA-Assembler. The URLs of all public data files on TCGA DCC data server were gathered at Jan-05-2015. Only eight cancer types have enough normal control samples for differential expression analysis. (t test, adjusted p<0.05 (using Benjamini-Hochberg FDR)) |
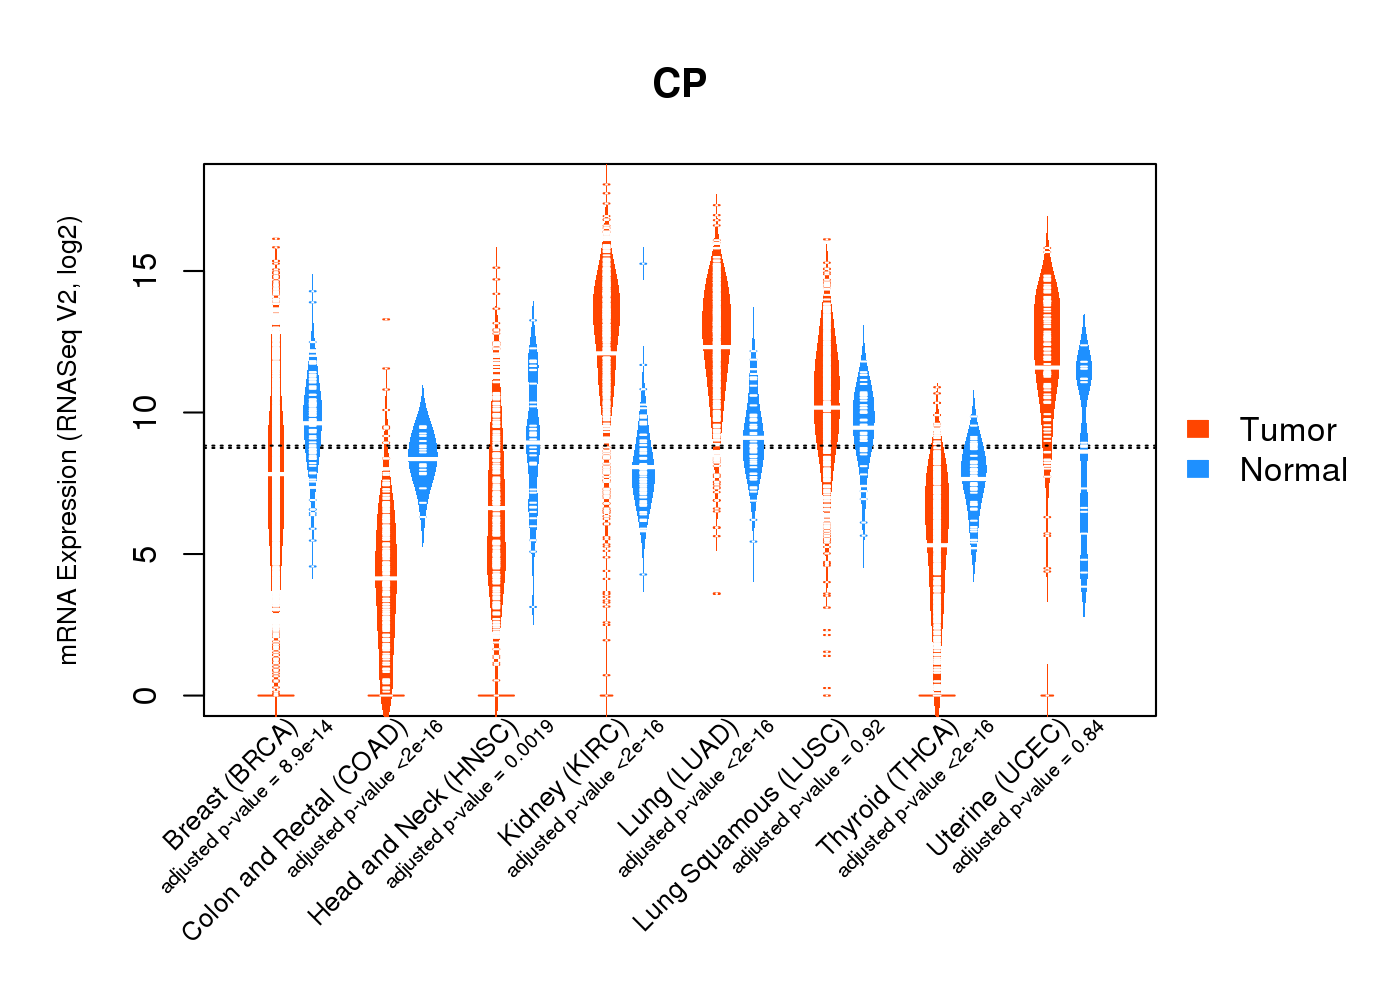 |
| Top |
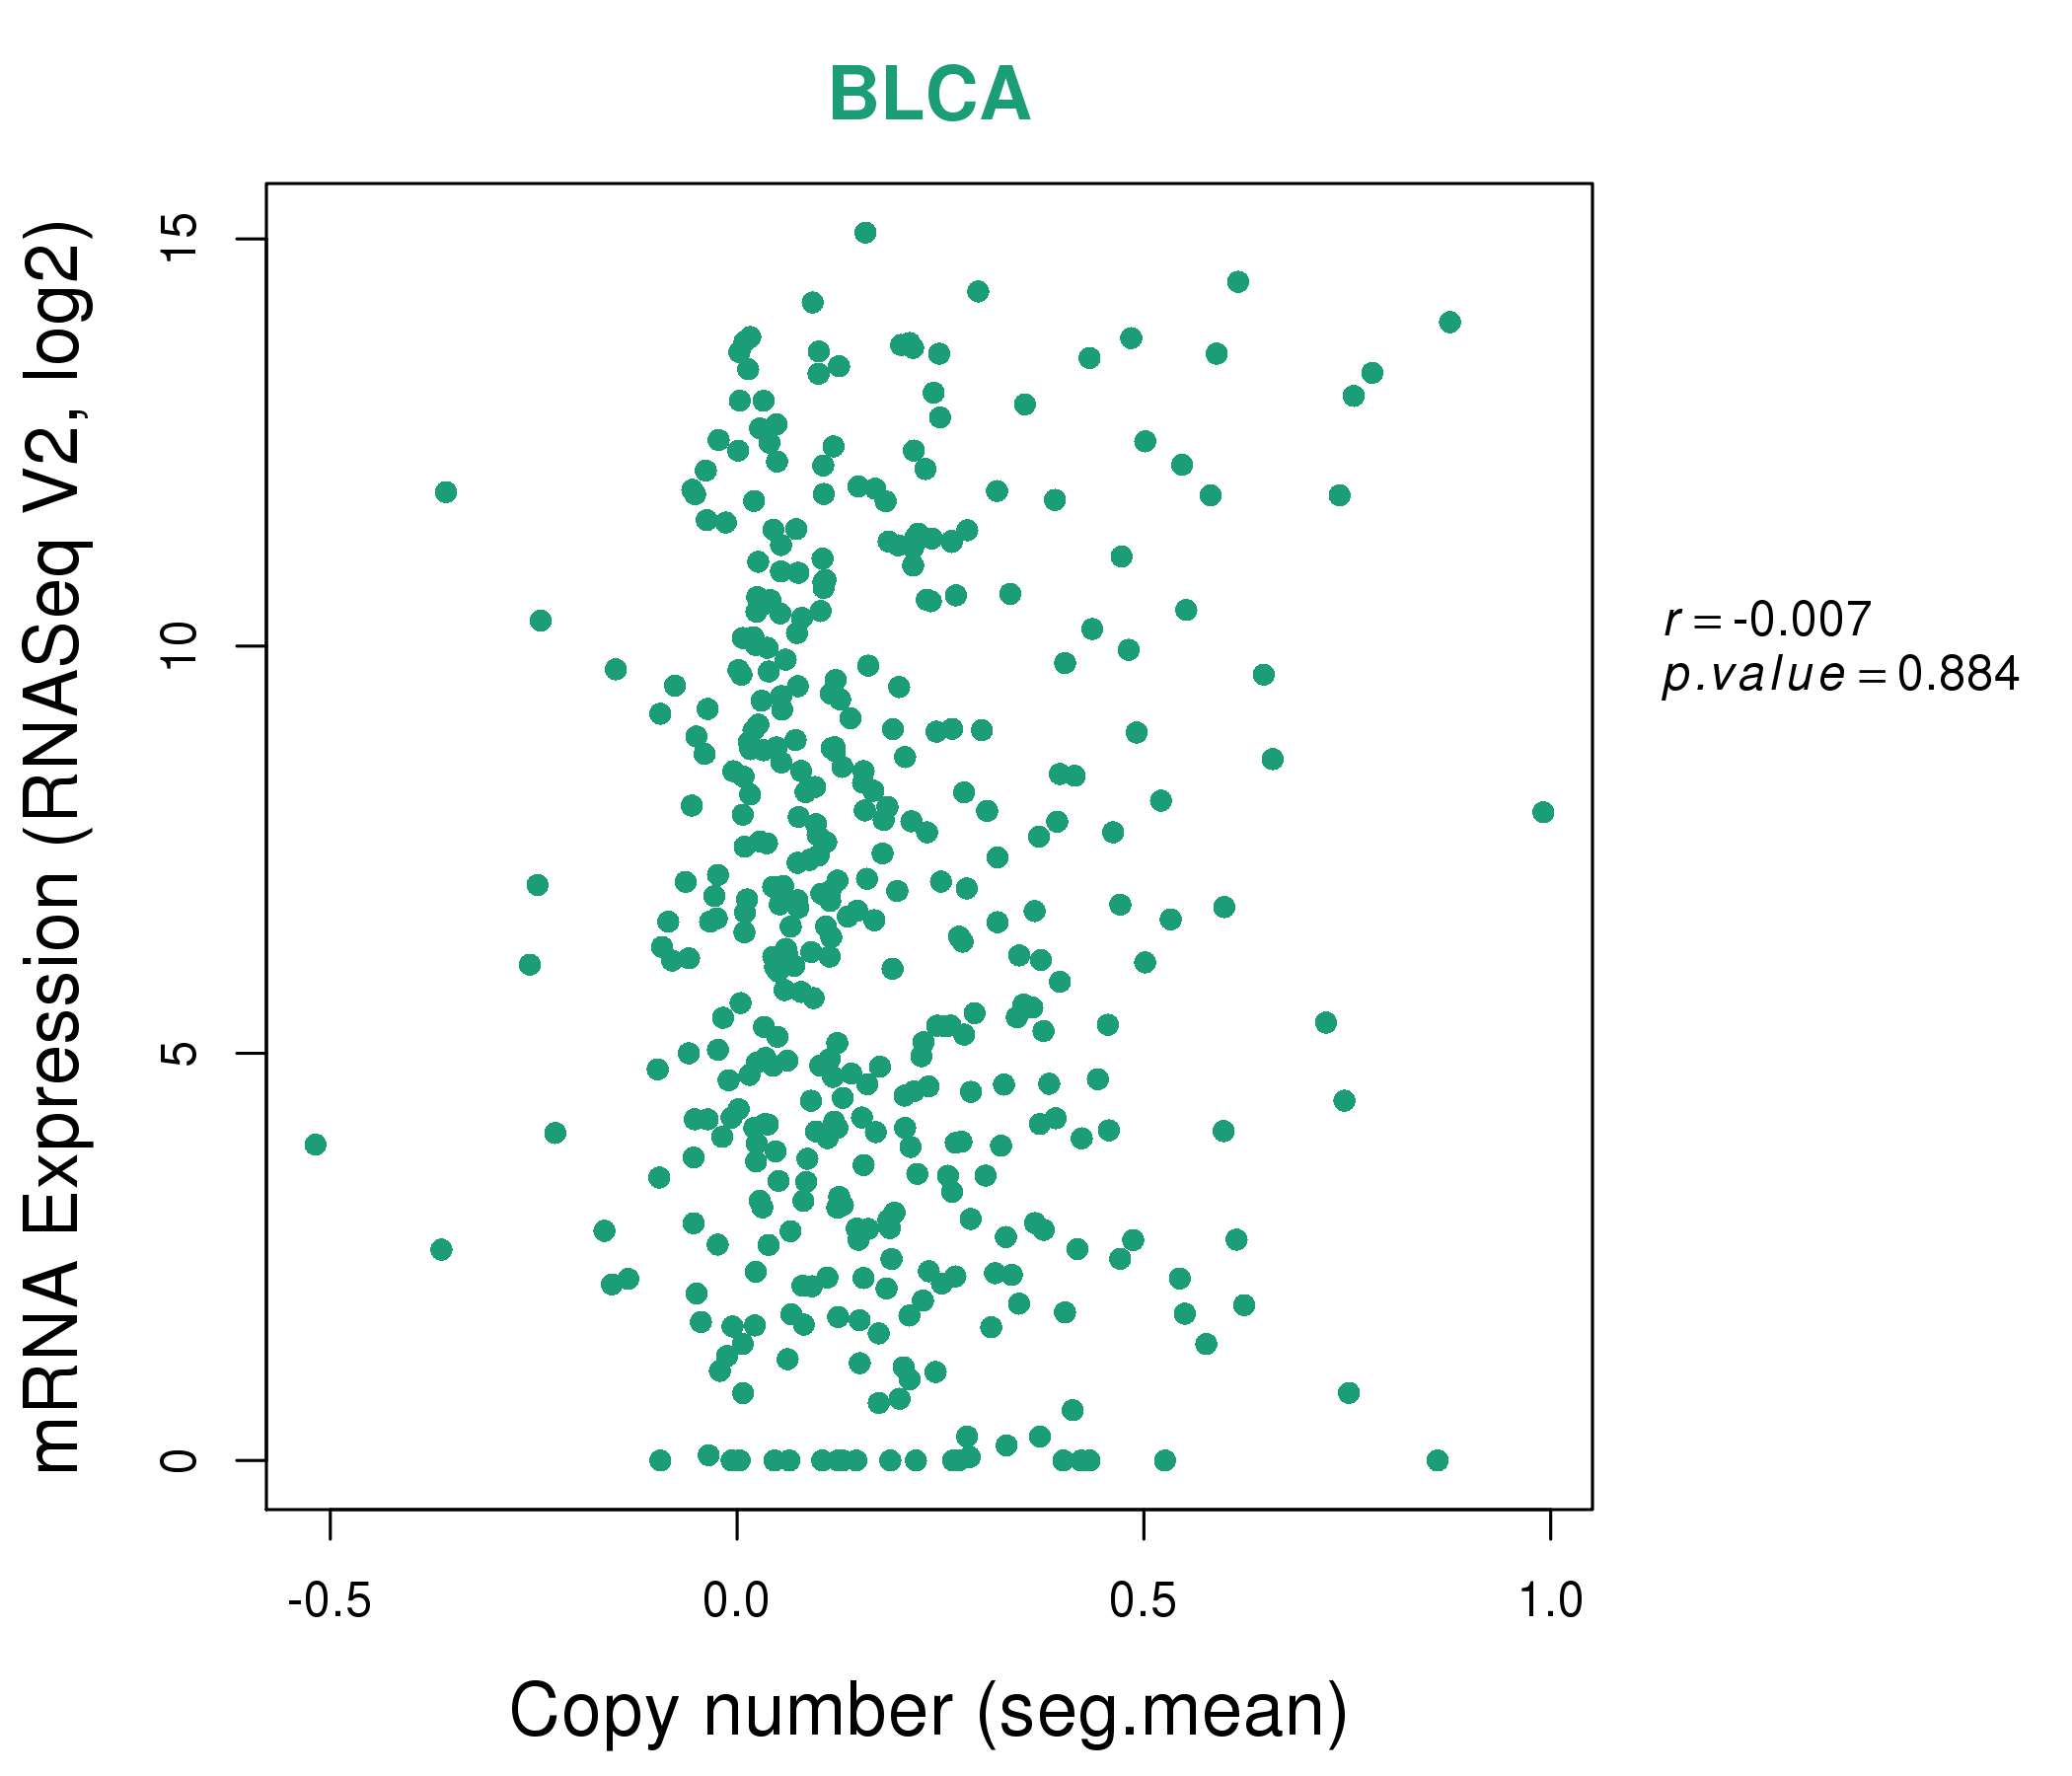
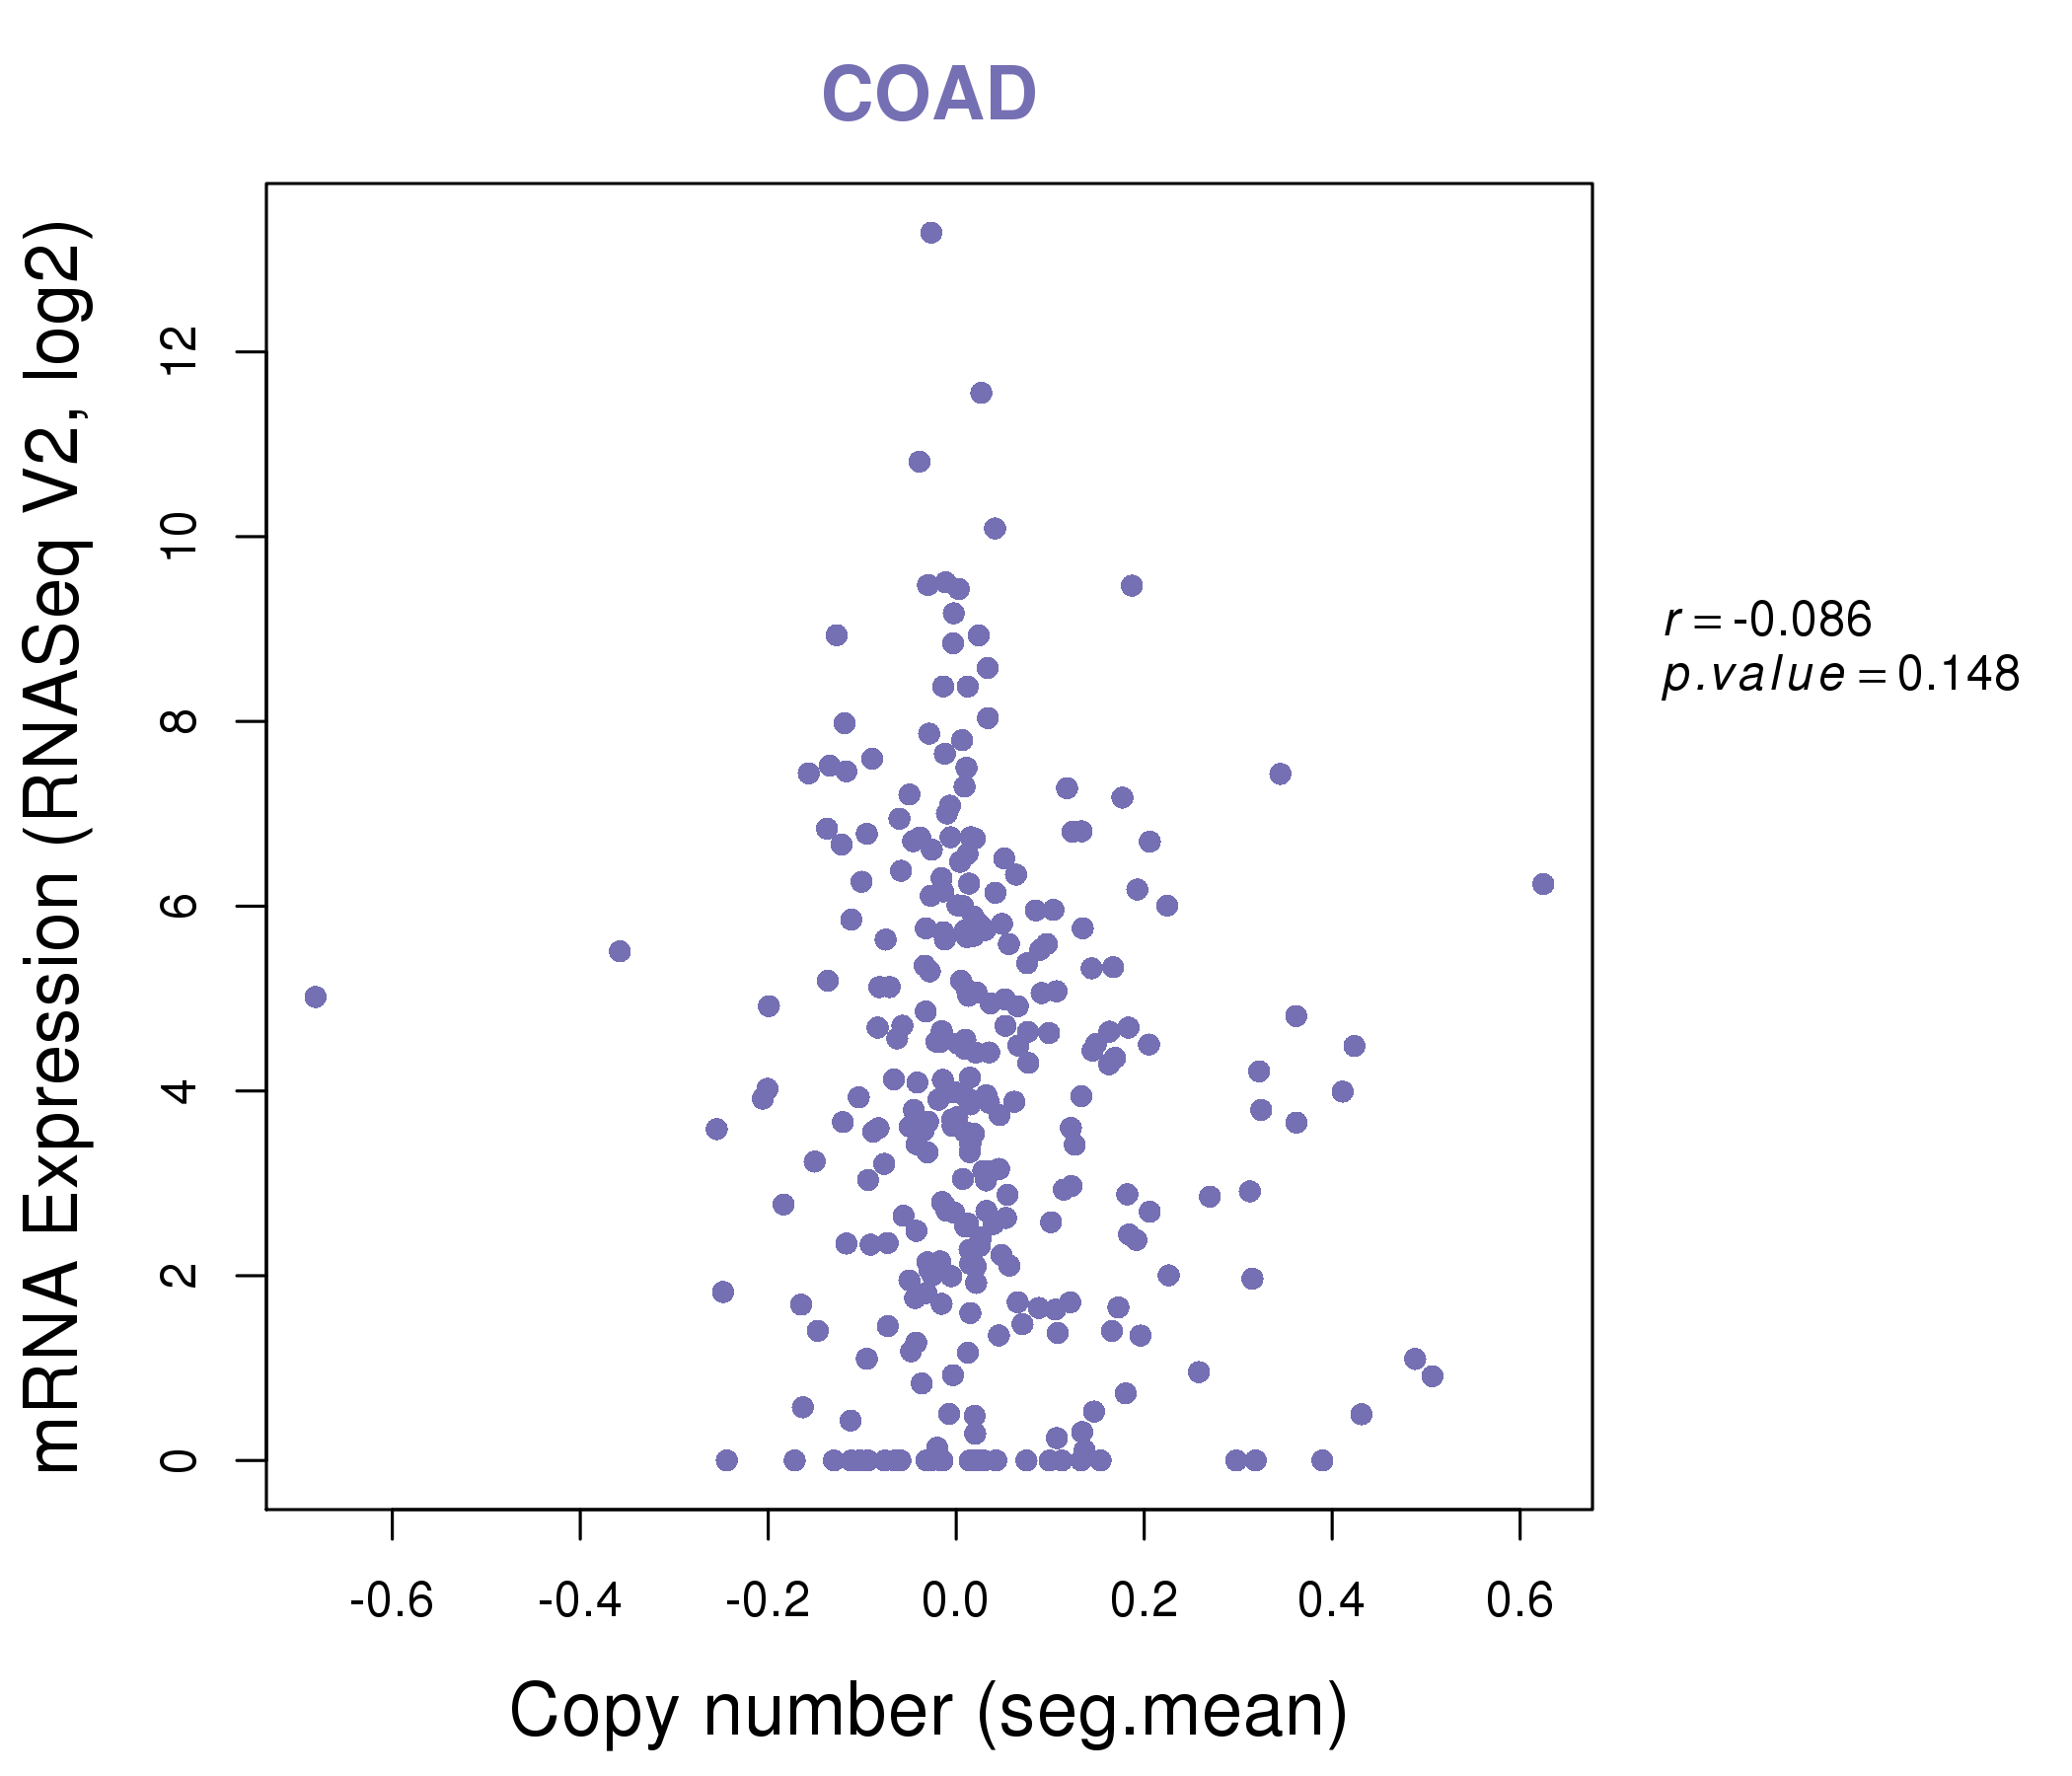
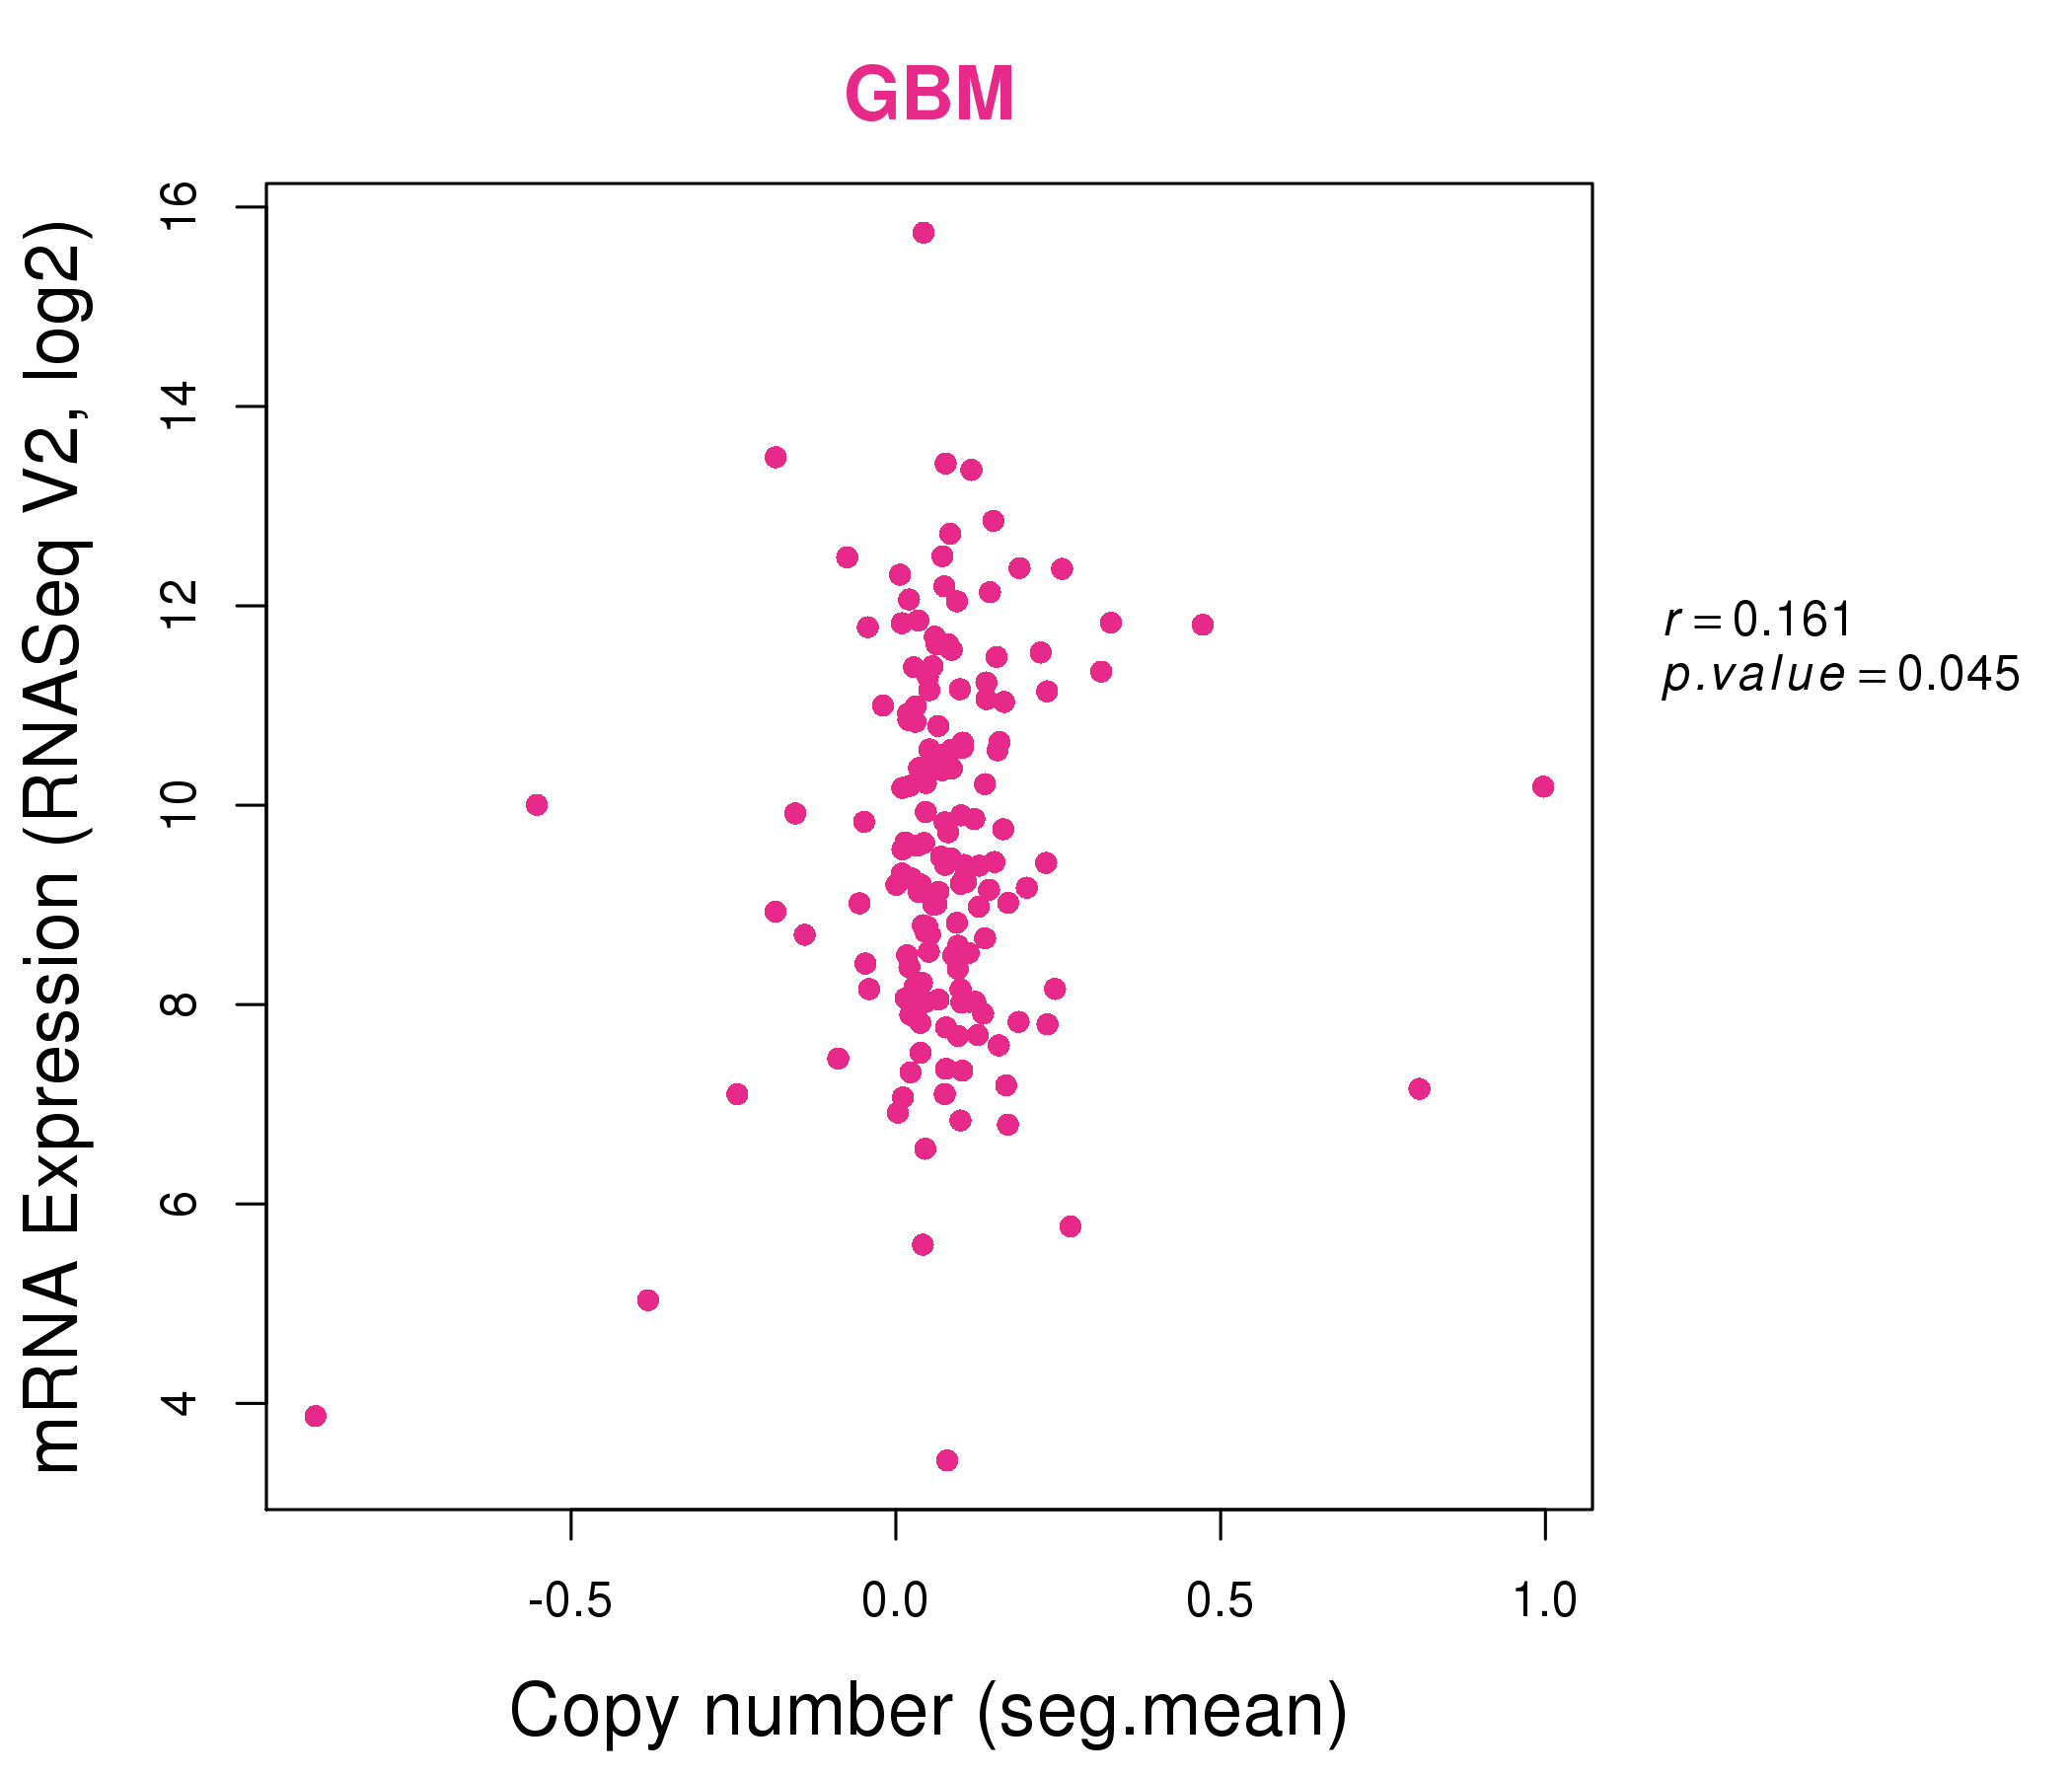
| * This plots show the correlation between CNV and gene expression. |
: Open all plots for all cancer types
 |
|
 |
|

| Top |
| Gene-Gene Network Information |
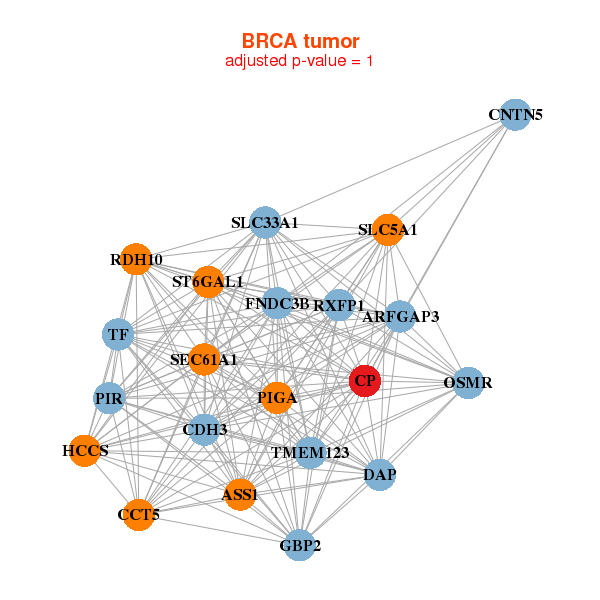
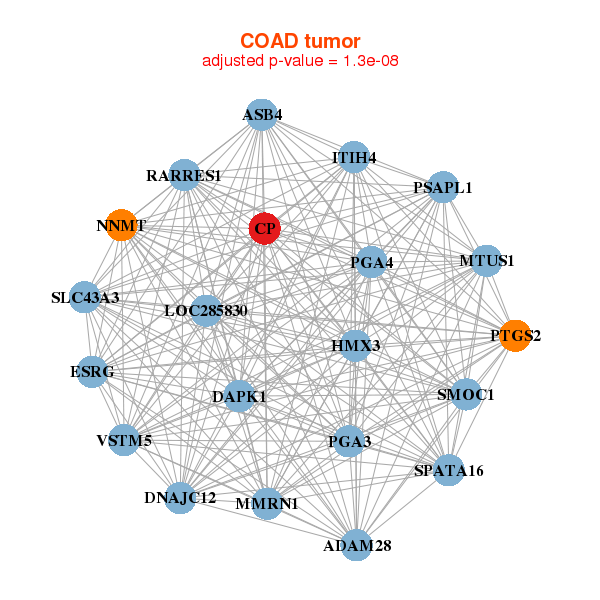
| * Co-Expression network figures were drawn using R package igraph. Only the top 20 genes with the highest correlations were shown. Red circle: input gene, orange circle: cell metabolism gene, sky circle: other gene |
: Open all plots for all cancer types
 |
| ||||
| ACADM,ALDH6A1,ATPAF1,BSDC1,C1orf210,TCEANC2,CPT2, DHCR24,IPP,IVD,KIAA0319L,MYCBP,NRD1,NSUN4, OMA1,PAFAH2,PARS2,POMGNT1,SCP2,TMEM59,YIPF1 | ABCB6,ACADM,AIFM1,MPC2,C19orf54,GUCD1,COQ6, CPT2,CRAT,CSPG5,DBI,GRPEL1,HIST1H1C,IVD, LDHD,NDUFA10,NDUFAF1,NFS1,PCCB,ECI2,SUOX | ||||
 |
| ||||
| ABCD3,ACADS,ALDH6A1,ARHGEF16,C1orf210,CPT2,DLST, ETFDH,GGT6,GPBP1L1,HMGCL,LDHD,NUDT6,OMA1, PAFAH2,PIGR,RBM47,RPS6KA1,SCP2,SIAE,TMEM125 | ACSF2,AGFG2,AP1M2,BDH1,CPT2,DTX4,ENTPD5, EPB41L4B,KLF5,LDLRAP1,MARVELD3,MYO1D,PAFAH2,PLD1, PPARG,PTK6,SFXN5,SH3BGRL2,SLC44A1,TRAF3IP2,WDR78 |
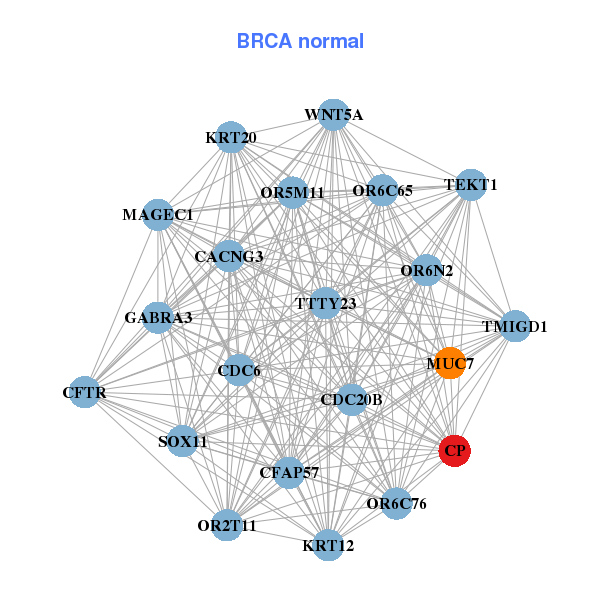
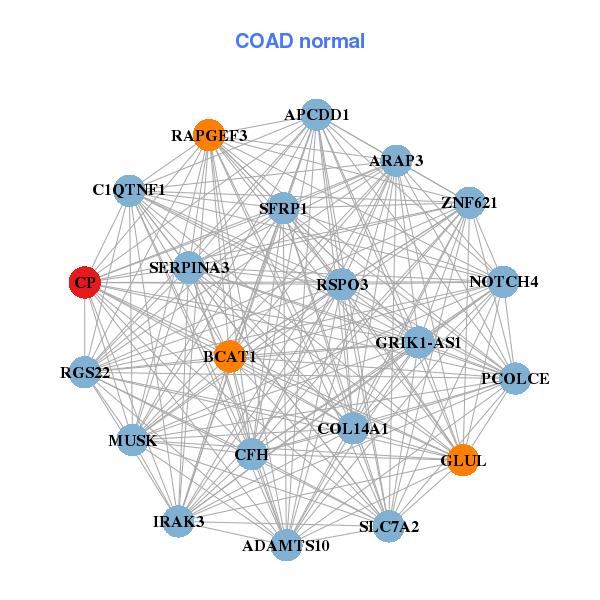
| * Co-Expression network figures were drawn using R package igraph. Only the top 20 genes with the highest correlations were shown. Red circle: input gene, orange circle: cell metabolism gene, sky circle: other gene |
: Open all plots for all cancer types
| Top |
: Open all interacting genes' information including KEGG pathway for all interacting genes from DAVID
| Top |
| Pharmacological Information for CP |
| DB Category | DB Name | DB's ID and Url link |
| Organism-specific databases | PharmGKB | PA26815; -. |
| Organism-specific databases | CTD | 1356; -. |
| * Gene Centered Interaction Network. |
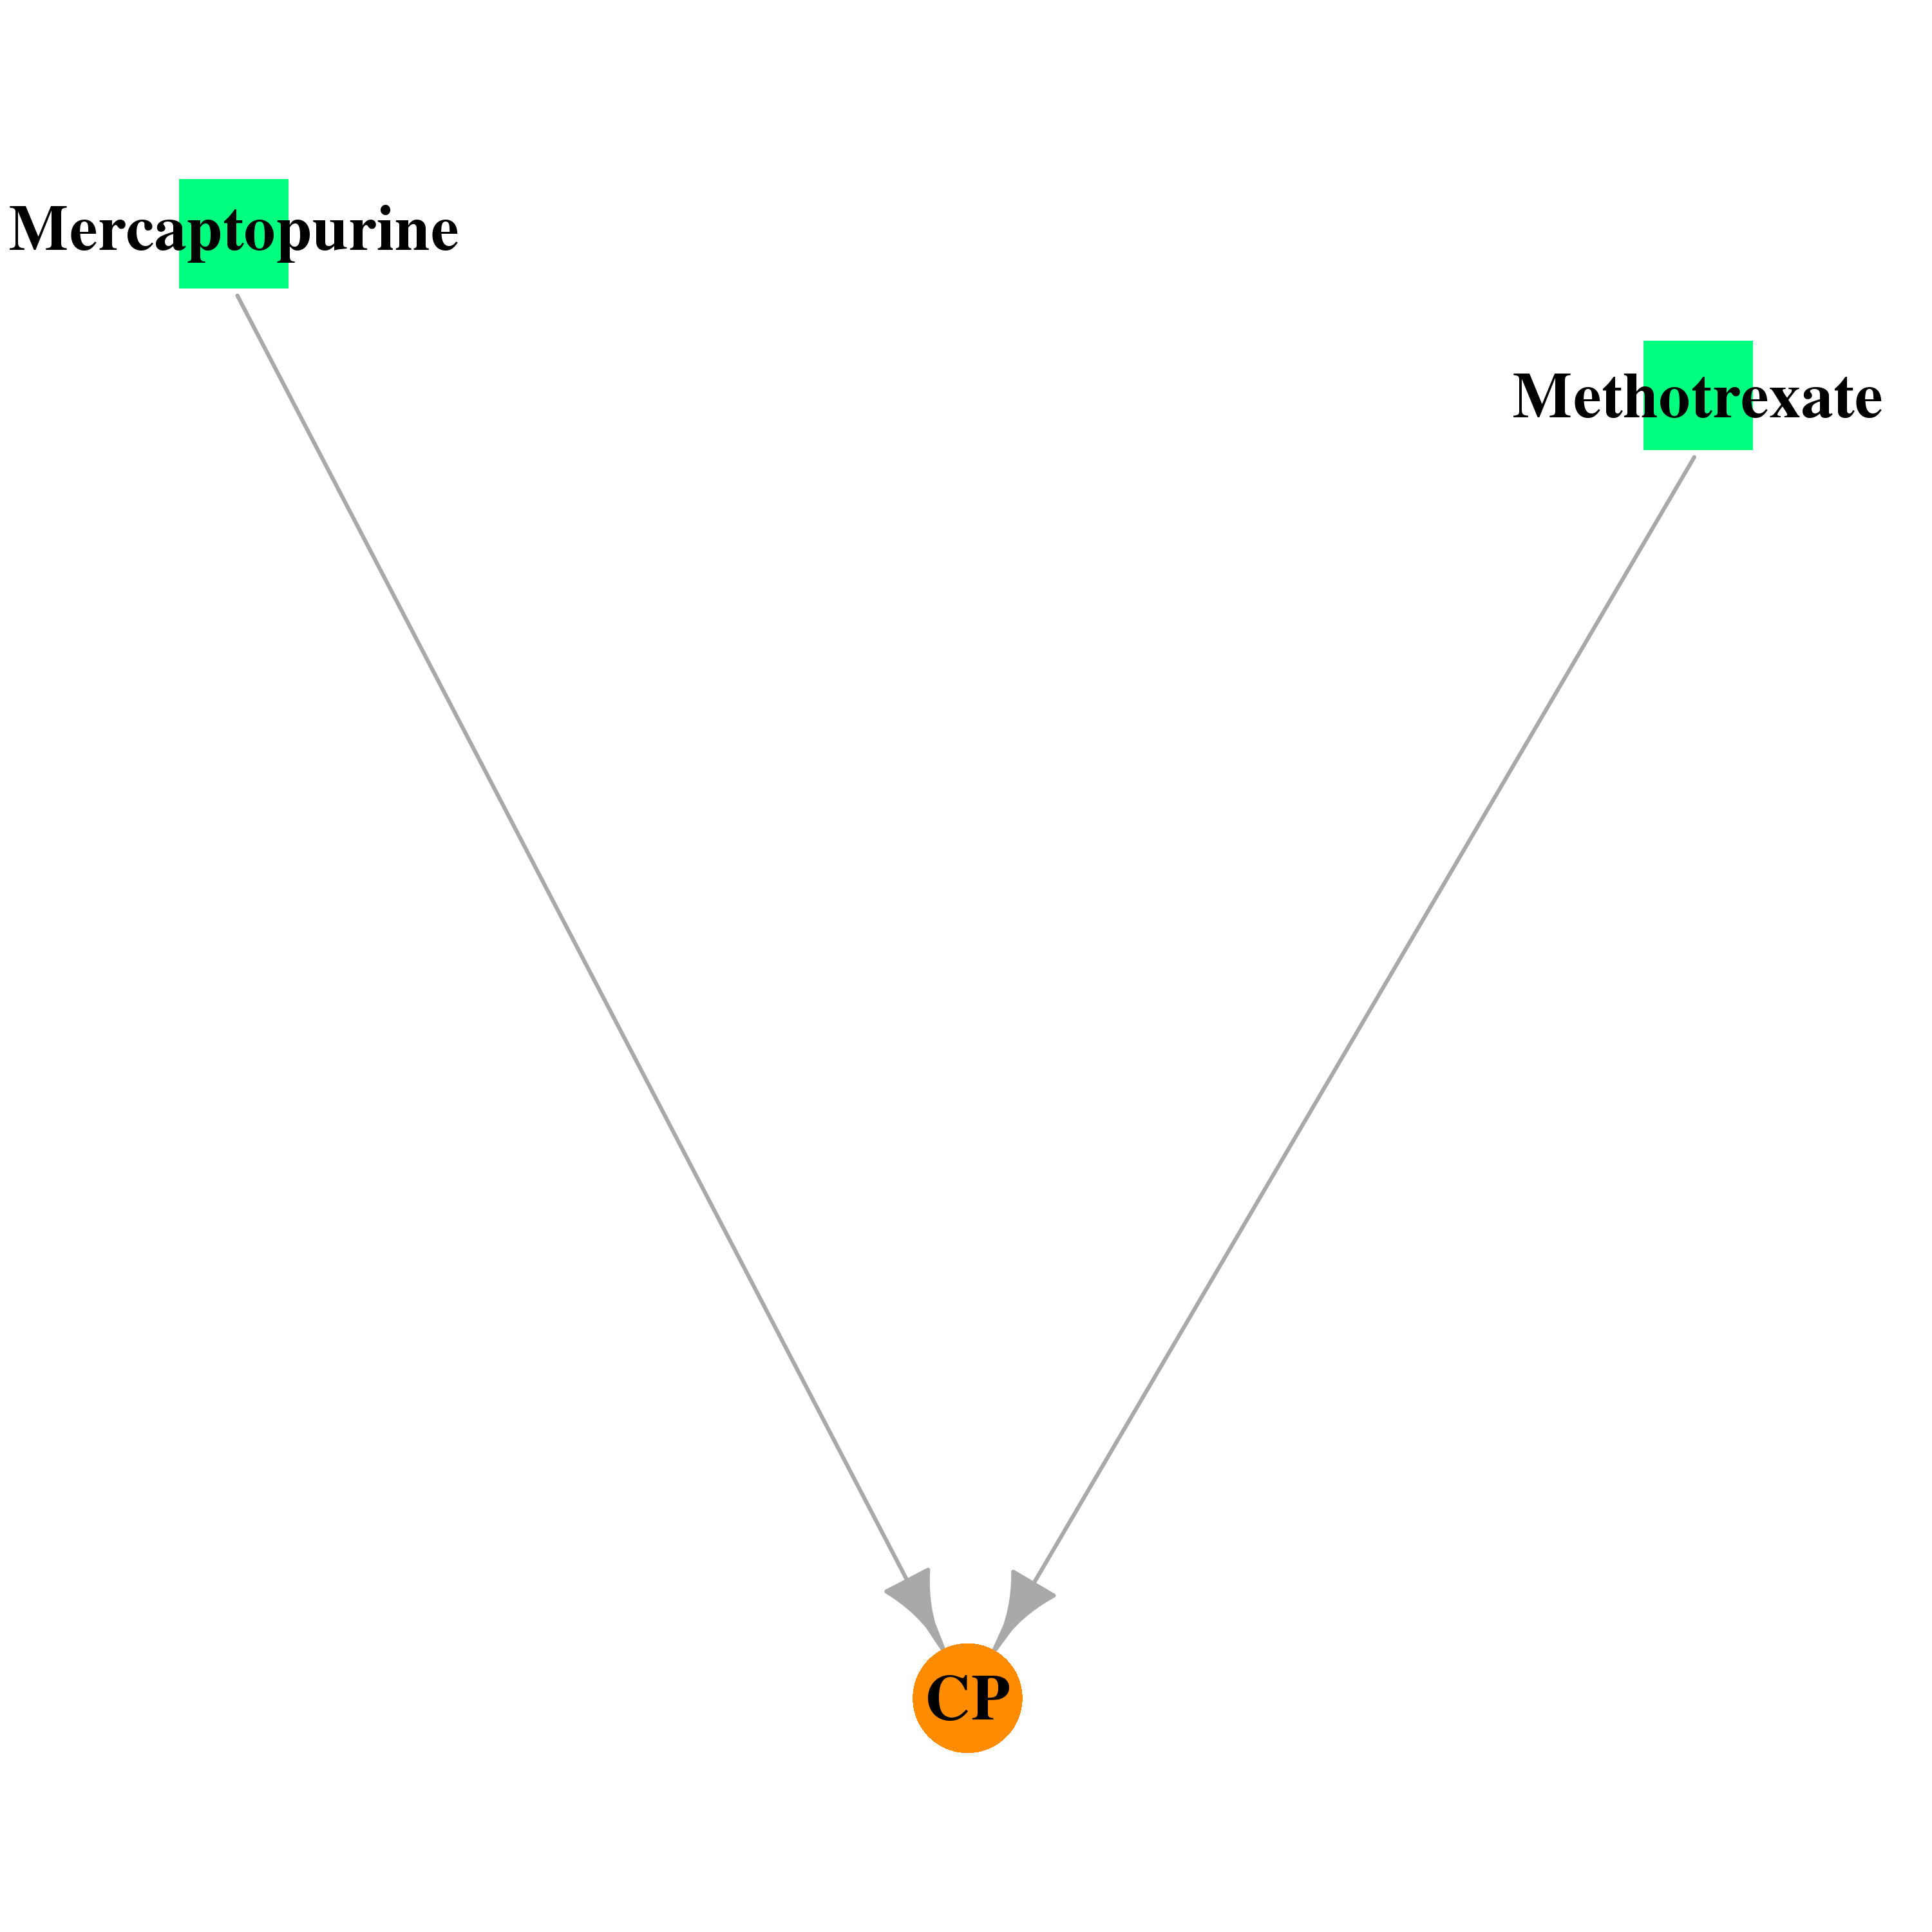 |
| * Drug Centered Interaction Network. |
| DrugBank ID | Target Name | Drug Groups | Generic Name | Drug Centered Network | Drug Structure |
| DB01033 | ceruloplasmin (ferroxidase) | approved | Mercaptopurine | 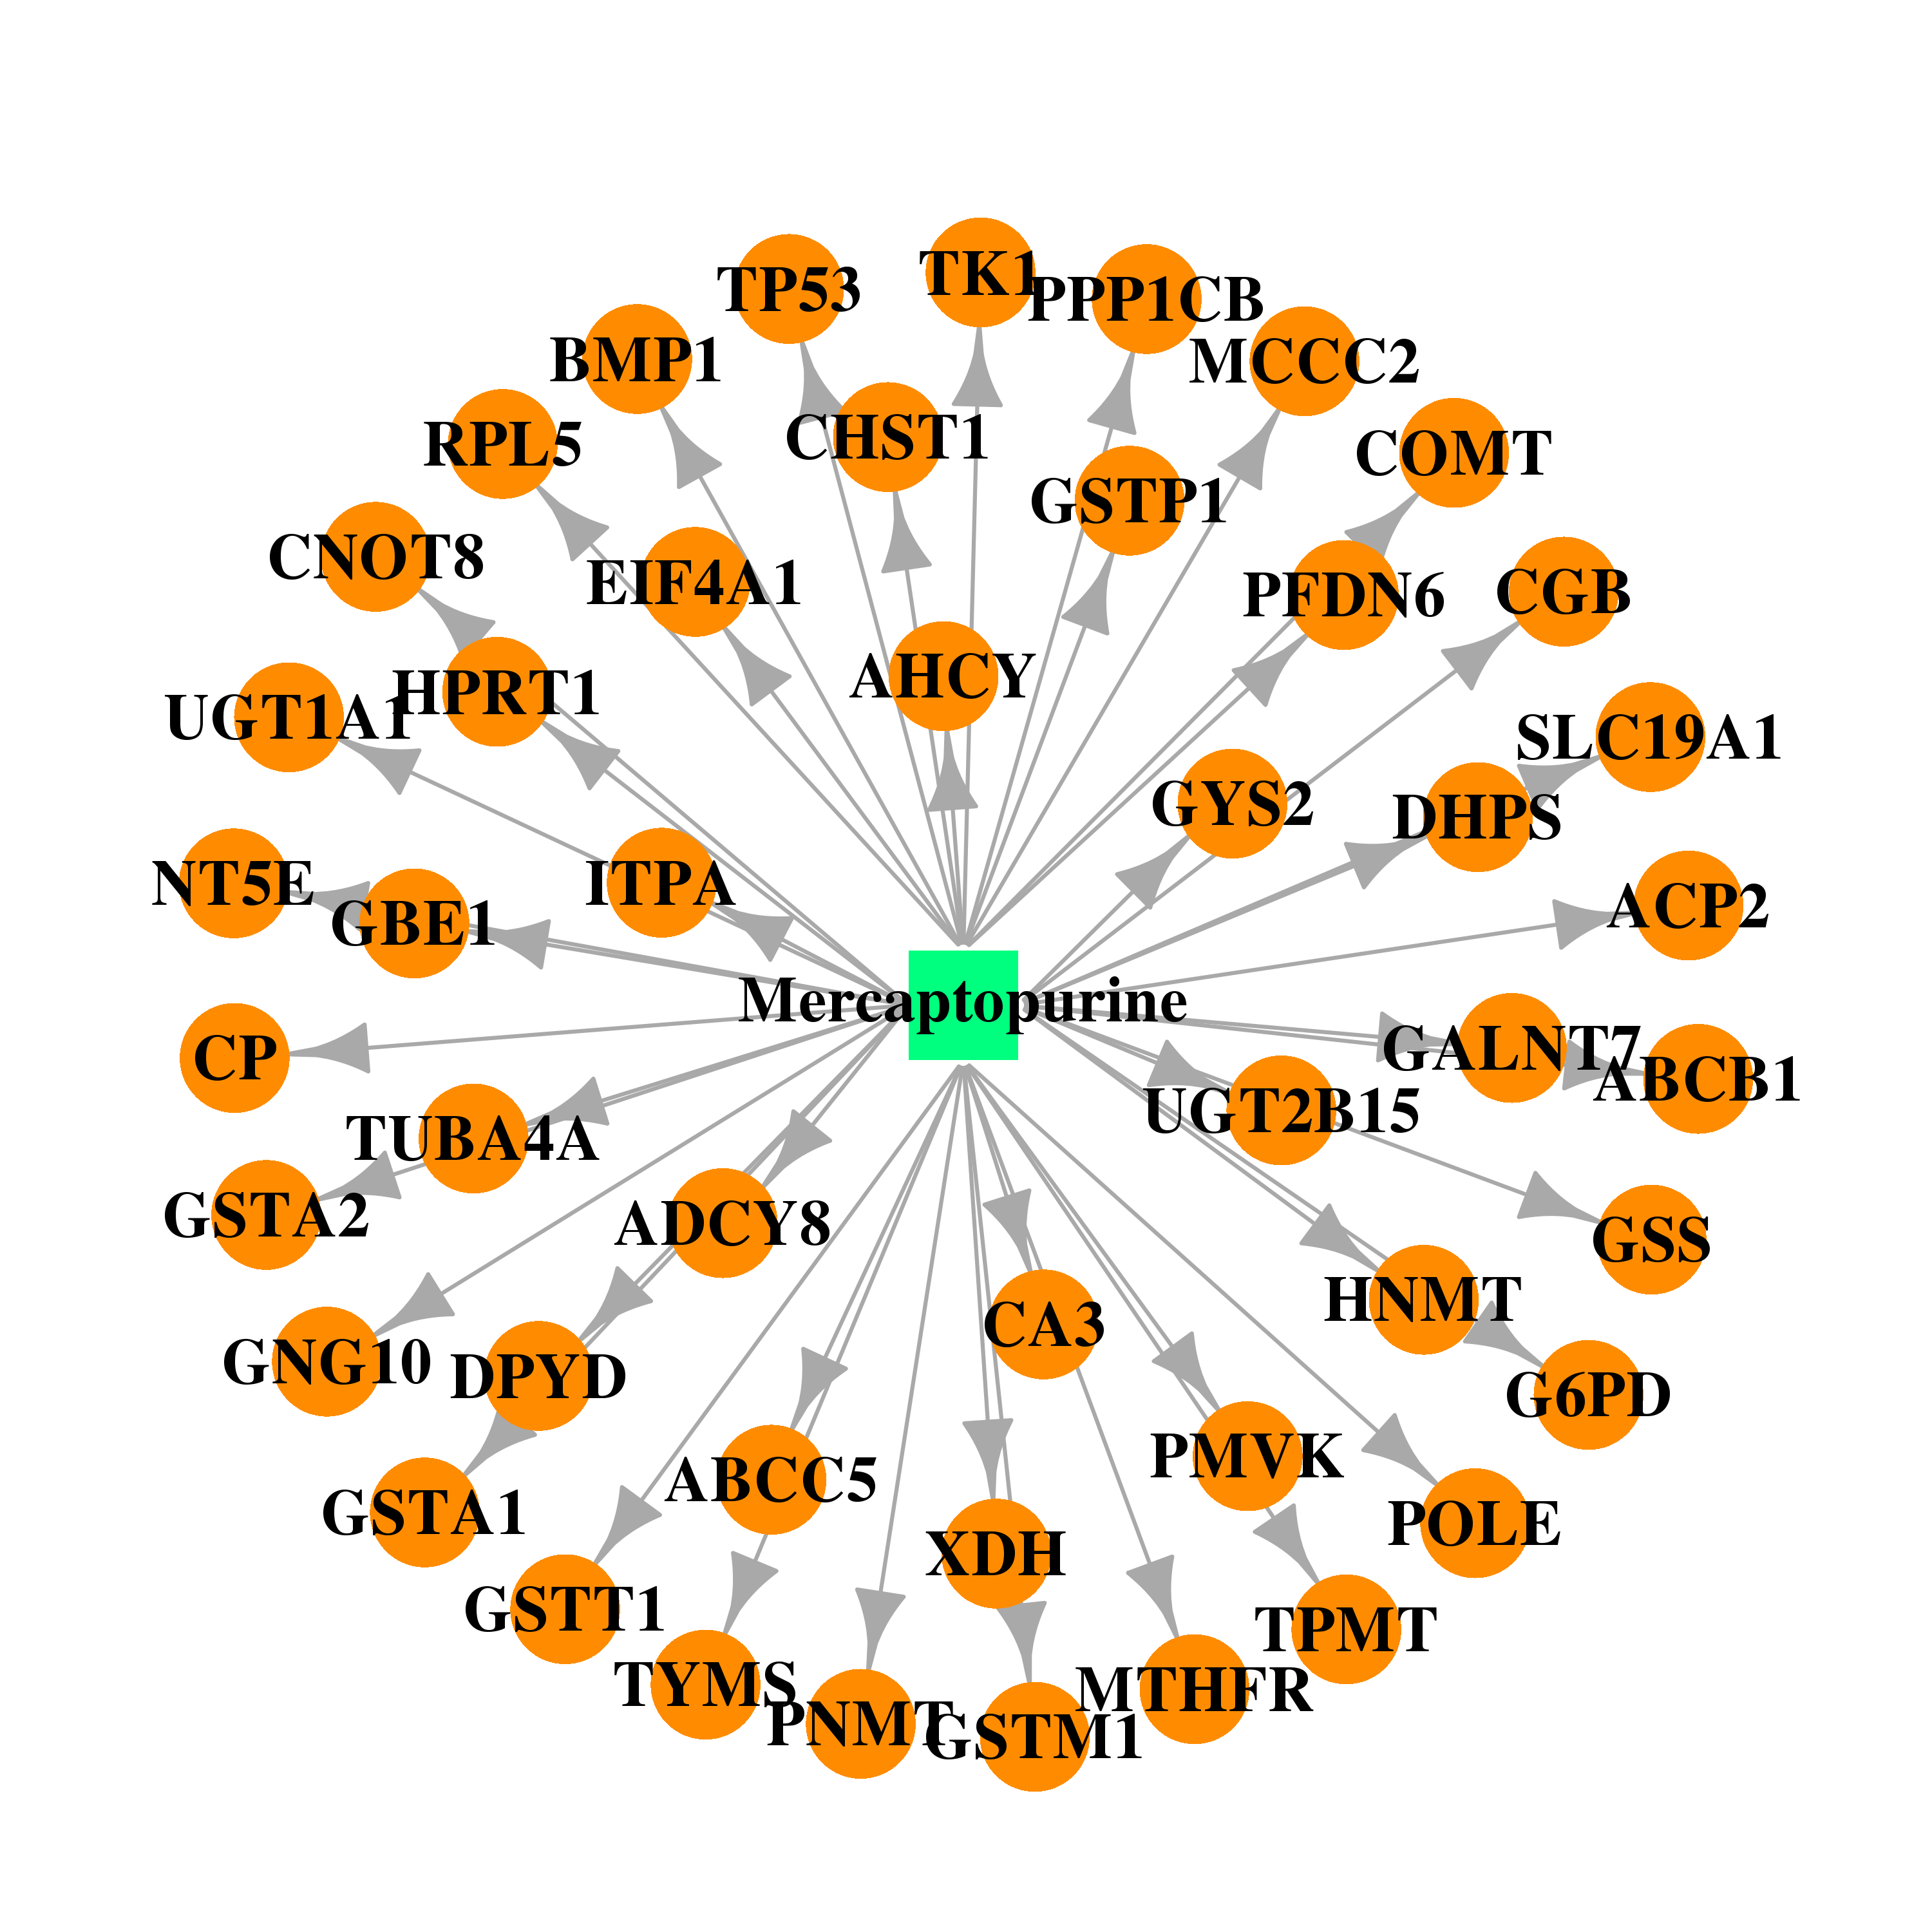 | 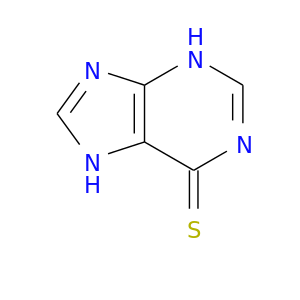 |
| DB00563 | ceruloplasmin (ferroxidase) | approved | Methotrexate |  |  |
| Top |
| Cross referenced IDs for CP |
| * We obtained these cross-references from Uniprot database. It covers 150 different DBs, 18 categories. http://www.uniprot.org/help/cross_references_section |
: Open all cross reference information
|
Copyright © 2016-Present - The Univsersity of Texas Health Science Center at Houston @ |