|
|||||||||||||||||||||||||||||||||||||||||||||||||||||||||||||||||||||||||||||||||||||||||||||||||||||||||||||||||||||||||||||||||||||||||||||||||||||||||||||||||||||||||||||||||||||||||||||||||||||||||||||||||||||||||||||||||||||||||||||||||||||||||||||||||||||||||||||||||||||||||||||||||||||||||||||||||||||||||||||||||||||||||||||||||||
| |
| Phenotypic Information (metabolism pathway, cancer, disease, phenome) |
| |
| |
| Gene-Gene Network Information: Co-Expression Network, Interacting Genes & KEGG |
| |
|


| Gene Summary for CPS1 |
| Top |
| Phenotypic Information for CPS1(metabolism pathway, cancer, disease, phenome) |
| Cancer | CGAP: CPS1 |
| Familial Cancer Database: CPS1 | |
| * This gene is included in those cancer gene databases. |
|
|
|
|
|
| . | |||||||||||||||||||||||||||||||||||||||||||||||||||||||||||||||||||||||||||||||||||||||||||||||||||||||||||||||||||||||||||||||||||||||||||||||||||||||||||||||||||||||||||||||||||||||||||||||||||||||||||||||||||||||||||||||||||||||||||||||||||||||||||||||||||||||||||||||||||||||||||||||||||||||||||||||||||||||||||||||||||||||||||||
Oncogene 1 | Significant driver gene in | ||||||||||||||||||||||||||||||||||||||||||||||||||||||||||||||||||||||||||||||||||||||||||||||||||||||||||||||||||||||||||||||||||||||||||||||||||||||||||||||||||||||||||||||||||||||||||||||||||||||||||||||||||||||||||||||||||||||||||||||||||||||||||||||||||||||||||||||||||||||||||||||||||||||||||||||||||||||||||||||||||||||||||||||||||
| cf) number; DB name 1 Oncogene; http://nar.oxfordjournals.org/content/35/suppl_1/D721.long, 2 Tumor Suppressor gene; https://bioinfo.uth.edu/TSGene/, 3 Cancer Gene Census; http://www.nature.com/nrc/journal/v4/n3/abs/nrc1299.html, 4 CancerGenes; http://nar.oxfordjournals.org/content/35/suppl_1/D721.long, 5 Network of Cancer Gene; http://ncg.kcl.ac.uk/index.php, 1Therapeutic Vulnerabilities in Cancer; http://cbio.mskcc.org/cancergenomics/statius/ |
| KEGG_ALANINE_ASPARTATE_AND_GLUTAMATE_METABOLISM KEGG_ARGININE_AND_PROLINE_METABOLISM KEGG_NITROGEN_METABOLISM REACTOME_METABOLISM_OF_AMINO_ACIDS_AND_DERIVATIVES | |
| OMIM | |
| Orphanet | |
| Disease | KEGG Disease: CPS1 |
| MedGen: CPS1 (Human Medical Genetics with Condition) | |
| ClinVar: CPS1 | |
| Phenotype | MGI: CPS1 (International Mouse Phenotyping Consortium) |
| PhenomicDB: CPS1 | |
| Mutations for CPS1 |
| * Under tables are showing count per each tissue to give us broad intuition about tissue specific mutation patterns.You can go to the detailed page for each mutation database's web site. |
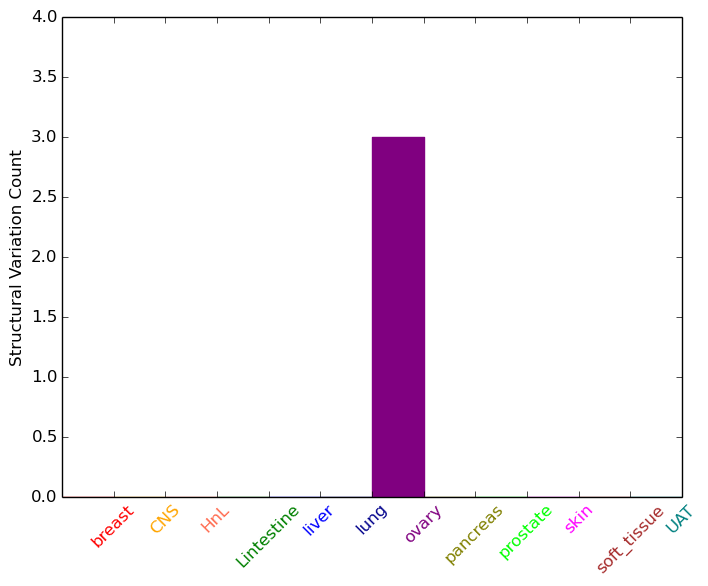
| - Statistics for Tissue and Mutation type | Top |
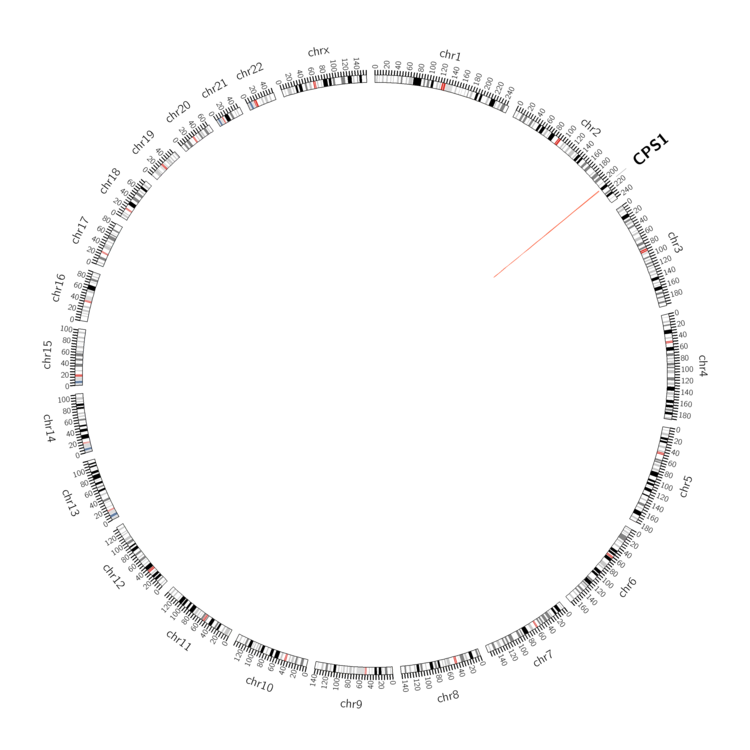 |
| - For Inter-chromosomal Variations |
| There's no inter-chromosomal structural variation. |
| - For Intra-chromosomal Variations |
| * Intra-chromosomal variantions includes 'intrachromosomal amplicon to amplicon', 'intrachromosomal amplicon to non-amplified dna', 'intrachromosomal deletion', 'intrachromosomal fold-back inversion', 'intrachromosomal inversion', 'intrachromosomal tandem duplication', 'Intrachromosomal unknown type', 'intrachromosomal with inverted orientation', 'intrachromosomal with non-inverted orientation'. |
 |
| Sample | Symbol_a | Chr_a | Start_a | End_a | Symbol_b | Chr_b | Start_b | End_b |
| ovary | CPS1 | chr2 | 211349759 | 211349779 | CPS1 | chr2 | 211345995 | 211346015 |
| ovary | CPS1 | chr2 | 211432074 | 211432094 | chr2 | 212207968 | 212207988 | |
| ovary | CPS1 | chr2 | 211513531 | 211513551 | CPS1 | chr2 | 211513876 | 211513896 |
| cf) Tissue number; Tissue name (1;Breast, 2;Central_nervous_system, 3;Haematopoietic_and_lymphoid_tissue, 4;Large_intestine, 5;Liver, 6;Lung, 7;Ovary, 8;Pancreas, 9;Prostate, 10;Skin, 11;Soft_tissue, 12;Upper_aerodigestive_tract) |
| * From mRNA Sanger sequences, Chitars2.0 arranged chimeric transcripts. This table shows CPS1 related fusion information. |
| ID | Head Gene | Tail Gene | Accession | Gene_a | qStart_a | qEnd_a | Chromosome_a | tStart_a | tEnd_a | Gene_a | qStart_a | qEnd_a | Chromosome_a | tStart_a | tEnd_a |
| AV694689 | CPS1 | 2 | 84 | 2 | 211421361 | 211421447 | PRDX3 | 79 | 583 | 10 | 120927794 | 120931984 | |
| BX102832 | CPS1 | 1 | 511 | 2 | 211523219 | 211523729 | IFNGR1 | 499 | 580 | 6 | 137518622 | 137518703 | |
| Top |
| Mutation type/ Tissue ID | brca | cns | cerv | endome | haematopo | kidn | Lintest | liver | lung | ns | ovary | pancre | prost | skin | stoma | thyro | urina | |||
| Total # sample | 1 | 1 | ||||||||||||||||||
| GAIN (# sample) | 1 | |||||||||||||||||||
| LOSS (# sample) | 1 |
| cf) Tissue ID; Tissue type (1; Breast, 2; Central_nervous_system, 3; Cervix, 4; Endometrium, 5; Haematopoietic_and_lymphoid_tissue, 6; Kidney, 7; Large_intestine, 8; Liver, 9; Lung, 10; NS, 11; Ovary, 12; Pancreas, 13; Prostate, 14; Skin, 15; Stomach, 16; Thyroid, 17; Urinary_tract) |
| Top |
|
 |
| Top |
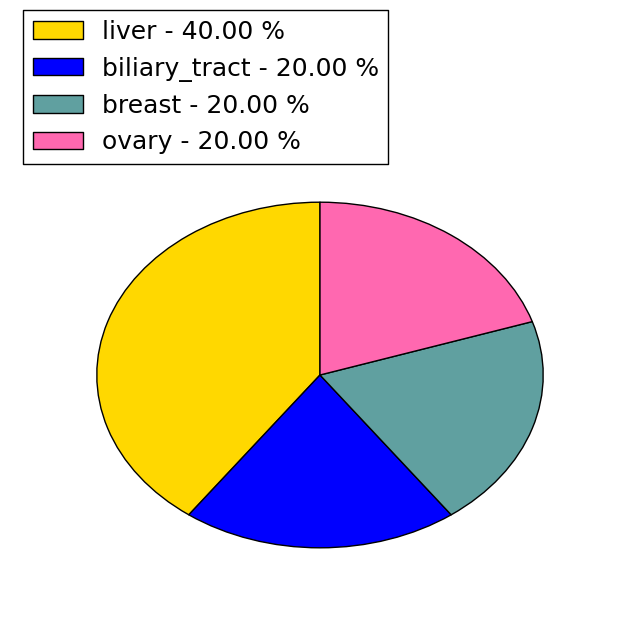
| Stat. for Non-Synonymous SNVs (# total SNVs=237) | (# total SNVs=57) |
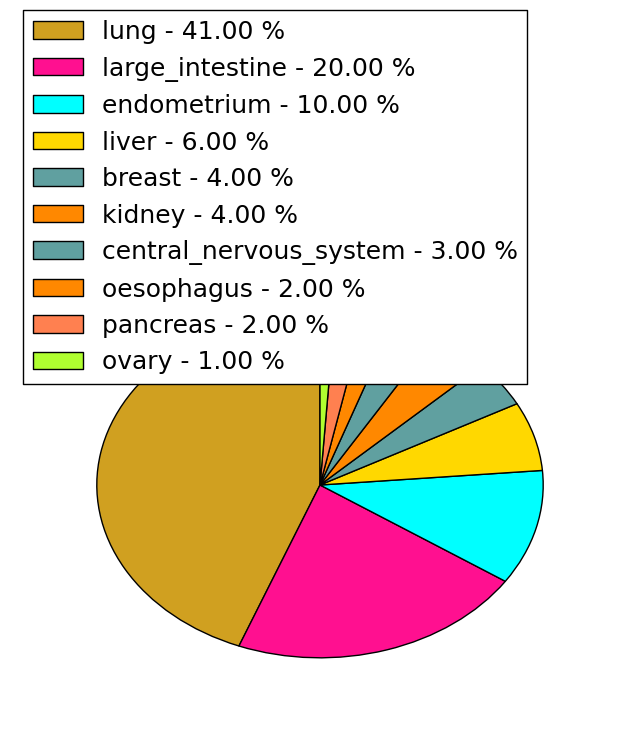 | 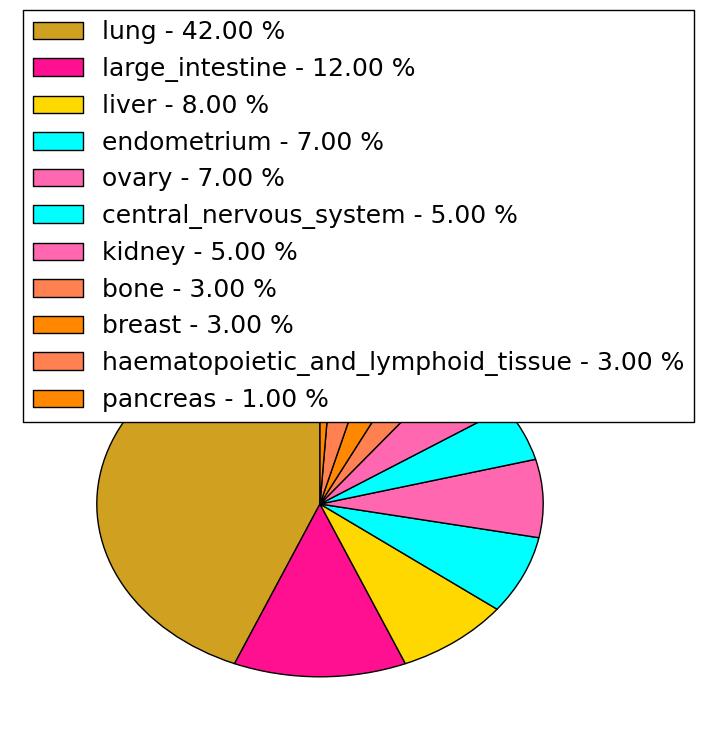 |
(# total SNVs=5) | (# total SNVs=1) |
 |  |
| Top |
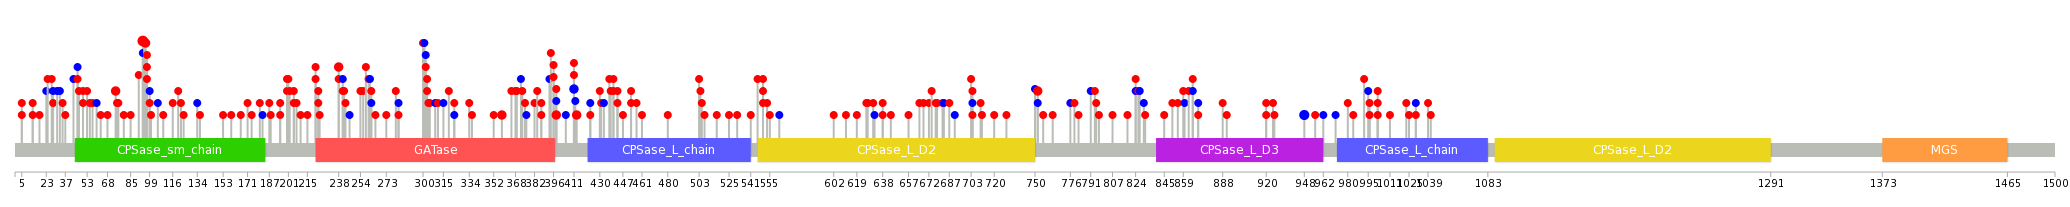
| * When you move the cursor on each content, you can see more deailed mutation information on the Tooltip. Those are primary_site,primary_histology,mutation(aa),pubmedID. |
| GRCh37 position | Mutation(aa) | Unique sampleID count |
| chr2:211540487-211540487 | p.N1399N | 5 |
| chr2:211521298-211521298 | p.S1203L | 4 |
| chr2:211441114-211441114 | p.L94P | 4 |
| chr2:211455590-211455590 | p.A303S | 3 |
| chr2:211456679-211456679 | p.D358N | 3 |
| chr2:211459300-211459300 | p.P411P | 3 |
| chr2:211512710-211512710 | p.R1089C | 3 |
| chr2:211421472-211421472 | p.L5F | 2 |
| chr2:211460258-211460258 | p.Q437H | 2 |
| chr2:211466937-211466937 | p.A573A | 2 |
| Top |
|
 |
| Point Mutation/ Tissue ID | 1 | 2 | 3 | 4 | 5 | 6 | 7 | 8 | 9 | 10 | 11 | 12 | 13 | 14 | 15 | 16 | 17 | 18 | 19 | 20 |
| # sample | 6 | 7 | 1 | 34 | 5 | 13 | 11 | 51 | 24 | 8 | 1 | 3 | 22 | 21 | 13 | |||||
| # mutation | 7 | 7 | 1 | 32 | 5 | 13 | 11 | 62 | 30 | 8 | 1 | 3 | 26 | 23 | 22 | |||||
| nonsynonymous SNV | 5 | 7 | 1 | 27 | 5 | 11 | 10 | 45 | 27 | 4 | 1 | 19 | 19 | 19 | ||||||
| synonymous SNV | 2 | 5 | 2 | 1 | 17 | 3 | 4 | 3 | 7 | 4 | 3 |
| cf) Tissue ID; Tissue type (1; BLCA[Bladder Urothelial Carcinoma], 2; BRCA[Breast invasive carcinoma], 3; CESC[Cervical squamous cell carcinoma and endocervical adenocarcinoma], 4; COAD[Colon adenocarcinoma], 5; GBM[Glioblastoma multiforme], 6; Glioma Low Grade, 7; HNSC[Head and Neck squamous cell carcinoma], 8; KICH[Kidney Chromophobe], 9; KIRC[Kidney renal clear cell carcinoma], 10; KIRP[Kidney renal papillary cell carcinoma], 11; LAML[Acute Myeloid Leukemia], 12; LUAD[Lung adenocarcinoma], 13; LUSC[Lung squamous cell carcinoma], 14; OV[Ovarian serous cystadenocarcinoma ], 15; PAAD[Pancreatic adenocarcinoma], 16; PRAD[Prostate adenocarcinoma], 17; SKCM[Skin Cutaneous Melanoma], 18:STAD[Stomach adenocarcinoma], 19:THCA[Thyroid carcinoma], 20:UCEC[Uterine Corpus Endometrial Carcinoma]) |
| Top |
| * We represented just top 10 SNVs. When you move the cursor on each content, you can see more deailed mutation information on the Tooltip. Those are primary_site, primary_histology, mutation(aa), pubmedID. |
| Genomic Position | Mutation(aa) | Unique sampleID count |
| chr2:211441114 | p.L94P,CPS1 | 4 |
| chr2:211540487 | p.N948N,CPS1 | 3 |
| chr2:211438116 | p.L453V,CPS1 | 2 |
| chr2:211455590 | p.S752P,CPS1 | 2 |
| chr2:211525277 | p.M96V,CPS1 | 2 |
| chr2:211527868 | p.P13Q,CPS1 | 2 |
| chr2:211464127 | p.A97V,CPS1 | 2 |
| chr2:211456679 | p.R238C,CPS1 | 2 |
| chr2:211459300 | p.T398K,CPS1 | 2 |
| chr2:211502448 | p.R866W,CPS1 | 2 |
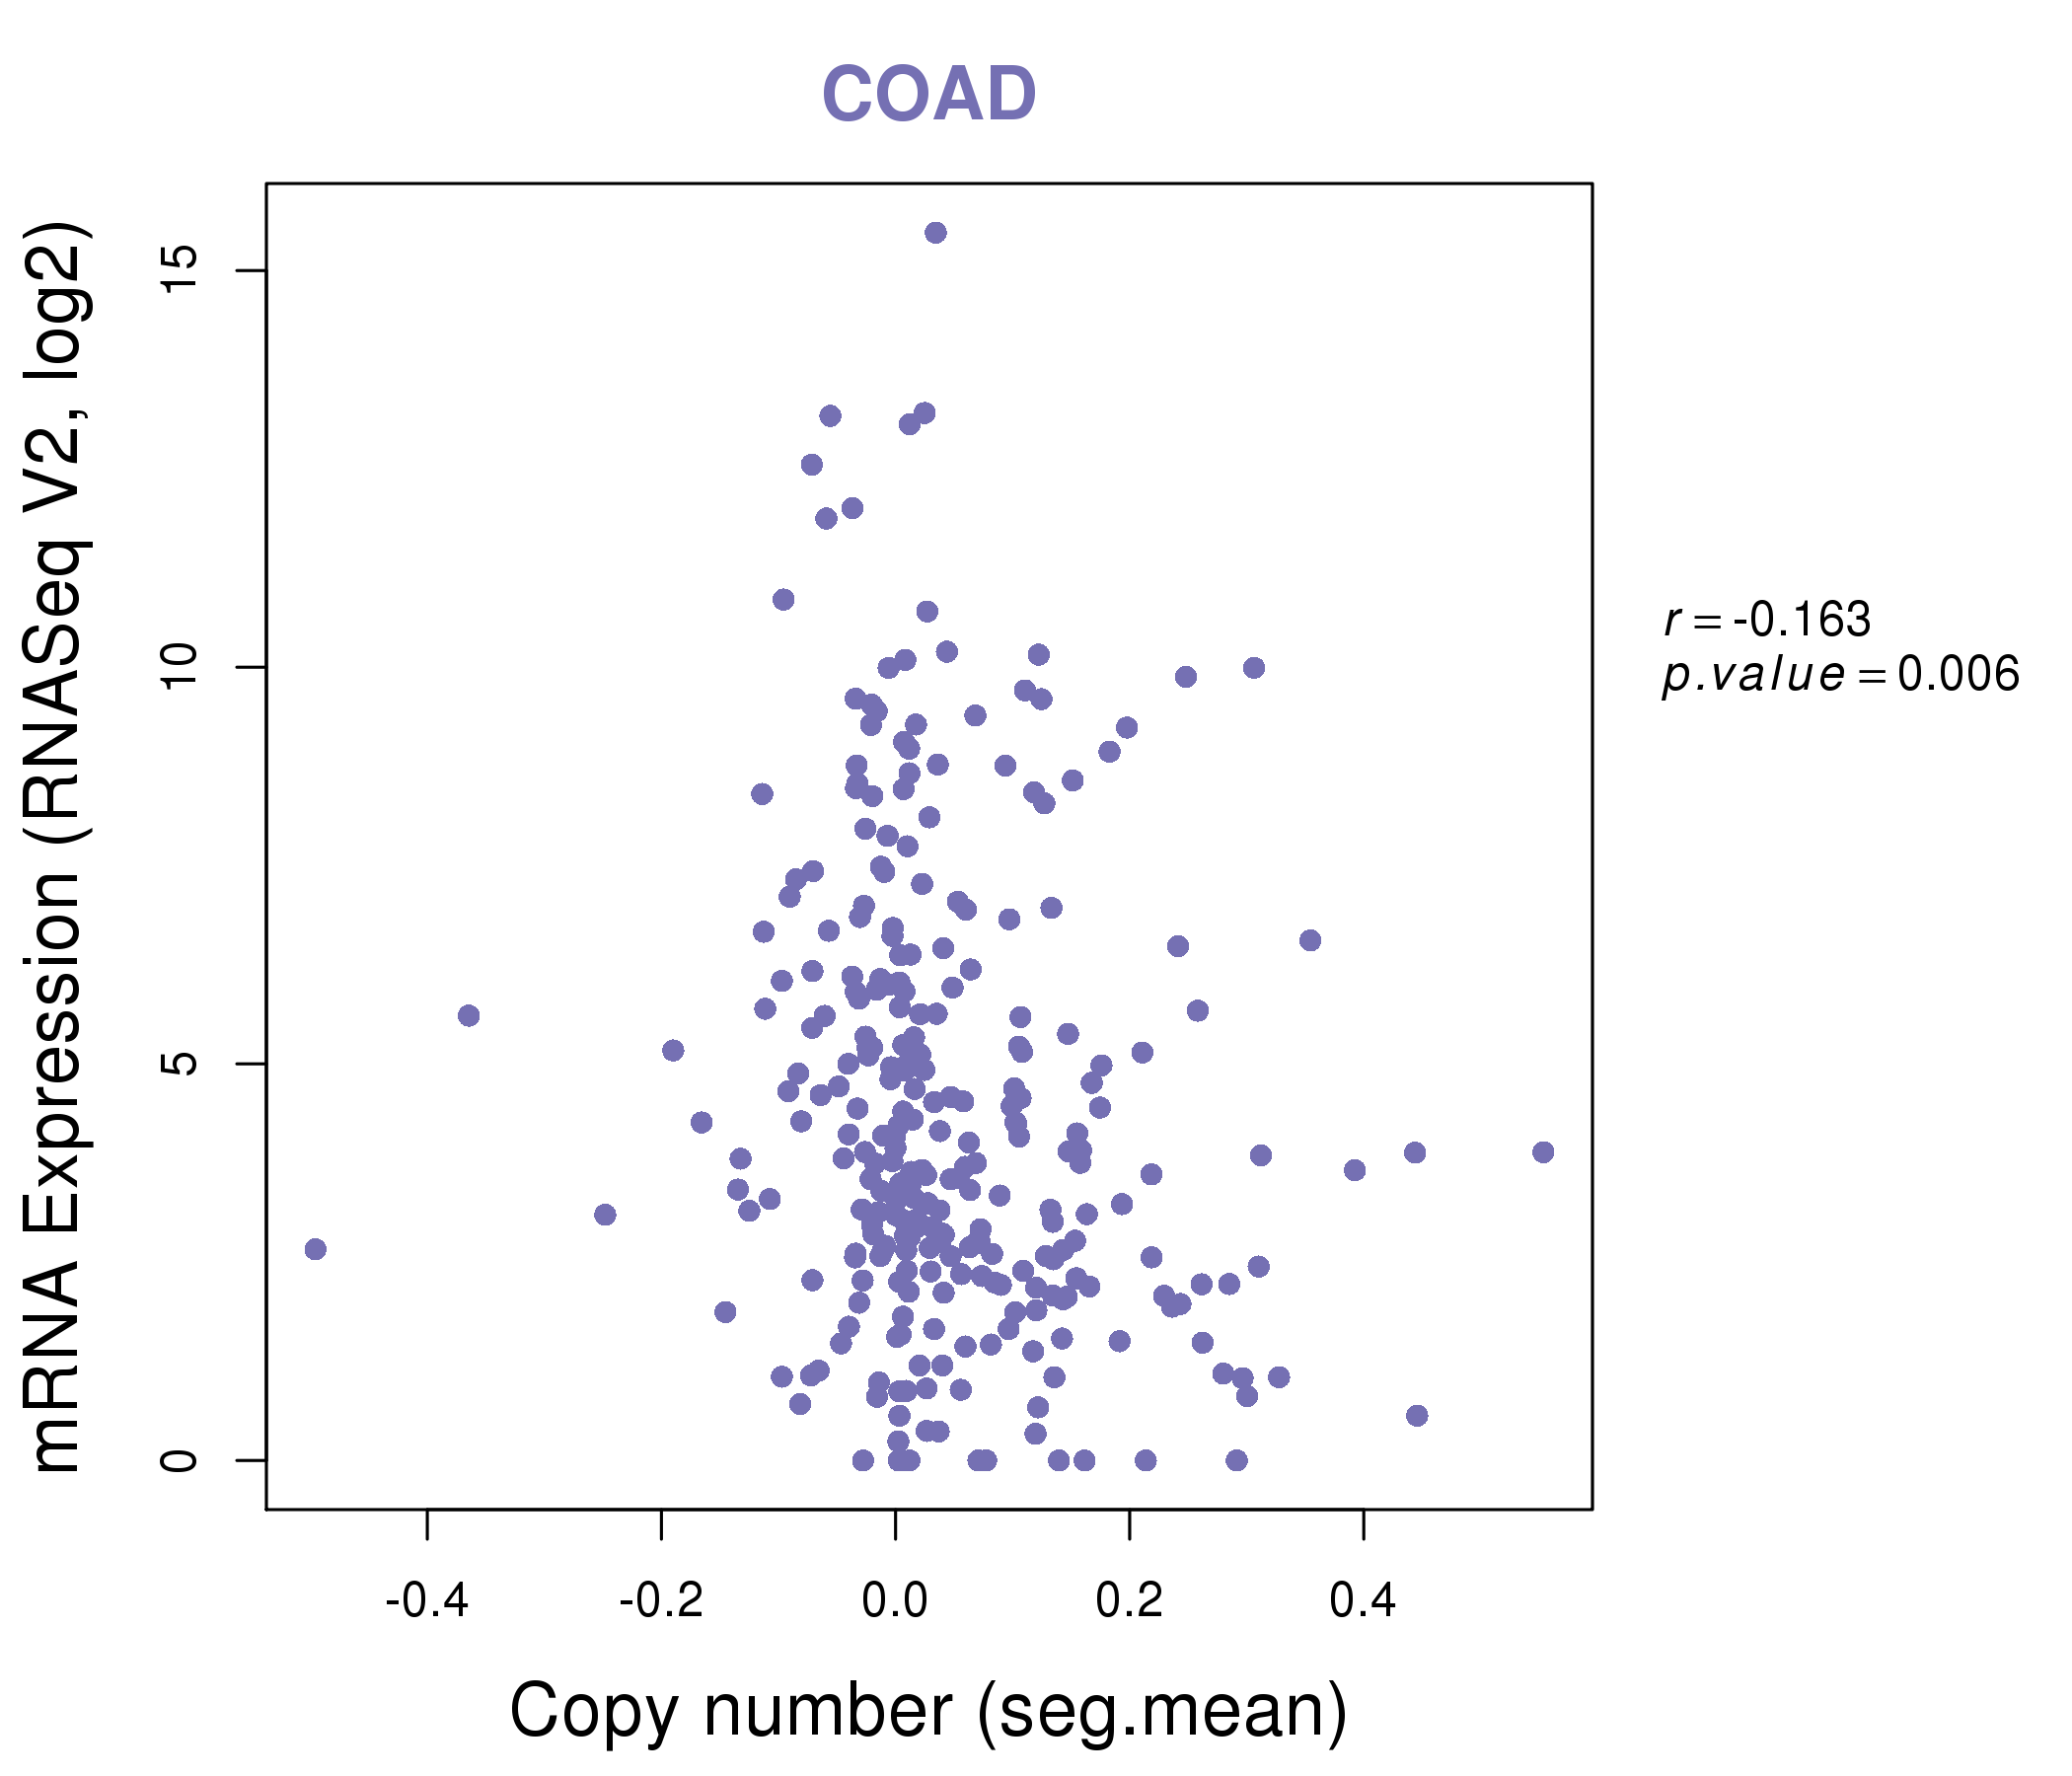
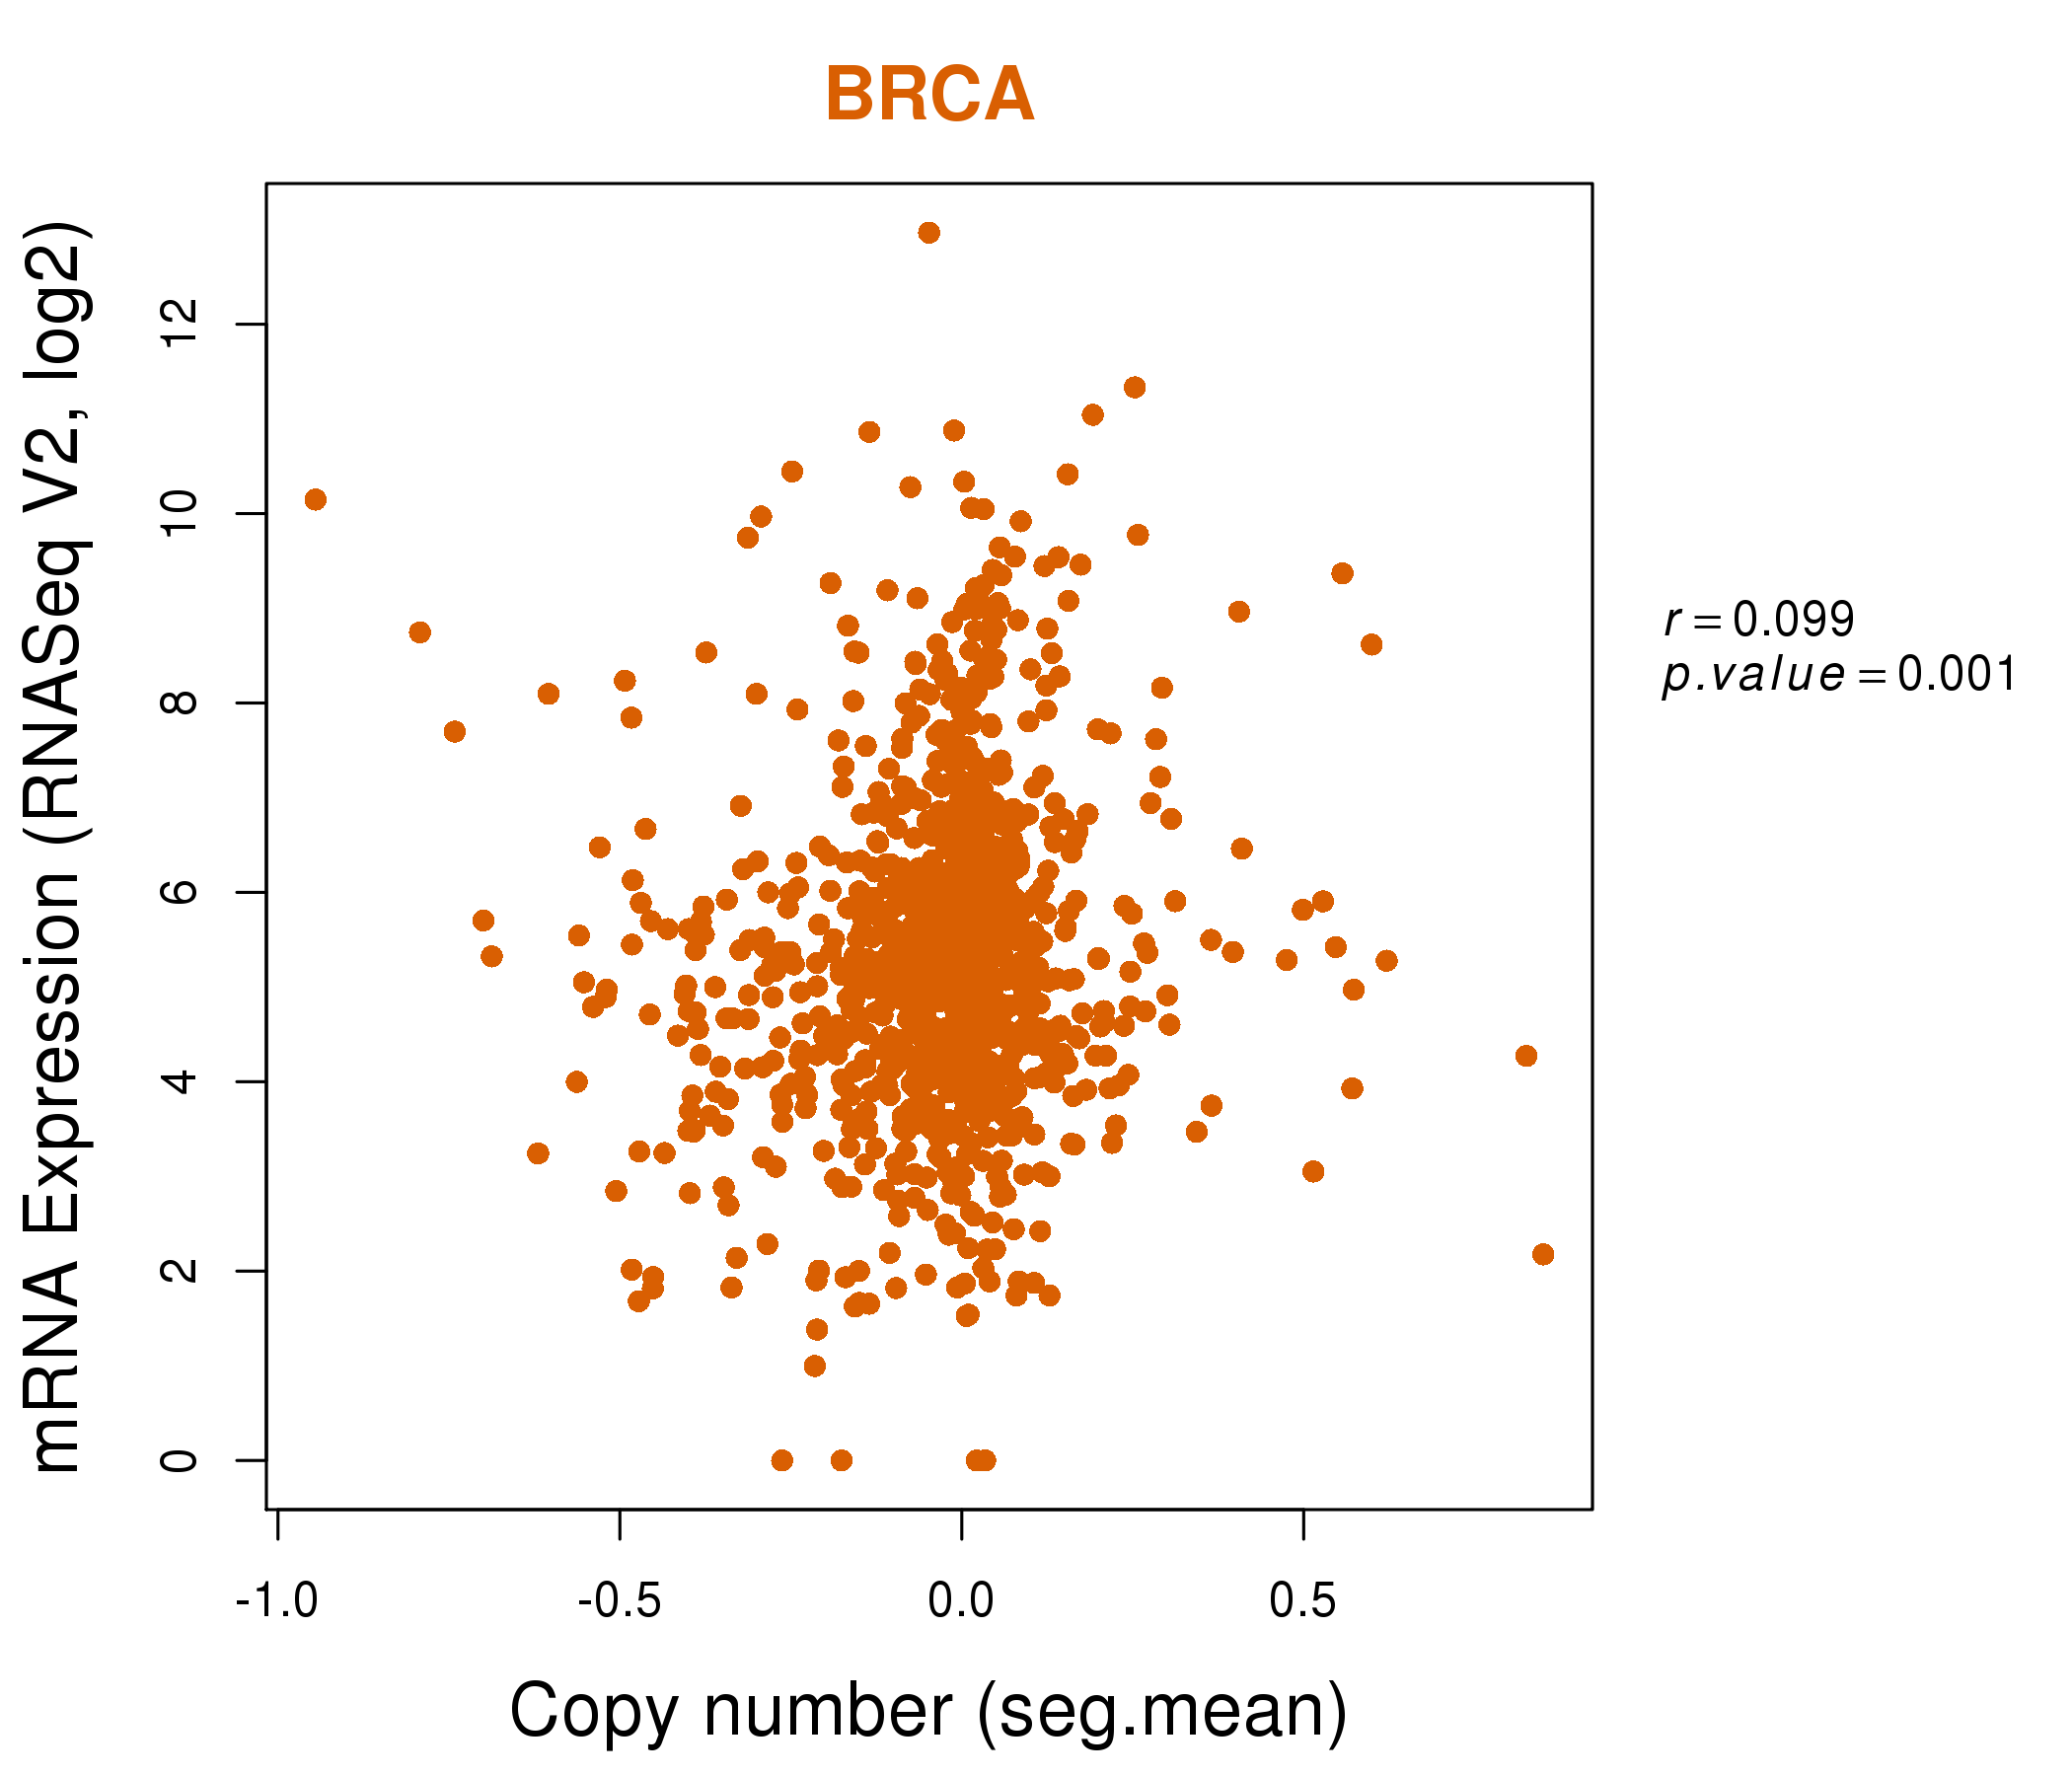
| * Copy number data were extracted from TCGA using R package TCGA-Assembler. The URLs of all public data files on TCGA DCC data server were gathered on Jan-05-2015. Function ProcessCNAData in TCGA-Assembler package was used to obtain gene-level copy number value which is calculated as the average copy number of the genomic region of a gene. |
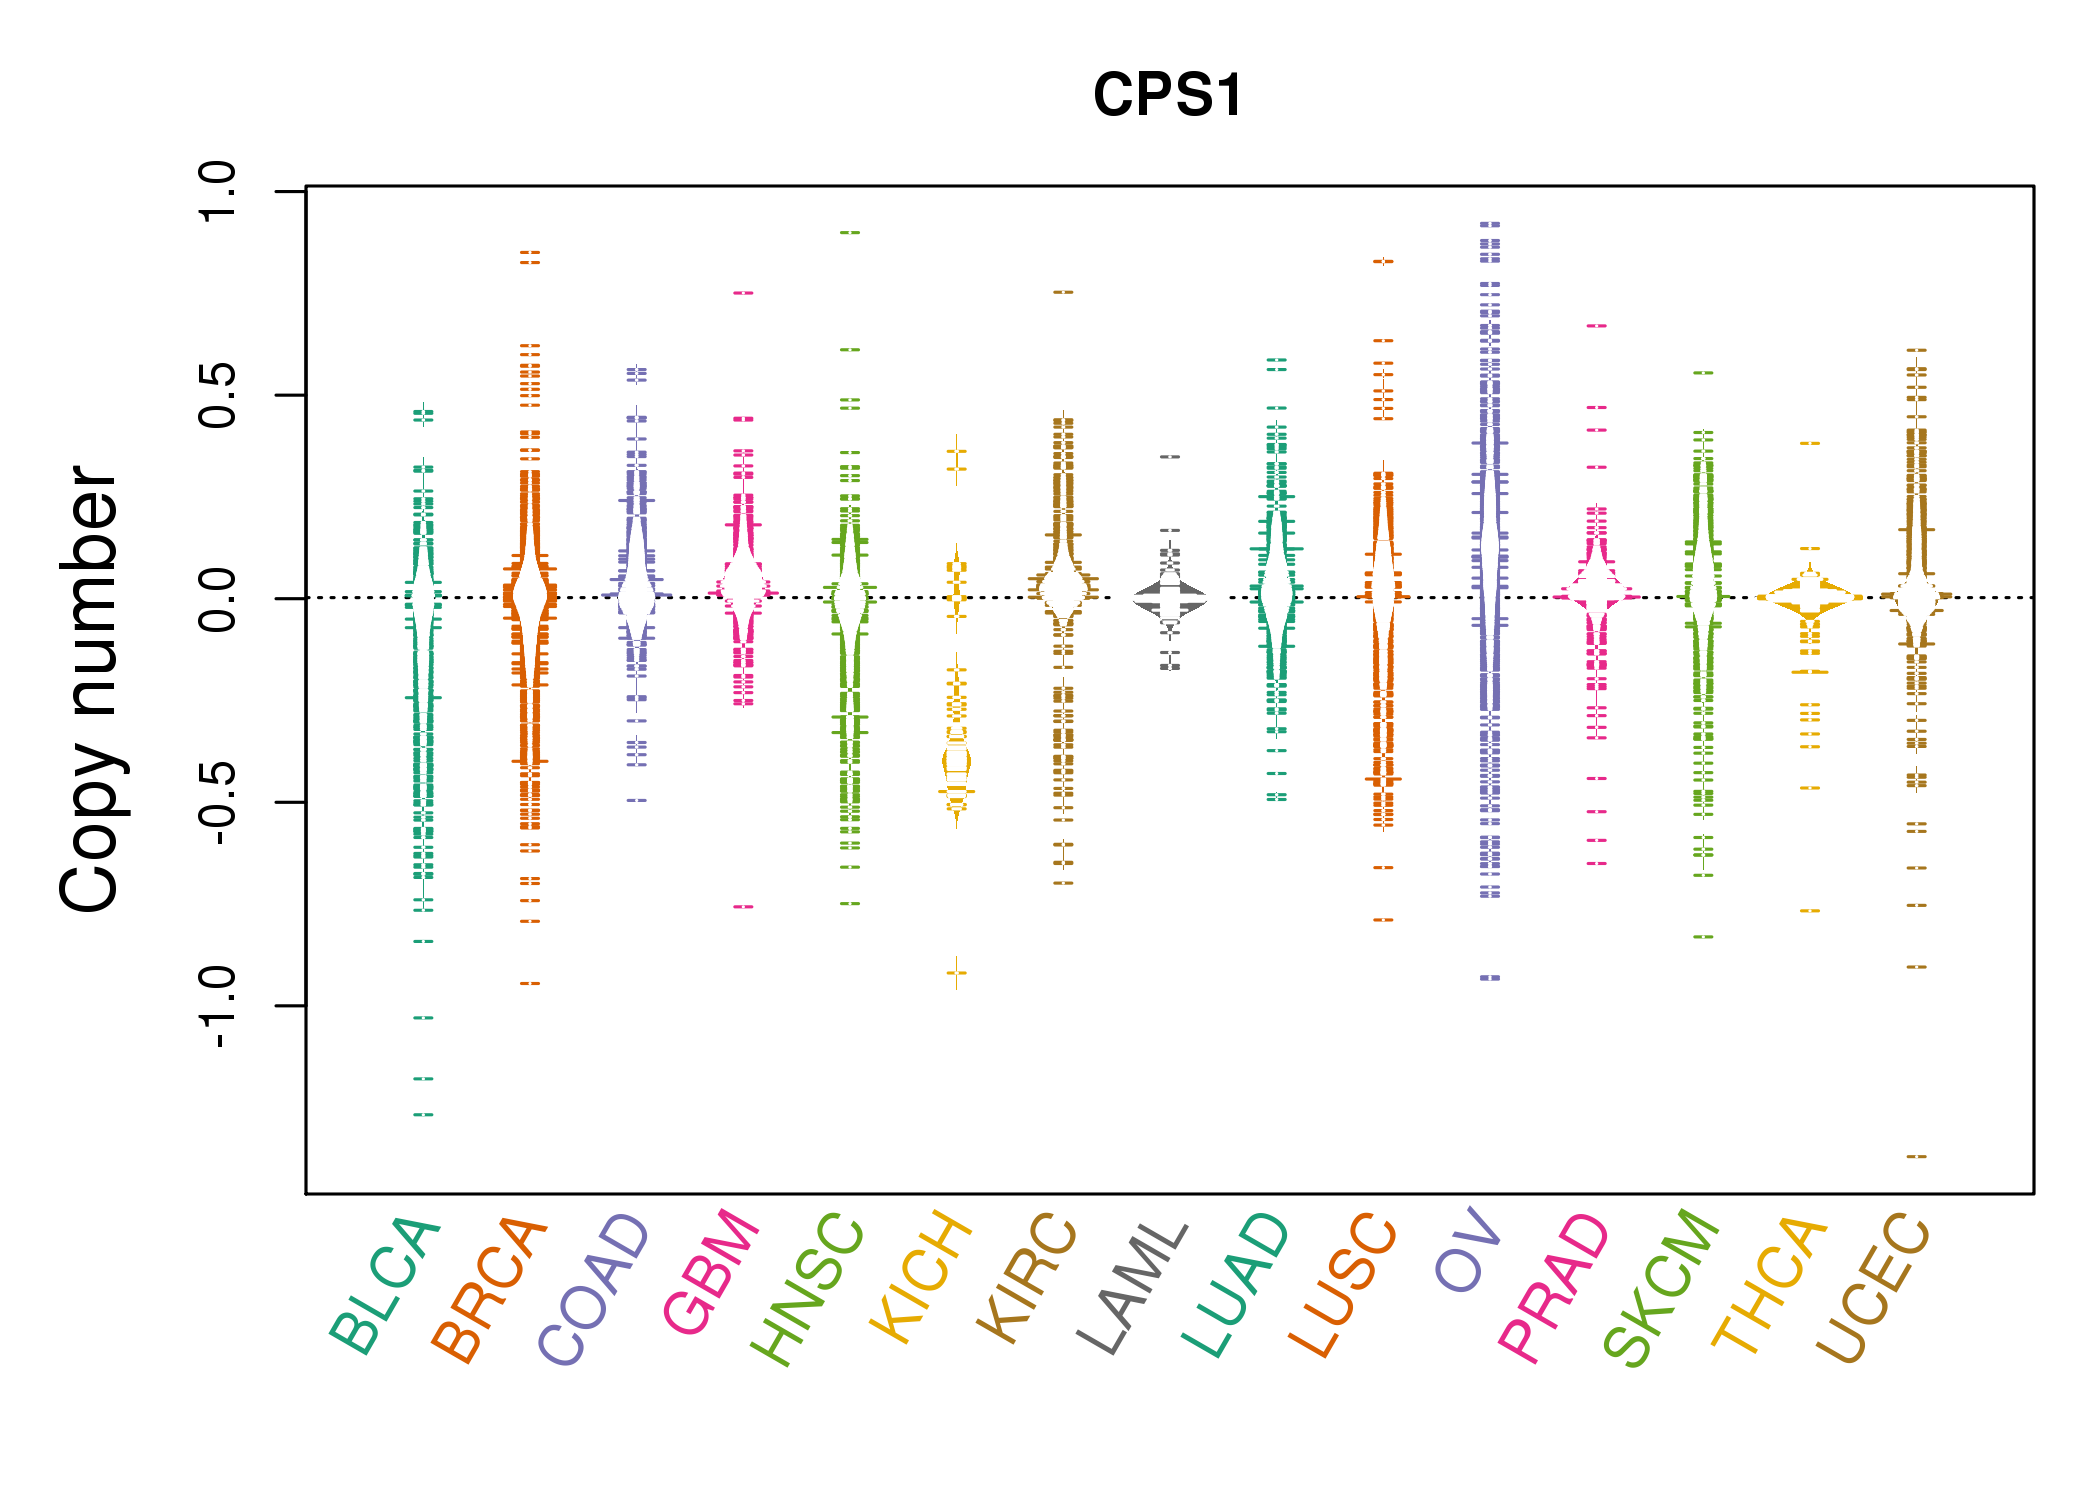 |
| cf) Tissue ID[Tissue type]: BLCA[Bladder Urothelial Carcinoma], BRCA[Breast invasive carcinoma], CESC[Cervical squamous cell carcinoma and endocervical adenocarcinoma], COAD[Colon adenocarcinoma], GBM[Glioblastoma multiforme], Glioma Low Grade, HNSC[Head and Neck squamous cell carcinoma], KICH[Kidney Chromophobe], KIRC[Kidney renal clear cell carcinoma], KIRP[Kidney renal papillary cell carcinoma], LAML[Acute Myeloid Leukemia], LUAD[Lung adenocarcinoma], LUSC[Lung squamous cell carcinoma], OV[Ovarian serous cystadenocarcinoma ], PAAD[Pancreatic adenocarcinoma], PRAD[Prostate adenocarcinoma], SKCM[Skin Cutaneous Melanoma], STAD[Stomach adenocarcinoma], THCA[Thyroid carcinoma], UCEC[Uterine Corpus Endometrial Carcinoma] |
| Top |
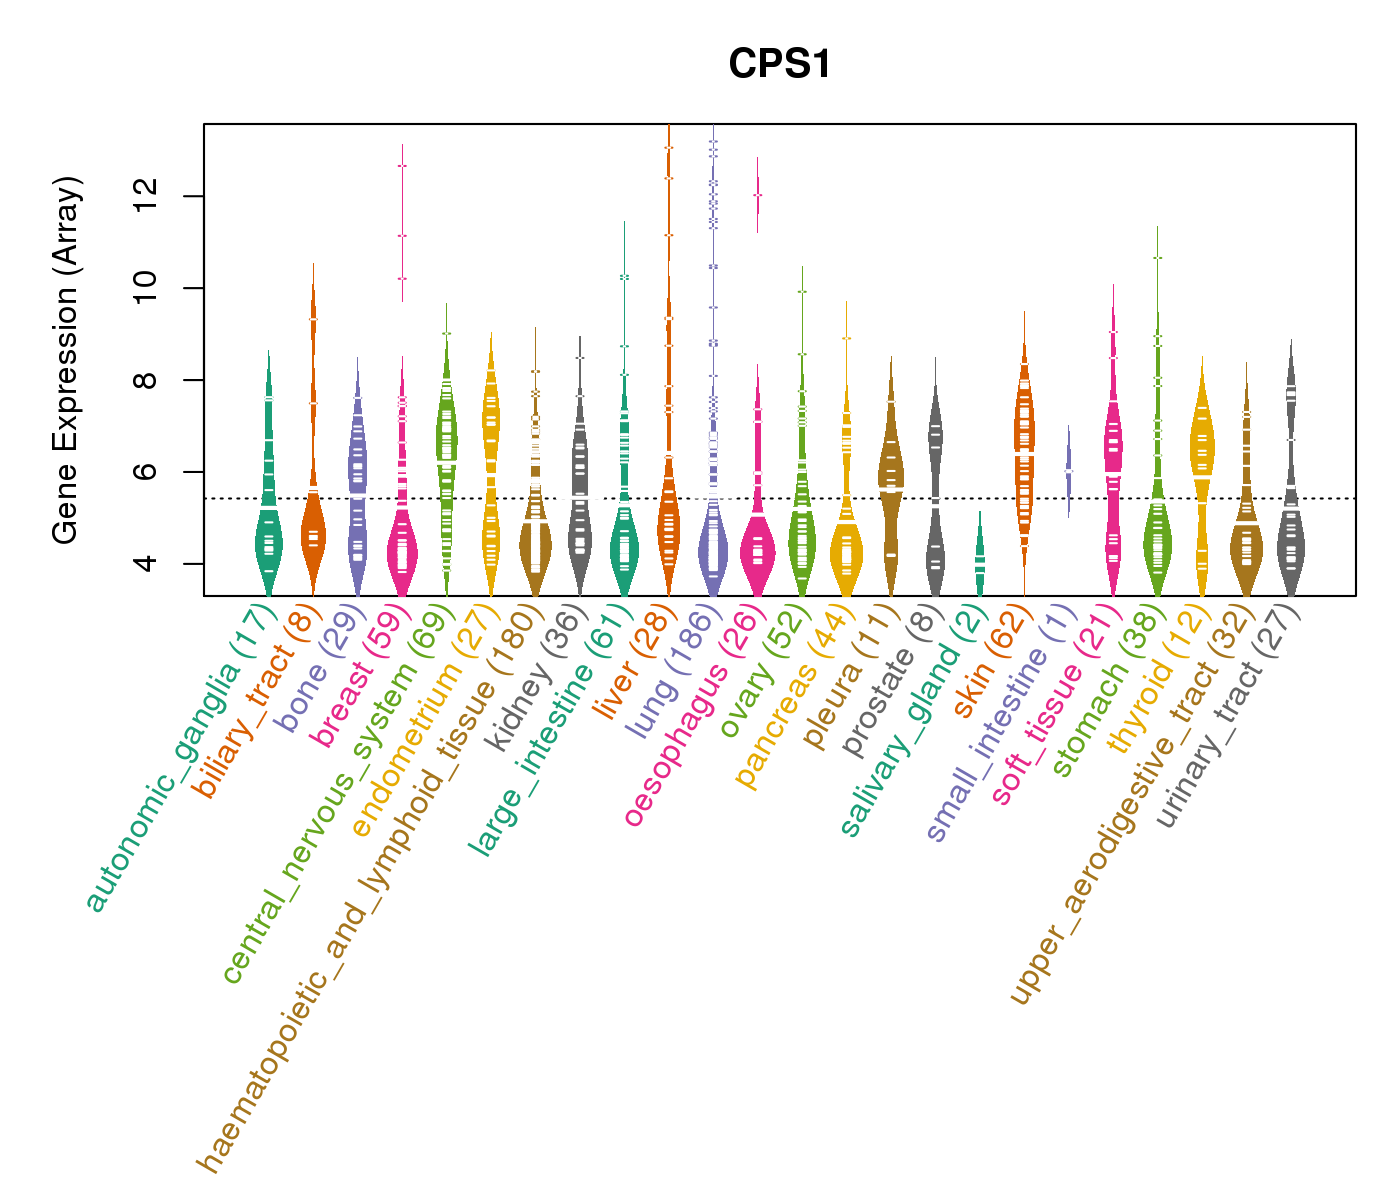
| Gene Expression for CPS1 |
| * CCLE gene expression data were extracted from CCLE_Expression_Entrez_2012-10-18.res: Gene-centric RMA-normalized mRNA expression data. |
 |
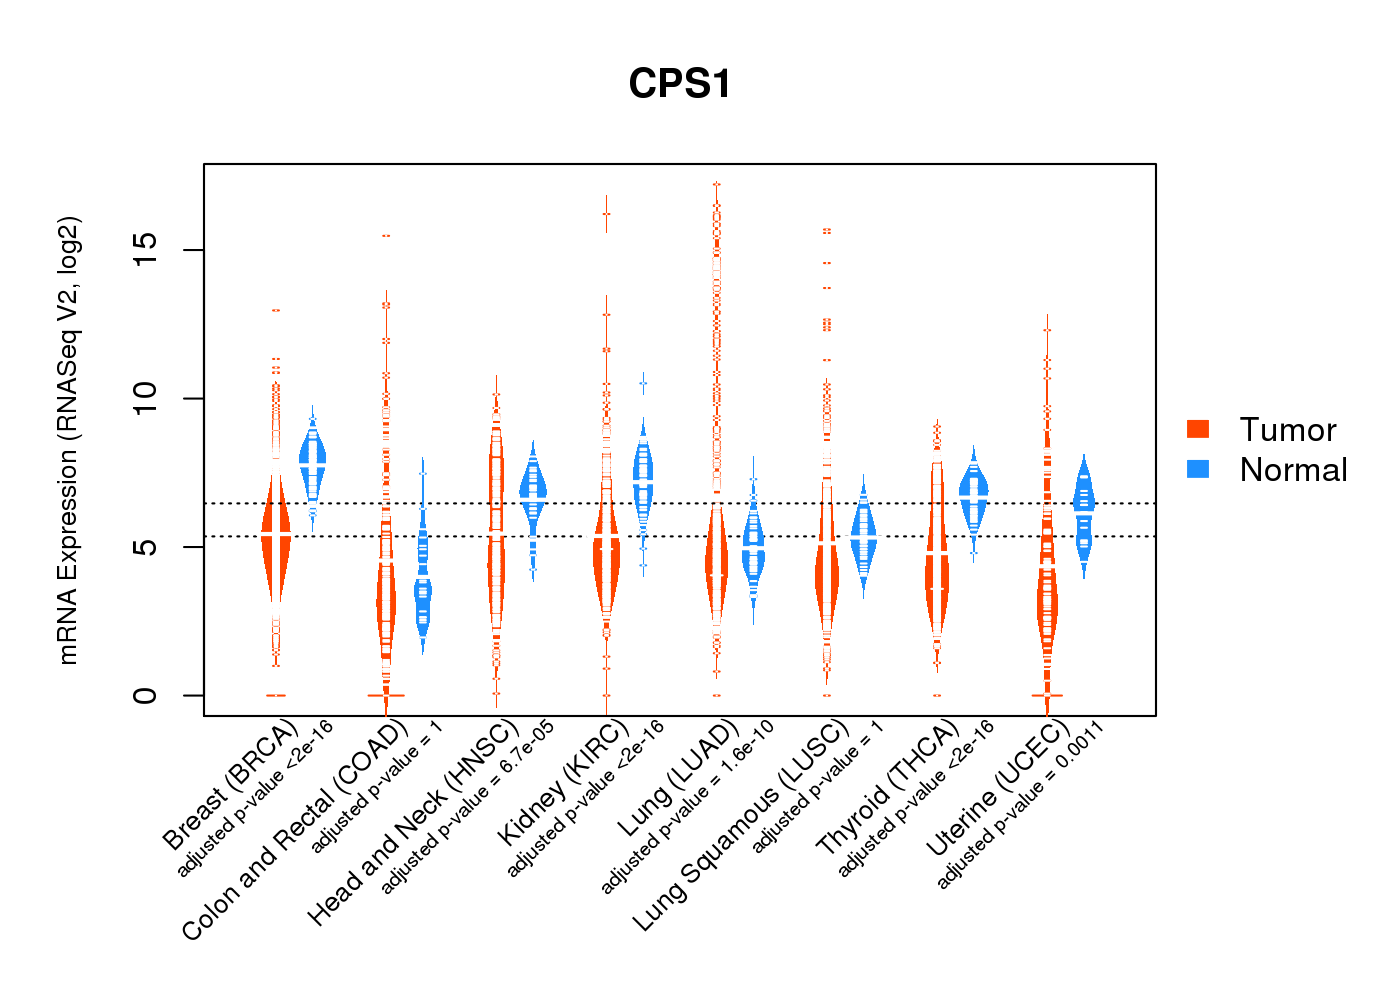
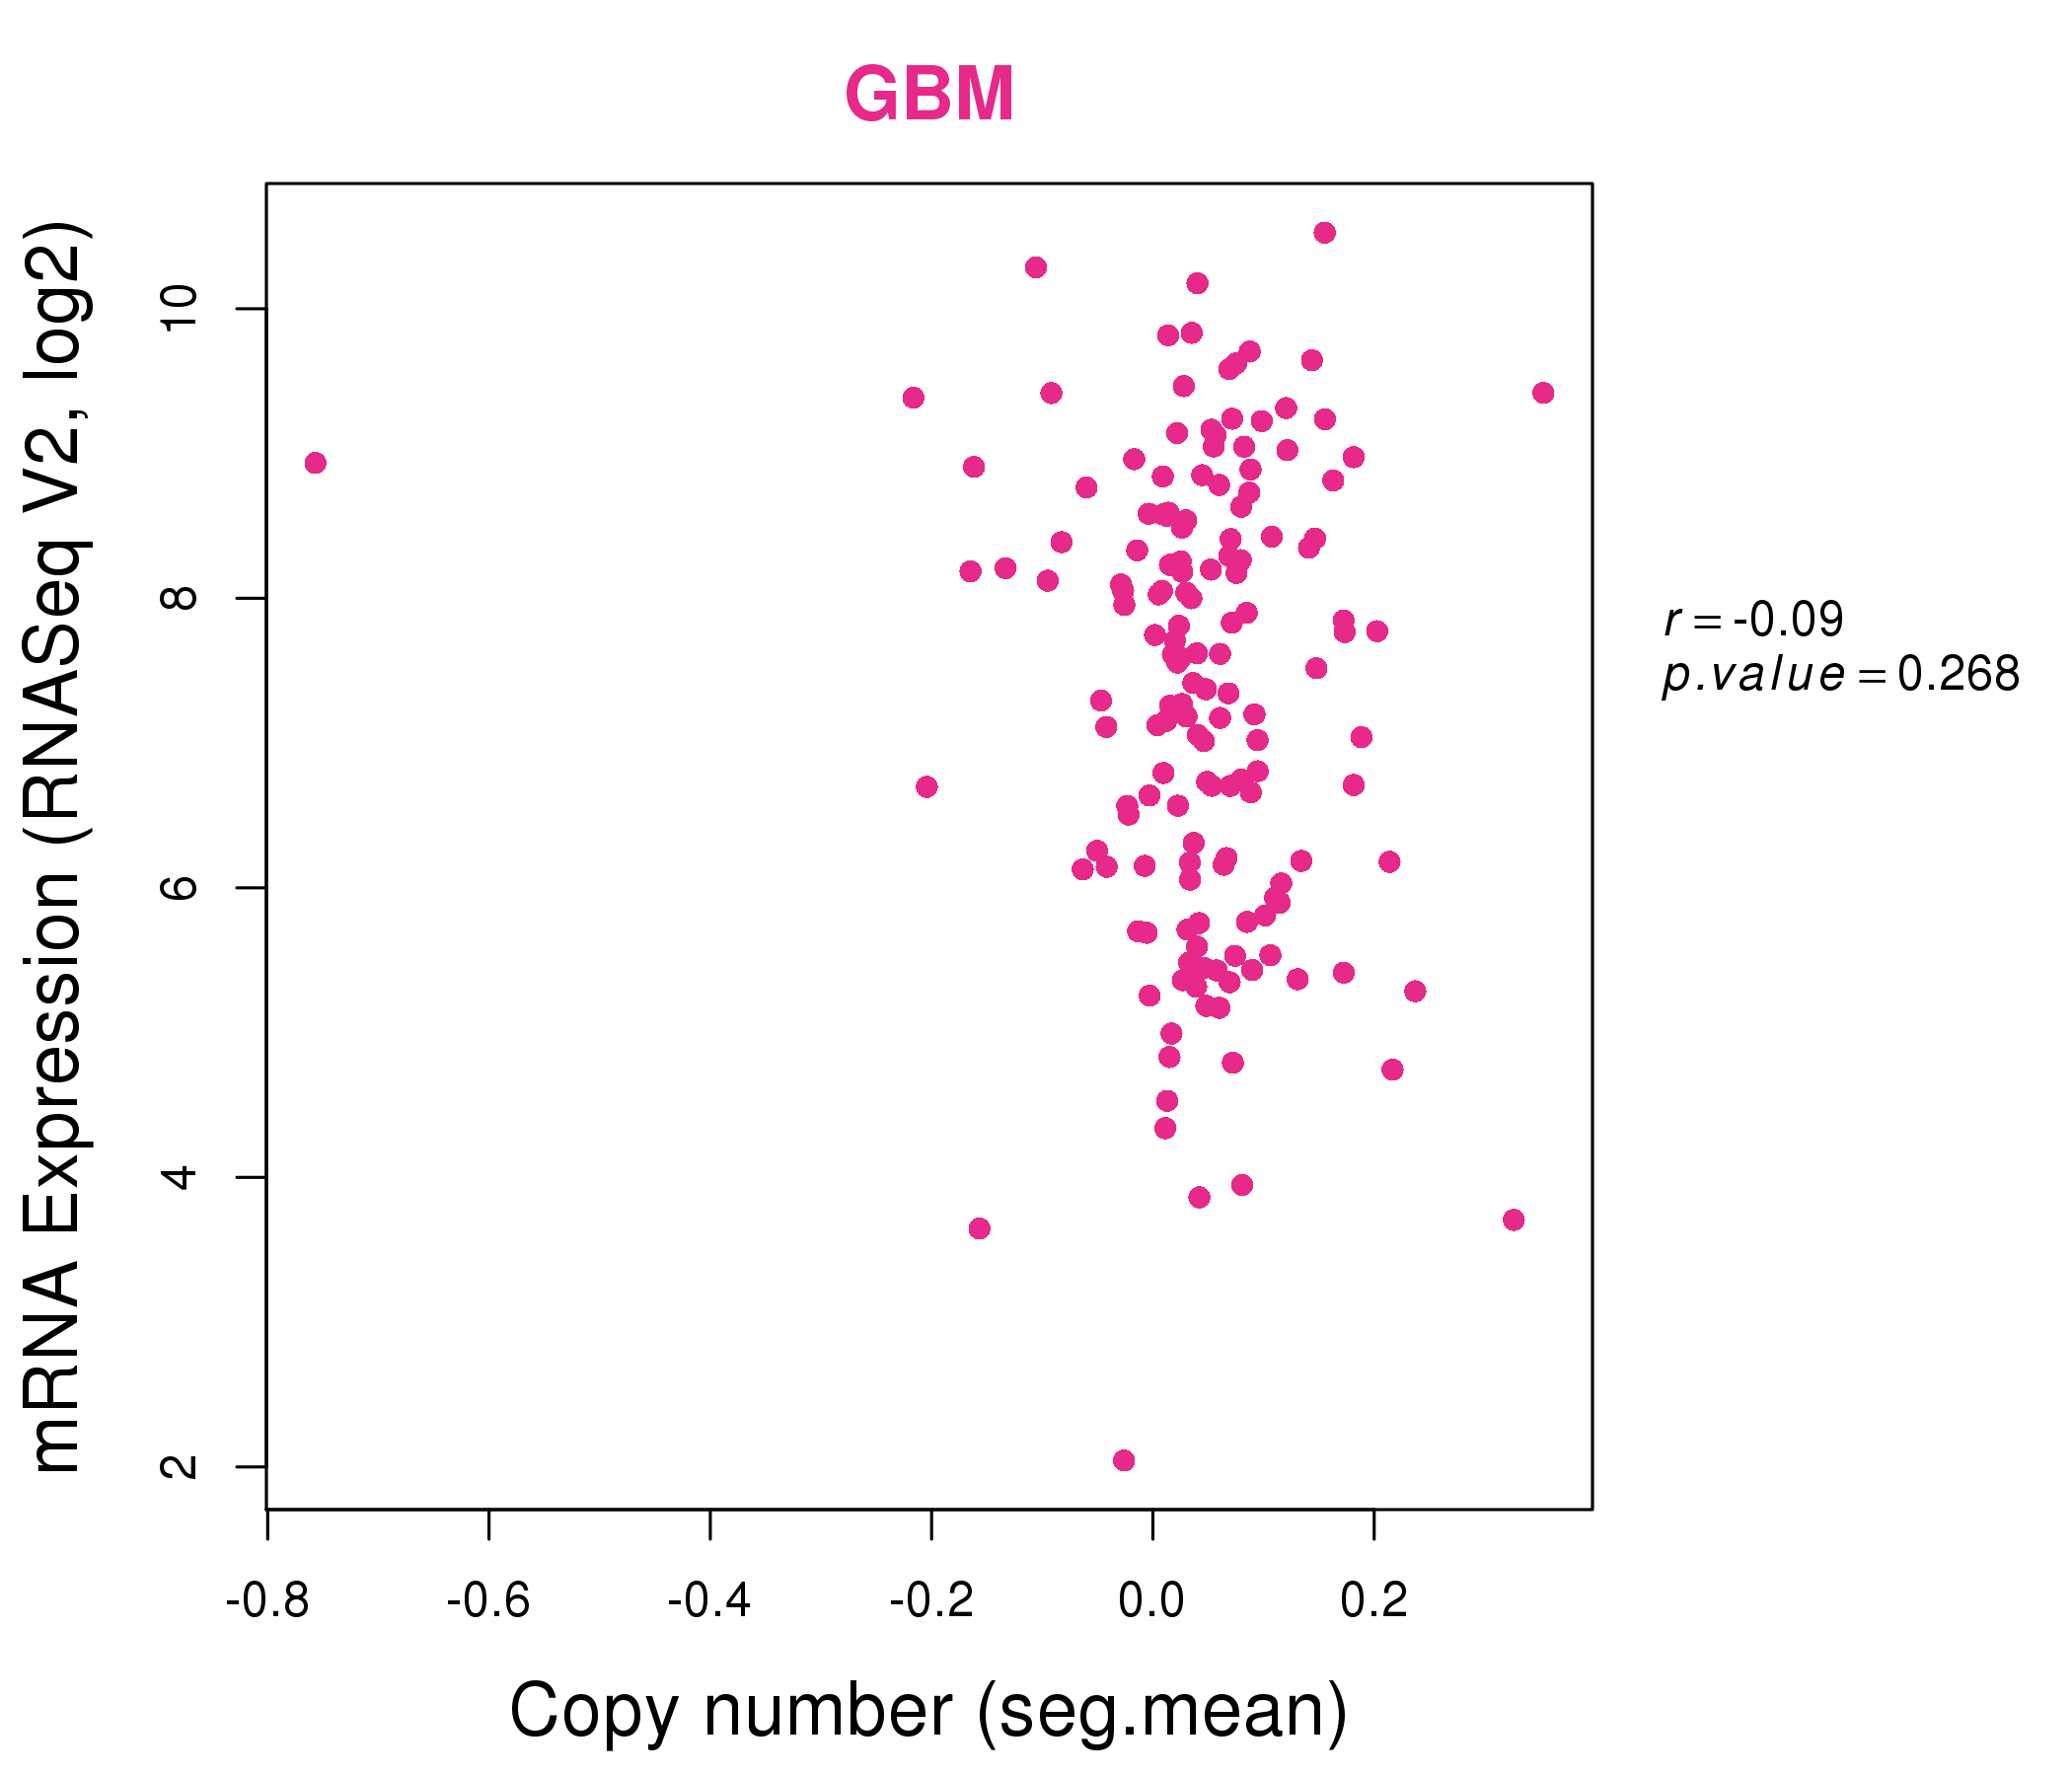
| * Normalized gene expression data of RNASeqV2 was extracted from TCGA using R package TCGA-Assembler. The URLs of all public data files on TCGA DCC data server were gathered at Jan-05-2015. Only eight cancer types have enough normal control samples for differential expression analysis. (t test, adjusted p<0.05 (using Benjamini-Hochberg FDR)) |
 |
| Top |
| * This plots show the correlation between CNV and gene expression. |
: Open all plots for all cancer types
 |
|
 |
|
| Top |
| Gene-Gene Network Information |
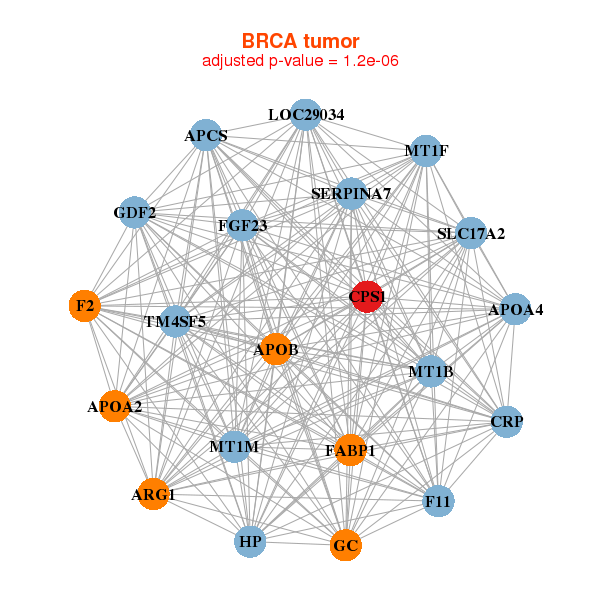
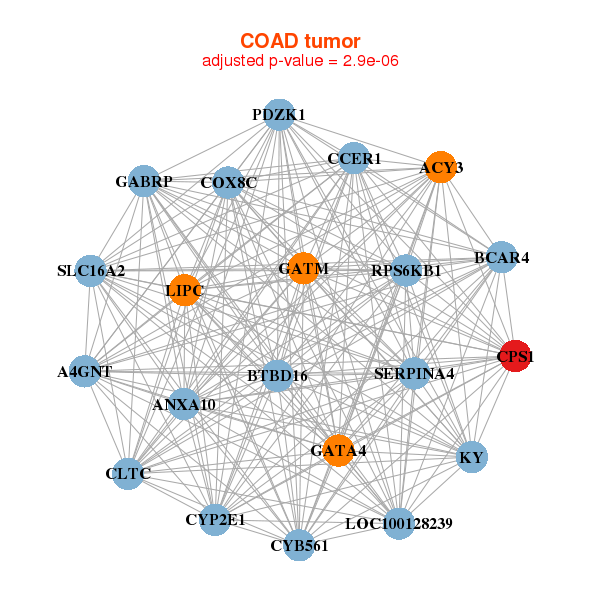
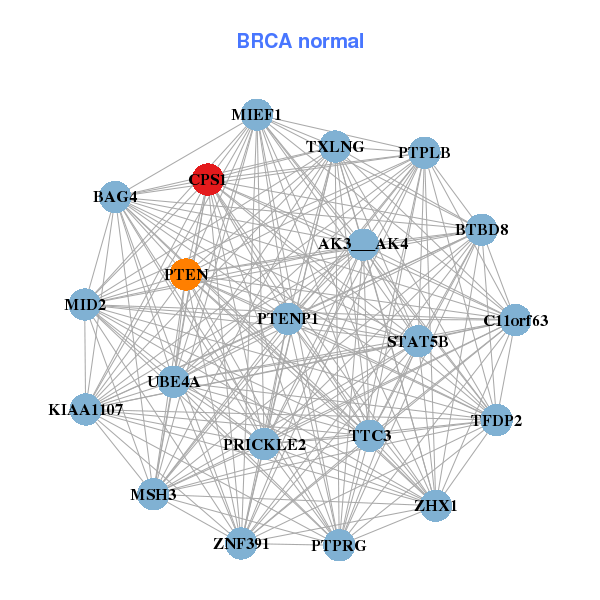
| * Co-Expression network figures were drawn using R package igraph. Only the top 20 genes with the highest correlations were shown. Red circle: input gene, orange circle: cell metabolism gene, sky circle: other gene |
: Open all plots for all cancer types
 |
| ||||
| APCS,APOA2,APOA4,APOB,ARG1,CPS1,CRP, F11,F2,FABP1,FGF23,GC,GDF2,HP, LOC29034,MT1B,MT1F,MT1M,SERPINA7,SLC17A2,TM4SF5 | AK3___AK4,BAG4,BTBD8,C11orf63,CPS1,KIAA1107,MID2, MSH3,PRICKLE2,PTEN,PTENP1,PTPLB,PTPRG,MIEF1, STAT5B,TFDP2,TTC3,TXLNG,UBE4A,ZHX1,ZNF391 | ||||
 |
| ||||
| A4GNT,ACY3,ANXA10,BCAR4,BTBD16,CCER1,CLTC, COX8C,CPS1,CYB561,CYP2E1,GABRP,GATA4,GATM, KY,LIPC,LOC100128239,PDZK1,RPS6KB1,SERPINA4,SLC16A2 | APOA1,APOA4,APOB,APOC3,C17orf78,CPO,CPS1, CRISP1,CUBN,ENPEP,FAM99A,FAM99B,GSTA5,KCNJ13, LCE3E,LOC388428,MOS,ONECUT3,OR10H1,OR10H5,OR4N5, PWAR4___F2RL3___PAWR,SPANXN3,TMPR |

| * Co-Expression network figures were drawn using R package igraph. Only the top 20 genes with the highest correlations were shown. Red circle: input gene, orange circle: cell metabolism gene, sky circle: other gene |
: Open all plots for all cancer types
| Top |
: Open all interacting genes' information including KEGG pathway for all interacting genes from DAVID
| Top |
| Pharmacological Information for CPS1 |
| DB Category | DB Name | DB's ID and Url link |
| * Gene Centered Interaction Network. |
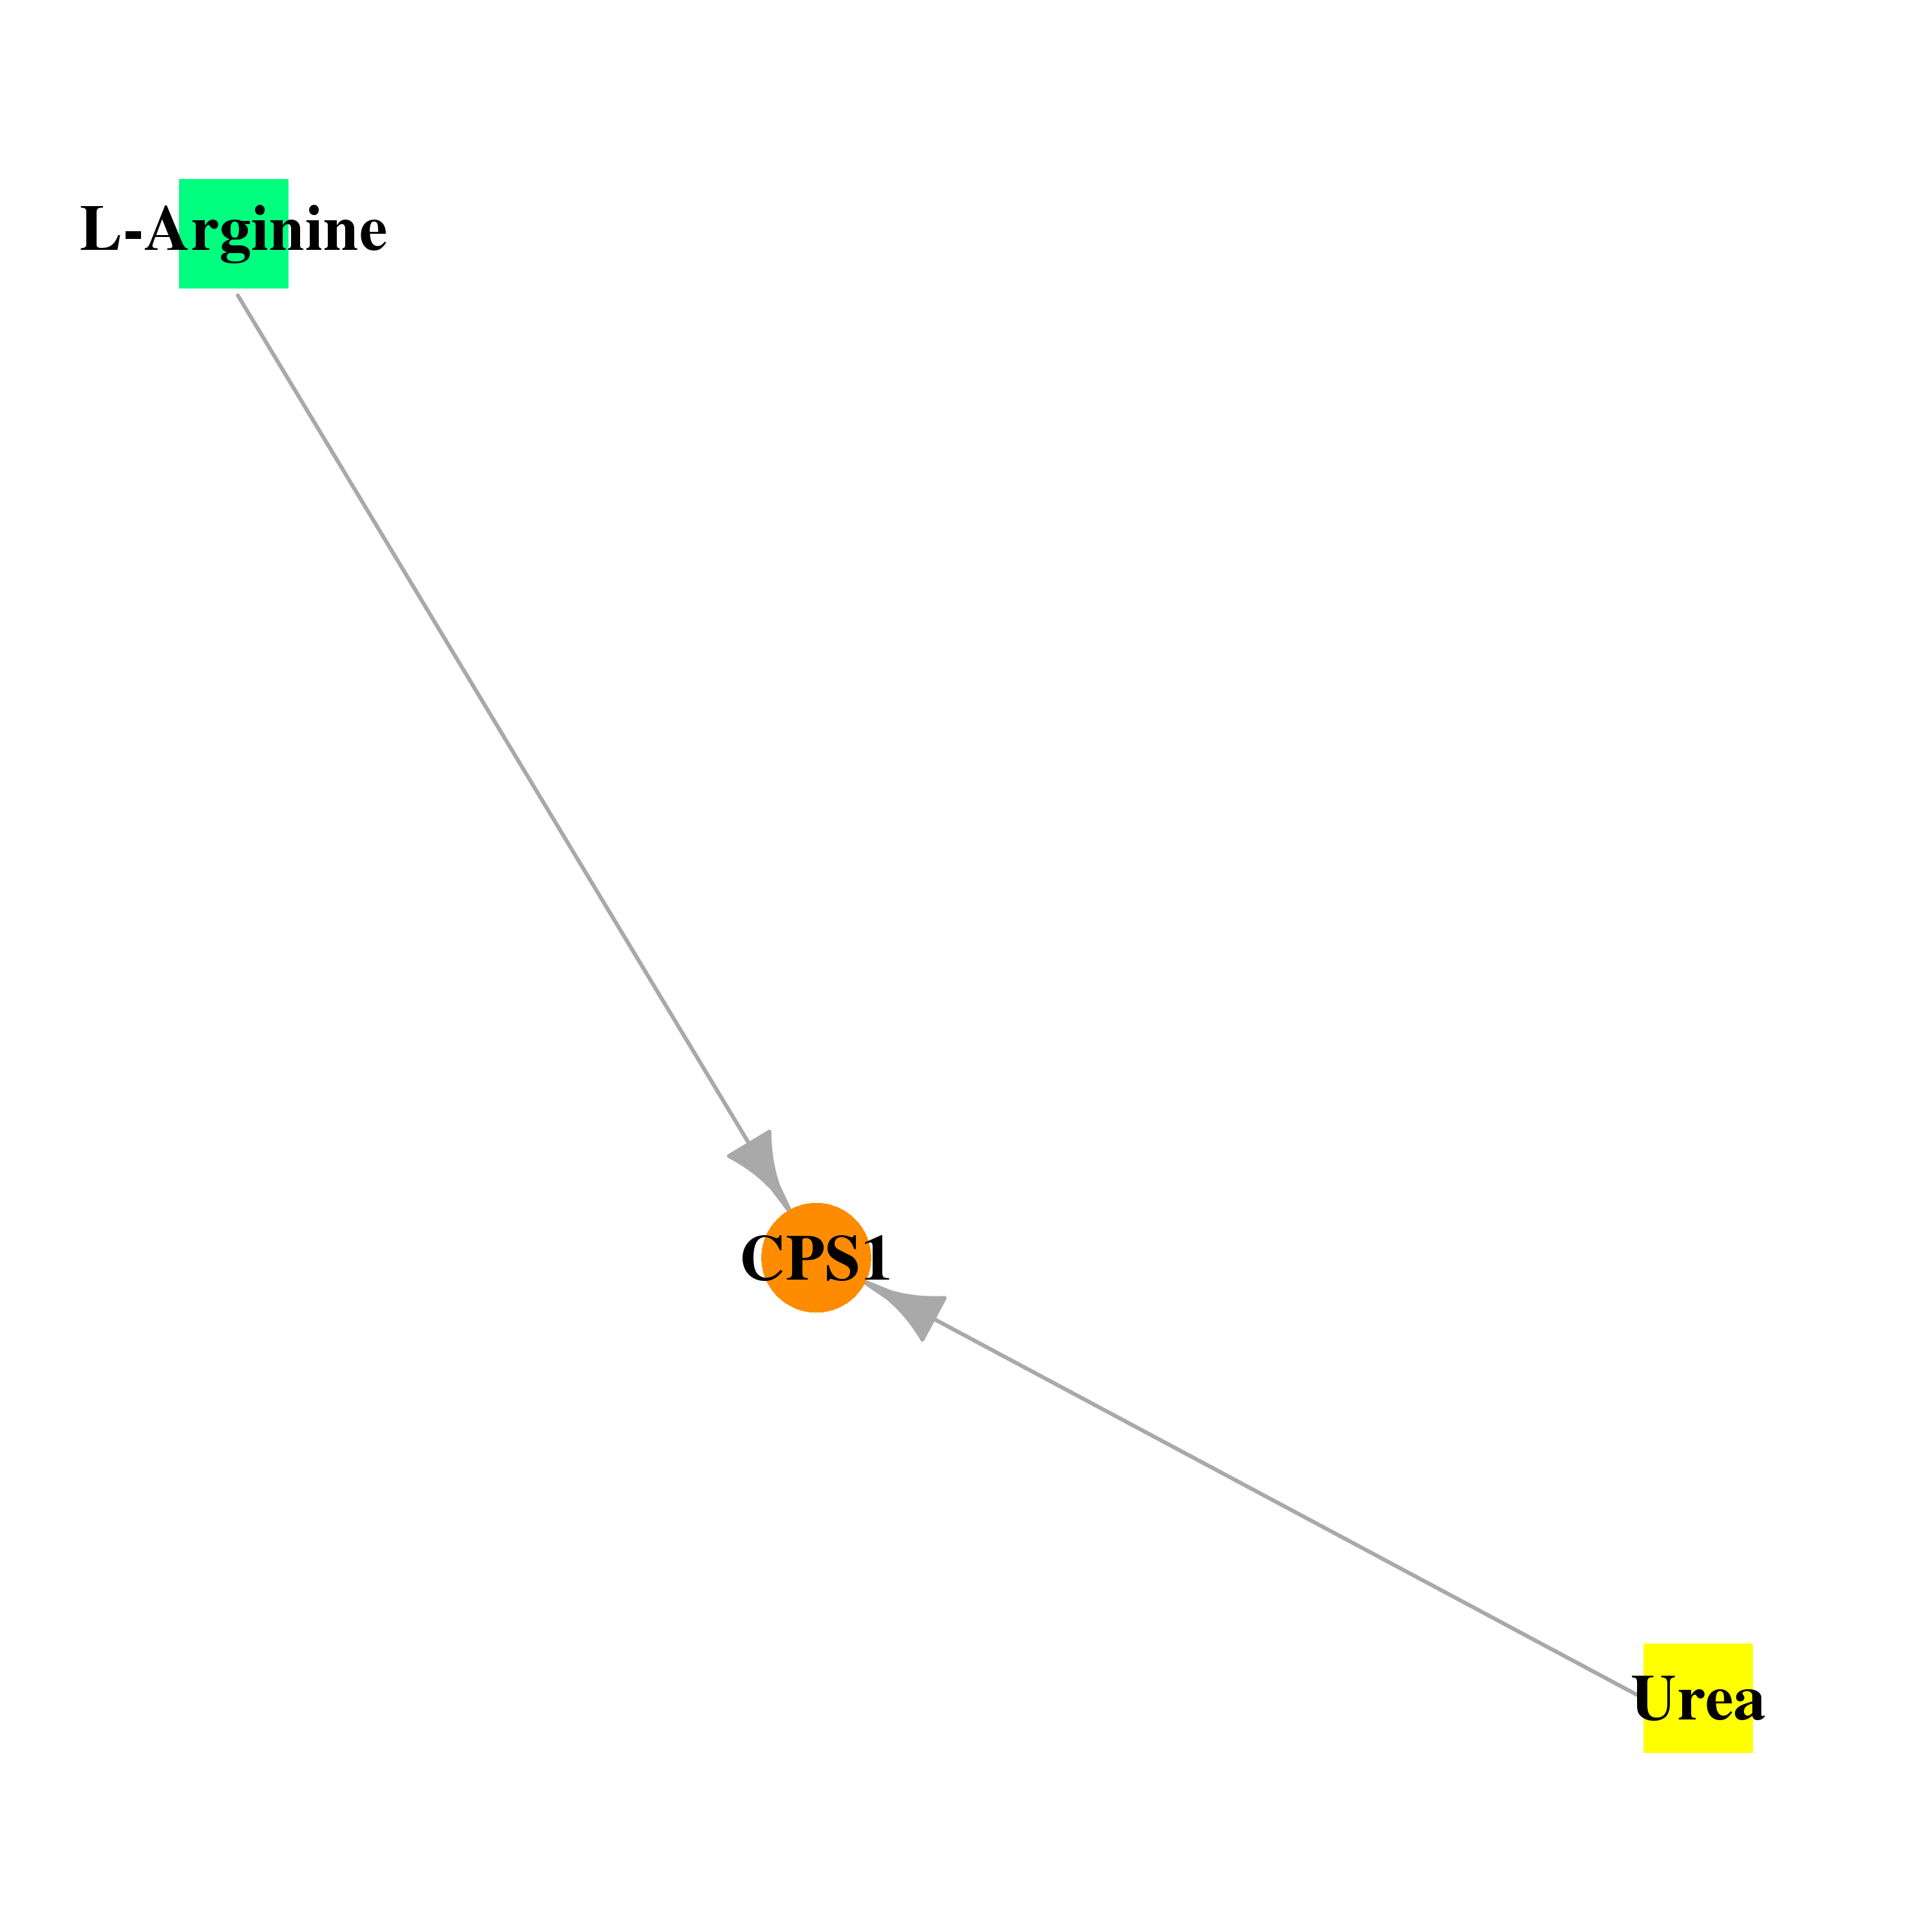 |
| * Drug Centered Interaction Network. |
| DrugBank ID | Target Name | Drug Groups | Generic Name | Drug Centered Network | Drug Structure |
| DB00125 | carbamoyl-phosphate synthase 1, mitochondrial | approved; nutraceutical | L-Arginine |  |  |
| DB03904 | carbamoyl-phosphate synthase 1, mitochondrial | experimental | Urea |  | 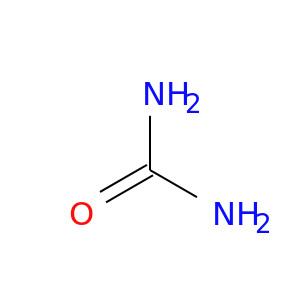 |
| Top |
| Cross referenced IDs for CPS1 |
| * We obtained these cross-references from Uniprot database. It covers 150 different DBs, 18 categories. http://www.uniprot.org/help/cross_references_section |
: Open all cross reference information
|
Copyright © 2016-Present - The Univsersity of Texas Health Science Center at Houston @ |