|
|||||||||||||||||||||||||||||||||||||||||||||||||||||||||||||||||||||||||||||||||||||||||||||||||||||||||||||||||||||||||||||||||||||||||||||||||||||||||||||||||||||||||||||||||||||||||||||||||||||||||||||||||||||||||||||||||||||||||||||||||||||||||||||||||||||||||||||||||||||||||||||||||||||||||||||||||||||||||||||||||||||||||||||||||||
| |
| Phenotypic Information (metabolism pathway, cancer, disease, phenome) |
| |
| |
| Gene-Gene Network Information: Co-Expression Network, Interacting Genes & KEGG |
| |
|


| Gene Summary for CPT1A |
| Basic gene info. | Gene symbol | CPT1A |
| Gene name | carnitine palmitoyltransferase 1A (liver) | |
| Synonyms | CPT1|CPT1-L|L-CPT1 | |
| Cytomap | UCSC genome browser: 11q13.2 | |
| Genomic location | chr11 :68522087-68609399 | |
| Type of gene | protein-coding | |
| RefGenes | NM_001031847.2, NM_001876.3, | |
| Ensembl id | ENSG00000110090 | |
| Description | CPT ICPTI-Lcarnitine O-palmitoyltransferase 1, liver isoformcarnitine O-palmitoyltransferase I, liver isoformcarnitine palmitoyltransferase I, liver | |
| Modification date | 20141219 | |
| dbXrefs | MIM : 600528 | |
| HGNC : HGNC | ||
| Ensembl : ENSG00000110090 | ||
| HPRD : 02755 | ||
| Vega : OTTHUMG00000167892 | ||
| Protein | UniProt: go to UniProt's Cross Reference DB Table | |
| Expression | CleanEX: HS_CPT1A | |
| BioGPS: 1374 | ||
| Gene Expression Atlas: ENSG00000110090 | ||
| The Human Protein Atlas: ENSG00000110090 | ||
| Pathway | NCI Pathway Interaction Database: CPT1A | |
| KEGG: CPT1A | ||
| REACTOME: CPT1A | ||
| ConsensusPathDB | ||
| Pathway Commons: CPT1A | ||
| Metabolism | MetaCyc: CPT1A | |
| HUMANCyc: CPT1A | ||
| Regulation | Ensembl's Regulation: ENSG00000110090 | |
| miRBase: chr11 :68,522,087-68,609,399 | ||
| TargetScan: NM_001031847 | ||
| cisRED: ENSG00000110090 | ||
| Context | iHOP: CPT1A | |
| cancer metabolism search in PubMed: CPT1A | ||
| UCL Cancer Institute: CPT1A | ||
| Assigned class in ccmGDB | A - This gene has a literature evidence and it belongs to cancer gene. | |
| References showing role of CPT1A in cancer cell metabolism | 1. Patsoukis N, Bardhan K, Chatterjee P, Sari D, Liu B, et al. (2015) PD-1 alters T-cell metabolic reprogramming by inhibiting glycolysis and promoting lipolysis and fatty acid oxidation. Nat Commun 6: 6692. doi: 10.1038/ncomms7692. pmid: 4389235. go to article 2. Patella F, Schug ZT, Persi E, Neilson LJ, Erami Z, et al. (2015) Proteomics-based metabolic modeling reveals that fatty acid oxidation (FAO) controls endothelial cell (EC) permeability. Mol Cell Proteomics 14: 621-634. doi: 10.1074/mcp.M114.045575. pmid: 4349982. go to article 3. Roy D, Mondal S, Wang C, He X, Khurana A, et al. (2014) Loss of HSulf-1 promotes altered lipid metabolism in ovarian cancer. Cancer Metab 2: 13. doi: 10.1186/2049-3002-2-13. pmid: 4164348. go to article 4. Schlaepfer IR, Rider L, Rodrigues LU, Gijon MA, Pac CT, et al. (2014) Lipid catabolism via CPT1 as a therapeutic target for prostate cancer. Mol Cancer Ther 13: 2361-2371. doi: 10.1158/1535-7163.MCT-14-0183. pmid: 4185227. go to article 5. Cirillo A, Di Salle A, Petillo O, Melone MA, Grimaldi G, et al. (2014) High grade glioblastoma is associated with aberrant expression of ZFP57, a protein involved in gene imprinting, and of CPT1A and CPT1C that regulate fatty acid metabolism. Cancer Biol Ther 15: 735-741. doi: 10.4161/cbt.28408. pmid: 4049789. go to article | |
| Top |
| Phenotypic Information for CPT1A(metabolism pathway, cancer, disease, phenome) |
| Cancer | CGAP: CPT1A |
| Familial Cancer Database: CPT1A | |
| * This gene is included in those cancer gene databases. |
|
|
|
|
|
|
| |||||||||||||||||||||||||||||||||||||||||||||||||||||||||||||||||||||||||||||||||||||||||||||||||||||||||||||||||||||||||||||||||||||||||||||||||||||||||||||||||||||||||||||||||||||||||||||||||||||||||||||||||||||||||||||||||||||||||||||||||||||||||||||||||||||||||||||||||||||||||||||||||||||||||||||||||||||||||||||||||||||||||||||
Oncogene 1 | Significant driver gene in | ||||||||||||||||||||||||||||||||||||||||||||||||||||||||||||||||||||||||||||||||||||||||||||||||||||||||||||||||||||||||||||||||||||||||||||||||||||||||||||||||||||||||||||||||||||||||||||||||||||||||||||||||||||||||||||||||||||||||||||||||||||||||||||||||||||||||||||||||||||||||||||||||||||||||||||||||||||||||||||||||||||||||||||||||||
| cf) number; DB name 1 Oncogene; http://nar.oxfordjournals.org/content/35/suppl_1/D721.long, 2 Tumor Suppressor gene; https://bioinfo.uth.edu/TSGene/, 3 Cancer Gene Census; http://www.nature.com/nrc/journal/v4/n3/abs/nrc1299.html, 4 CancerGenes; http://nar.oxfordjournals.org/content/35/suppl_1/D721.long, 5 Network of Cancer Gene; http://ncg.kcl.ac.uk/index.php, 1Therapeutic Vulnerabilities in Cancer; http://cbio.mskcc.org/cancergenomics/statius/ |
| KEGG_FATTY_ACID_METABOLISM REACTOME_METABOLISM_OF_LIPIDS_AND_LIPOPROTEINS | |
| OMIM | |
| Orphanet | |
| Disease | KEGG Disease: CPT1A |
| MedGen: CPT1A (Human Medical Genetics with Condition) | |
| ClinVar: CPT1A | |
| Phenotype | MGI: CPT1A (International Mouse Phenotyping Consortium) |
| PhenomicDB: CPT1A | |
| Mutations for CPT1A |
| * Under tables are showing count per each tissue to give us broad intuition about tissue specific mutation patterns.You can go to the detailed page for each mutation database's web site. |
| - Statistics for Tissue and Mutation type | Top |
 |
| - For Inter-chromosomal Variations |
| There's no inter-chromosomal structural variation. |
| - For Intra-chromosomal Variations |
| * Intra-chromosomal variantions includes 'intrachromosomal amplicon to amplicon', 'intrachromosomal amplicon to non-amplified dna', 'intrachromosomal deletion', 'intrachromosomal fold-back inversion', 'intrachromosomal inversion', 'intrachromosomal tandem duplication', 'Intrachromosomal unknown type', 'intrachromosomal with inverted orientation', 'intrachromosomal with non-inverted orientation'. |
 |
| Sample | Symbol_a | Chr_a | Start_a | End_a | Symbol_b | Chr_b | Start_b | End_b |
| haematopoietic_and_lymphoid_tissue | CPT1A | chr11 | 68567886 | 68567886 | CPT1A | chr11 | 68567886 | 68567886 |
| cf) Tissue number; Tissue name (1;Breast, 2;Central_nervous_system, 3;Haematopoietic_and_lymphoid_tissue, 4;Large_intestine, 5;Liver, 6;Lung, 7;Ovary, 8;Pancreas, 9;Prostate, 10;Skin, 11;Soft_tissue, 12;Upper_aerodigestive_tract) |
| * From mRNA Sanger sequences, Chitars2.0 arranged chimeric transcripts. This table shows CPT1A related fusion information. |
| ID | Head Gene | Tail Gene | Accession | Gene_a | qStart_a | qEnd_a | Chromosome_a | tStart_a | tEnd_a | Gene_a | qStart_a | qEnd_a | Chromosome_a | tStart_a | tEnd_a |
| AK309464 | CPT1A | 1 | 1887 | 11 | 68540732 | 68607152 | RDH5 | 1885 | 2165 | 12 | 56117668 | 56118220 | |
| BM970771 | CPT1A | 15 | 152 | 11 | 68522351 | 68522488 | C16orf72 | 147 | 634 | 16 | 9210267 | 9210755 | |
| BM041208 | CPT1A | 2 | 681 | 11 | 68552431 | 68575053 | GAPDH | 662 | 705 | 12 | 6647494 | 6647537 | |
| CB154699 | CPT1A | 15 | 243 | 11 | 68523181 | 68523409 | FGG | 232 | 537 | 4 | 155525288 | 155526135 | |
| Top |
| Mutation type/ Tissue ID | brca | cns | cerv | endome | haematopo | kidn | Lintest | liver | lung | ns | ovary | pancre | prost | skin | stoma | thyro | urina | |||
| Total # sample | 23 | 1 | 5 | 1 | 1 | |||||||||||||||
| GAIN (# sample) | 23 | 1 | 4 | 1 | 1 | |||||||||||||||
| LOSS (# sample) | 1 |
| cf) Tissue ID; Tissue type (1; Breast, 2; Central_nervous_system, 3; Cervix, 4; Endometrium, 5; Haematopoietic_and_lymphoid_tissue, 6; Kidney, 7; Large_intestine, 8; Liver, 9; Lung, 10; NS, 11; Ovary, 12; Pancreas, 13; Prostate, 14; Skin, 15; Stomach, 16; Thyroid, 17; Urinary_tract) |
| Top |
|
 |
| Top |
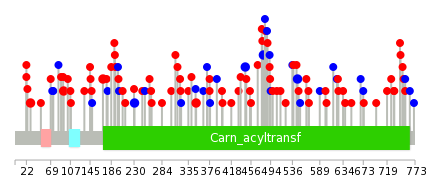
| Stat. for Non-Synonymous SNVs (# total SNVs=61) | (# total SNVs=23) |
 |  |
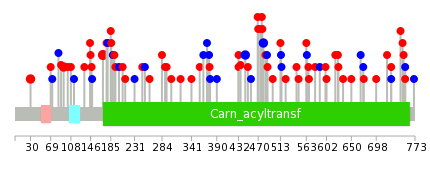
(# total SNVs=0) | (# total SNVs=0) |
| Top |
| * When you move the cursor on each content, you can see more deailed mutation information on the Tooltip. Those are primary_site,primary_histology,mutation(aa),pubmedID. |
| GRCh37 position | Mutation(aa) | Unique sampleID count |
| chr11:68566686-68566686 | p.Y231Y | 3 |
| chr11:68542876-68542876 | p.Q495* | 2 |
| chr11:68582853-68582853 | p.Q30H | 2 |
| chr11:68540835-68540835 | p.F546F | 2 |
| chr11:68552320-68552320 | p.G376R | 2 |
| chr11:68579905-68579905 | p.A94V | 2 |
| chr11:68549256-68549256 | p.H445H | 2 |
| chr11:68571514-68571514 | p.S170L | 2 |
| chr11:68552398-68552398 | p.D350N | 2 |
| chr11:68548126-68548126 | p.I480I | 2 |
| Top |
|
 |
| Point Mutation/ Tissue ID | 1 | 2 | 3 | 4 | 5 | 6 | 7 | 8 | 9 | 10 | 11 | 12 | 13 | 14 | 15 | 16 | 17 | 18 | 19 | 20 |
| # sample | 3 | 4 | 18 | 2 | 10 | 10 | 7 | 3 | 15 | 8 | 10 | |||||||||
| # mutation | 3 | 4 | 18 | 2 | 10 | 11 | 7 | 3 | 15 | 8 | 13 | |||||||||
| nonsynonymous SNV | 2 | 3 | 14 | 1 | 4 | 10 | 4 | 2 | 9 | 7 | 9 | |||||||||
| synonymous SNV | 1 | 1 | 4 | 1 | 6 | 1 | 3 | 1 | 6 | 1 | 4 |
| cf) Tissue ID; Tissue type (1; BLCA[Bladder Urothelial Carcinoma], 2; BRCA[Breast invasive carcinoma], 3; CESC[Cervical squamous cell carcinoma and endocervical adenocarcinoma], 4; COAD[Colon adenocarcinoma], 5; GBM[Glioblastoma multiforme], 6; Glioma Low Grade, 7; HNSC[Head and Neck squamous cell carcinoma], 8; KICH[Kidney Chromophobe], 9; KIRC[Kidney renal clear cell carcinoma], 10; KIRP[Kidney renal papillary cell carcinoma], 11; LAML[Acute Myeloid Leukemia], 12; LUAD[Lung adenocarcinoma], 13; LUSC[Lung squamous cell carcinoma], 14; OV[Ovarian serous cystadenocarcinoma ], 15; PAAD[Pancreatic adenocarcinoma], 16; PRAD[Prostate adenocarcinoma], 17; SKCM[Skin Cutaneous Melanoma], 18:STAD[Stomach adenocarcinoma], 19:THCA[Thyroid carcinoma], 20:UCEC[Uterine Corpus Endometrial Carcinoma]) |
| Top |
| * We represented just top 10 SNVs. When you move the cursor on each content, you can see more deailed mutation information on the Tooltip. Those are primary_site, primary_histology, mutation(aa), pubmedID. |
| Genomic Position | Mutation(aa) | Unique sampleID count |
| chr11:68571514 | p.S170L,CPT1A | 3 |
| chr11:68549256 | p.I480I,CPT1A | 2 |
| chr11:68582853 | p.A94V,CPT1A | 2 |
| chr11:68548126 | p.Q30H,CPT1A | 2 |
| chr11:68579905 | p.H445H,CPT1A | 2 |
| chr11:68548198 | p.S371S,CPT1A | 1 |
| chr11:68571493 | p.M194L,CPT1A | 1 |
| chr11:68529011 | p.R749C | 1 |
| chr11:68552354 | p.Y589Y,CPT1A | 1 |
| chr11:68579920 | p.K580R,CPT1A | 1 |
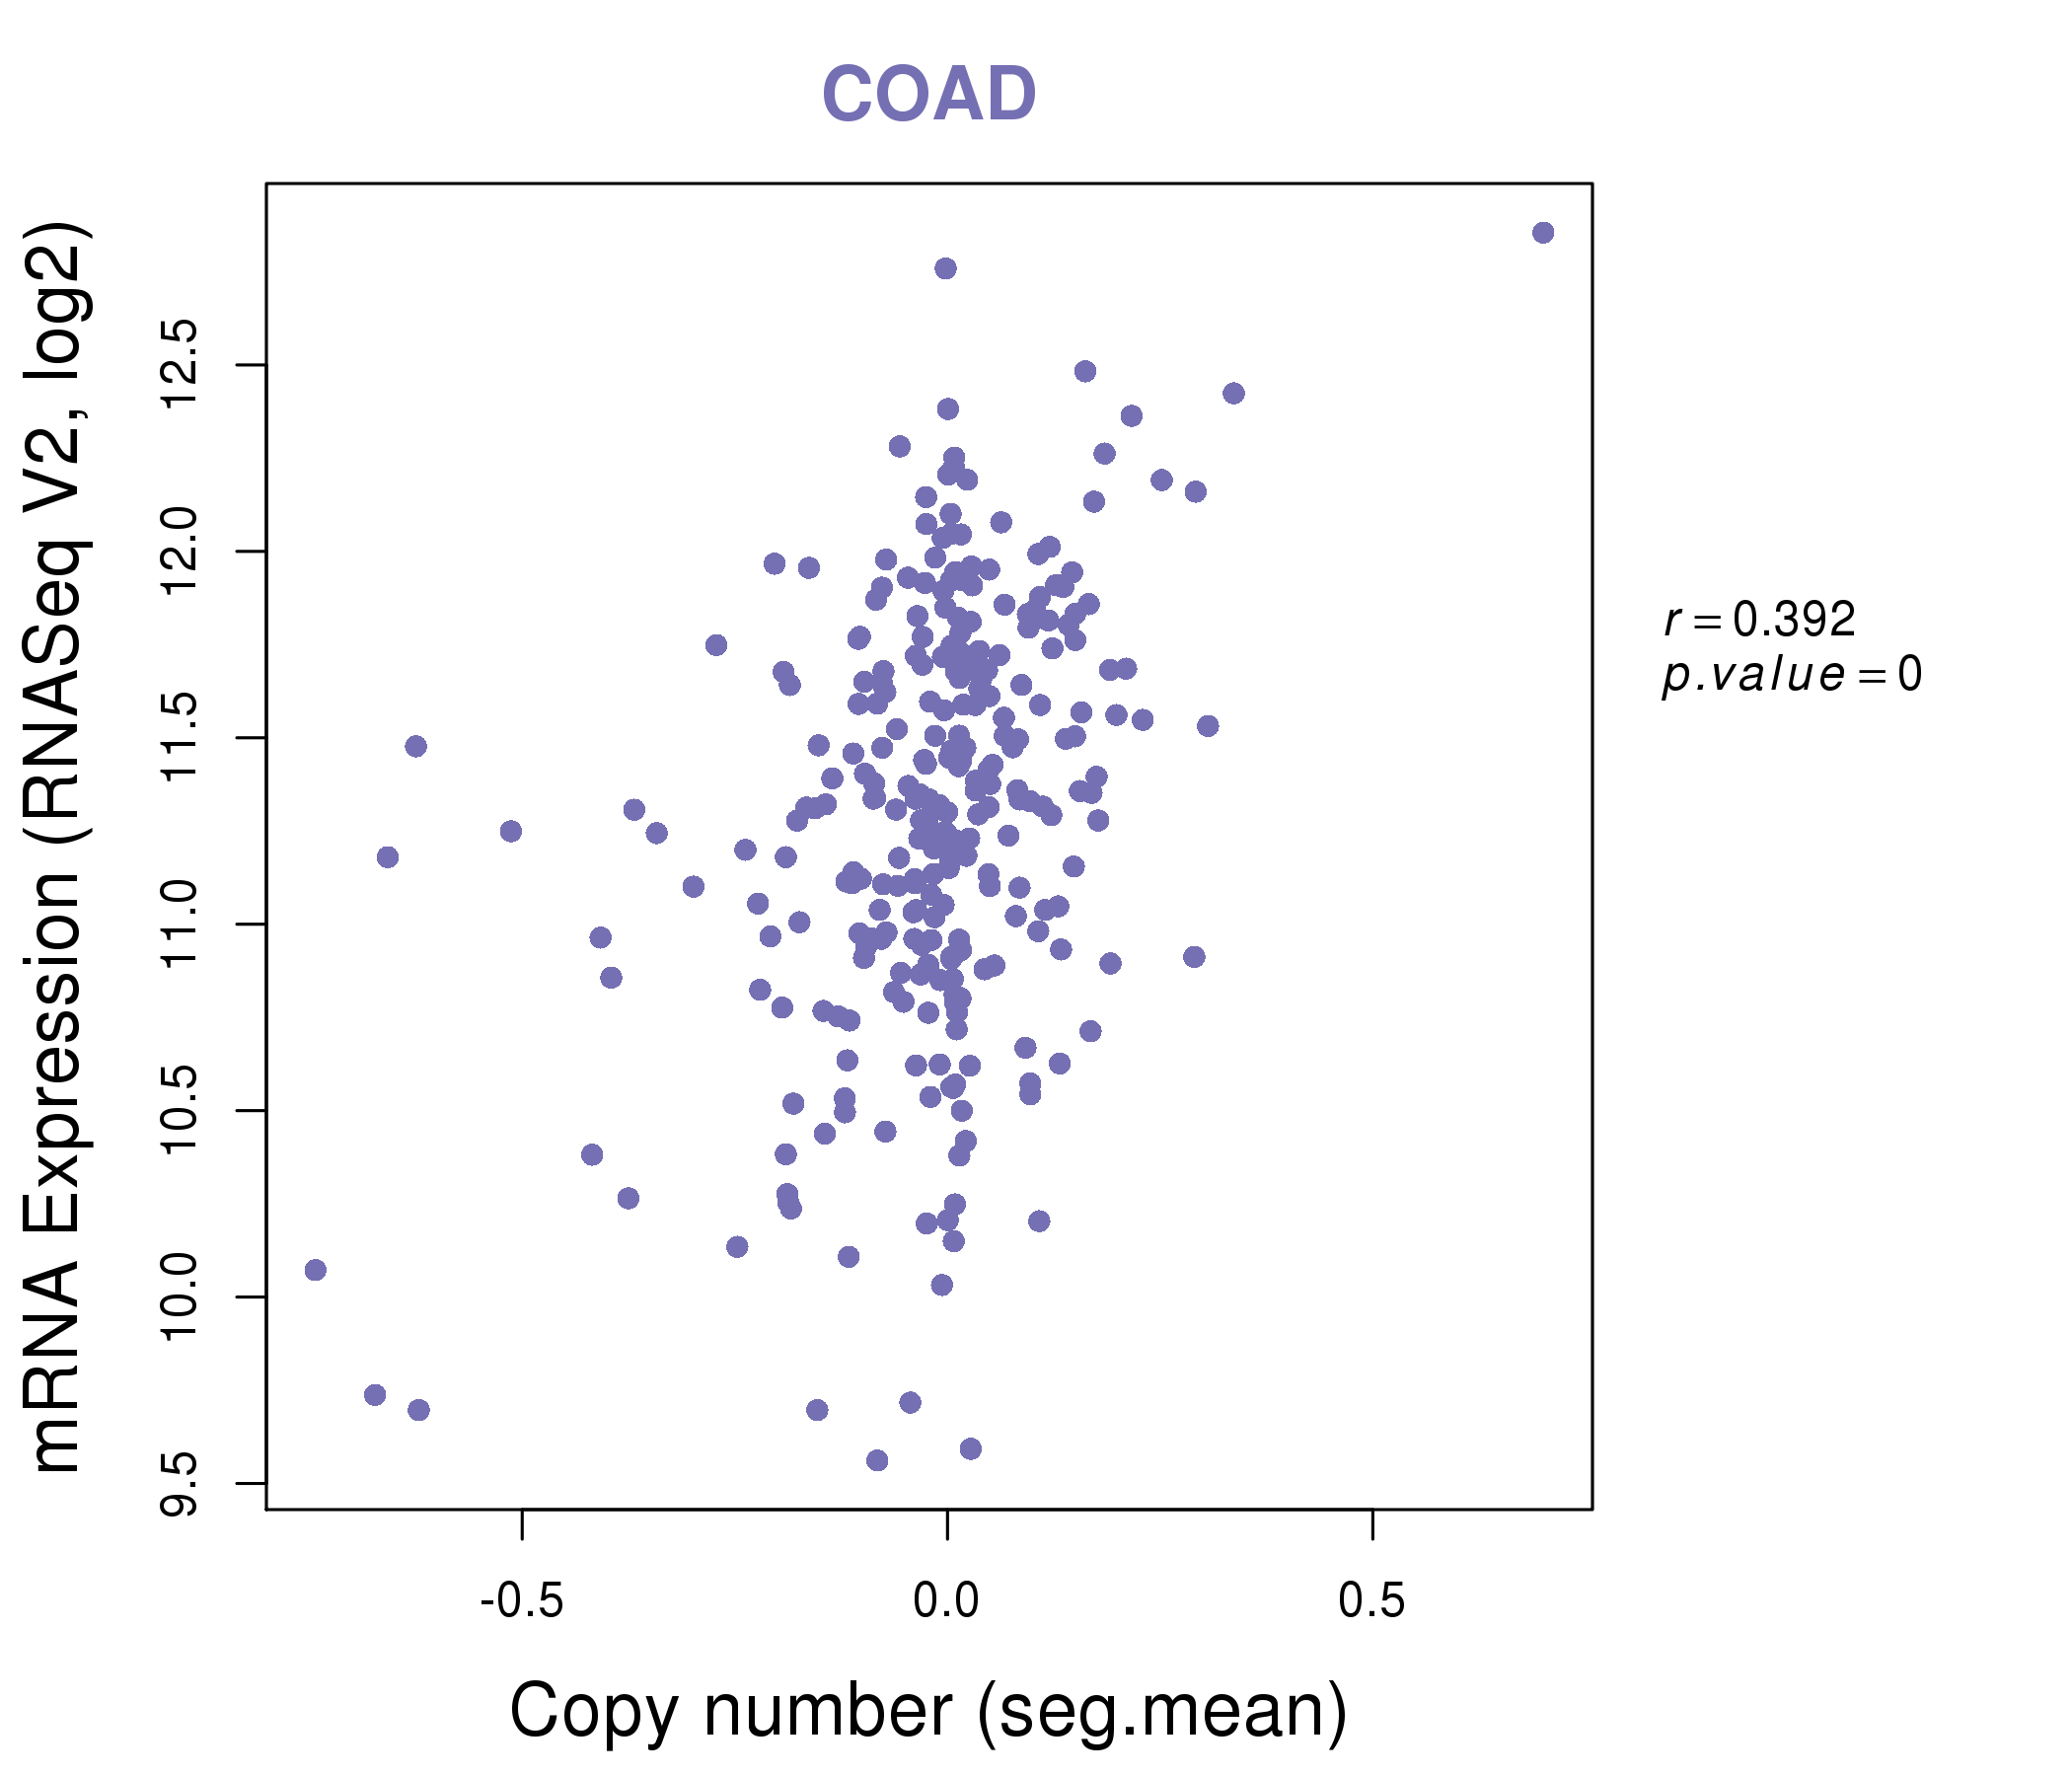
| * Copy number data were extracted from TCGA using R package TCGA-Assembler. The URLs of all public data files on TCGA DCC data server were gathered on Jan-05-2015. Function ProcessCNAData in TCGA-Assembler package was used to obtain gene-level copy number value which is calculated as the average copy number of the genomic region of a gene. |
 |
| cf) Tissue ID[Tissue type]: BLCA[Bladder Urothelial Carcinoma], BRCA[Breast invasive carcinoma], CESC[Cervical squamous cell carcinoma and endocervical adenocarcinoma], COAD[Colon adenocarcinoma], GBM[Glioblastoma multiforme], Glioma Low Grade, HNSC[Head and Neck squamous cell carcinoma], KICH[Kidney Chromophobe], KIRC[Kidney renal clear cell carcinoma], KIRP[Kidney renal papillary cell carcinoma], LAML[Acute Myeloid Leukemia], LUAD[Lung adenocarcinoma], LUSC[Lung squamous cell carcinoma], OV[Ovarian serous cystadenocarcinoma ], PAAD[Pancreatic adenocarcinoma], PRAD[Prostate adenocarcinoma], SKCM[Skin Cutaneous Melanoma], STAD[Stomach adenocarcinoma], THCA[Thyroid carcinoma], UCEC[Uterine Corpus Endometrial Carcinoma] |
| Top |
| Gene Expression for CPT1A |
| * CCLE gene expression data were extracted from CCLE_Expression_Entrez_2012-10-18.res: Gene-centric RMA-normalized mRNA expression data. |
 |
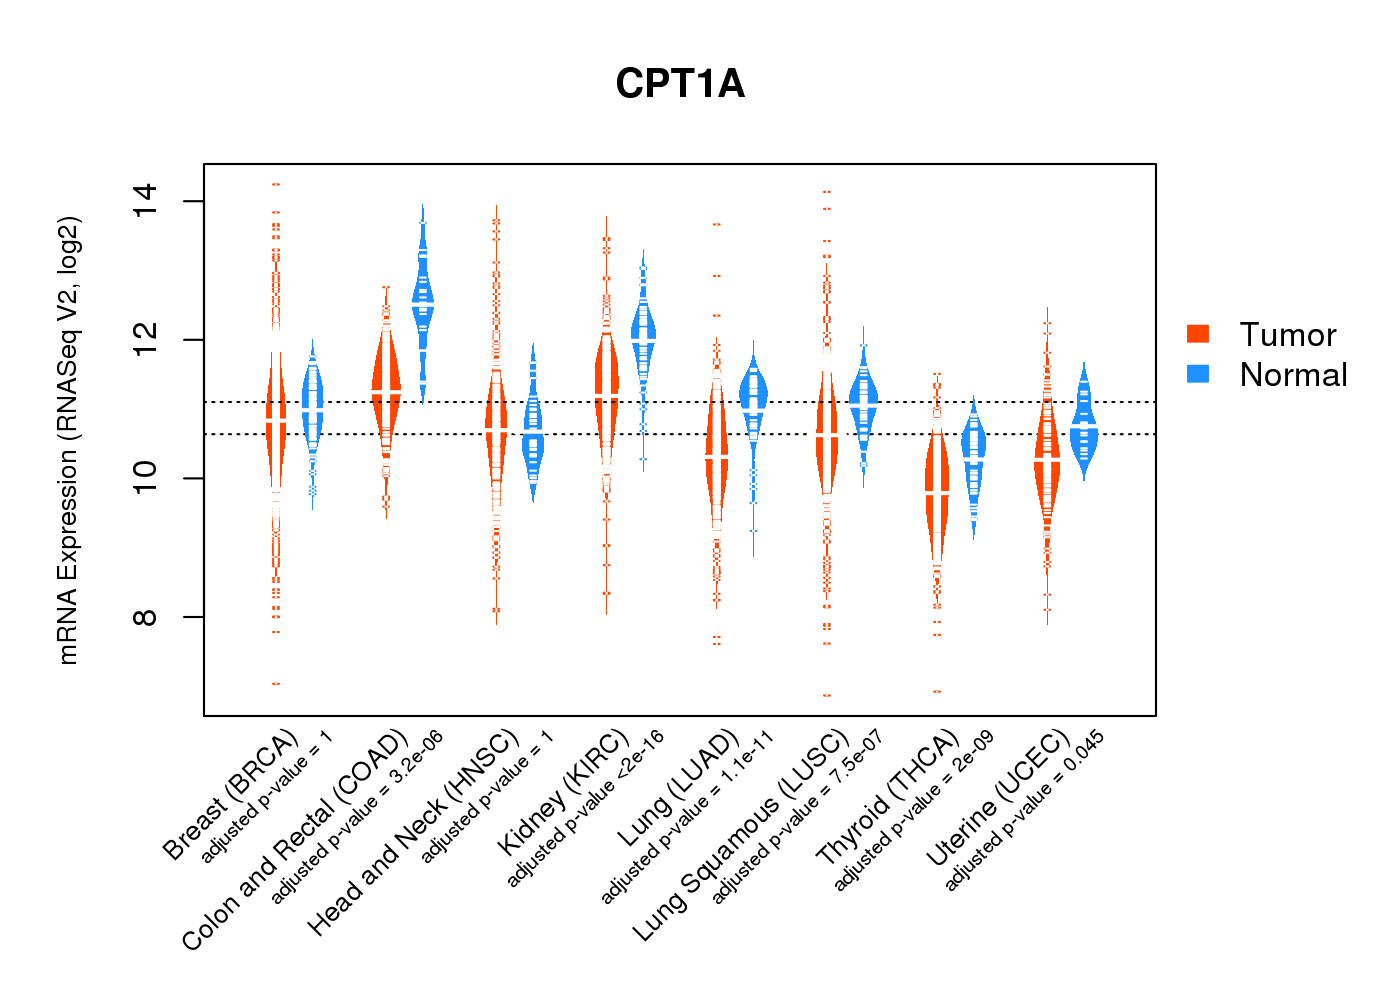
| * Normalized gene expression data of RNASeqV2 was extracted from TCGA using R package TCGA-Assembler. The URLs of all public data files on TCGA DCC data server were gathered at Jan-05-2015. Only eight cancer types have enough normal control samples for differential expression analysis. (t test, adjusted p<0.05 (using Benjamini-Hochberg FDR)) |
 |
| Top |
| * This plots show the correlation between CNV and gene expression. |
: Open all plots for all cancer types
 |
|
 |
|


| Top |
| Gene-Gene Network Information |
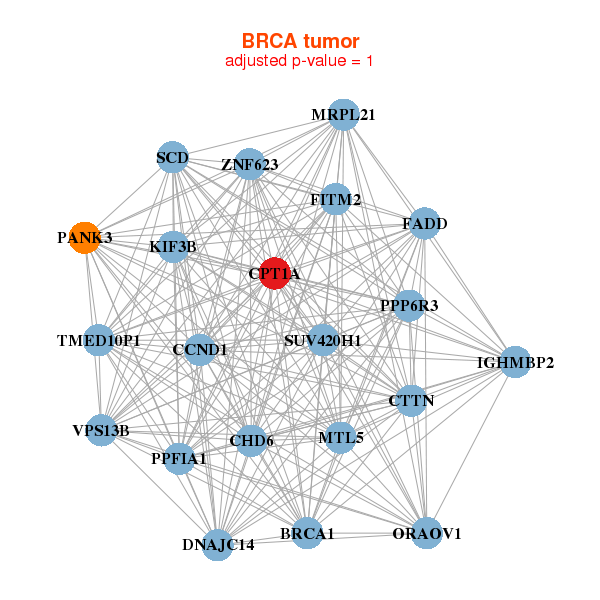
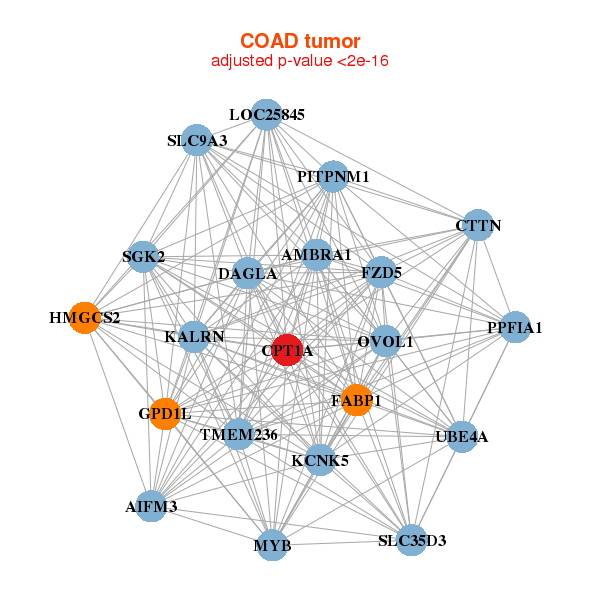
| * Co-Expression network figures were drawn using R package igraph. Only the top 20 genes with the highest correlations were shown. Red circle: input gene, orange circle: cell metabolism gene, sky circle: other gene |
: Open all plots for all cancer types
 |
| ||||
| BRCA1,CCND1,CHD6,CPT1A,CTTN,DNAJC14,FADD, FITM2,IGHMBP2,KIF3B,MRPL21,MTL5,ORAOV1,PANK3, PPFIA1,PPP6R3,SCD,SUV420H1,TMED10P1,VPS13B,ZNF623 | ABL2,ADD2,ANGPT2,ARHGAP23,ATP8B2,BMX,CMIP, CPT1A,DOC2B,ELF4,KCNT2,LHX6,NOD1,PLSCR1, RPGR,SEPT8,SWAP70,TLL1,TMOD2,TRPM6,ZNF385D | ||||
 |
| ||||
| AIFM3,AMBRA1,CPT1A,CTTN,DAGLA,FABP1,TMEM236, FZD5,GPD1L,HMGCS2,KALRN,KCNK5,LOC25845,MYB, OVOL1,PITPNM1,PPFIA1,SGK2,SLC35D3,SLC9A3,UBE4A | ABCC3,ACOX1,AGFG2,CD2AP,CDH1,CPT1A,CUL3, EPB41L4B,FLNB,FZD5,HNF4A,PDCD6IP,PDE8A,RAPGEFL1, RBM47,SGK2,SLC41A2,STK38,TMEM63B,TNK1,TRAPPC10 |
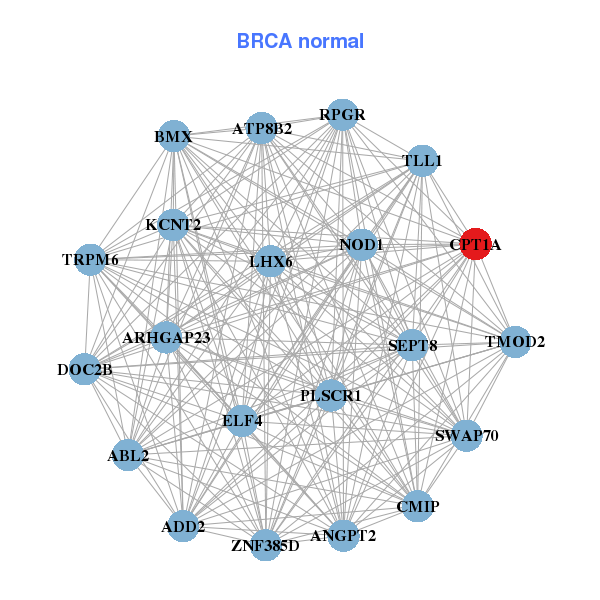
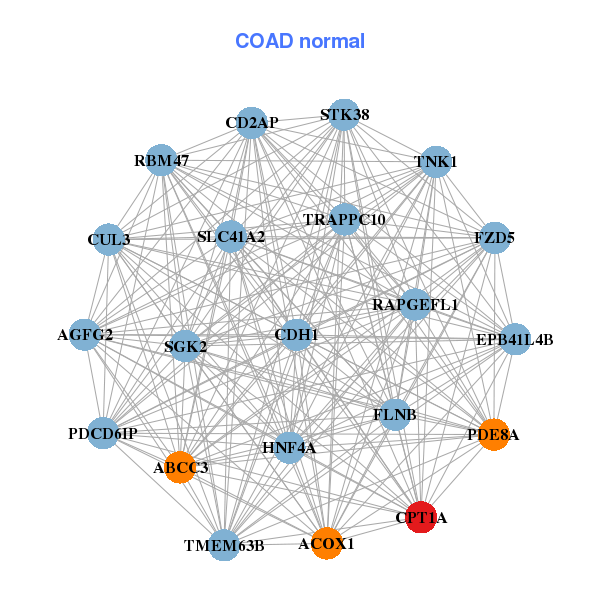
| * Co-Expression network figures were drawn using R package igraph. Only the top 20 genes with the highest correlations were shown. Red circle: input gene, orange circle: cell metabolism gene, sky circle: other gene |
: Open all plots for all cancer types
| Top |
: Open all interacting genes' information including KEGG pathway for all interacting genes from DAVID
| Top |
| Pharmacological Information for CPT1A |
| DB Category | DB Name | DB's ID and Url link |
| * Gene Centered Interaction Network. |
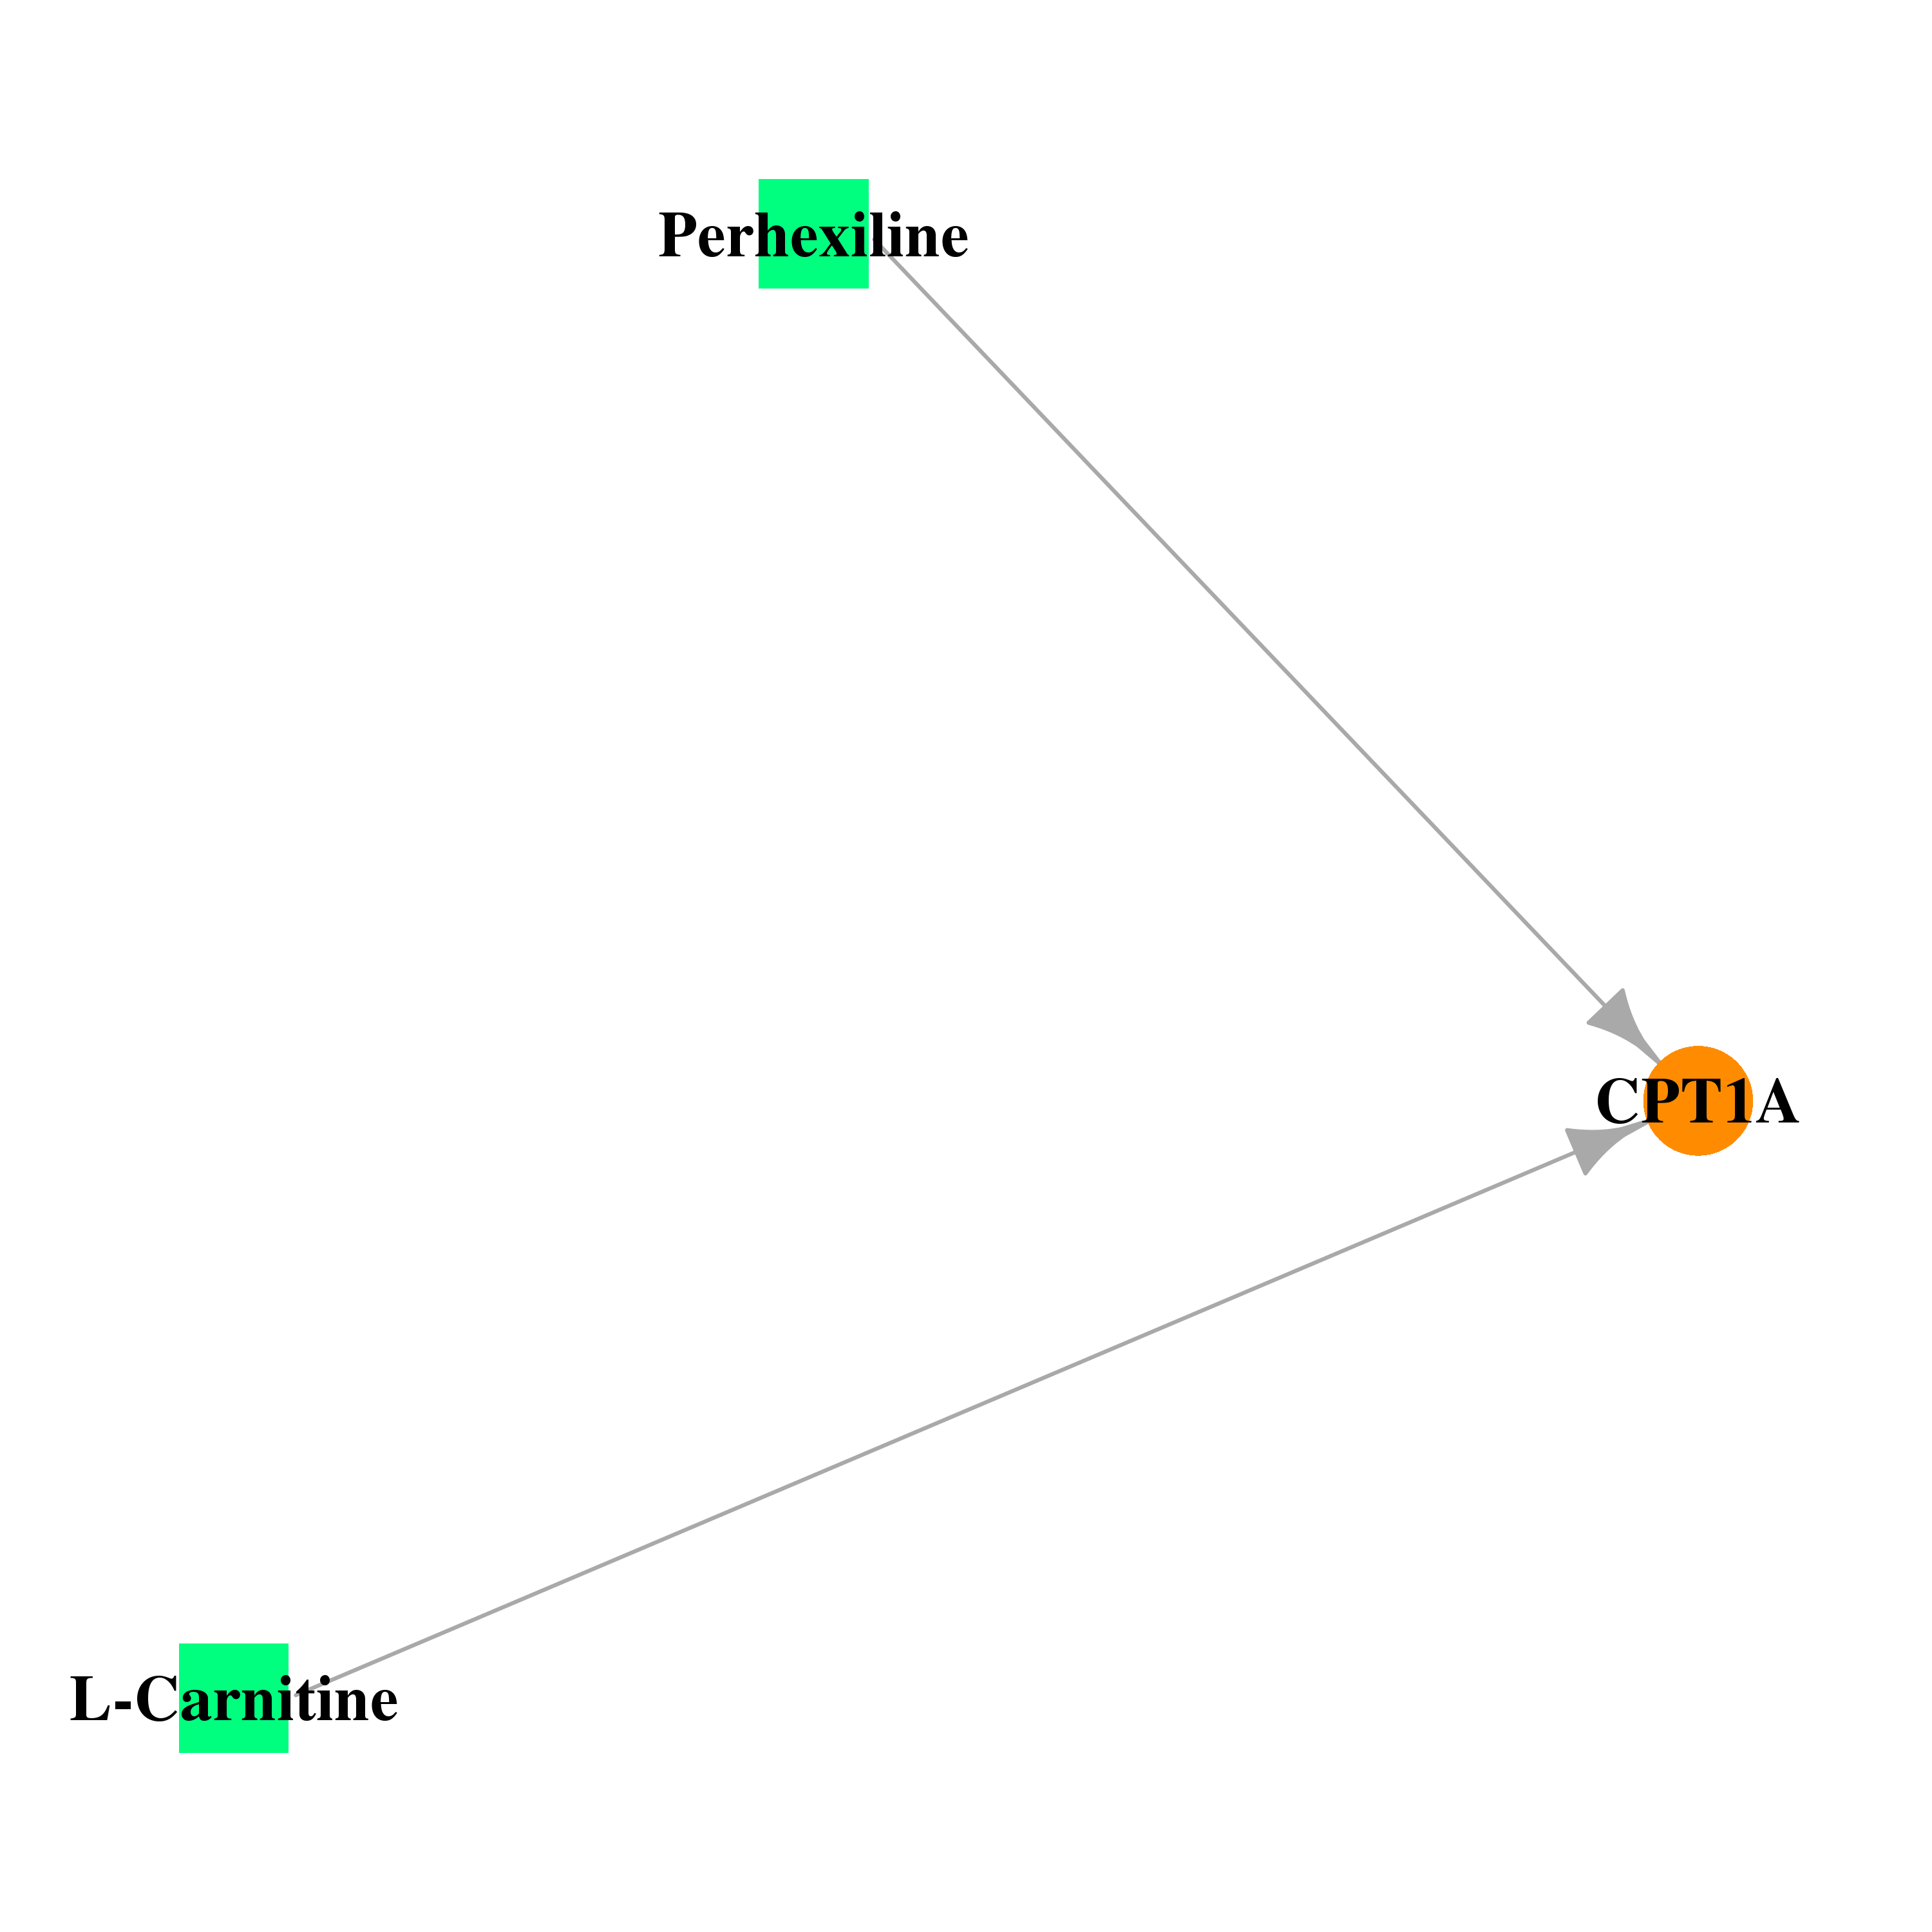 |
| * Drug Centered Interaction Network. |
| DrugBank ID | Target Name | Drug Groups | Generic Name | Drug Centered Network | Drug Structure |
| DB00583 | carnitine palmitoyltransferase 1A (liver) | approved | L-Carnitine | 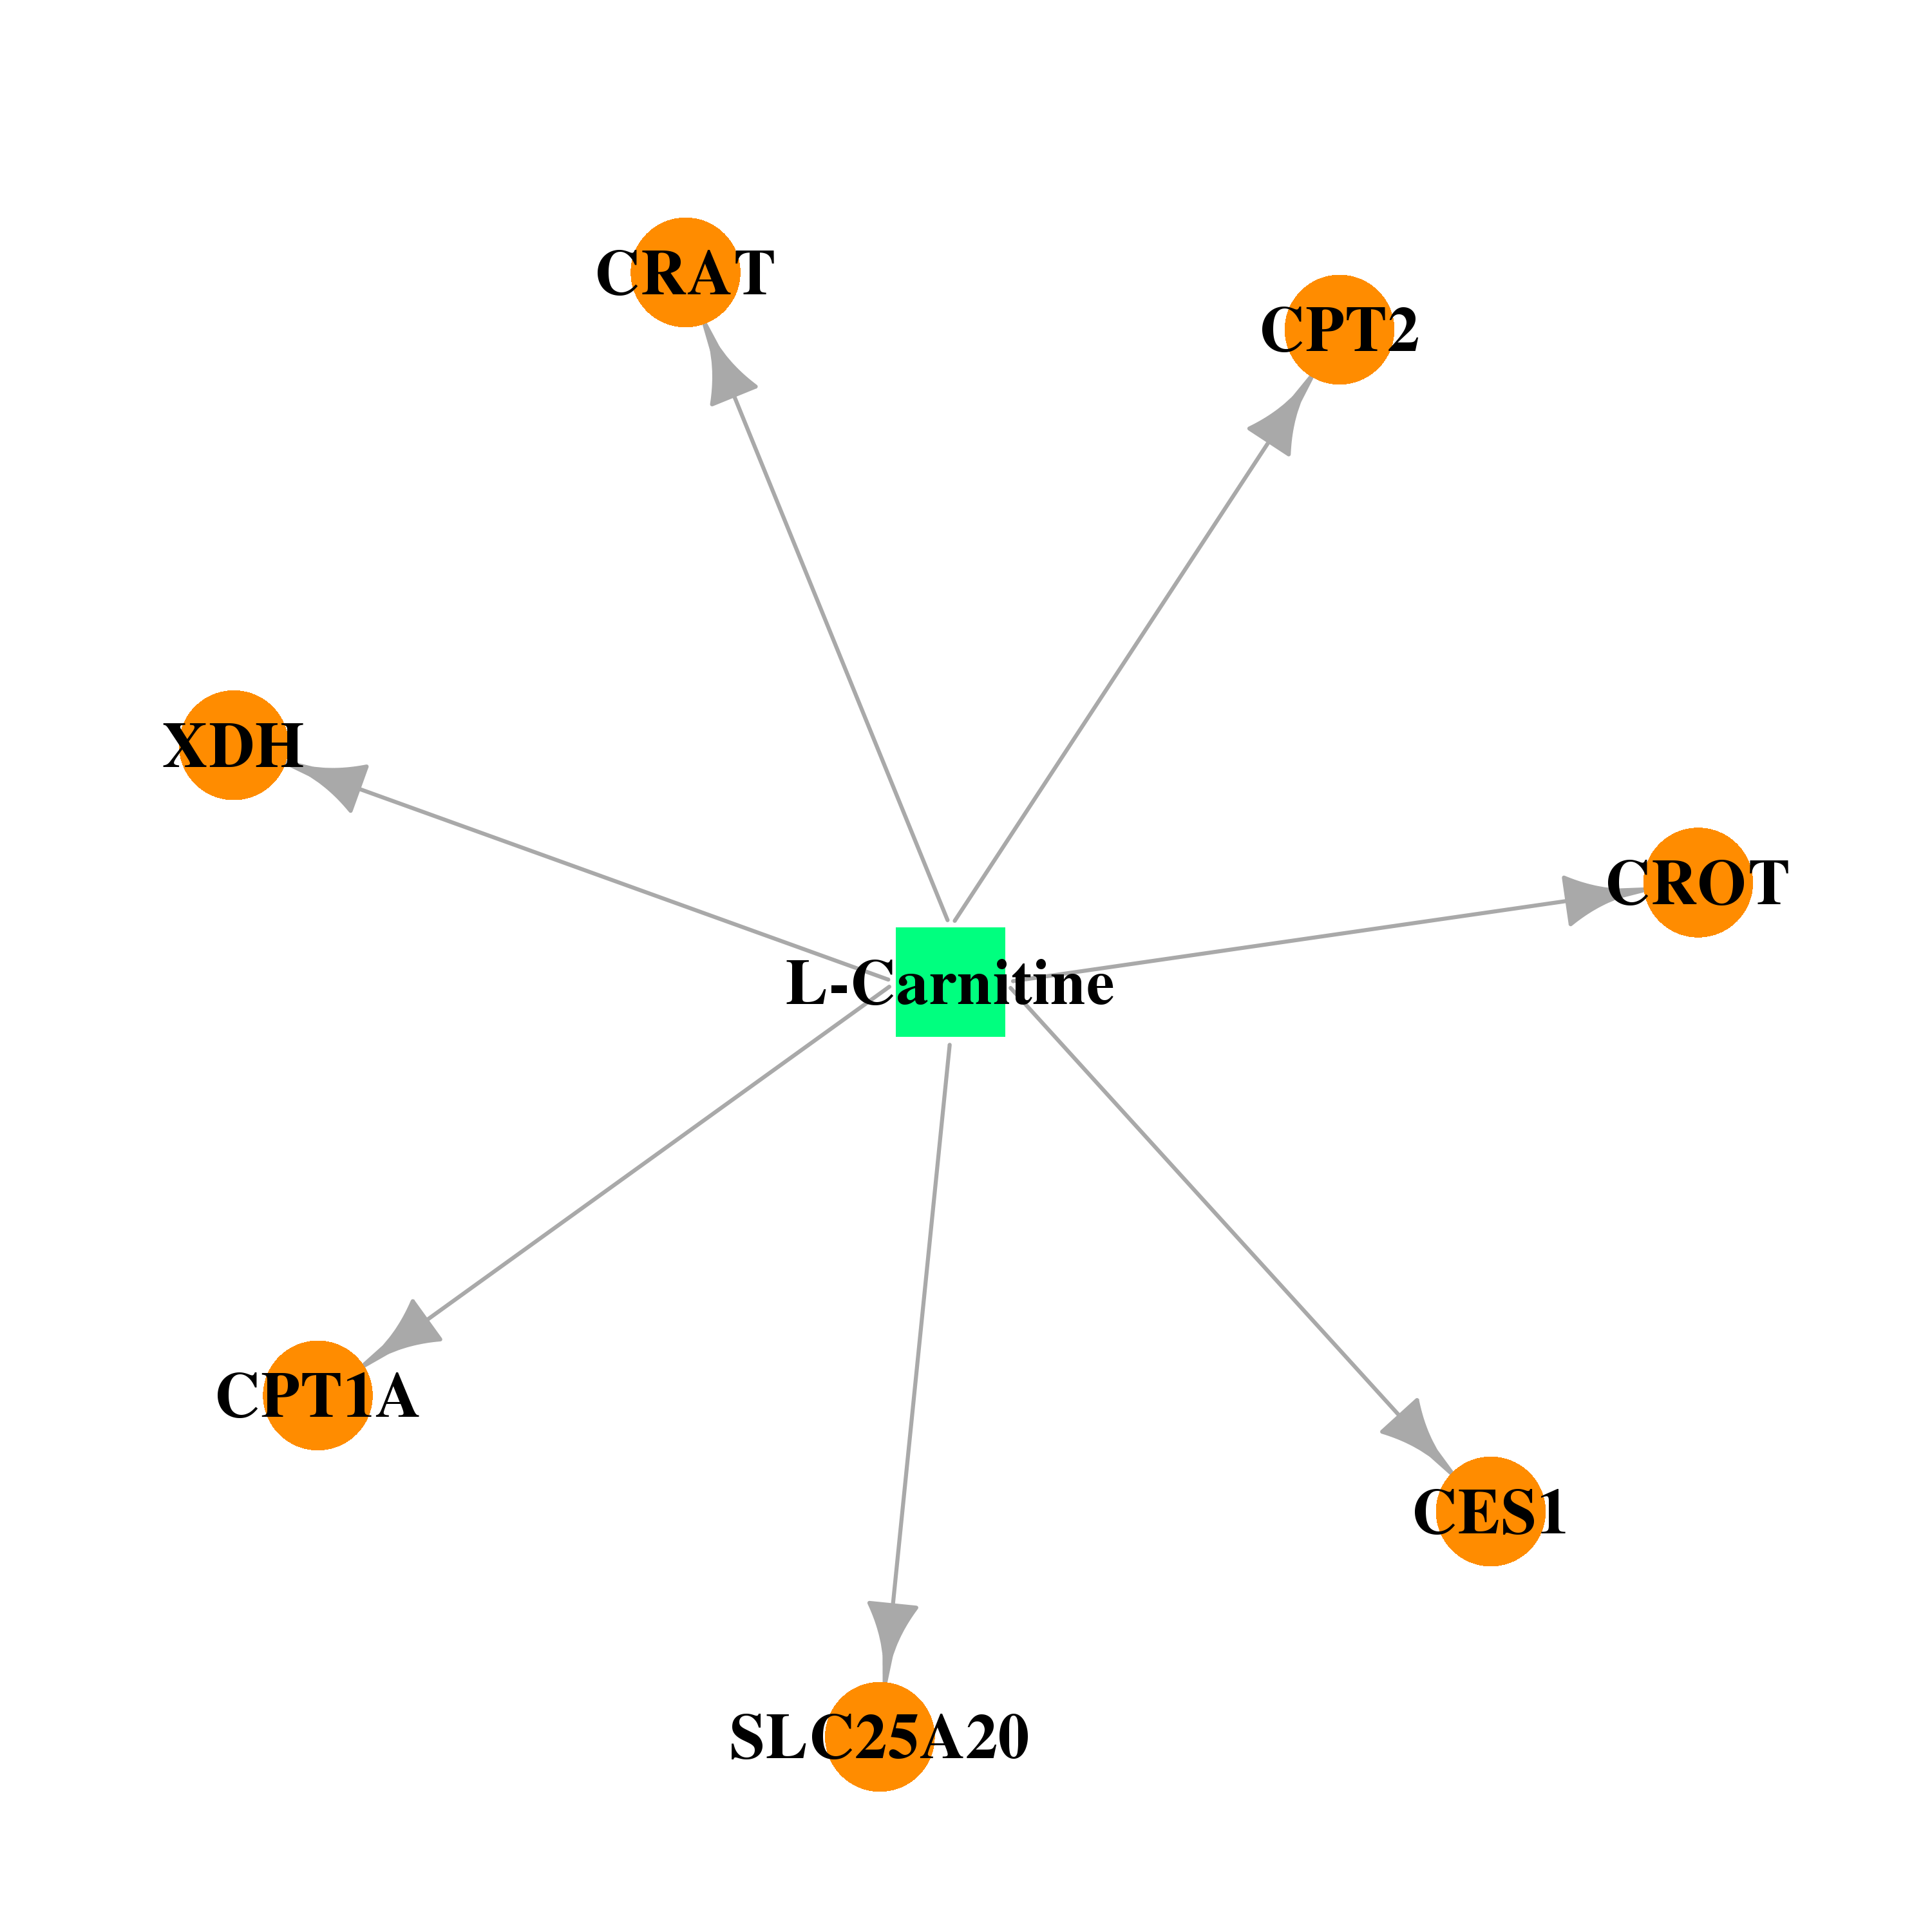 | 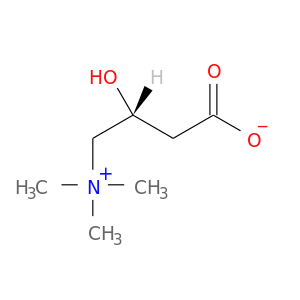 |
| DB01074 | carnitine palmitoyltransferase 1A (liver) | approved | Perhexiline | 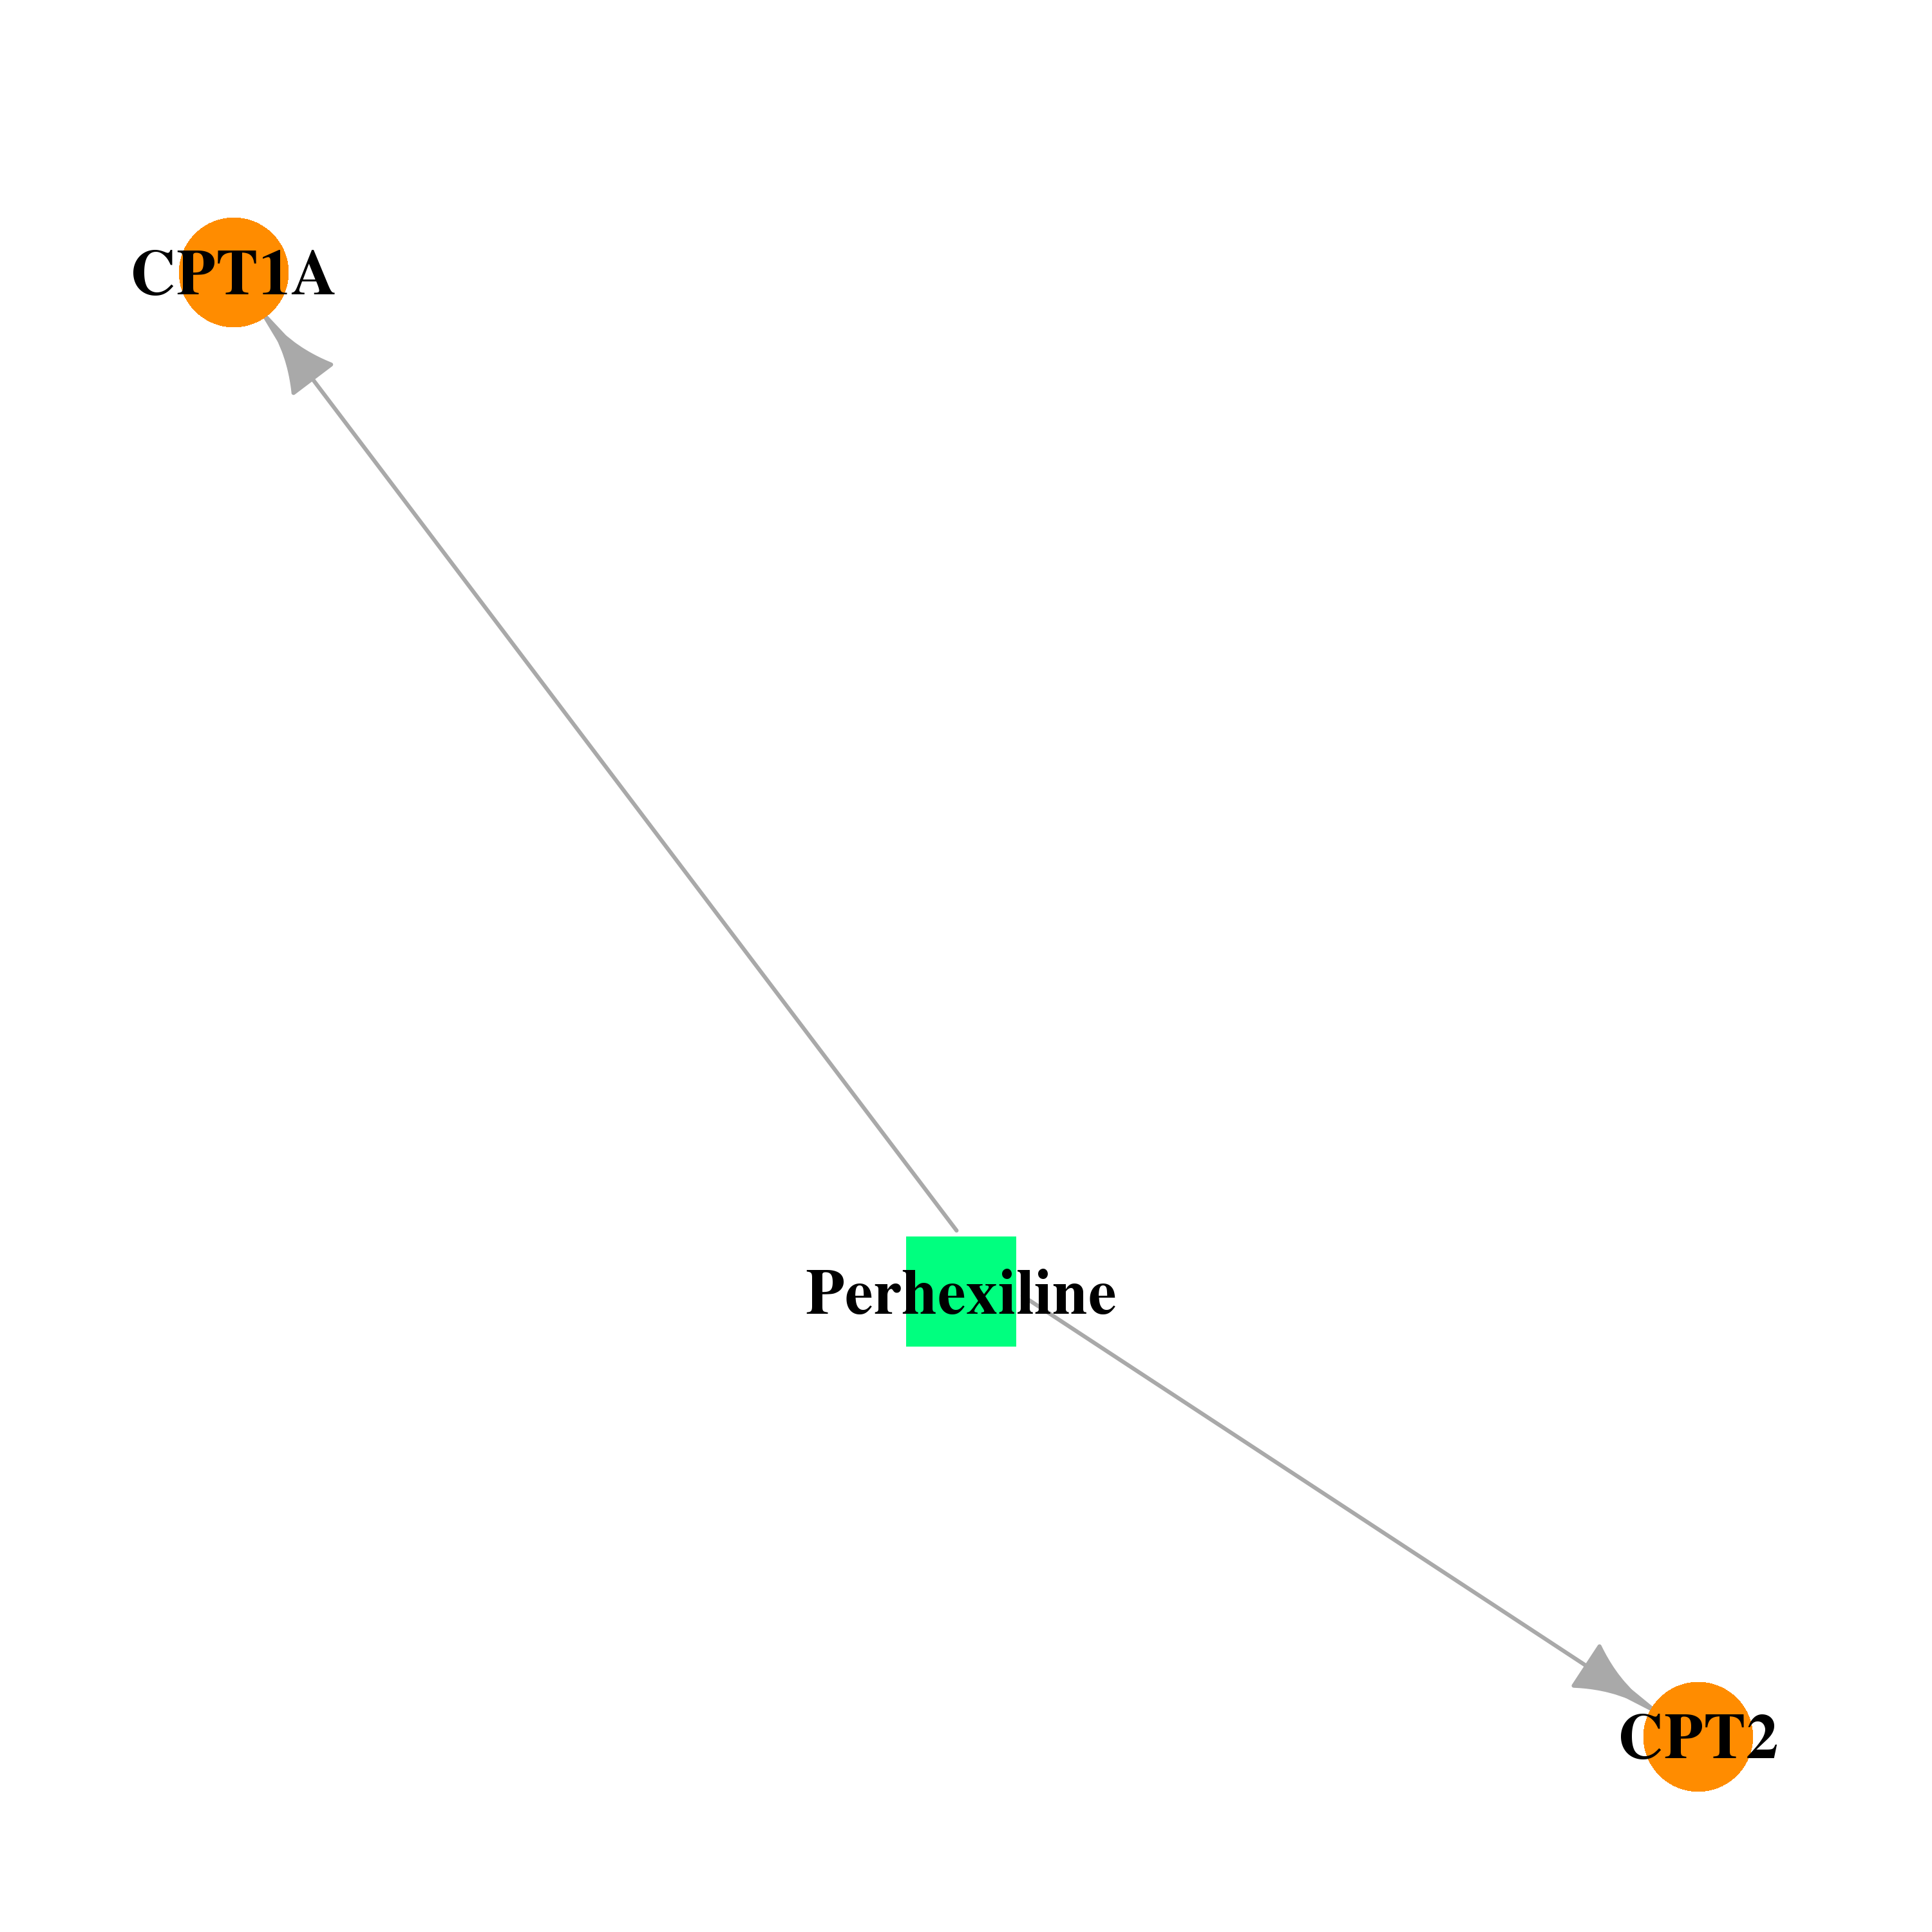 | 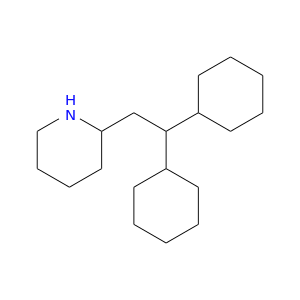 |
| Top |
| Cross referenced IDs for CPT1A |
| * We obtained these cross-references from Uniprot database. It covers 150 different DBs, 18 categories. http://www.uniprot.org/help/cross_references_section |
: Open all cross reference information
|
Copyright © 2016-Present - The Univsersity of Texas Health Science Center at Houston @ |