|
||||||||||||||||||||
| |
| Phenotypic Information (metabolism pathway, cancer, disease, phenome) |
| |
| |
| Gene-Gene Network Information: Co-Expression Network, Interacting Genes & KEGG |
| |
|


| Gene Summary for CPT2 |
| Top |
| Phenotypic Information for CPT2(metabolism pathway, cancer, disease, phenome) |
| Cancer | CGAP: CPT2 |
| Familial Cancer Database: CPT2 | |
| * This gene is included in those cancer gene databases. |
|
|
|
|
|
|
| ||||||||||||||
Oncogene 1 | Significant driver gene in | |||||||||||||||||||
| cf) number; DB name 1 Oncogene; http://nar.oxfordjournals.org/content/35/suppl_1/D721.long, 2 Tumor Suppressor gene; https://bioinfo.uth.edu/TSGene/, 3 Cancer Gene Census; http://www.nature.com/nrc/journal/v4/n3/abs/nrc1299.html, 4 CancerGenes; http://nar.oxfordjournals.org/content/35/suppl_1/D721.long, 5 Network of Cancer Gene; http://ncg.kcl.ac.uk/index.php, 1Therapeutic Vulnerabilities in Cancer; http://cbio.mskcc.org/cancergenomics/statius/ |
| KEGG_FATTY_ACID_METABOLISM REACTOME_METABOLISM_OF_LIPIDS_AND_LIPOPROTEINS | |
| OMIM | |
| Orphanet | |
| Disease | KEGG Disease: CPT2 |
| MedGen: CPT2 (Human Medical Genetics with Condition) | |
| ClinVar: CPT2 | |
| Phenotype | MGI: CPT2 (International Mouse Phenotyping Consortium) |
| PhenomicDB: CPT2 | |
| Mutations for CPT2 |
| * Under tables are showing count per each tissue to give us broad intuition about tissue specific mutation patterns.You can go to the detailed page for each mutation database's web site. |
| There's no structural variation information in COSMIC data for this gene. |
| * From mRNA Sanger sequences, Chitars2.0 arranged chimeric transcripts. This table shows CPT2 related fusion information. |
| ID | Head Gene | Tail Gene | Accession | Gene_a | qStart_a | qEnd_a | Chromosome_a | tStart_a | tEnd_a | Gene_a | qStart_a | qEnd_a | Chromosome_a | tStart_a | tEnd_a |
| AA531596 | CPT2 | 36 | 86 | 1 | 53679197 | 53679247 | CPT2 | 68 | 388 | 1 | 53679197 | 53679869 | |
| Top |
| There's no copy number variation information in COSMIC data for this gene. |
| Top |
|
 |
| Top |
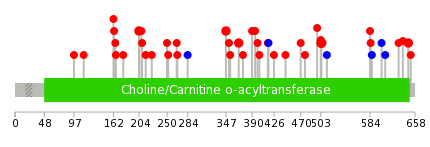
| Stat. for Non-Synonymous SNVs (# total SNVs=38) | (# total SNVs=4) |
 |  |
(# total SNVs=0) | (# total SNVs=0) |
| Top |
| * When you move the cursor on each content, you can see more deailed mutation information on the Tooltip. Those are primary_site,primary_histology,mutation(aa),pubmedID. |
| GRCh37 position | Mutation(aa) | Unique sampleID count |
| chr1:53676857-53676857 | p.P504L | 3 |
| chr1:53676386-53676386 | p.G347D | 2 |
| chr1:53675956-53675956 | p.A204T | 2 |
| chr1:53676448-53676448 | p.V368I | 2 |
| chr1:53679229-53679229 | p.M647V | 2 |
| chr1:53676198-53676198 | p.P284P | 1 |
| chr1:53676597-53676597 | p.F417F | 1 |
| chr1:53679044-53679044 | p.N585S | 1 |
| chr1:53675880-53675880 | p.L178F | 1 |
| chr1:53676623-53676623 | p.G426V | 1 |
| Top |
|
 |
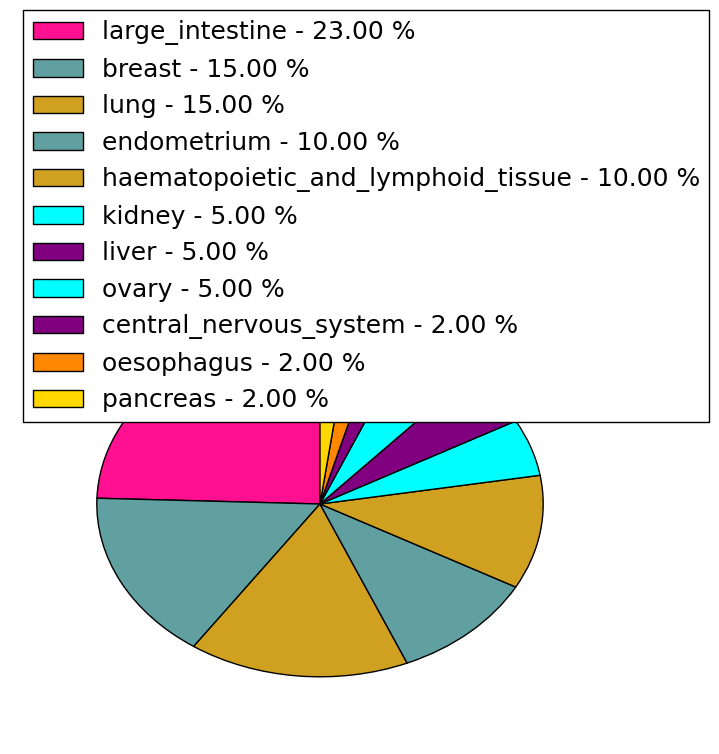
| Point Mutation/ Tissue ID | 1 | 2 | 3 | 4 | 5 | 6 | 7 | 8 | 9 | 10 | 11 | 12 | 13 | 14 | 15 | 16 | 17 | 18 | 19 | 20 |
| # sample | 5 | 5 | 1 | 1 | 1 | 4 | 2 | 2 | 2 | 4 | 7 | |||||||||
| # mutation | 5 | 4 | 1 | 1 | 1 | 4 | 2 | 2 | 2 | 5 | 7 | |||||||||
| nonsynonymous SNV | 5 | 3 | 1 | 1 | 1 | 3 | 2 | 2 | 5 | 4 | ||||||||||
| synonymous SNV | 1 | 1 | 2 | 3 |
| cf) Tissue ID; Tissue type (1; BLCA[Bladder Urothelial Carcinoma], 2; BRCA[Breast invasive carcinoma], 3; CESC[Cervical squamous cell carcinoma and endocervical adenocarcinoma], 4; COAD[Colon adenocarcinoma], 5; GBM[Glioblastoma multiforme], 6; Glioma Low Grade, 7; HNSC[Head and Neck squamous cell carcinoma], 8; KICH[Kidney Chromophobe], 9; KIRC[Kidney renal clear cell carcinoma], 10; KIRP[Kidney renal papillary cell carcinoma], 11; LAML[Acute Myeloid Leukemia], 12; LUAD[Lung adenocarcinoma], 13; LUSC[Lung squamous cell carcinoma], 14; OV[Ovarian serous cystadenocarcinoma ], 15; PAAD[Pancreatic adenocarcinoma], 16; PRAD[Prostate adenocarcinoma], 17; SKCM[Skin Cutaneous Melanoma], 18:STAD[Stomach adenocarcinoma], 19:THCA[Thyroid carcinoma], 20:UCEC[Uterine Corpus Endometrial Carcinoma]) |
| Top |
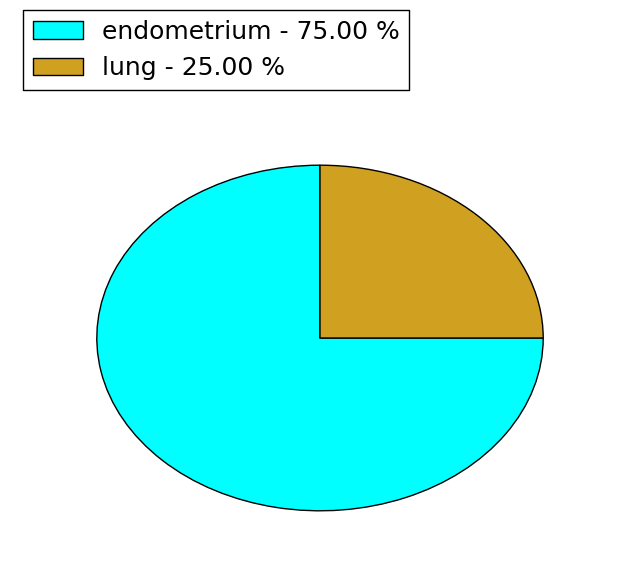
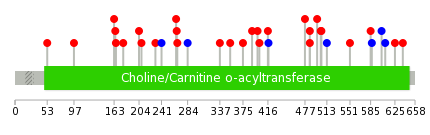
| * We represented just top 10 SNVs. When you move the cursor on each content, you can see more deailed mutation information on the Tooltip. Those are primary_site, primary_histology, mutation(aa), pubmedID. |
| Genomic Position | Mutation(aa) | Unique sampleID count |
| chr1:53676799 | p.T485P | 2 |
| chr1:53676469 | p.N208S | 1 |
| chr1:53676885 | p.R231L | 1 |
| chr1:53675956 | p.G497C | 1 |
| chr1:53676514 | p.R241R | 1 |
| chr1:53678942 | p.R503H | 1 |
| chr1:53675969 | p.S265T | 1 |
| chr1:53676541 | p.P504L | 1 |
| chr1:53679044 | p.P266T | 1 |
| chr1:53676038 | p.S513S | 1 |
| * Copy number data were extracted from TCGA using R package TCGA-Assembler. The URLs of all public data files on TCGA DCC data server were gathered on Jan-05-2015. Function ProcessCNAData in TCGA-Assembler package was used to obtain gene-level copy number value which is calculated as the average copy number of the genomic region of a gene. |
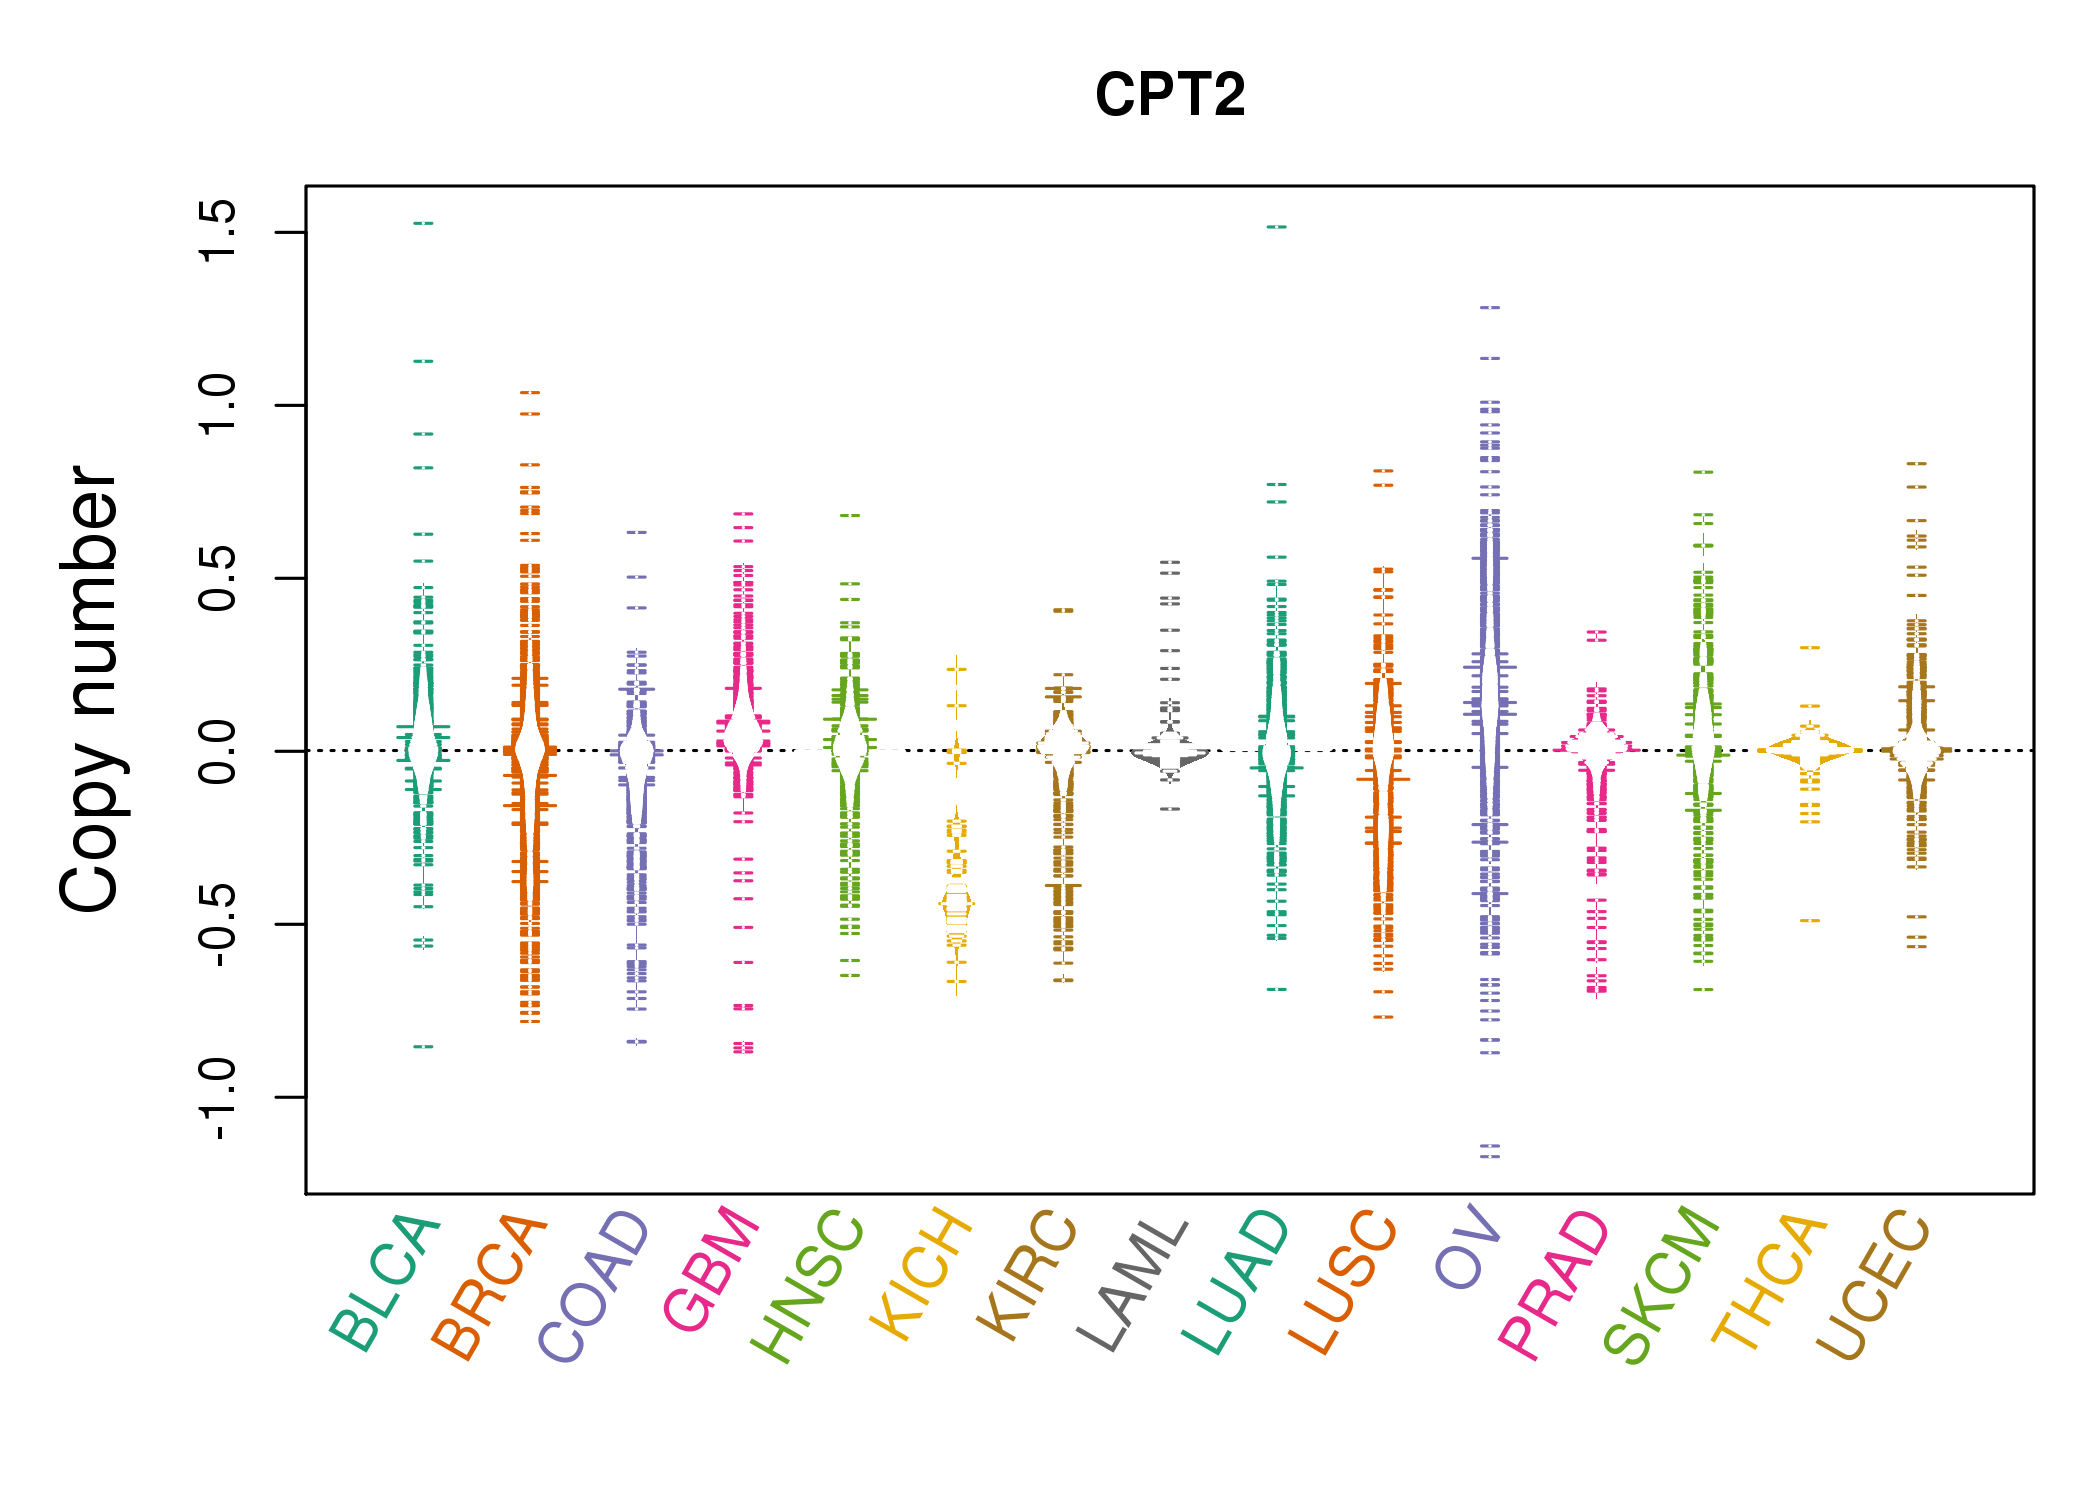 |
| cf) Tissue ID[Tissue type]: BLCA[Bladder Urothelial Carcinoma], BRCA[Breast invasive carcinoma], CESC[Cervical squamous cell carcinoma and endocervical adenocarcinoma], COAD[Colon adenocarcinoma], GBM[Glioblastoma multiforme], Glioma Low Grade, HNSC[Head and Neck squamous cell carcinoma], KICH[Kidney Chromophobe], KIRC[Kidney renal clear cell carcinoma], KIRP[Kidney renal papillary cell carcinoma], LAML[Acute Myeloid Leukemia], LUAD[Lung adenocarcinoma], LUSC[Lung squamous cell carcinoma], OV[Ovarian serous cystadenocarcinoma ], PAAD[Pancreatic adenocarcinoma], PRAD[Prostate adenocarcinoma], SKCM[Skin Cutaneous Melanoma], STAD[Stomach adenocarcinoma], THCA[Thyroid carcinoma], UCEC[Uterine Corpus Endometrial Carcinoma] |
| Top |
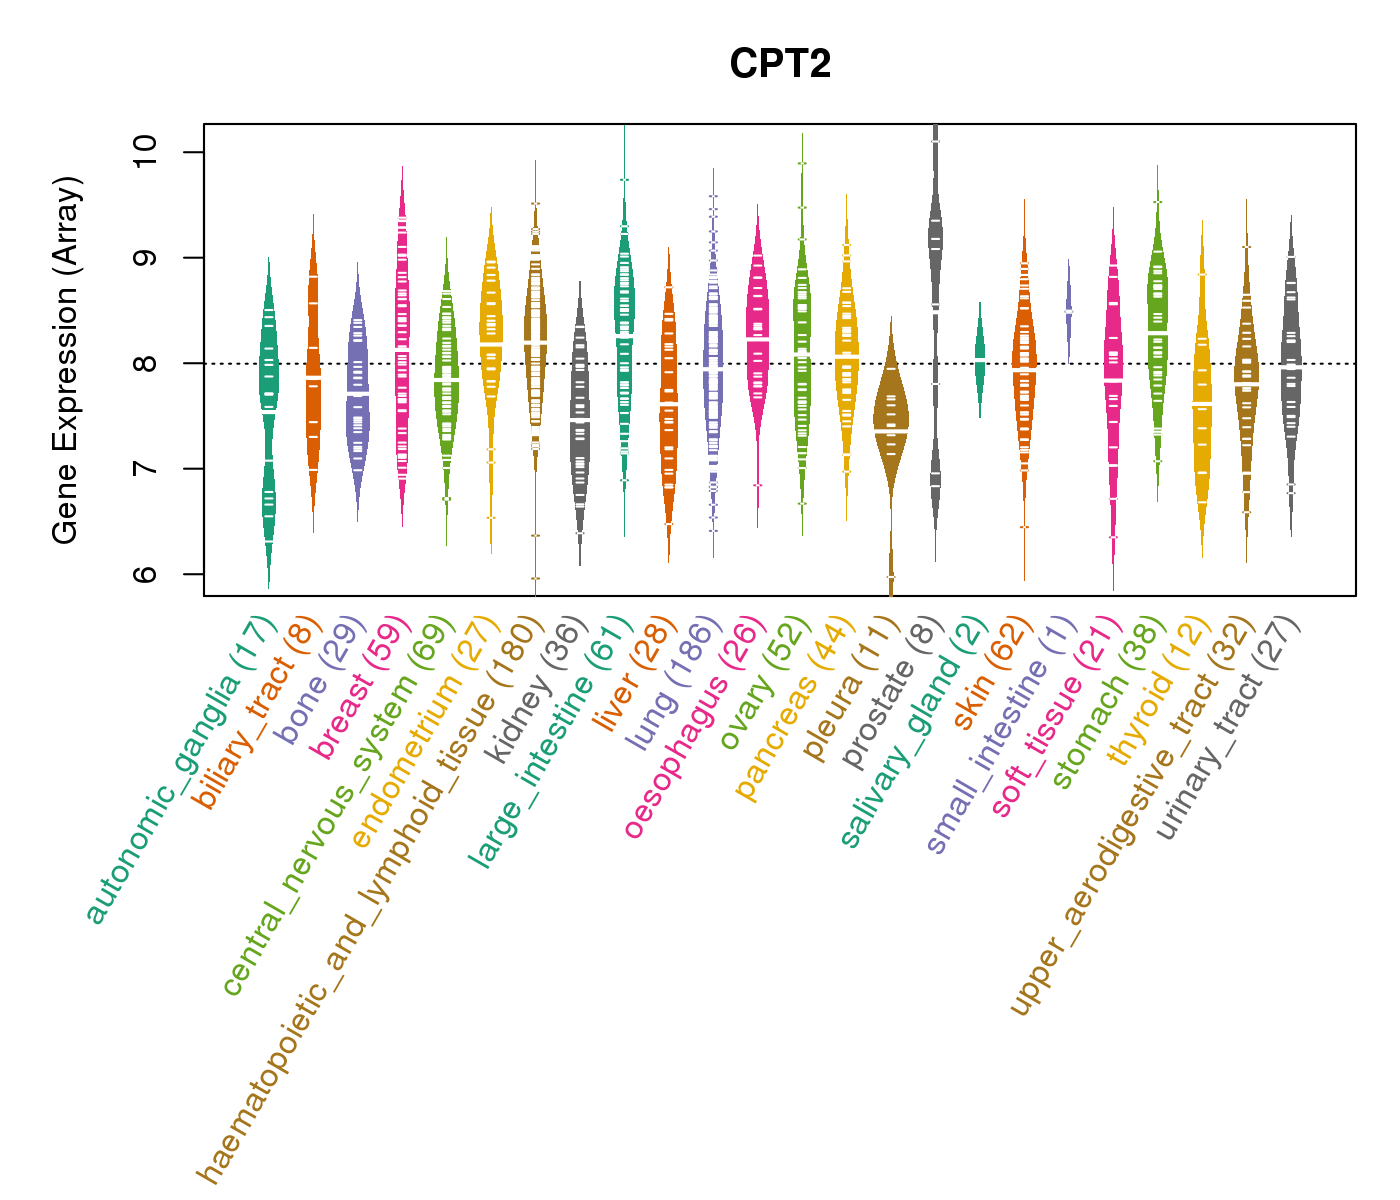
| Gene Expression for CPT2 |
| * CCLE gene expression data were extracted from CCLE_Expression_Entrez_2012-10-18.res: Gene-centric RMA-normalized mRNA expression data. |
 |
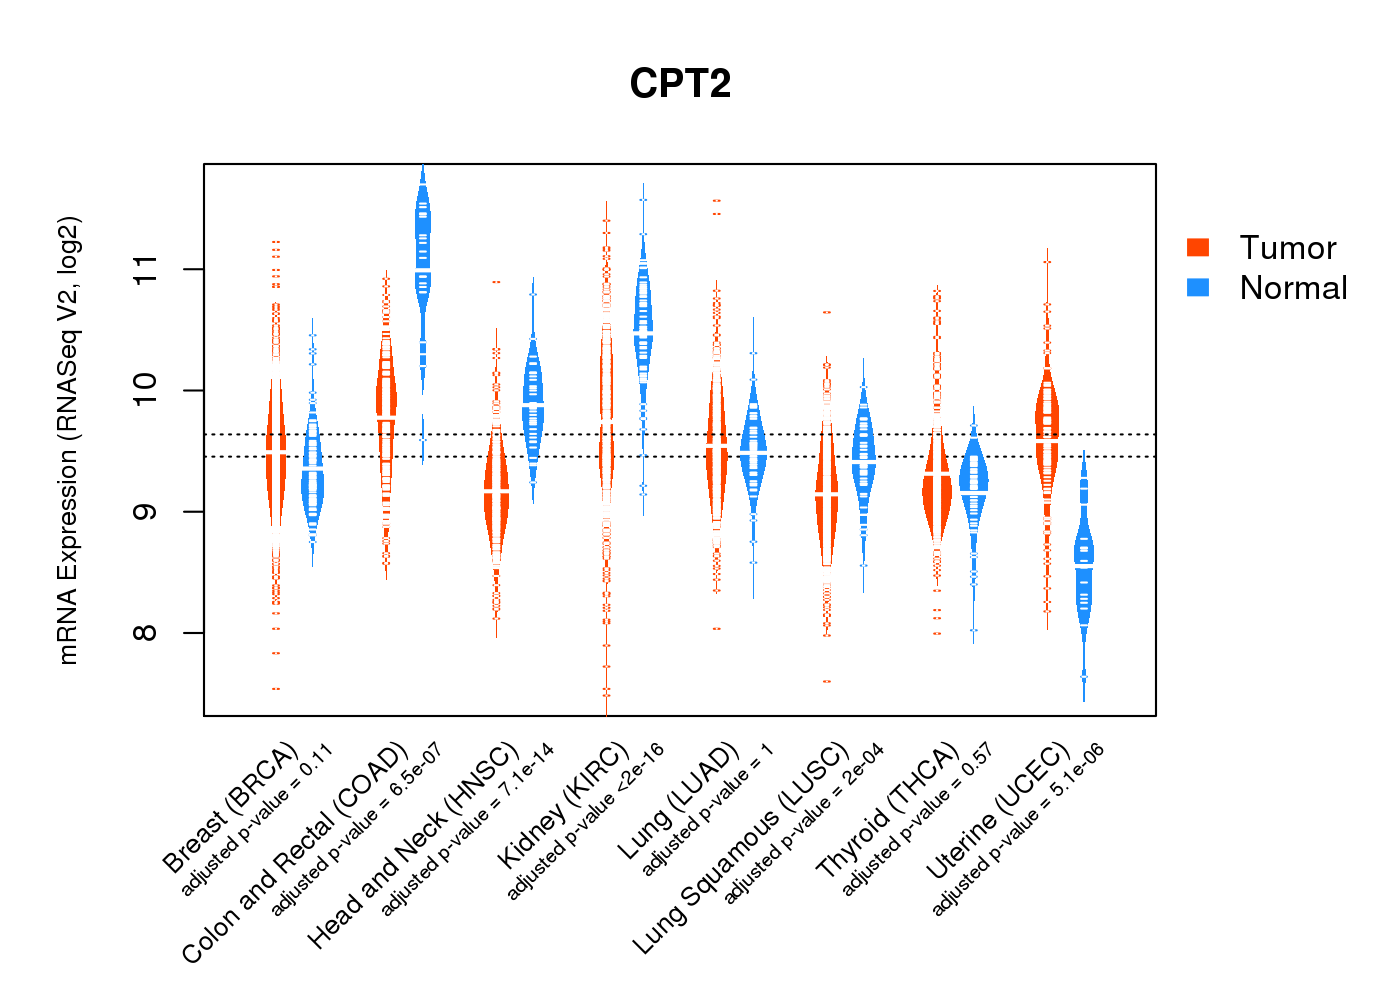
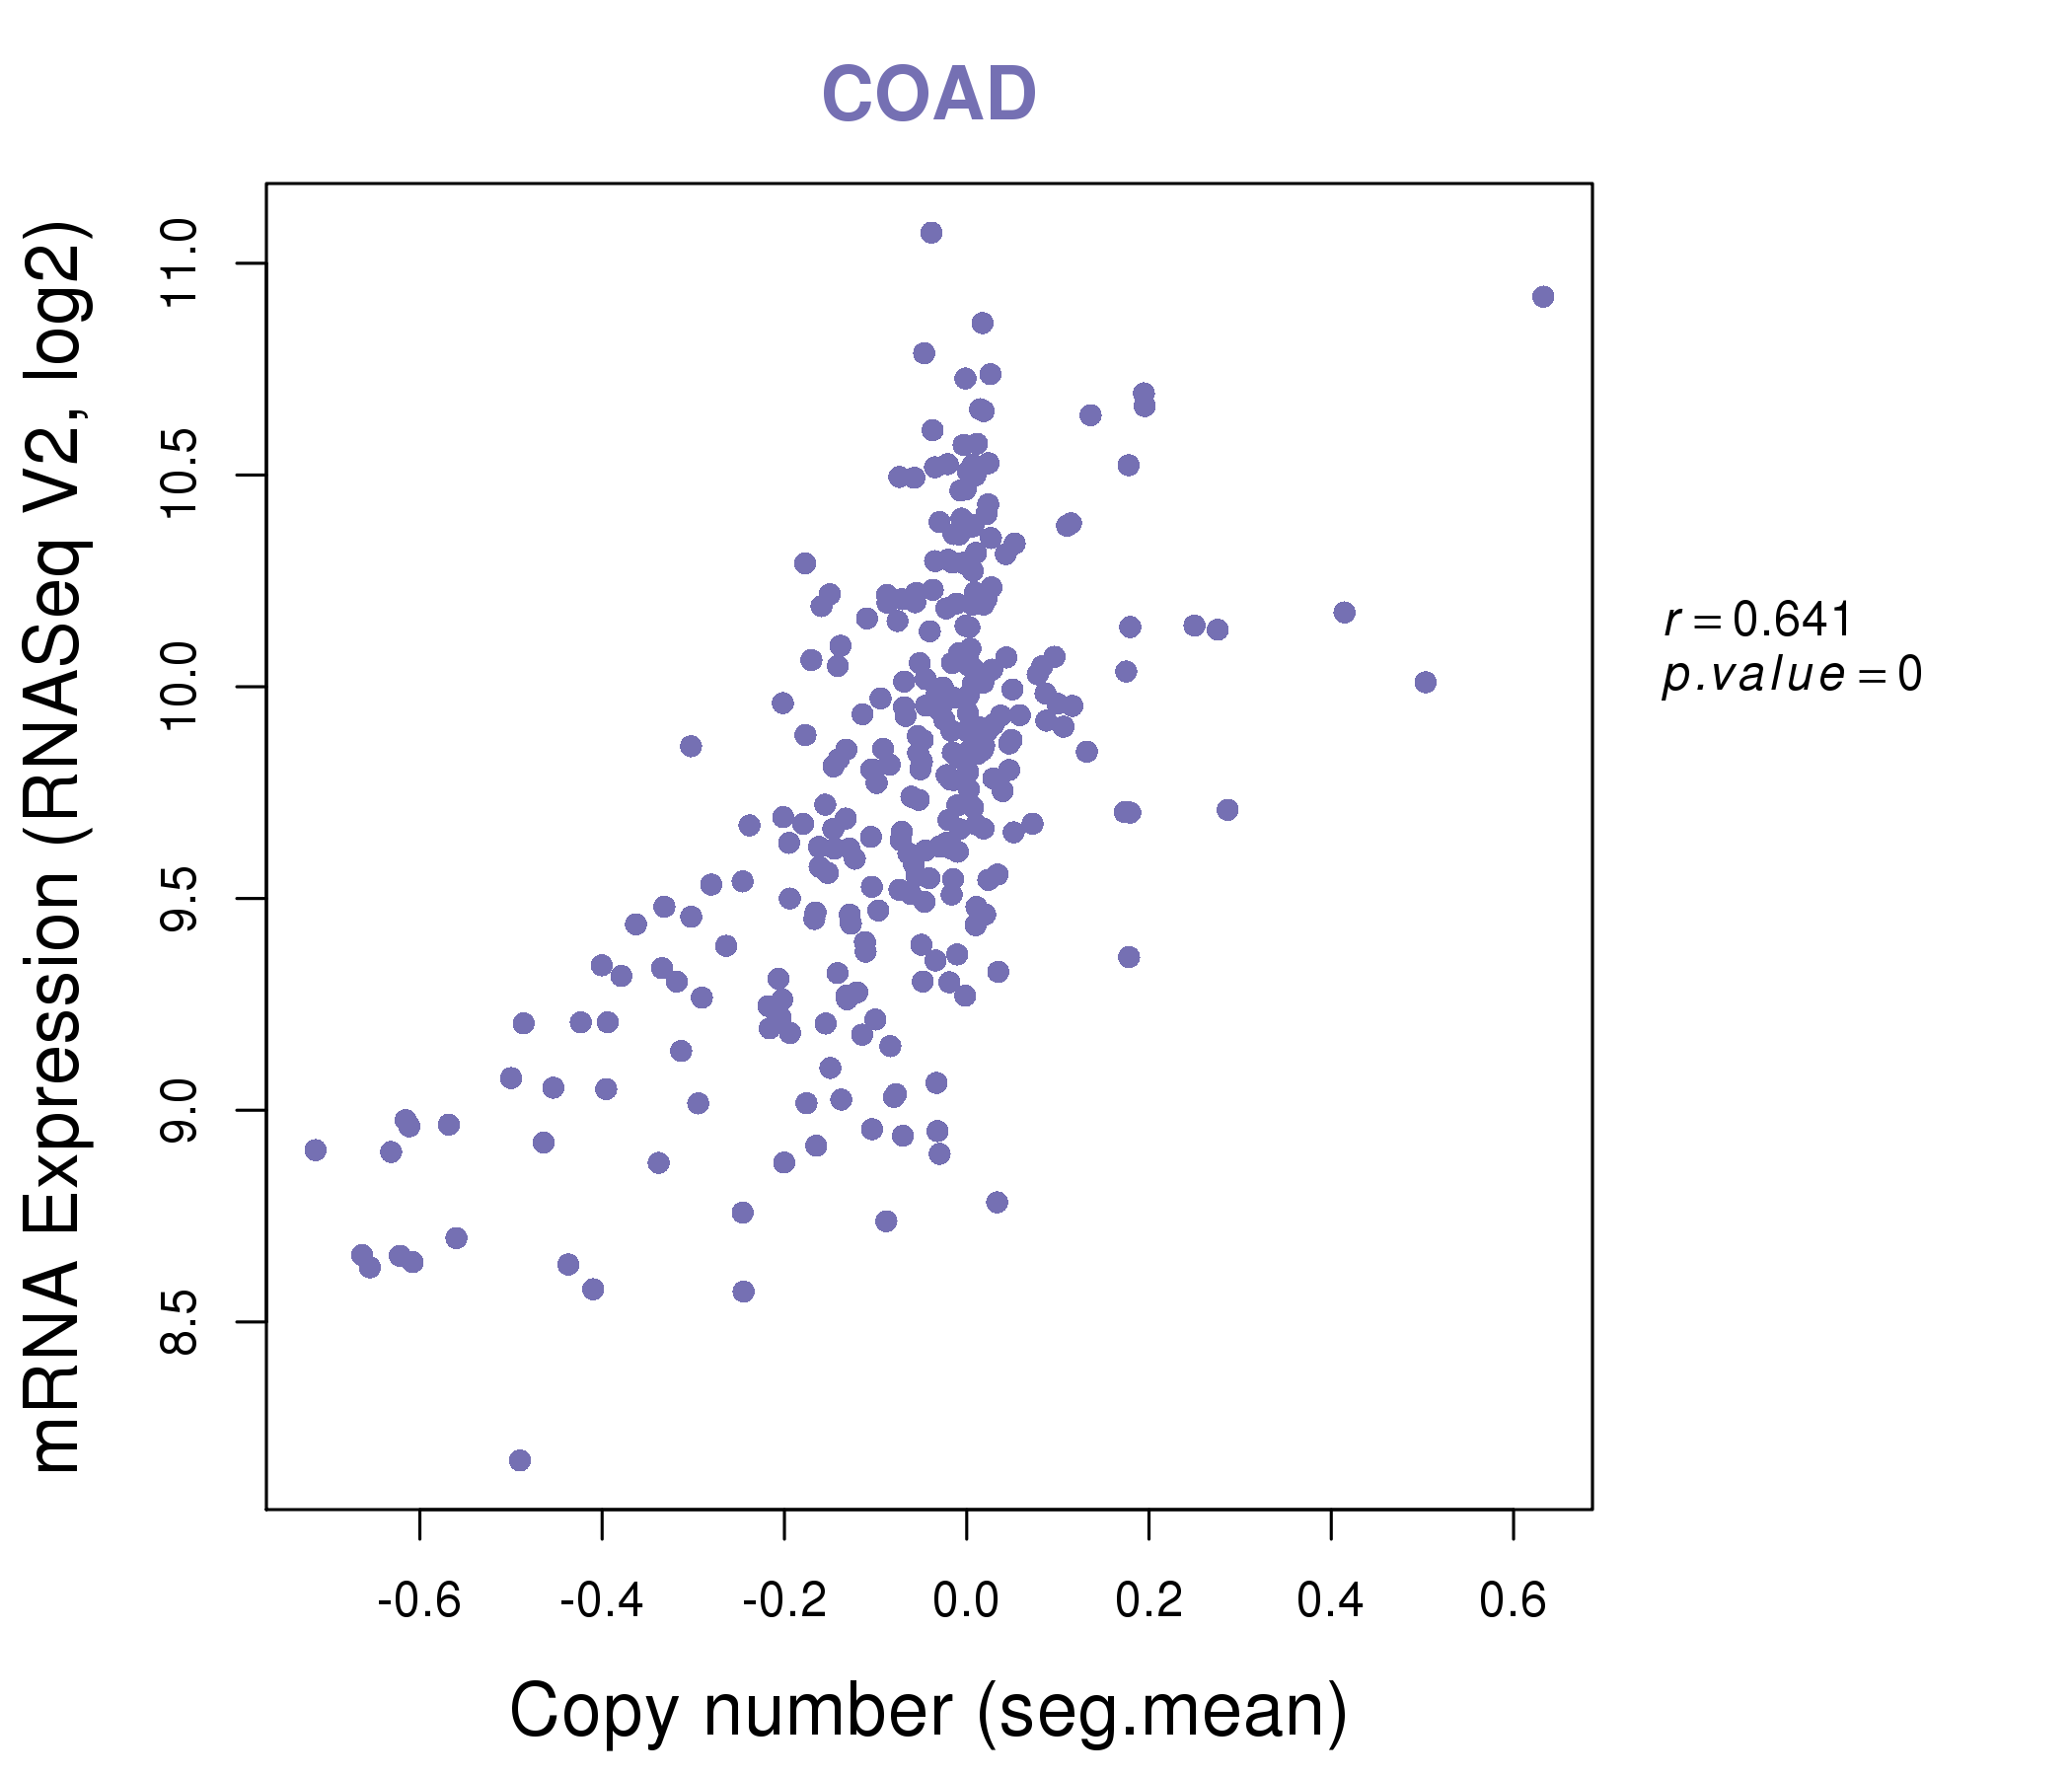
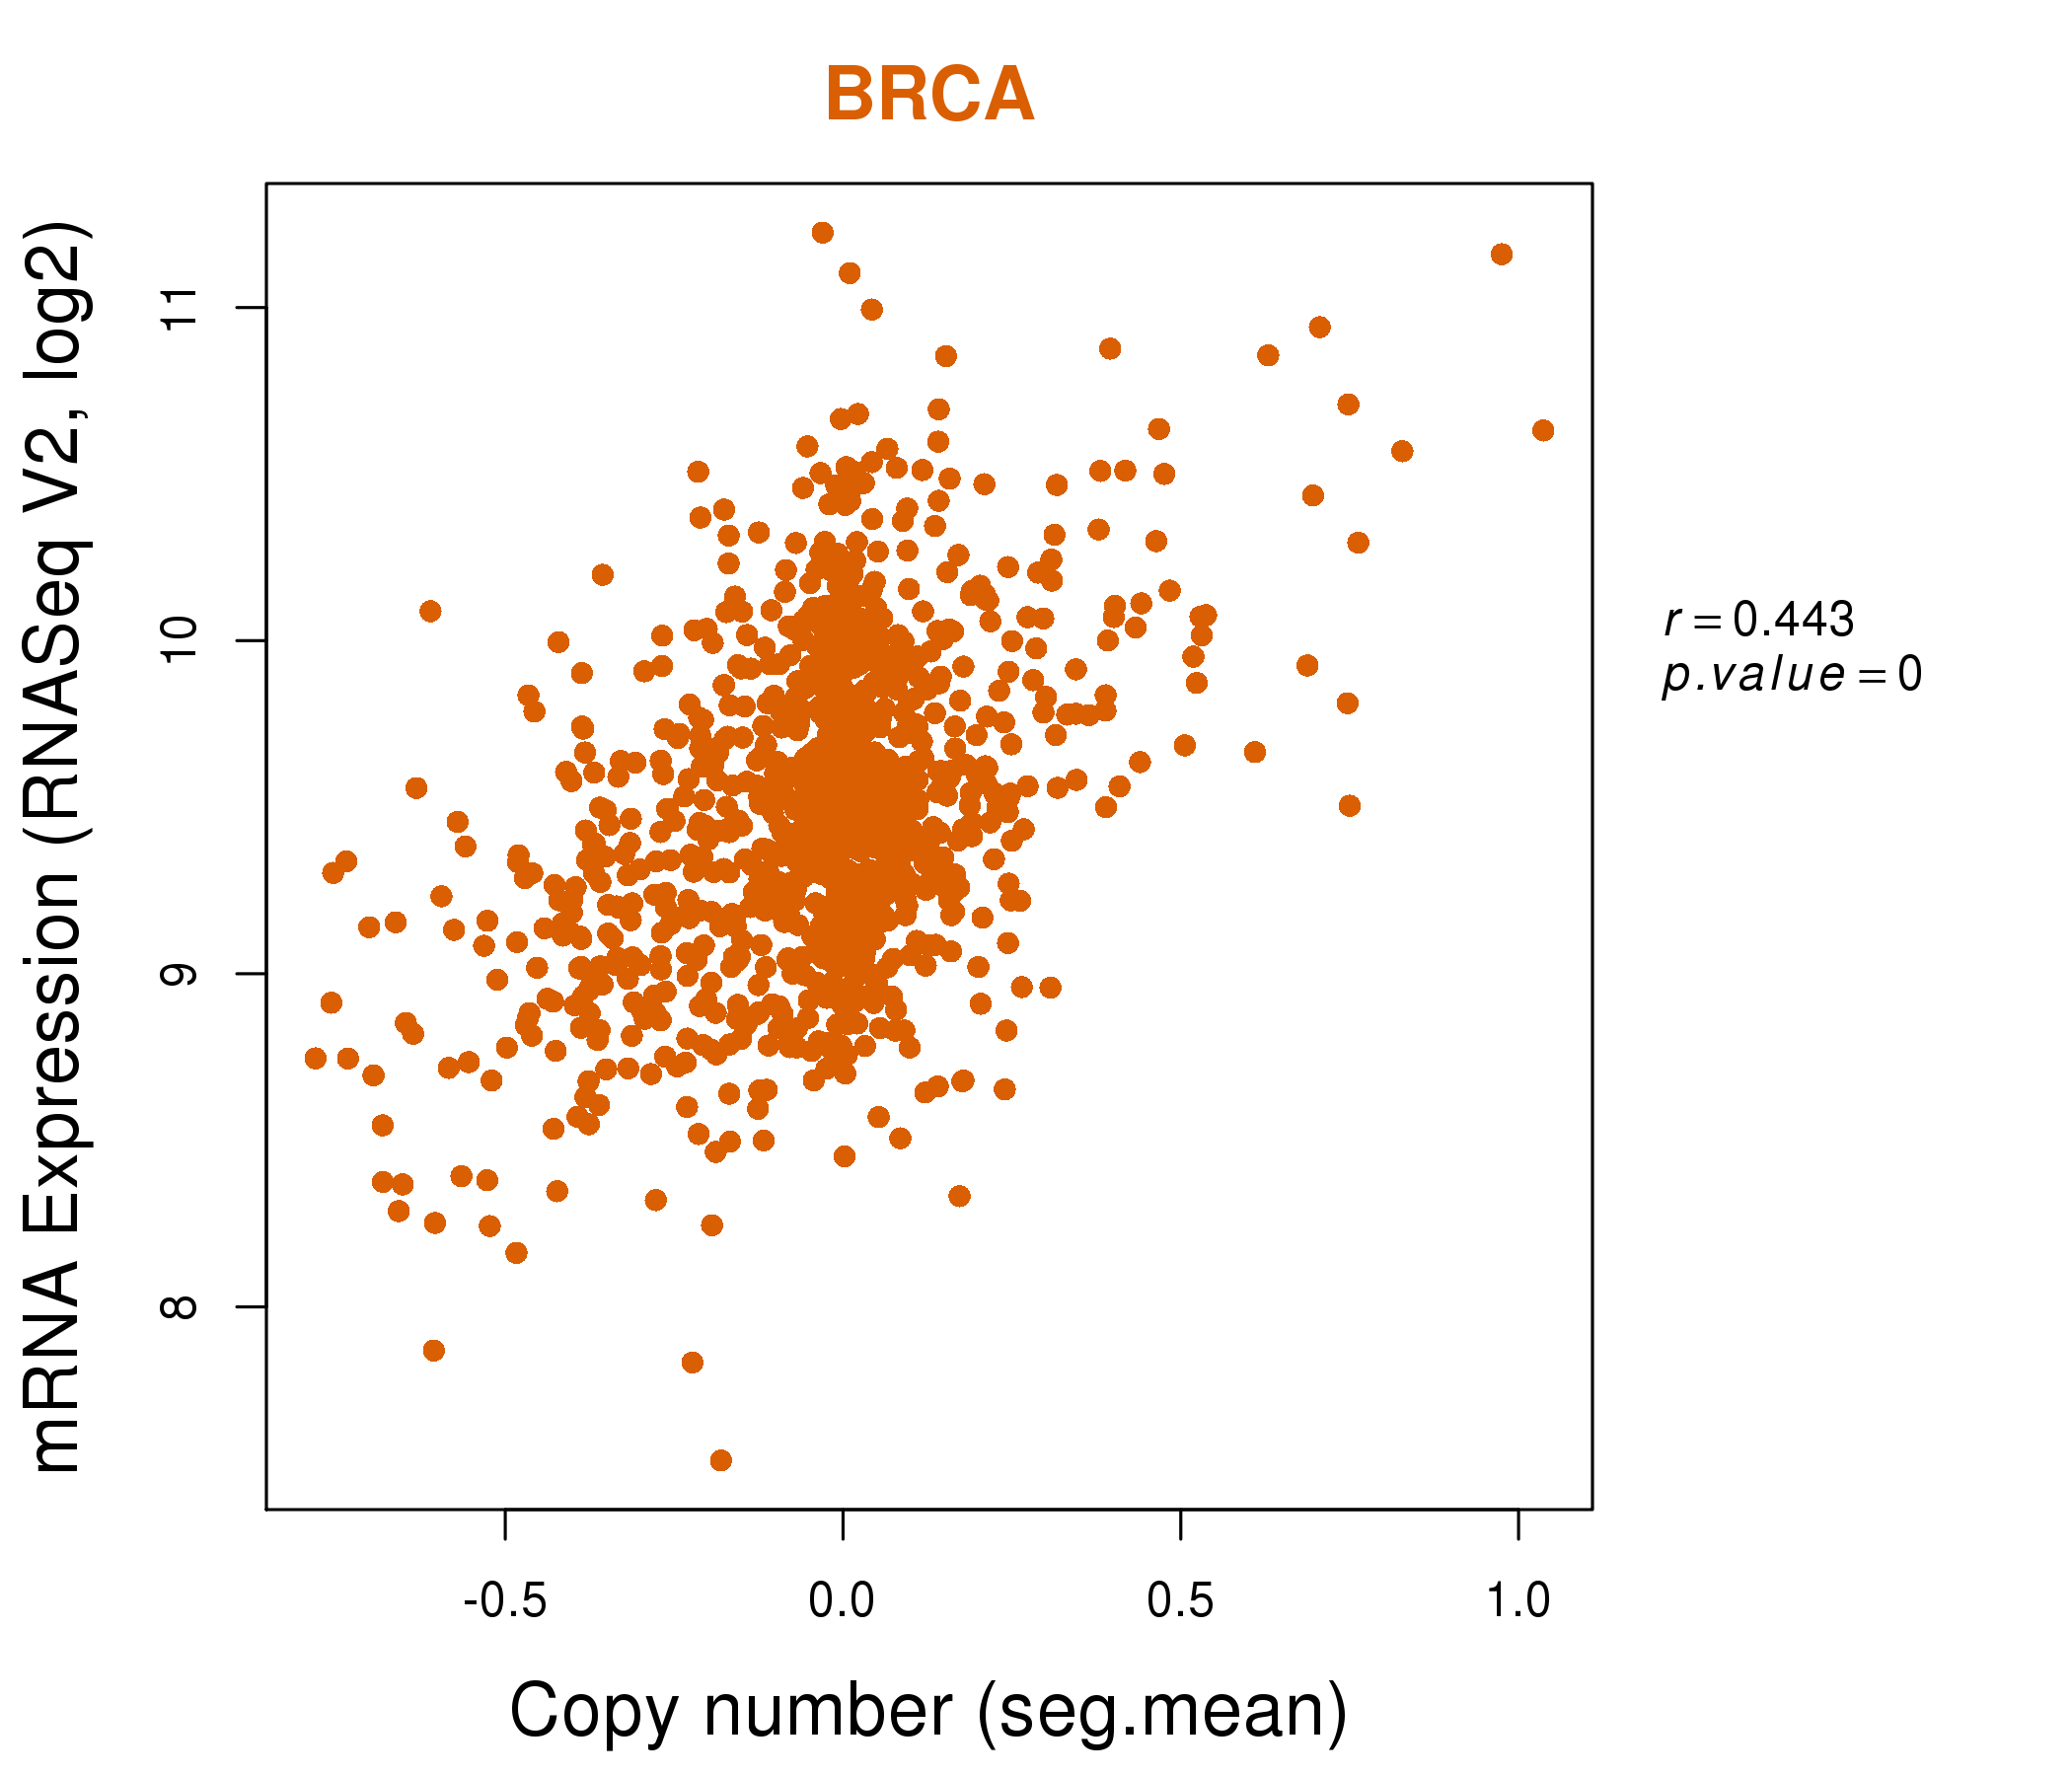
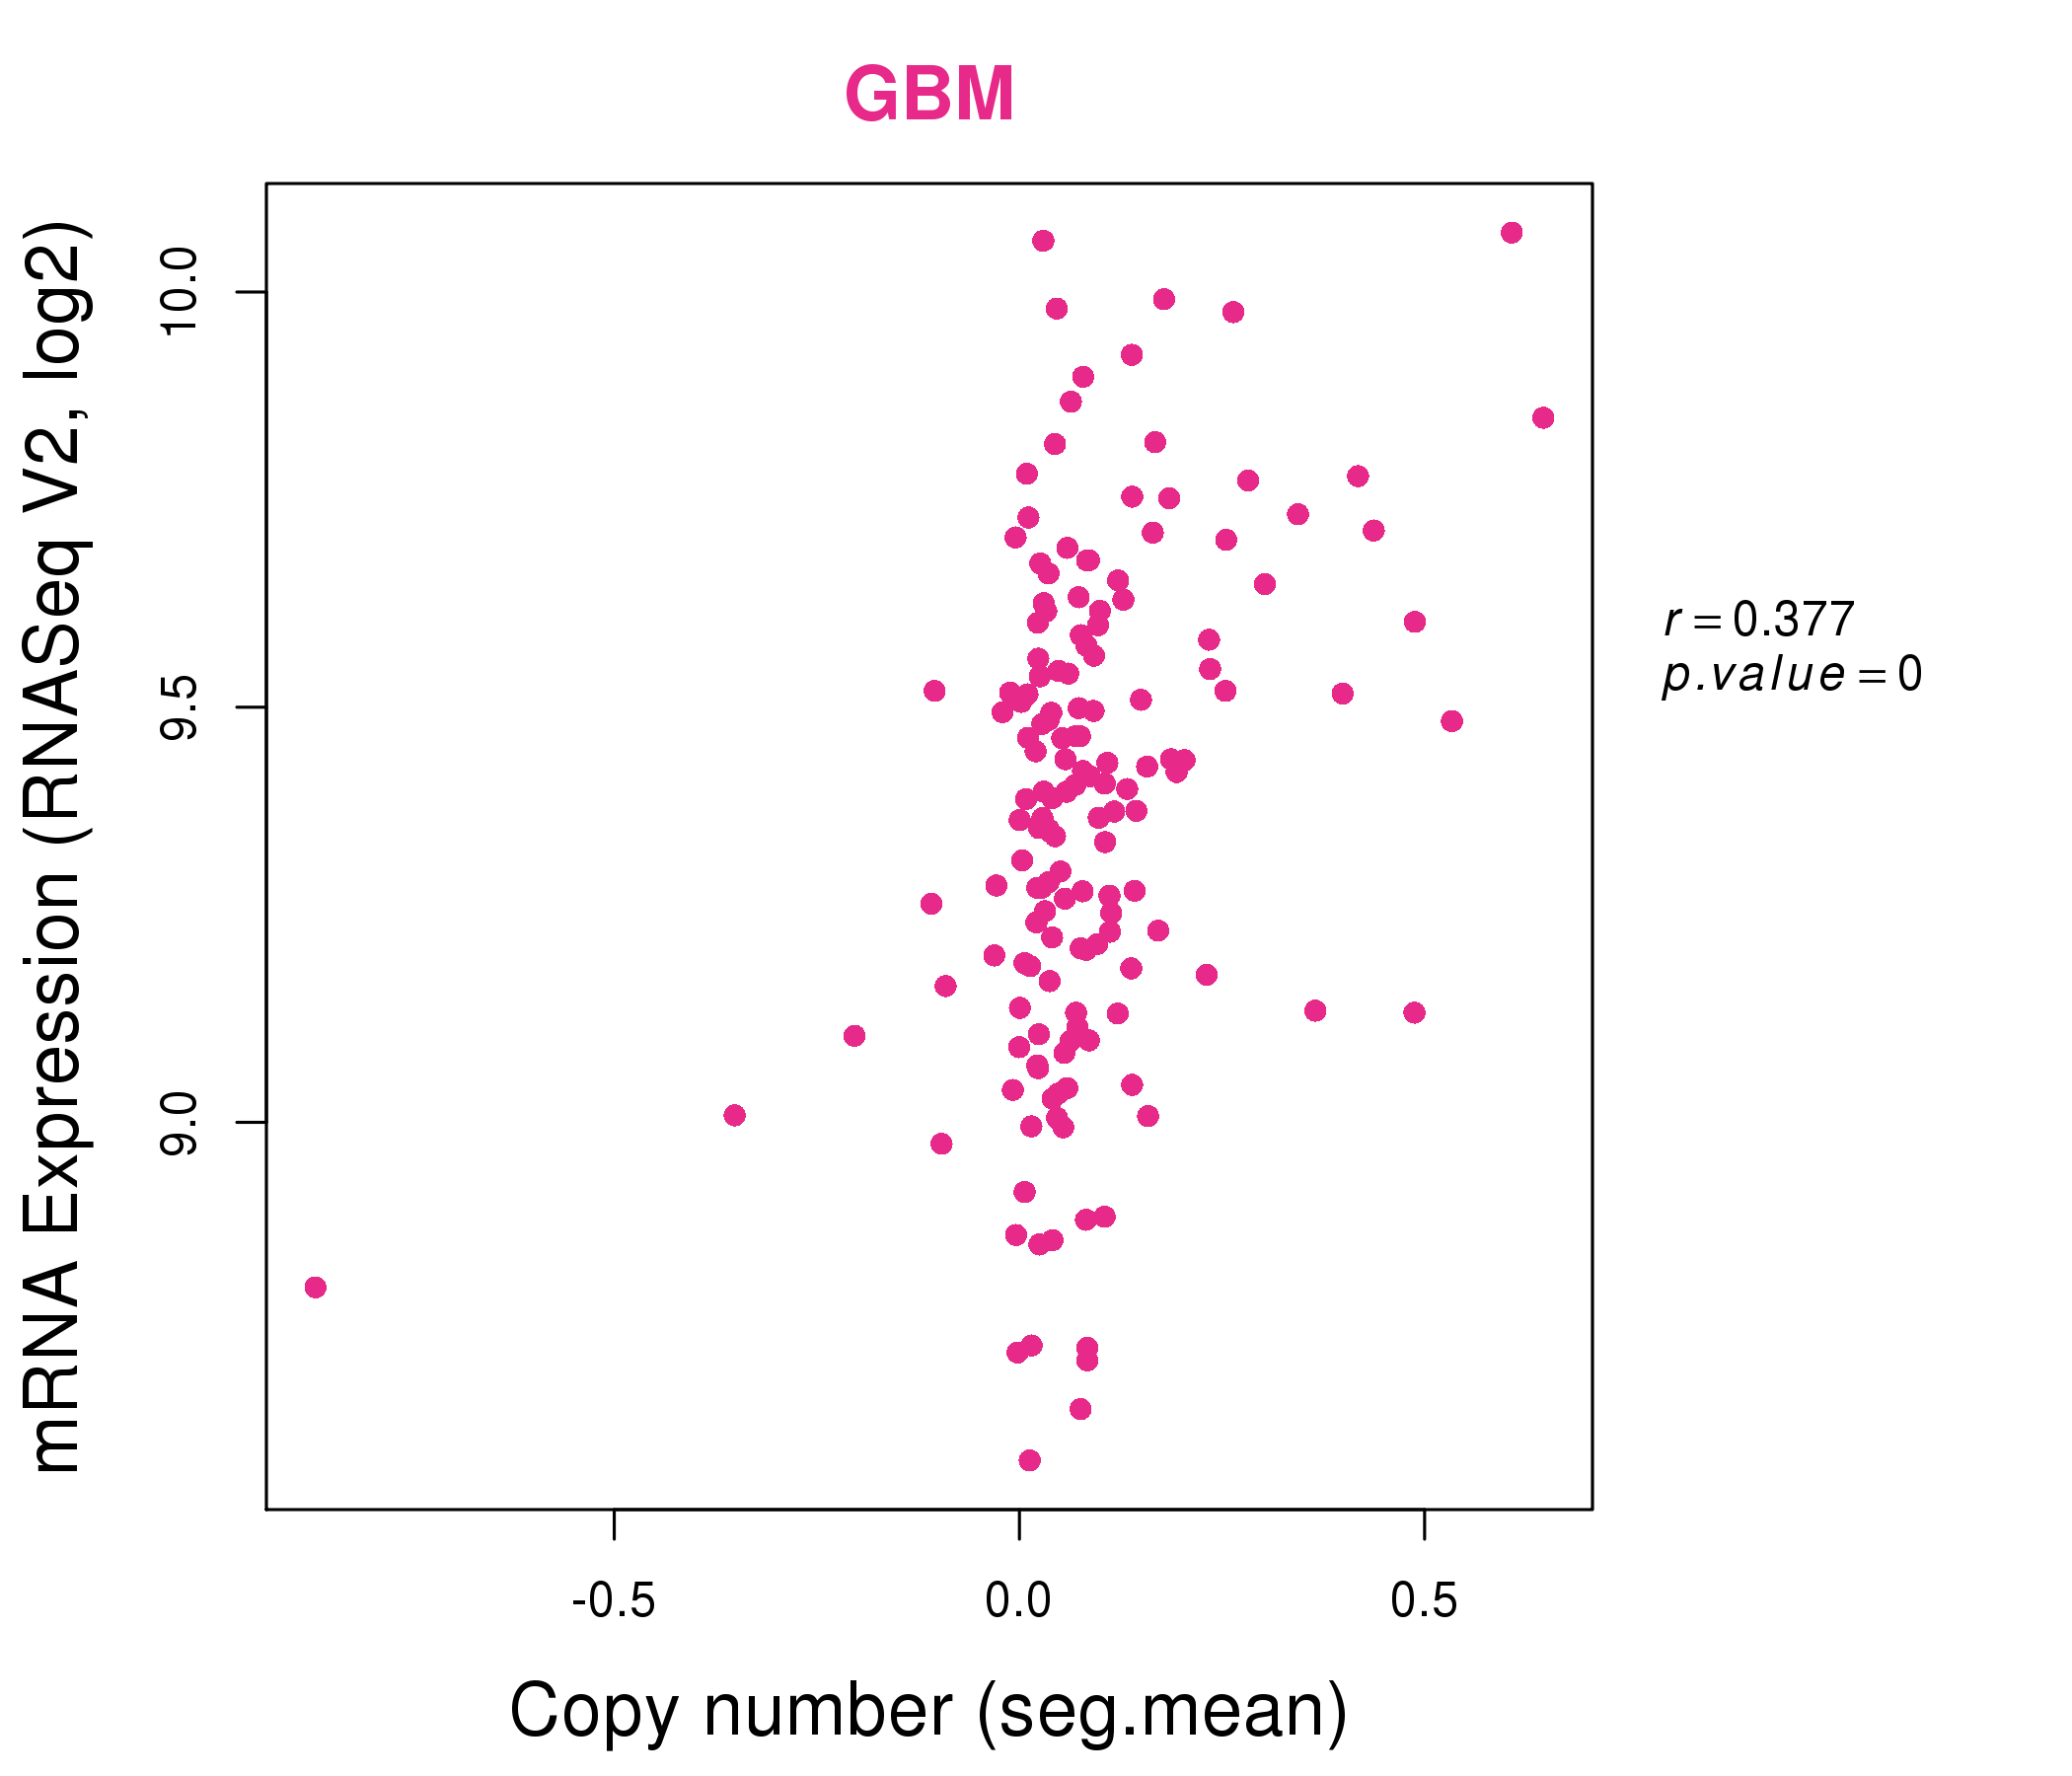
| * Normalized gene expression data of RNASeqV2 was extracted from TCGA using R package TCGA-Assembler. The URLs of all public data files on TCGA DCC data server were gathered at Jan-05-2015. Only eight cancer types have enough normal control samples for differential expression analysis. (t test, adjusted p<0.05 (using Benjamini-Hochberg FDR)) |
 |
| Top |
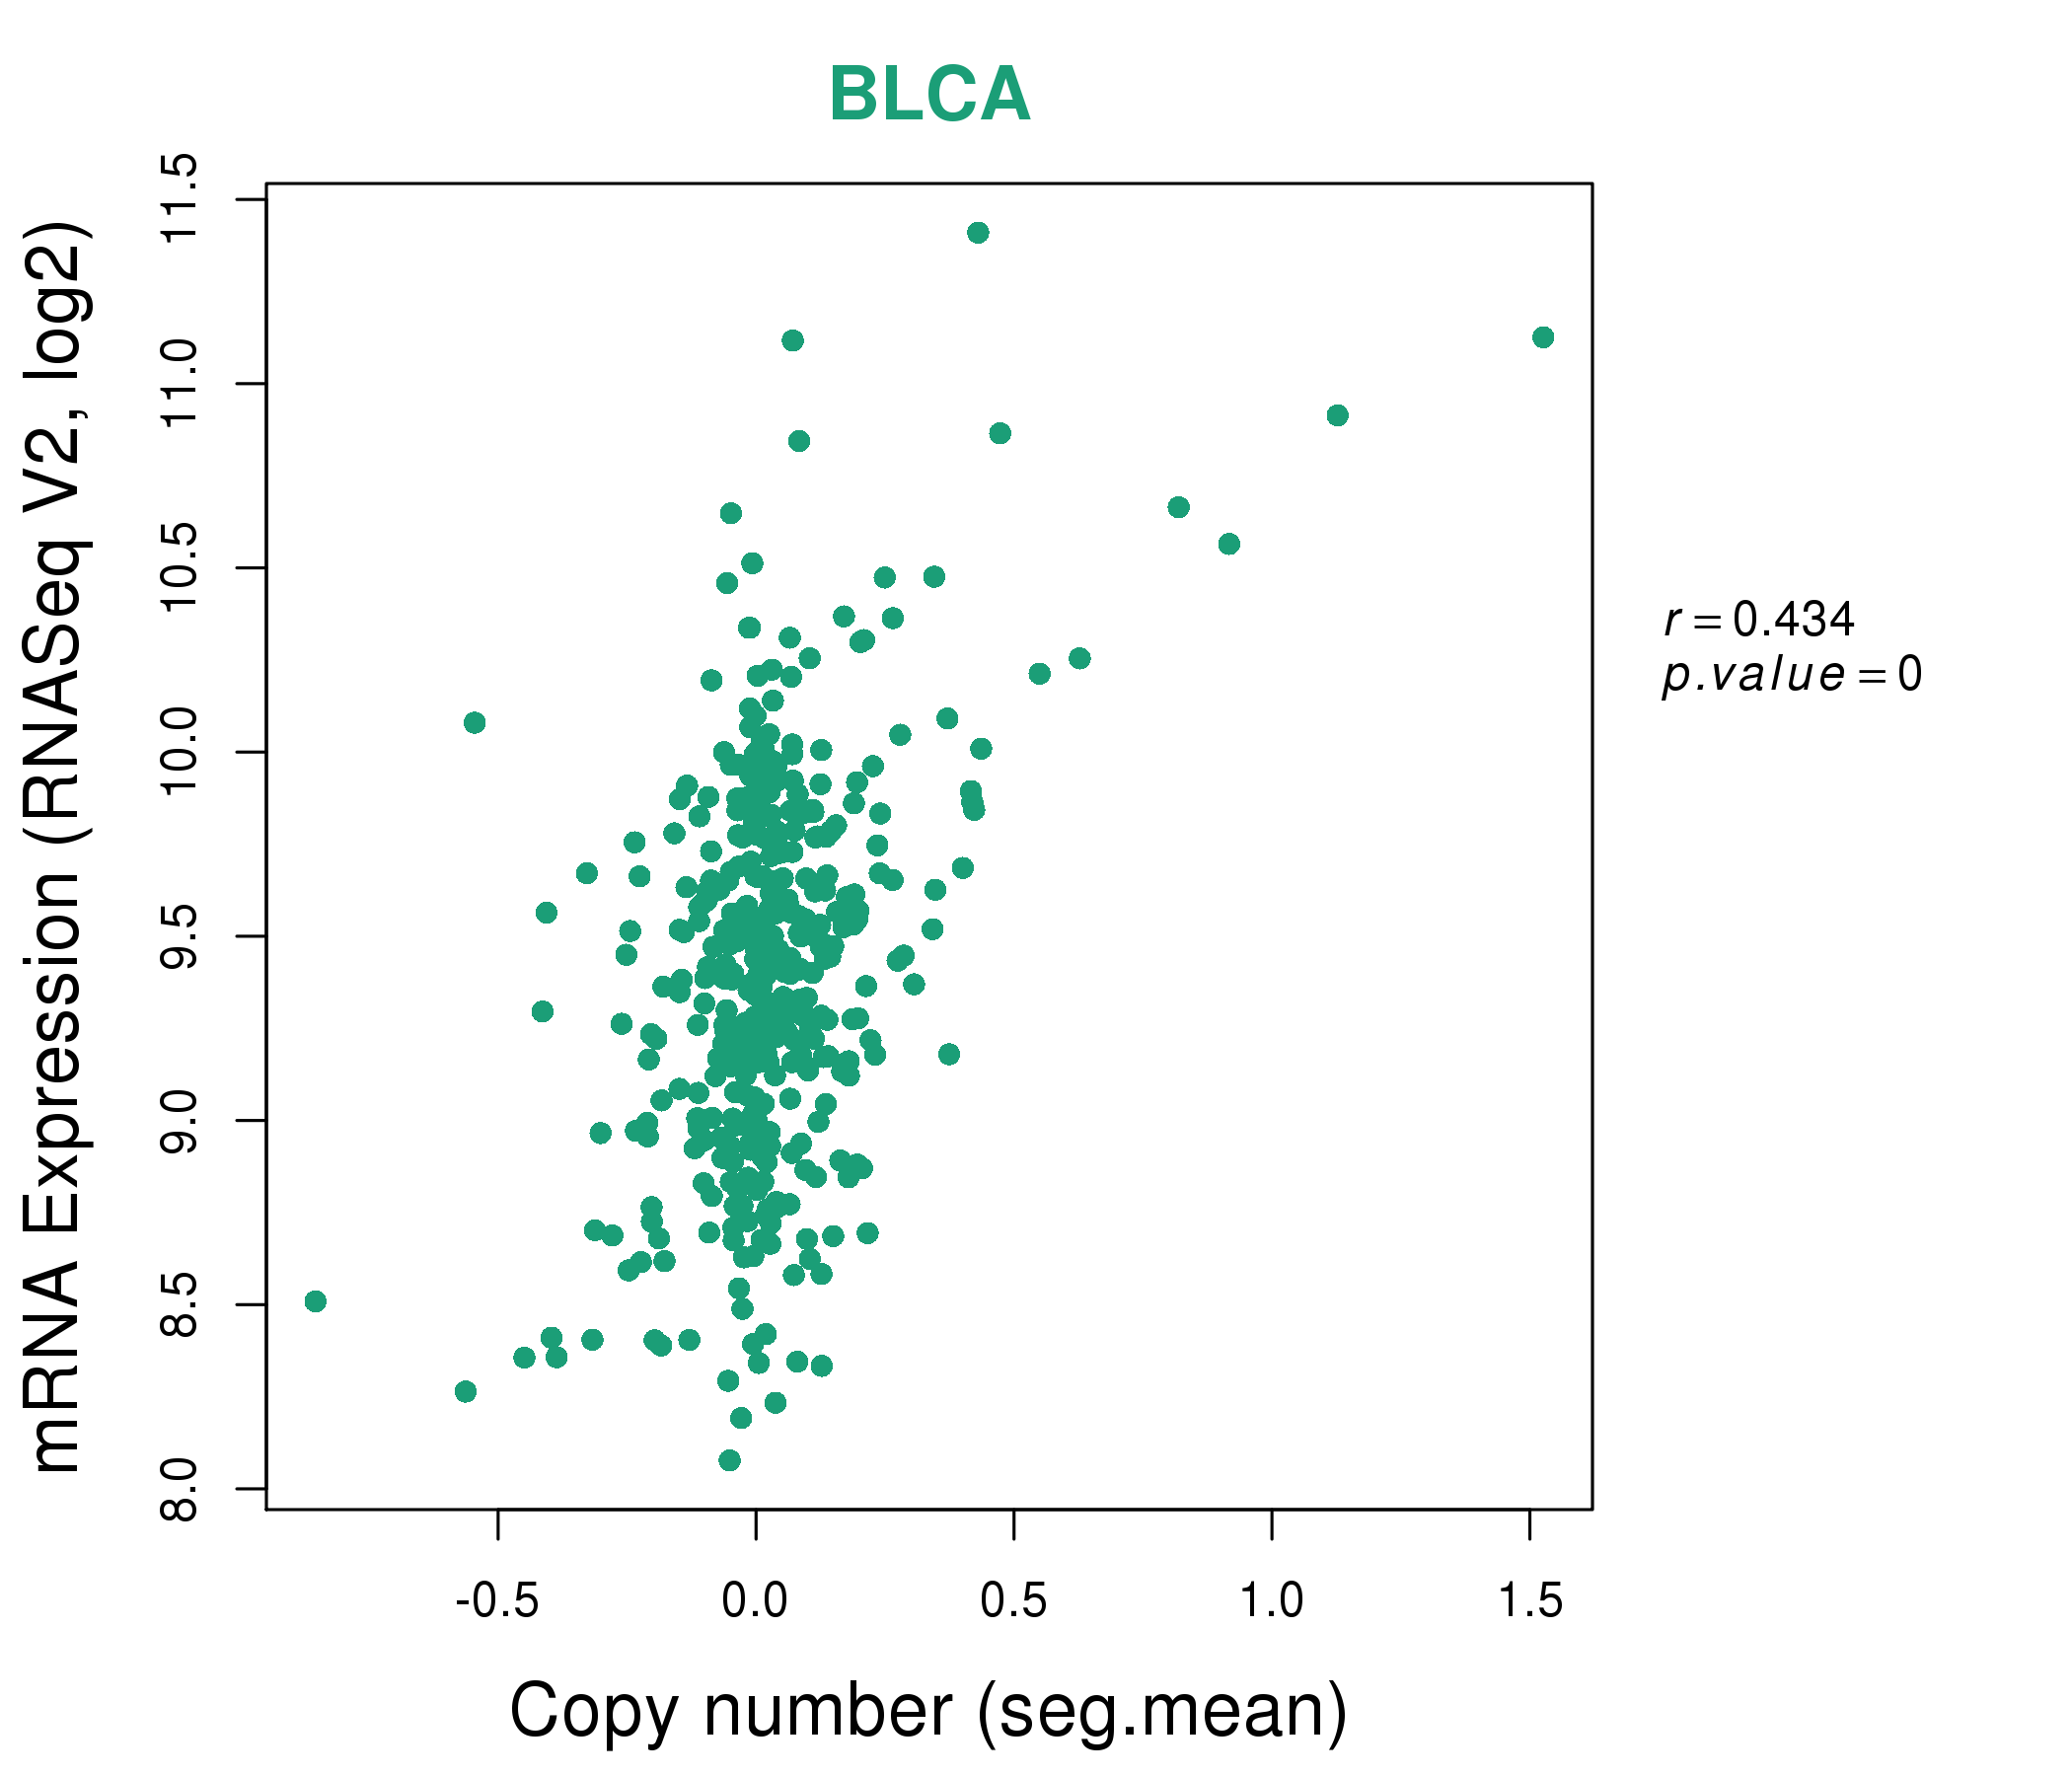
| * This plots show the correlation between CNV and gene expression. |
: Open all plots for all cancer types
 |
|
 |
|
| Top |
| Gene-Gene Network Information |
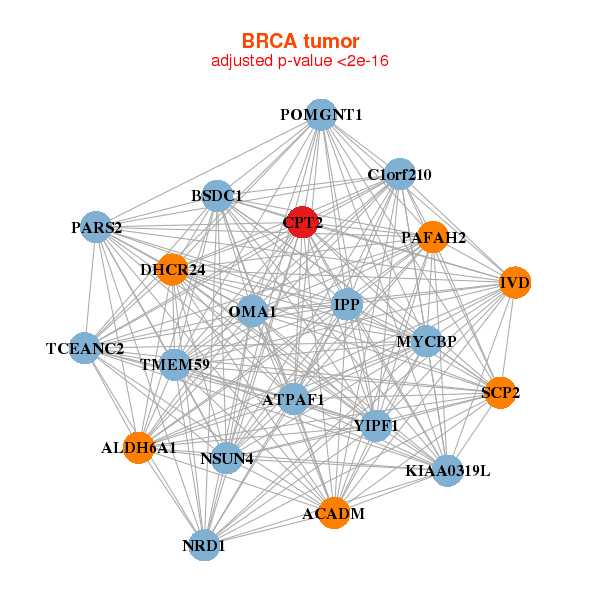
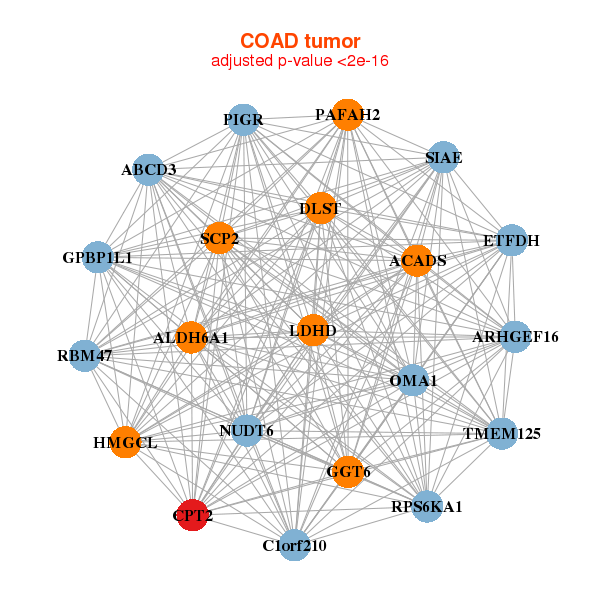
| * Co-Expression network figures were drawn using R package igraph. Only the top 20 genes with the highest correlations were shown. Red circle: input gene, orange circle: cell metabolism gene, sky circle: other gene |
: Open all plots for all cancer types
 |
| ||||
| ACADM,ALDH6A1,ATPAF1,BSDC1,C1orf210,TCEANC2,CPT2, DHCR24,IPP,IVD,KIAA0319L,MYCBP,NRD1,NSUN4, OMA1,PAFAH2,PARS2,POMGNT1,SCP2,TMEM59,YIPF1 | ABCB6,ACADM,AIFM1,MPC2,C19orf54,GUCD1,COQ6, CPT2,CRAT,CSPG5,DBI,GRPEL1,HIST1H1C,IVD, LDHD,NDUFA10,NDUFAF1,NFS1,PCCB,ECI2,SUOX | ||||
 |
| ||||
| ABCD3,ACADS,ALDH6A1,ARHGEF16,C1orf210,CPT2,DLST, ETFDH,GGT6,GPBP1L1,HMGCL,LDHD,NUDT6,OMA1, PAFAH2,PIGR,RBM47,RPS6KA1,SCP2,SIAE,TMEM125 | ACSF2,AGFG2,AP1M2,BDH1,CPT2,DTX4,ENTPD5, EPB41L4B,KLF5,LDLRAP1,MARVELD3,MYO1D,PAFAH2,PLD1, PPARG,PTK6,SFXN5,SH3BGRL2,SLC44A1,TRAF3IP2,WDR78 |
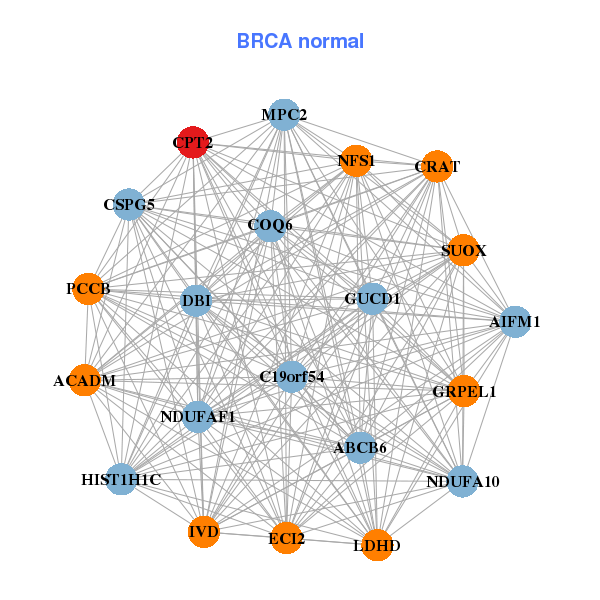
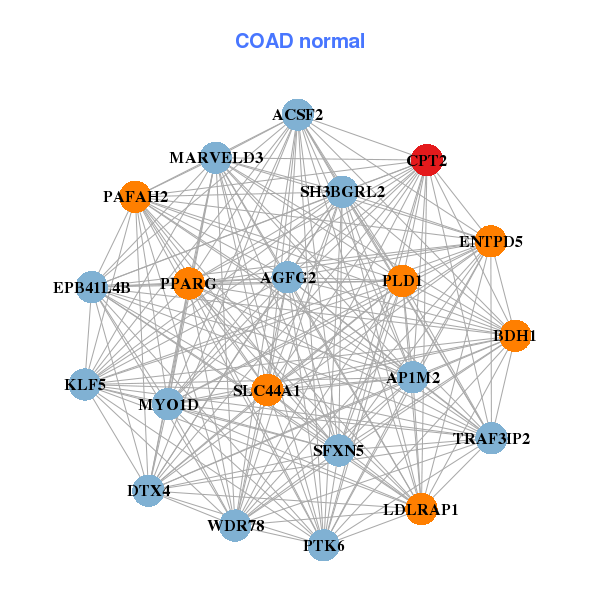
| * Co-Expression network figures were drawn using R package igraph. Only the top 20 genes with the highest correlations were shown. Red circle: input gene, orange circle: cell metabolism gene, sky circle: other gene |
: Open all plots for all cancer types
| Top |
: Open all interacting genes' information including KEGG pathway for all interacting genes from DAVID
| Top |
| Pharmacological Information for CPT2 |
| DB Category | DB Name | DB's ID and Url link |
| * Gene Centered Interaction Network. |
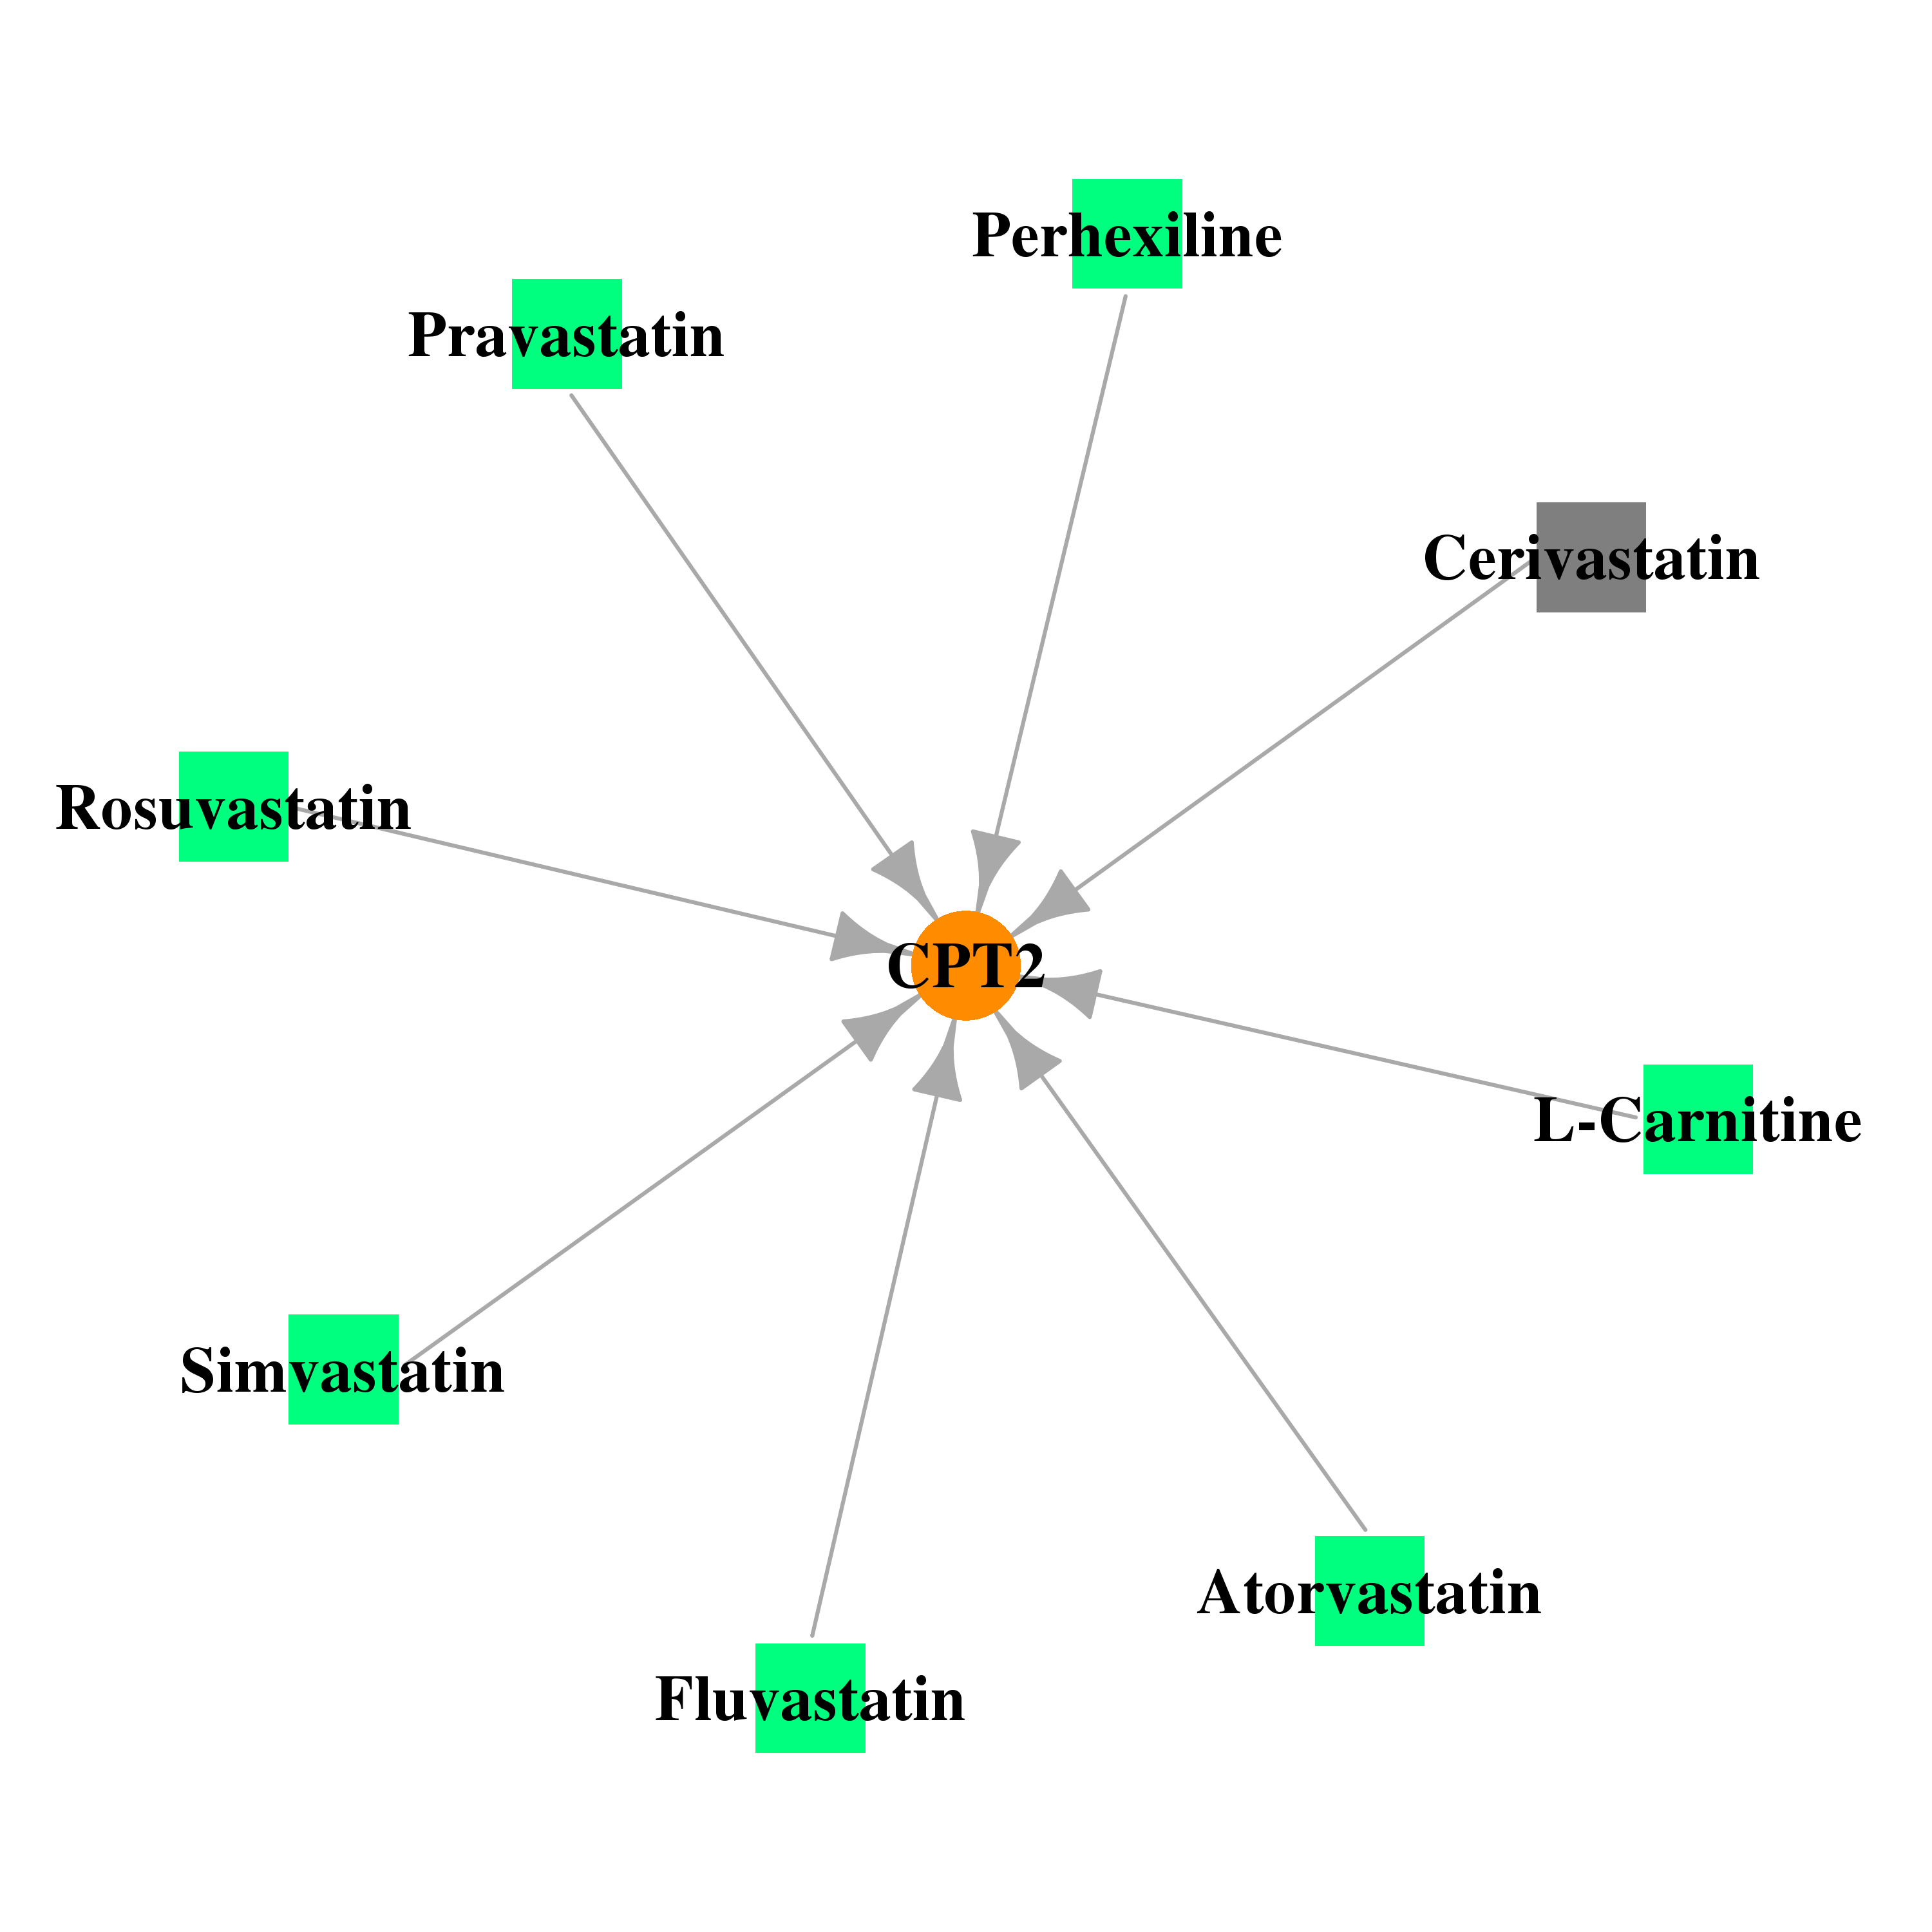 |
| * Drug Centered Interaction Network. |
| DrugBank ID | Target Name | Drug Groups | Generic Name | Drug Centered Network | Drug Structure |
| DB00583 | carnitine palmitoyltransferase 2 | approved | L-Carnitine | 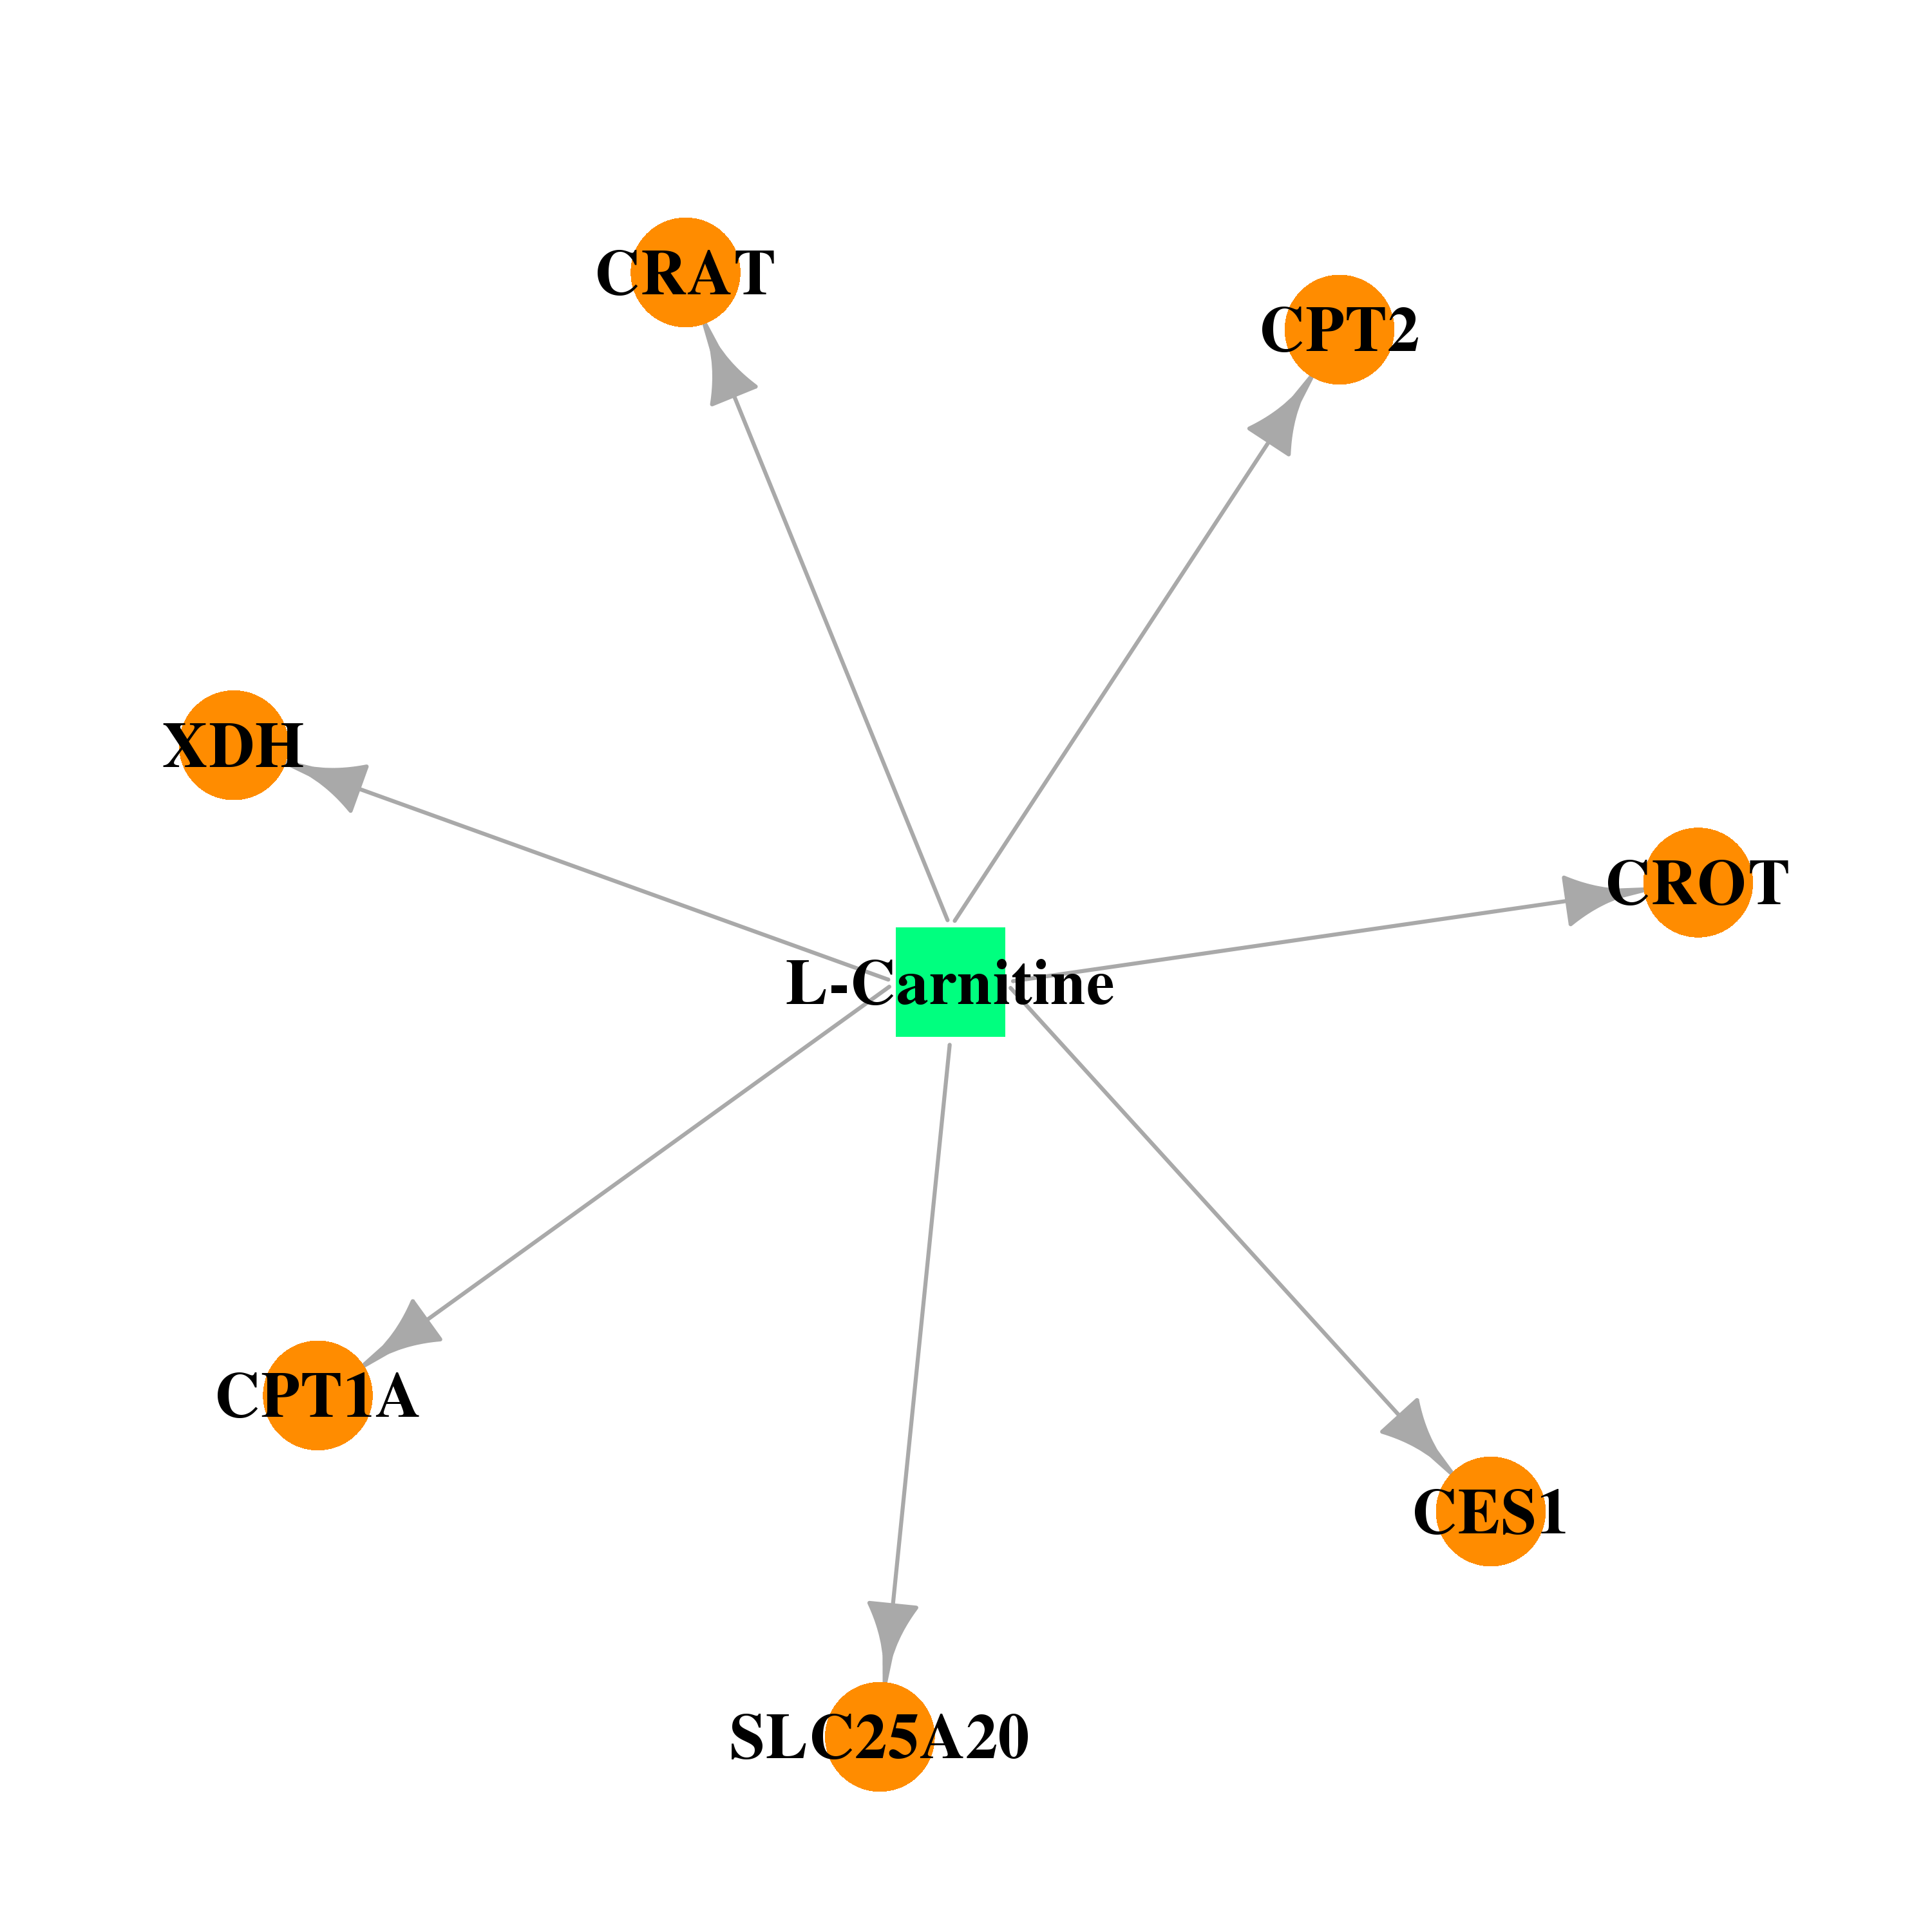 | 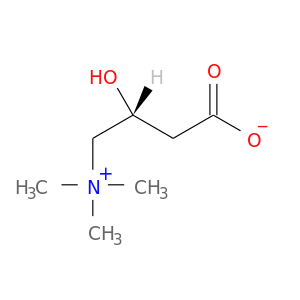 |
| DB01074 | carnitine palmitoyltransferase 2 | approved | Perhexiline | 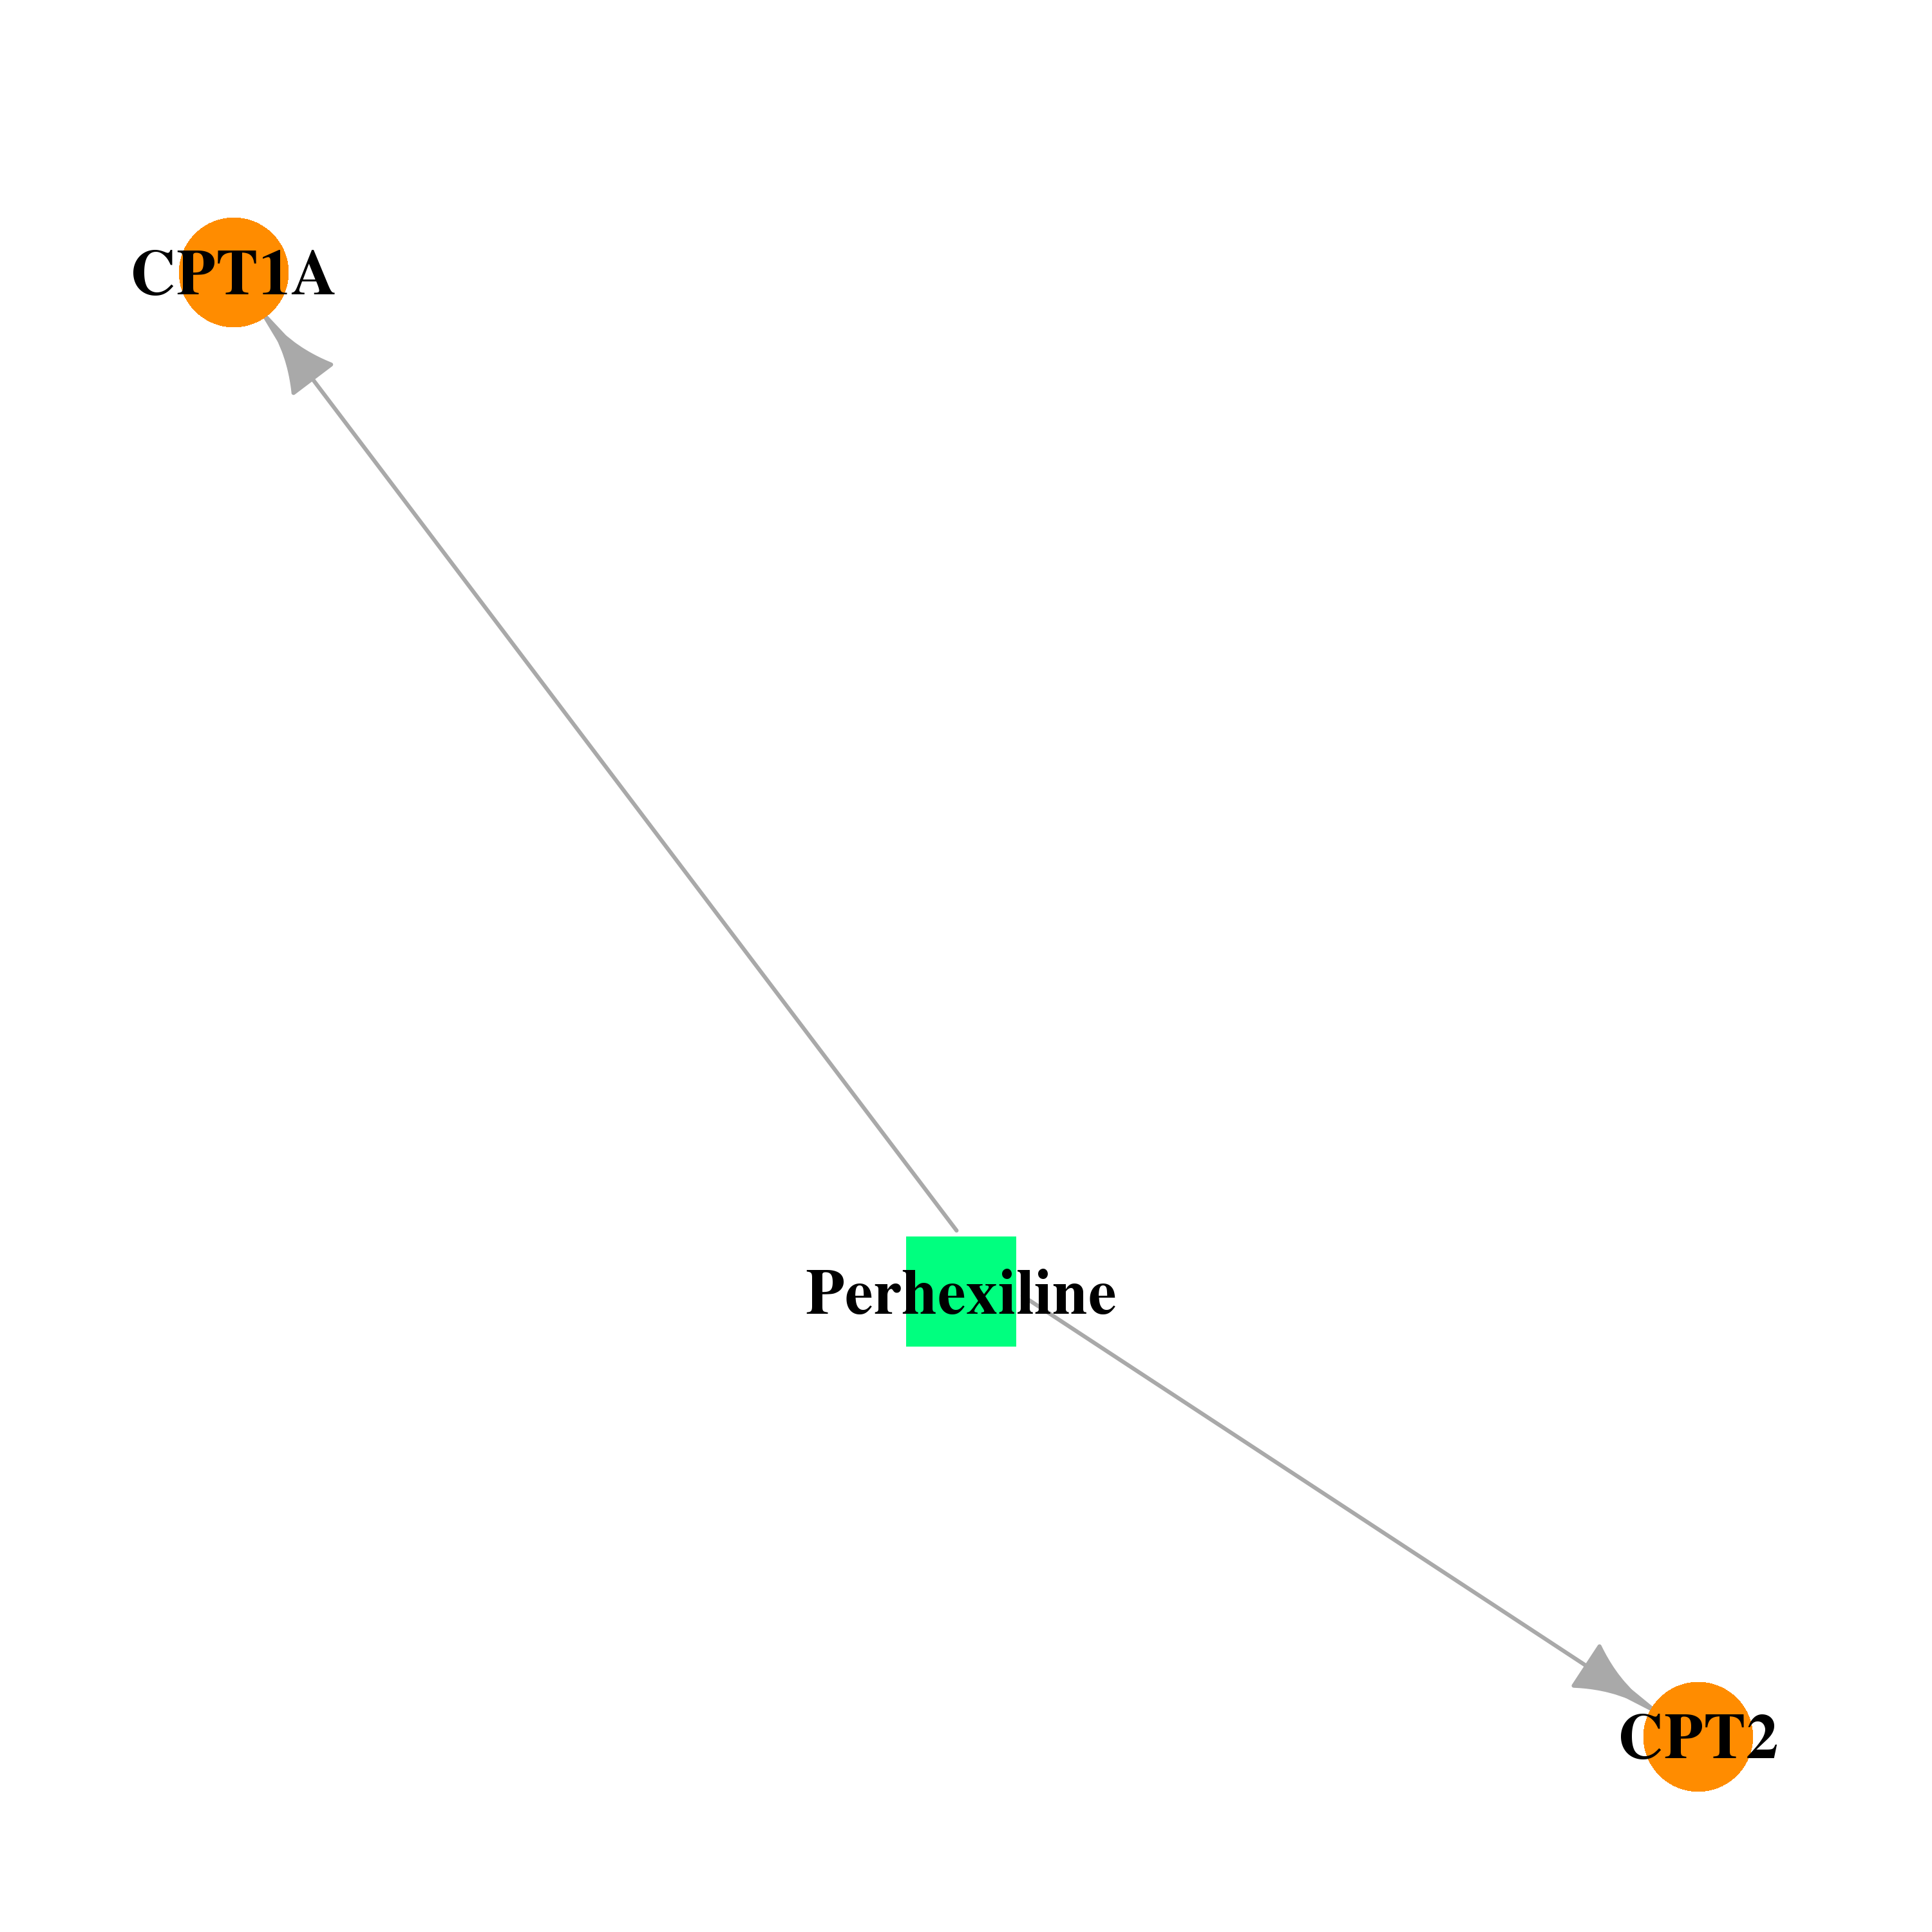 | 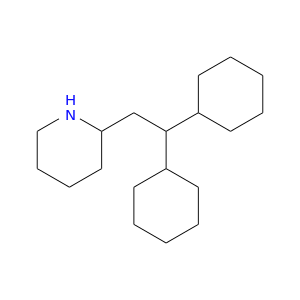 |
| DB01076 | carnitine palmitoyltransferase 2 | approved | Atorvastatin | 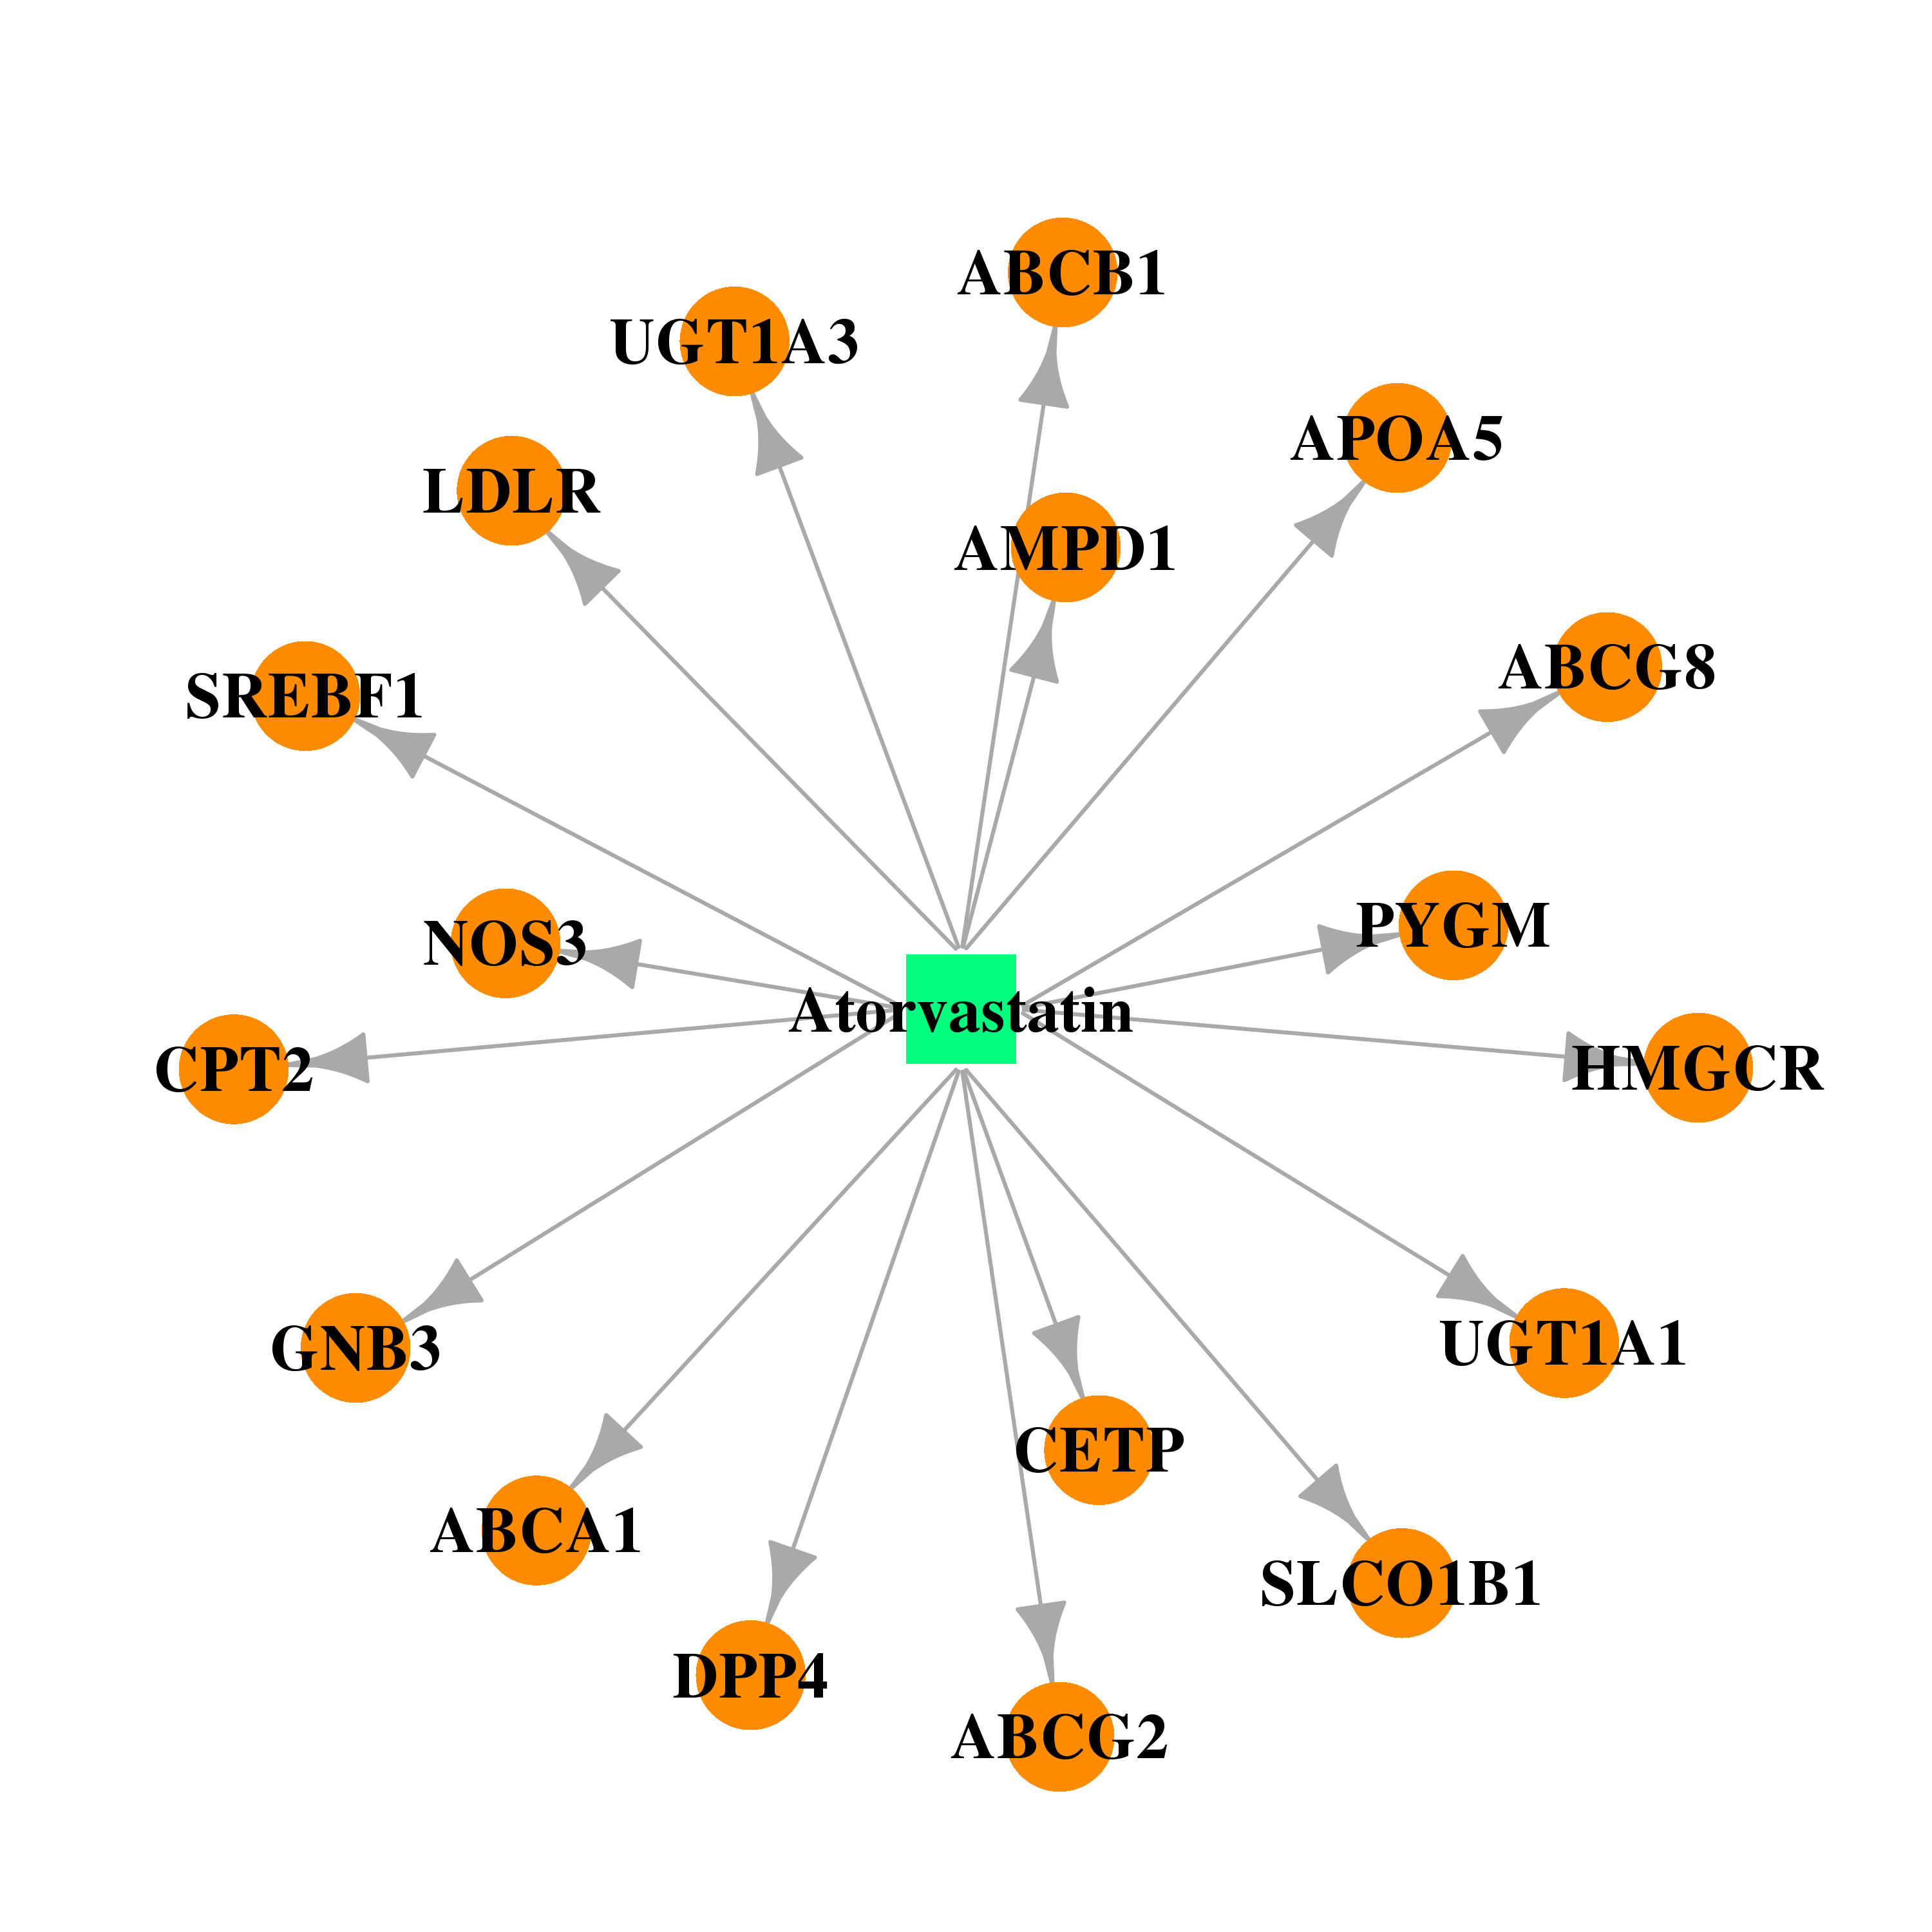 | 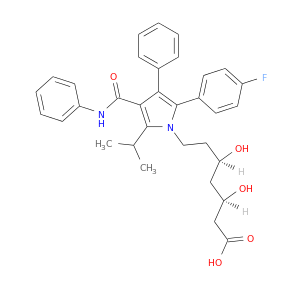 |
| DB00439 | carnitine palmitoyltransferase 2 | withdrawn | Cerivastatin |  | 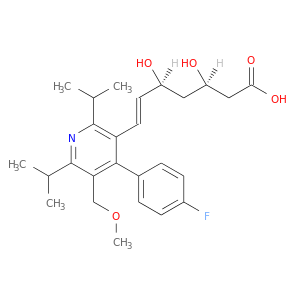 |
| DB01095 | carnitine palmitoyltransferase 2 | approved | Fluvastatin | 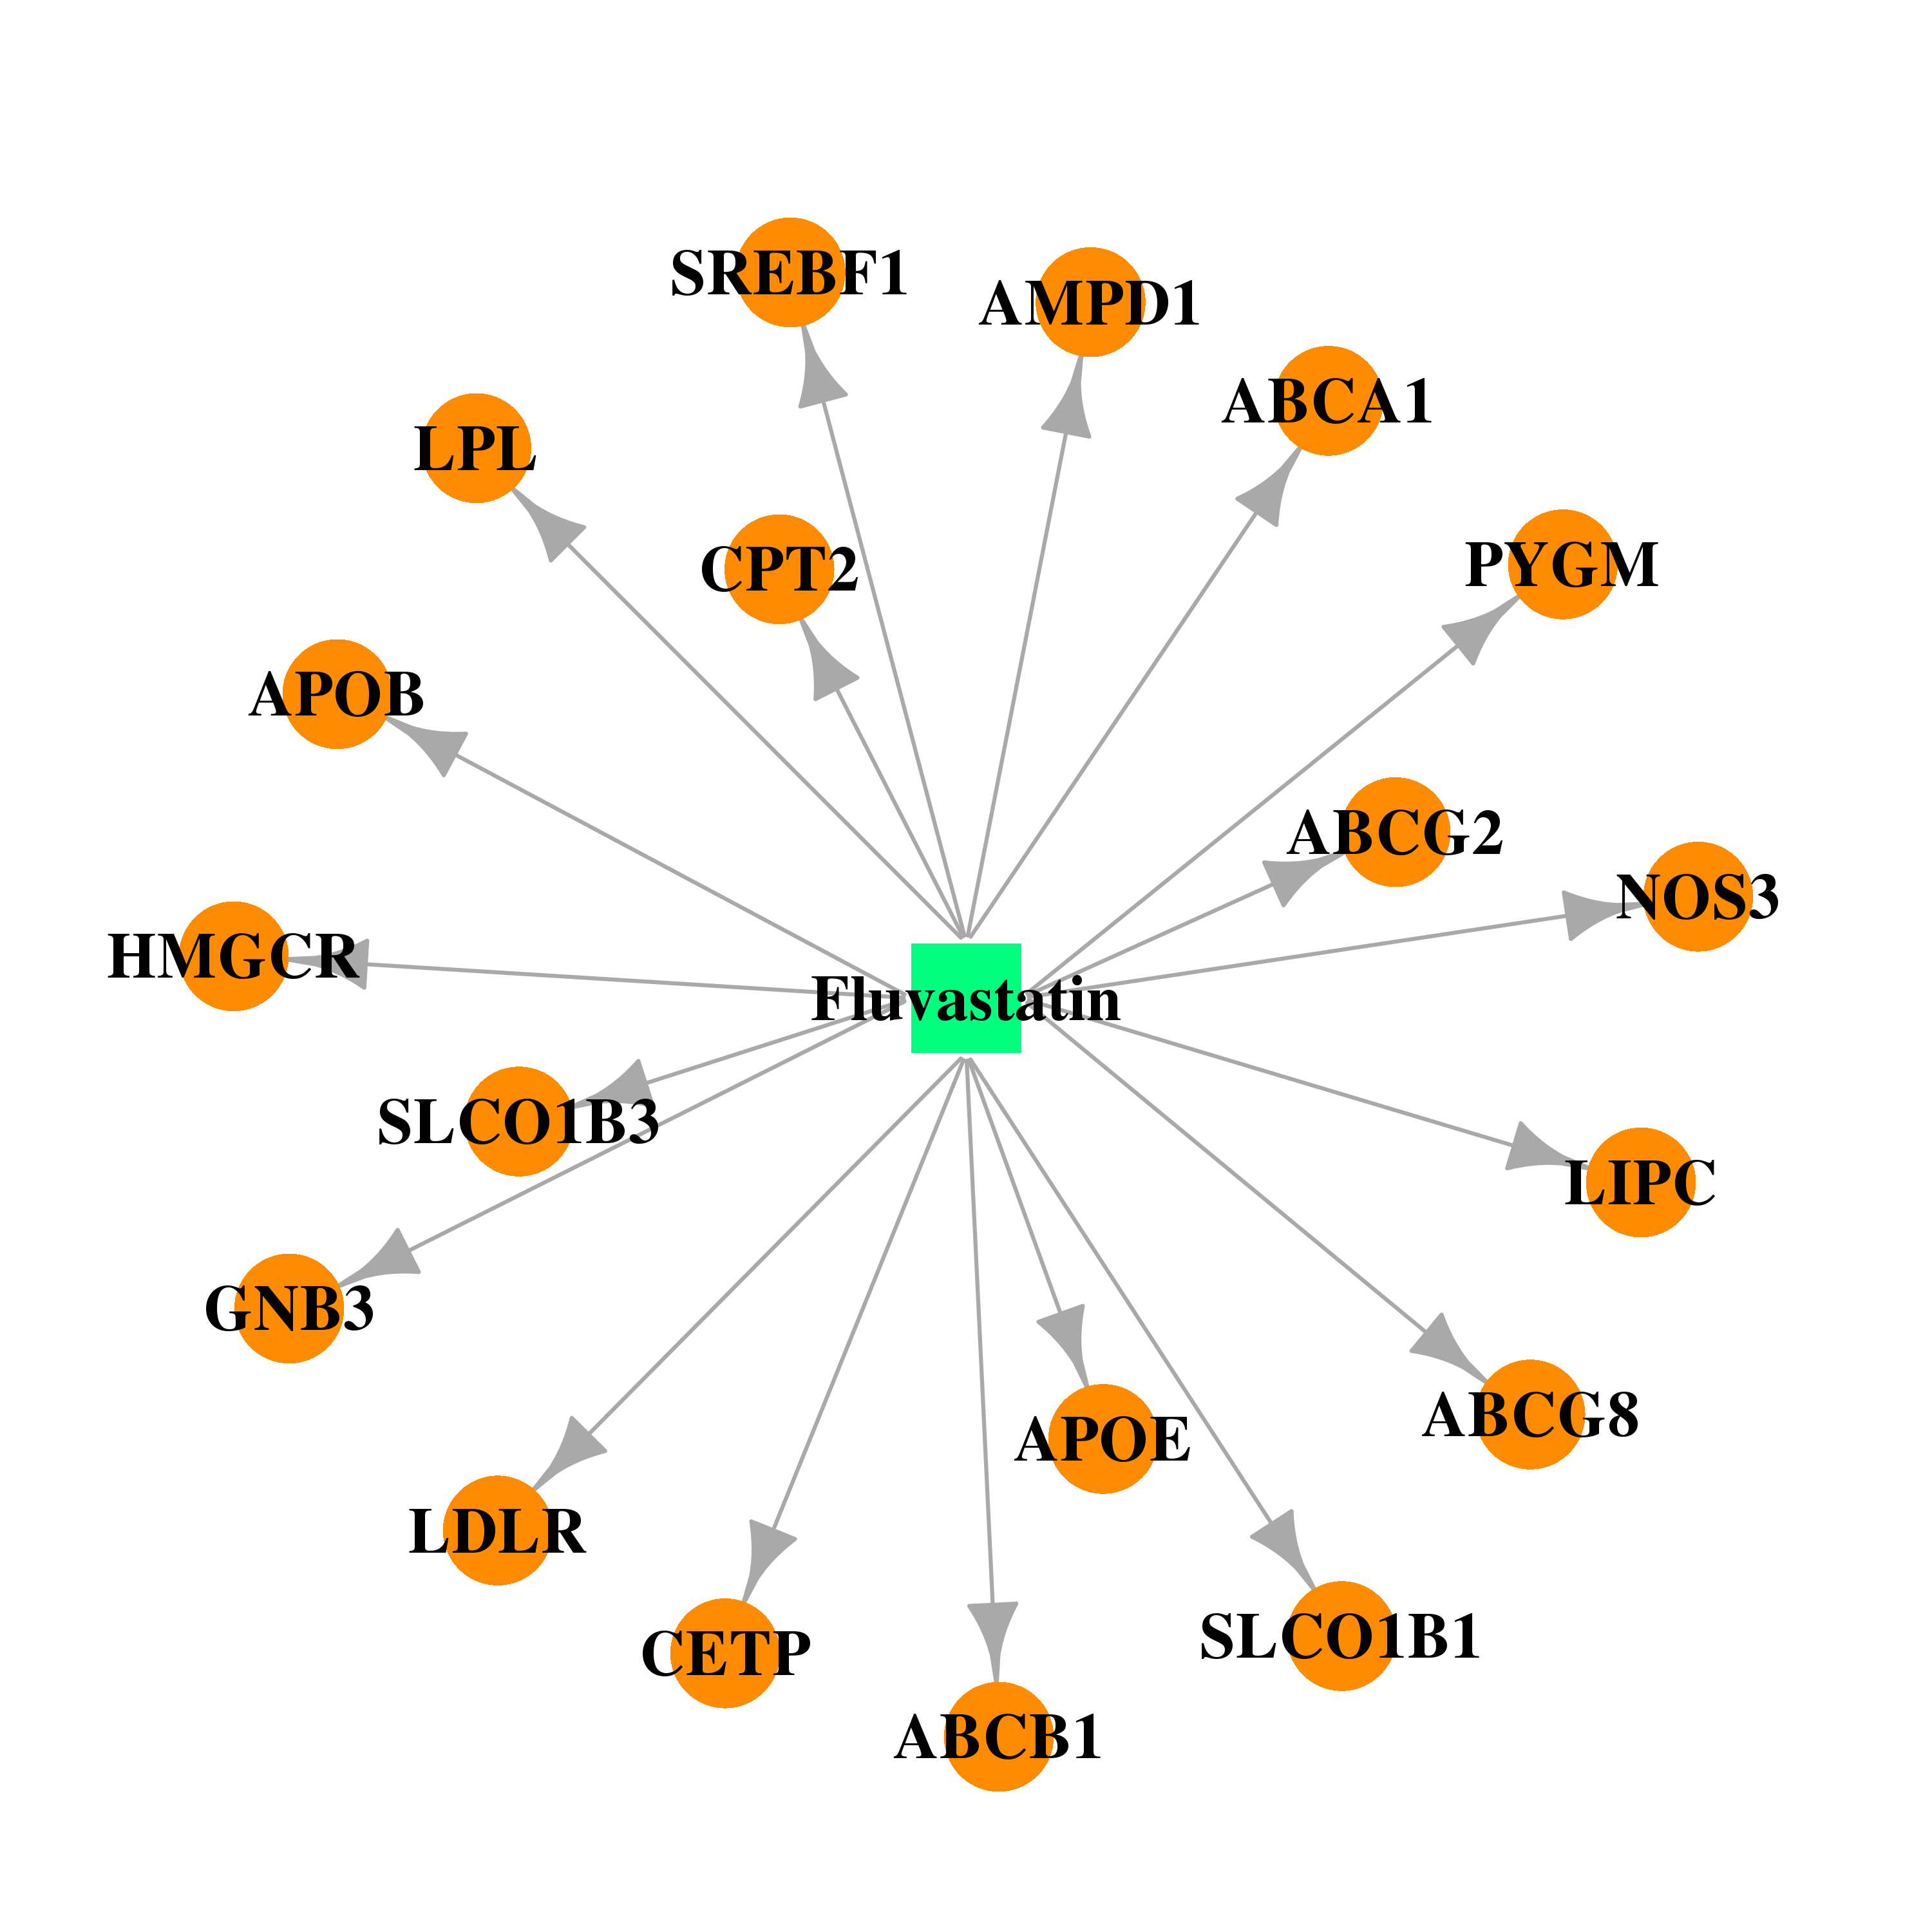 |  |
| DB00175 | carnitine palmitoyltransferase 2 | approved | Pravastatin | 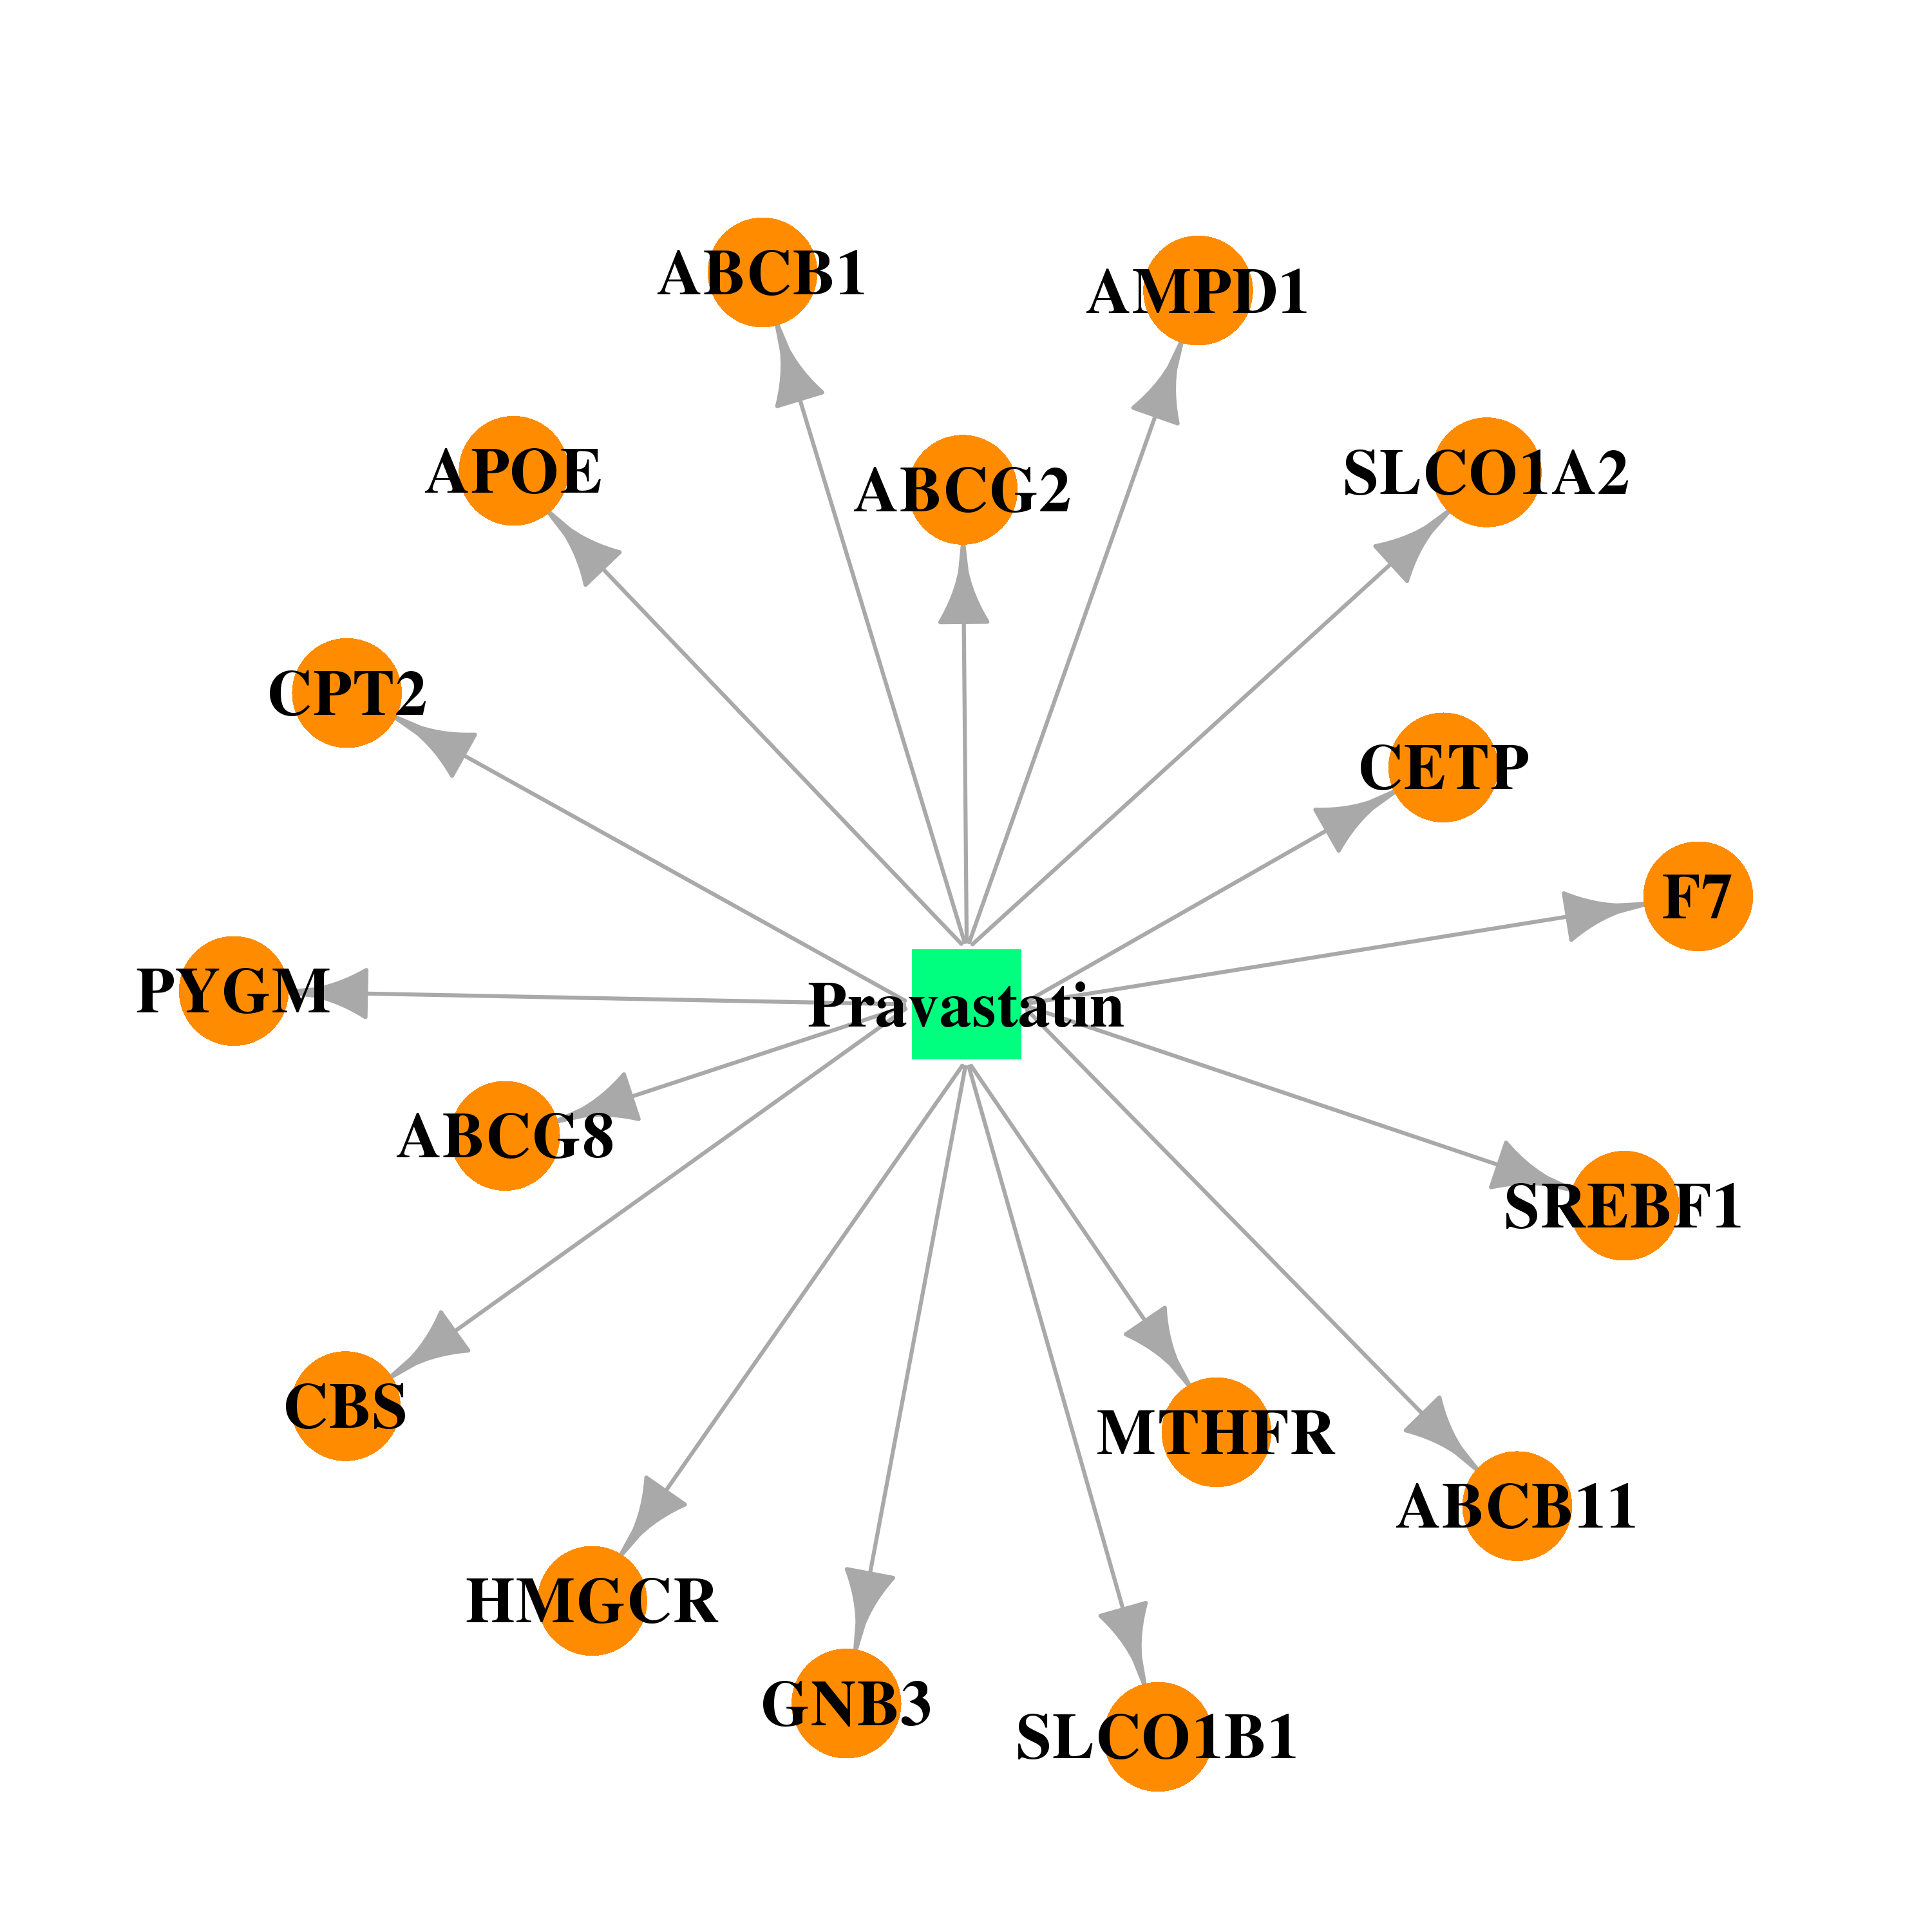 |  |
| DB01098 | carnitine palmitoyltransferase 2 | approved | Rosuvastatin | 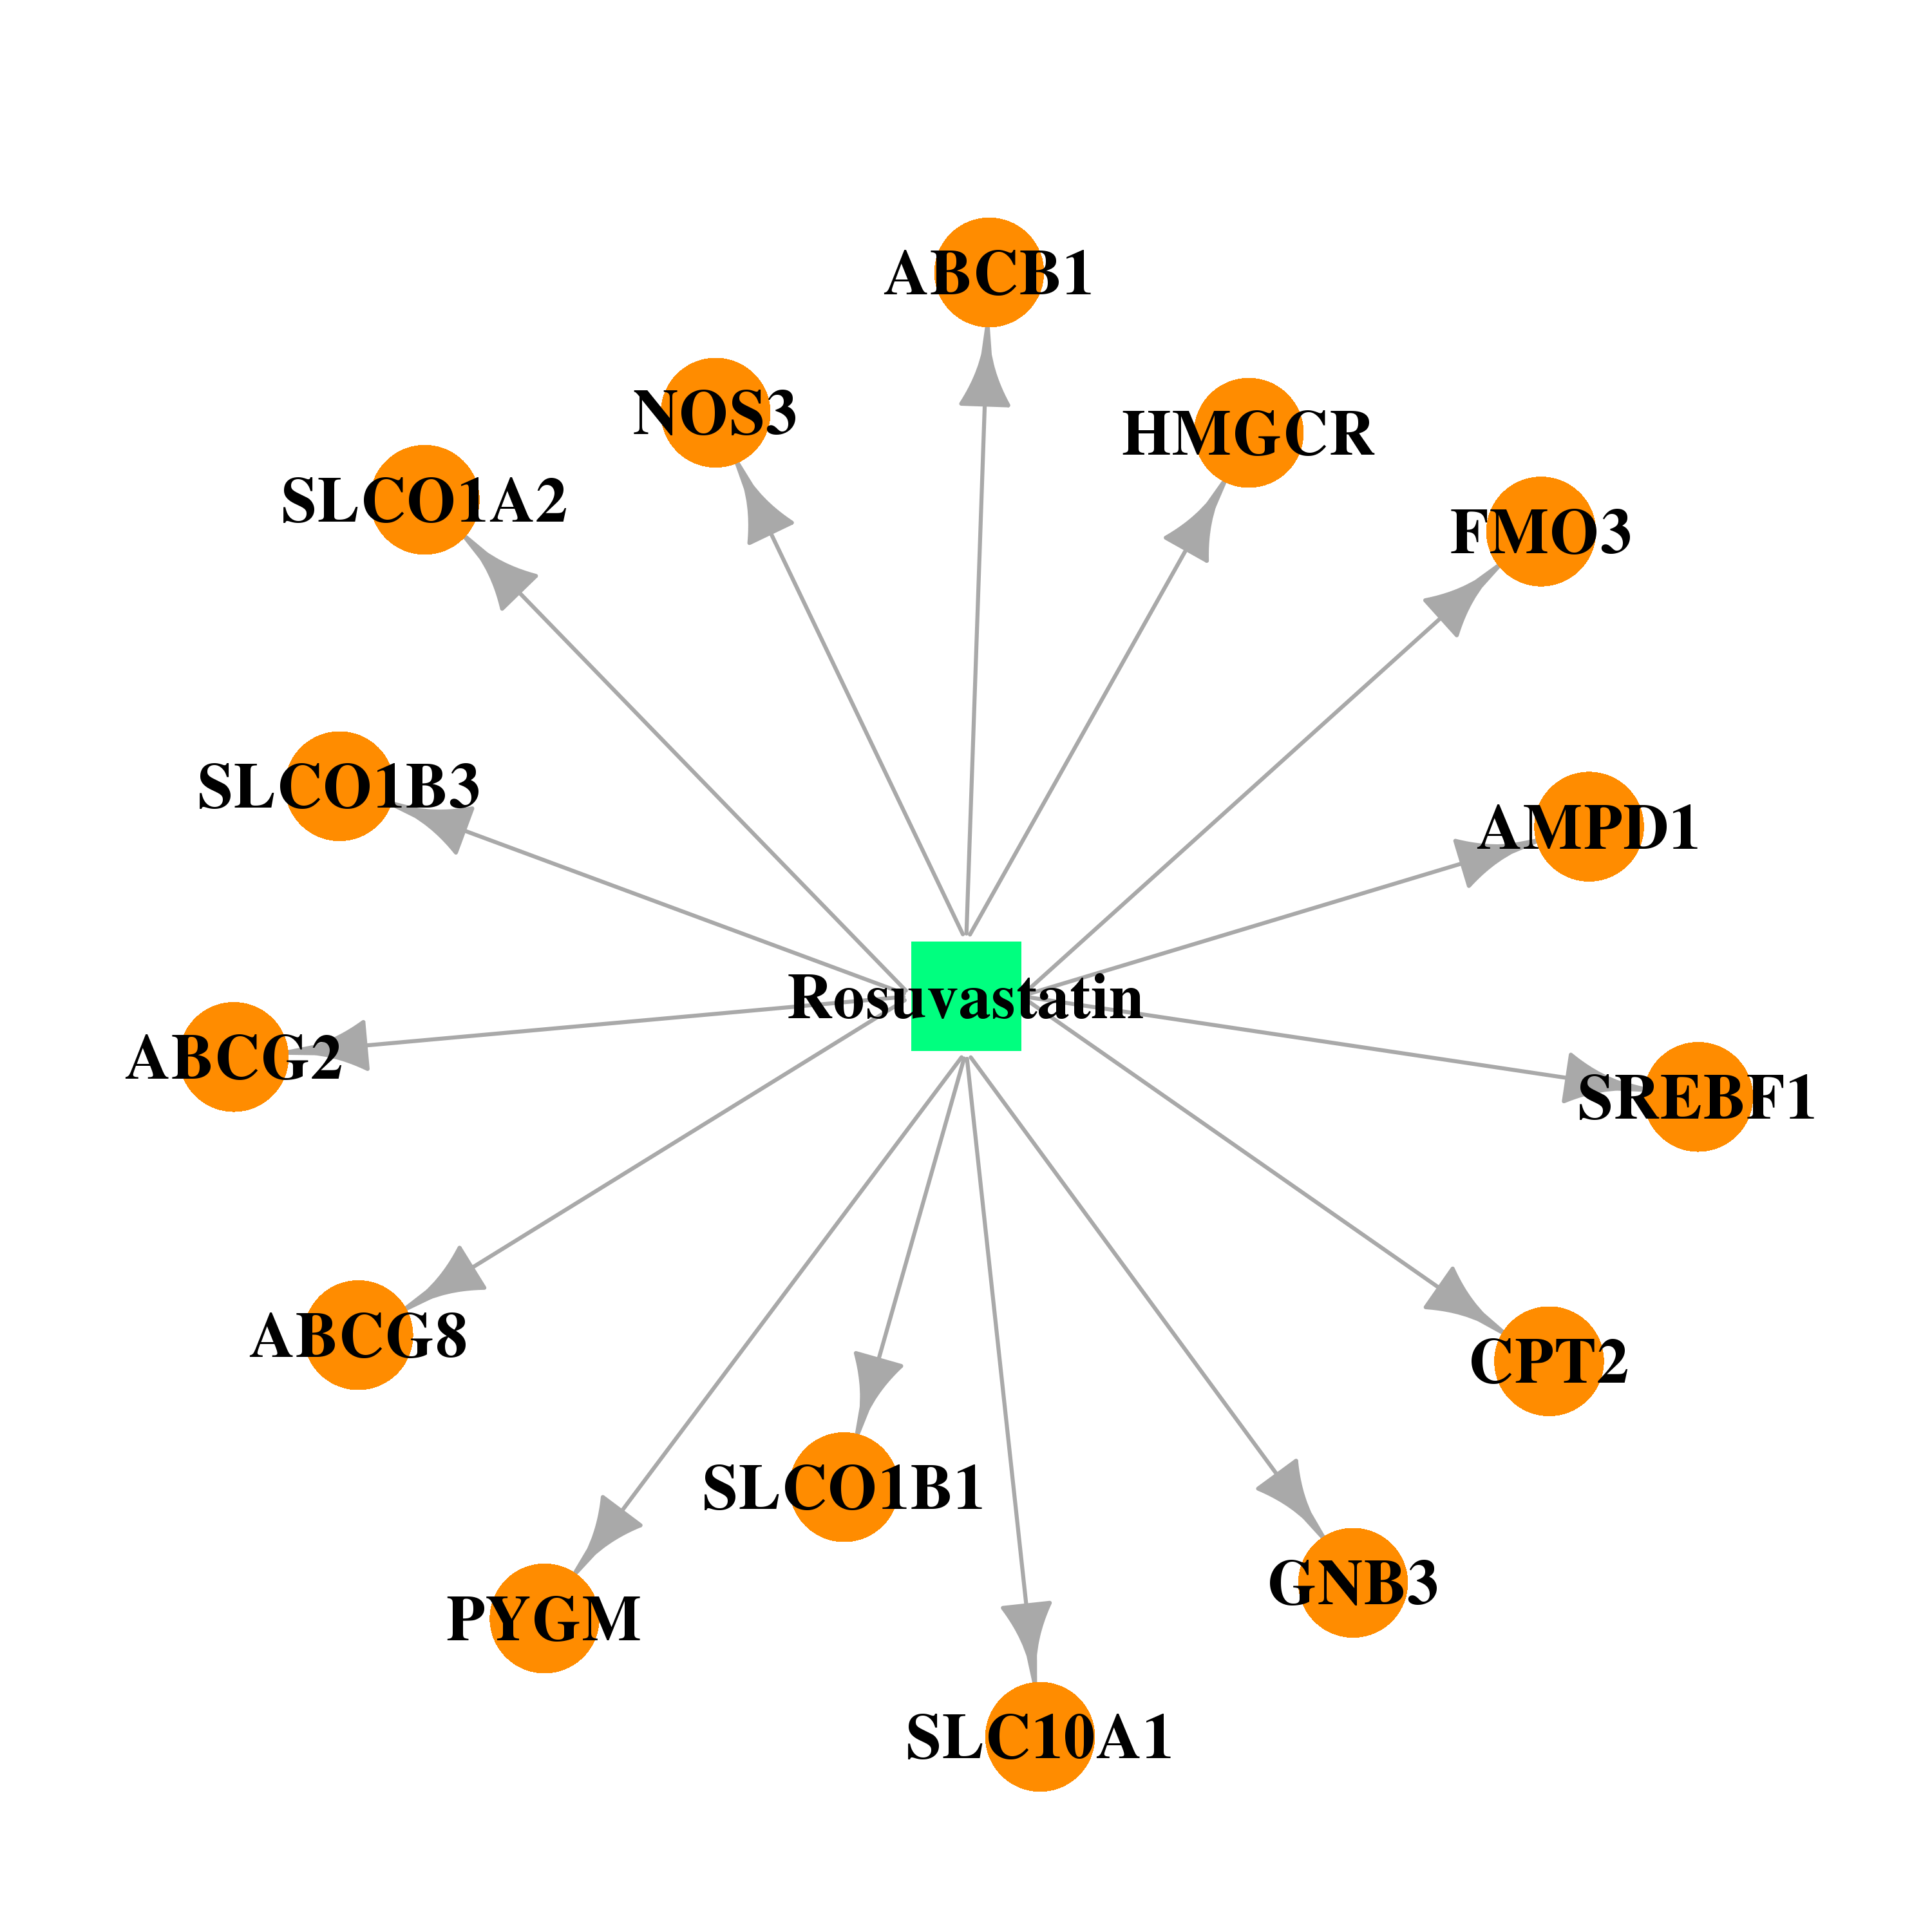 | 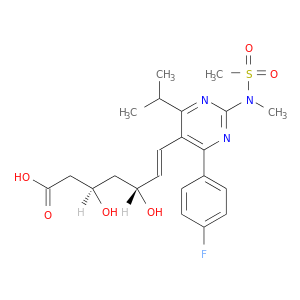 |
| DB00641 | carnitine palmitoyltransferase 2 | approved | Simvastatin | 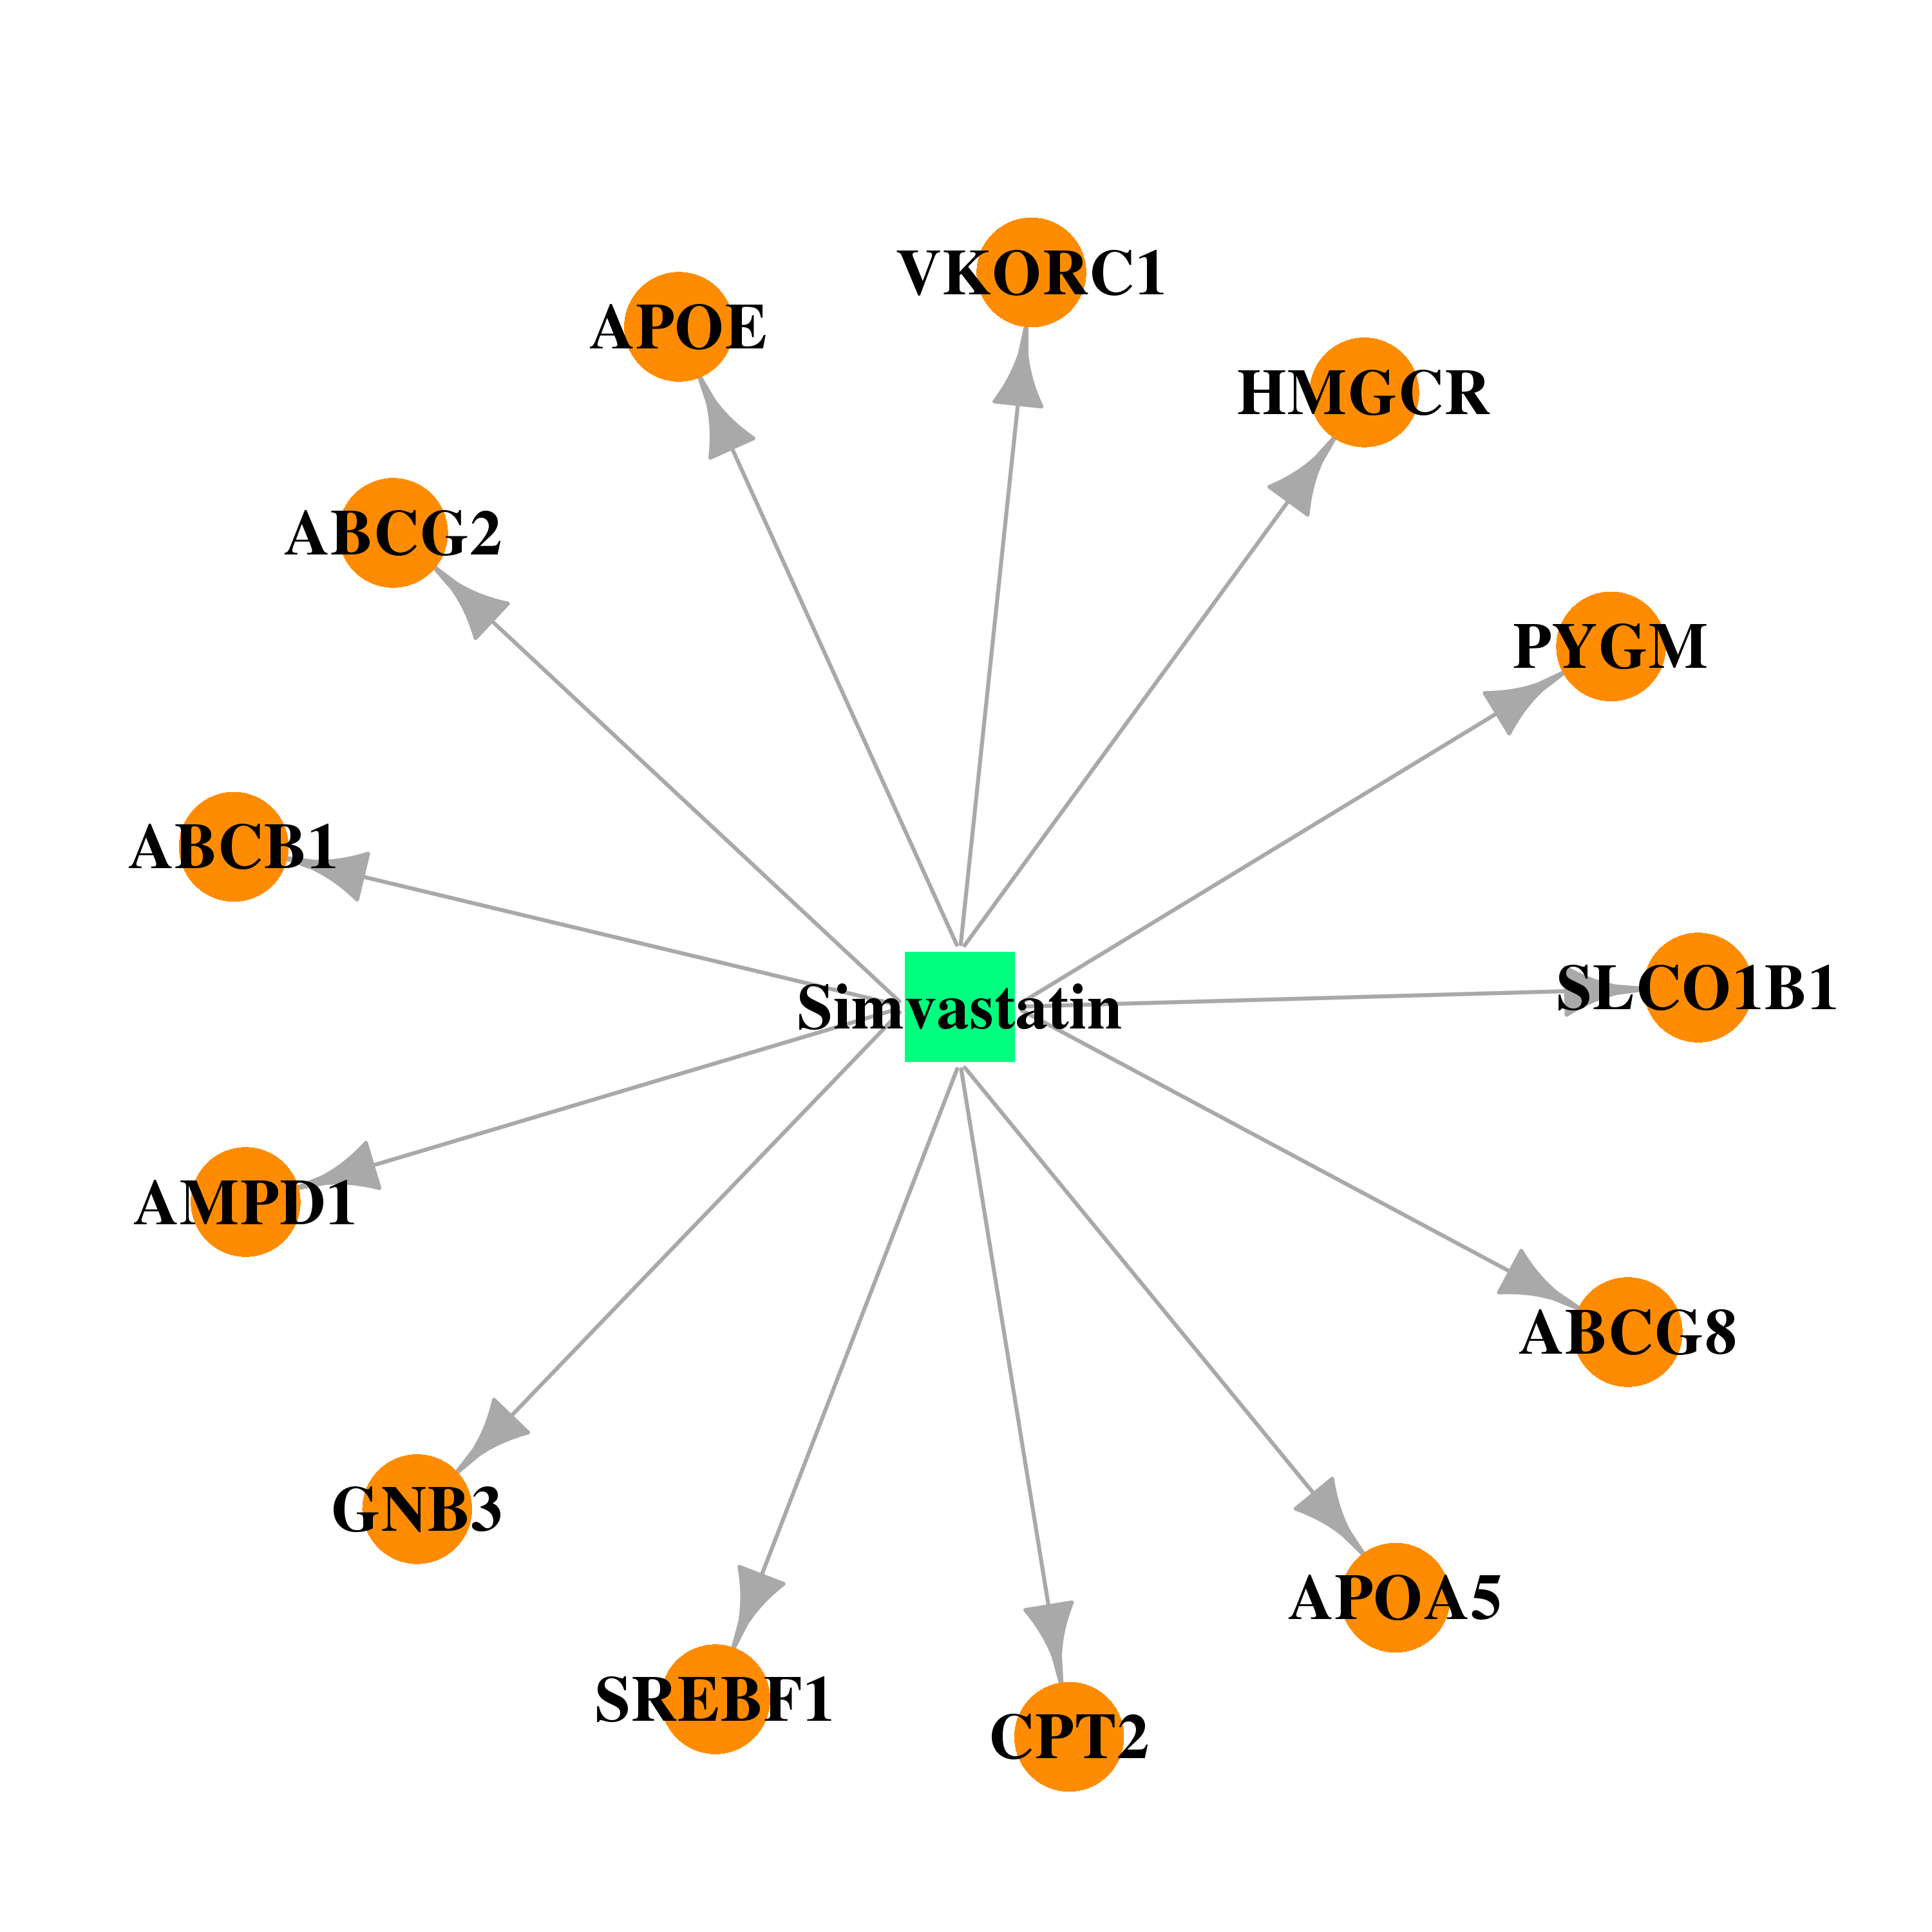 |  |
| Top |
| Cross referenced IDs for CPT2 |
| * We obtained these cross-references from Uniprot database. It covers 150 different DBs, 18 categories. http://www.uniprot.org/help/cross_references_section |
: Open all cross reference information
|
Copyright © 2016-Present - The Univsersity of Texas Health Science Center at Houston @ |