|
||||||||||||||||||||
| |
| Phenotypic Information (metabolism pathway, cancer, disease, phenome) |
| |
| |
| Gene-Gene Network Information: Co-Expression Network, Interacting Genes & KEGG |
| |
|


| Gene Summary for MUC15 |
| Basic gene info. | Gene symbol | MUC15 |
| Gene name | mucin 15, cell surface associated | |
| Synonyms | MUC-15|PAS3|PASIII | |
| Cytomap | UCSC genome browser: 11p14.3 | |
| Genomic location | chr11 :26580578-26593815 | |
| Type of gene | protein-coding | |
| RefGenes | NM_001135091.1, NM_001135092.1,NM_145650.3, | |
| Ensembl id | ENSG00000169550 | |
| Description | mucin-15 | |
| Modification date | 20141207 | |
| dbXrefs | MIM : 608566 | |
| HGNC : HGNC | ||
| Ensembl : ENSG00000169550 | ||
| HPRD : 16349 | ||
| Vega : OTTHUMG00000166112 | ||
| Protein | UniProt: go to UniProt's Cross Reference DB Table | |
| Expression | CleanEX: HS_MUC15 | |
| BioGPS: 143662 | ||
| Gene Expression Atlas: ENSG00000169550 | ||
| The Human Protein Atlas: ENSG00000169550 | ||
| Pathway | NCI Pathway Interaction Database: MUC15 | |
| KEGG: MUC15 | ||
| REACTOME: MUC15 | ||
| ConsensusPathDB | ||
| Pathway Commons: MUC15 | ||
| Metabolism | MetaCyc: MUC15 | |
| HUMANCyc: MUC15 | ||
| Regulation | Ensembl's Regulation: ENSG00000169550 | |
| miRBase: chr11 :26,580,578-26,593,815 | ||
| TargetScan: NM_001135091 | ||
| cisRED: ENSG00000169550 | ||
| Context | iHOP: MUC15 | |
| cancer metabolism search in PubMed: MUC15 | ||
| UCL Cancer Institute: MUC15 | ||
| Assigned class in ccmGDB | C | |
| Top |
| Phenotypic Information for MUC15(metabolism pathway, cancer, disease, phenome) |
| Cancer | CGAP: MUC15 |
| Familial Cancer Database: MUC15 | |
| * This gene is included in those cancer gene databases. |
|
|
|
|
|
| . | ||||||||||||||
Oncogene 1 | Significant driver gene in | |||||||||||||||||||
| cf) number; DB name 1 Oncogene; http://nar.oxfordjournals.org/content/35/suppl_1/D721.long, 2 Tumor Suppressor gene; https://bioinfo.uth.edu/TSGene/, 3 Cancer Gene Census; http://www.nature.com/nrc/journal/v4/n3/abs/nrc1299.html, 4 CancerGenes; http://nar.oxfordjournals.org/content/35/suppl_1/D721.long, 5 Network of Cancer Gene; http://ncg.kcl.ac.uk/index.php, 1Therapeutic Vulnerabilities in Cancer; http://cbio.mskcc.org/cancergenomics/statius/ |
| REACTOME_METABOLISM_OF_PROTEINS | |
| OMIM | |
| Orphanet | |
| Disease | KEGG Disease: MUC15 |
| MedGen: MUC15 (Human Medical Genetics with Condition) | |
| ClinVar: MUC15 | |
| Phenotype | MGI: MUC15 (International Mouse Phenotyping Consortium) |
| PhenomicDB: MUC15 | |
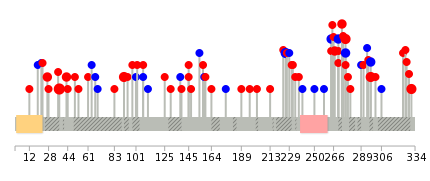
| Mutations for MUC15 |
| * Under tables are showing count per each tissue to give us broad intuition about tissue specific mutation patterns.You can go to the detailed page for each mutation database's web site. |
| There's no structural variation information in COSMIC data for this gene. |
| * From mRNA Sanger sequences, Chitars2.0 arranged chimeric transcripts. This table shows MUC15 related fusion information. |
| ID | Head Gene | Tail Gene | Accession | Gene_a | qStart_a | qEnd_a | Chromosome_a | tStart_a | tEnd_a | Gene_a | qStart_a | qEnd_a | Chromosome_a | tStart_a | tEnd_a |
| Top |
| There's no copy number variation information in COSMIC data for this gene. |
| Top |
|
 |
| Top |
| Stat. for Non-Synonymous SNVs (# total SNVs=46) | (# total SNVs=18) |
 |  |
(# total SNVs=0) | (# total SNVs=0) |
| Top |
| * When you move the cursor on each content, you can see more deailed mutation information on the Tooltip. Those are primary_site,primary_histology,mutation(aa),pubmedID. |
| GRCh37 position | Mutation(aa) | Unique sampleID count |
| chr11:26587295-26587295 | p.E37D | 5 |
| chr11:26587134-26587134 | p.S91L | 3 |
| chr11:26584680-26584680 | p.D276G | 3 |
| chr11:26586728-26586728 | p.T226T | 3 |
| chr11:26582728-26582728 | p.G297R | 3 |
| chr11:26582625-26582625 | p.R331H | 3 |
| chr11:26584708-26584708 | p.D267N | 2 |
| chr11:26587327-26587327 | p.Q27K | 2 |
| chr11:26586715-26586715 | p.K231Q | 2 |
| chr11:26584679-26584679 | p.D276D | 2 |
| Top |
|
 |
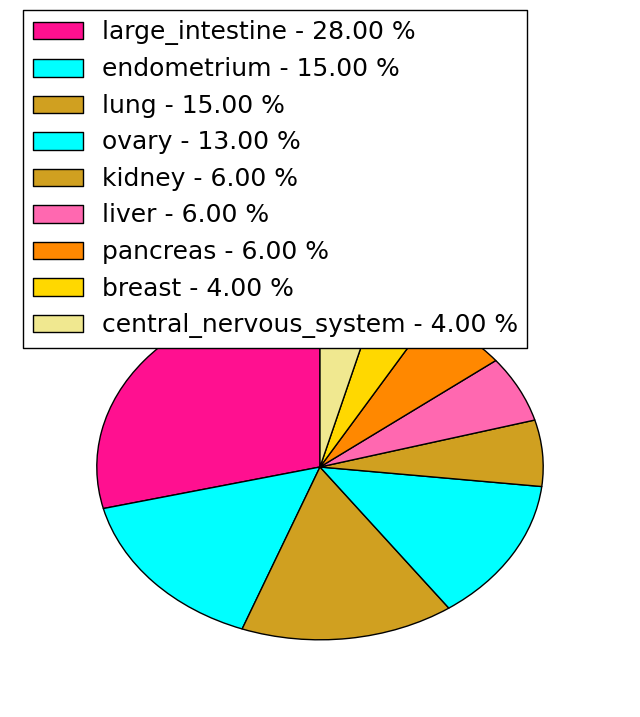
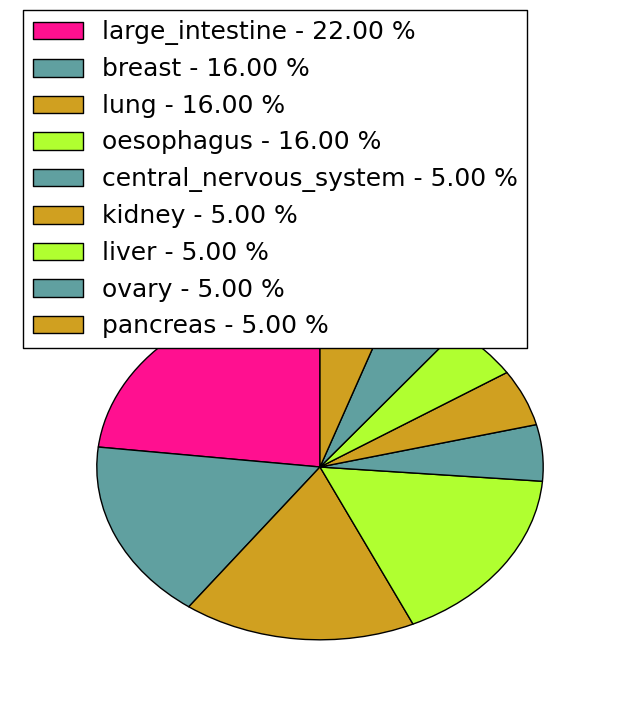
| Point Mutation/ Tissue ID | 1 | 2 | 3 | 4 | 5 | 6 | 7 | 8 | 9 | 10 | 11 | 12 | 13 | 14 | 15 | 16 | 17 | 18 | 19 | 20 |
| # sample | 4 | 3 | 9 | 2 | 2 | 8 | 2 | 2 | 14 | 5 | 6 | |||||||||
| # mutation | 3 | 3 | 7 | 2 | 2 | 8 | 2 | 2 | 15 | 5 | 7 | |||||||||
| nonsynonymous SNV | 1 | 1 | 6 | 2 | 1 | 6 | 1 | 1 | 10 | 3 | 7 | |||||||||
| synonymous SNV | 2 | 2 | 1 | 1 | 2 | 1 | 1 | 5 | 2 |
| cf) Tissue ID; Tissue type (1; BLCA[Bladder Urothelial Carcinoma], 2; BRCA[Breast invasive carcinoma], 3; CESC[Cervical squamous cell carcinoma and endocervical adenocarcinoma], 4; COAD[Colon adenocarcinoma], 5; GBM[Glioblastoma multiforme], 6; Glioma Low Grade, 7; HNSC[Head and Neck squamous cell carcinoma], 8; KICH[Kidney Chromophobe], 9; KIRC[Kidney renal clear cell carcinoma], 10; KIRP[Kidney renal papillary cell carcinoma], 11; LAML[Acute Myeloid Leukemia], 12; LUAD[Lung adenocarcinoma], 13; LUSC[Lung squamous cell carcinoma], 14; OV[Ovarian serous cystadenocarcinoma ], 15; PAAD[Pancreatic adenocarcinoma], 16; PRAD[Prostate adenocarcinoma], 17; SKCM[Skin Cutaneous Melanoma], 18:STAD[Stomach adenocarcinoma], 19:THCA[Thyroid carcinoma], 20:UCEC[Uterine Corpus Endometrial Carcinoma]) |
| Top |
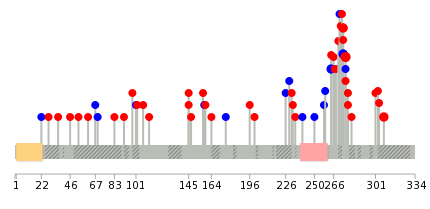
| * We represented just top 10 SNVs. When you move the cursor on each content, you can see more deailed mutation information on the Tooltip. Those are primary_site, primary_histology, mutation(aa), pubmedID. |
| Genomic Position | Mutation(aa) | Unique sampleID count |
| chr11:26584680 | p.D276G,MUC15 | 3 |
| chr11:26582726 | p.R264R,MUC15 | 2 |
| chr11:26582728 | p.G274G,MUC15 | 2 |
| chr11:26586972 | p.G274R,MUC15 | 2 |
| chr11:26584715 | p.S145C,MUC15 | 2 |
| chr11:26582625 | p.R308H,MUC15 | 2 |
| chr11:26587324 | p.S270T,MUC15 | 1 |
| chr11:26584716 | p.T176T,MUC15 | 1 |
| chr11:26586820 | p.N61H,MUC15 | 1 |
| chr11:26582638 | p.D303G,MUC15 | 1 |
| * Copy number data were extracted from TCGA using R package TCGA-Assembler. The URLs of all public data files on TCGA DCC data server were gathered on Jan-05-2015. Function ProcessCNAData in TCGA-Assembler package was used to obtain gene-level copy number value which is calculated as the average copy number of the genomic region of a gene. |
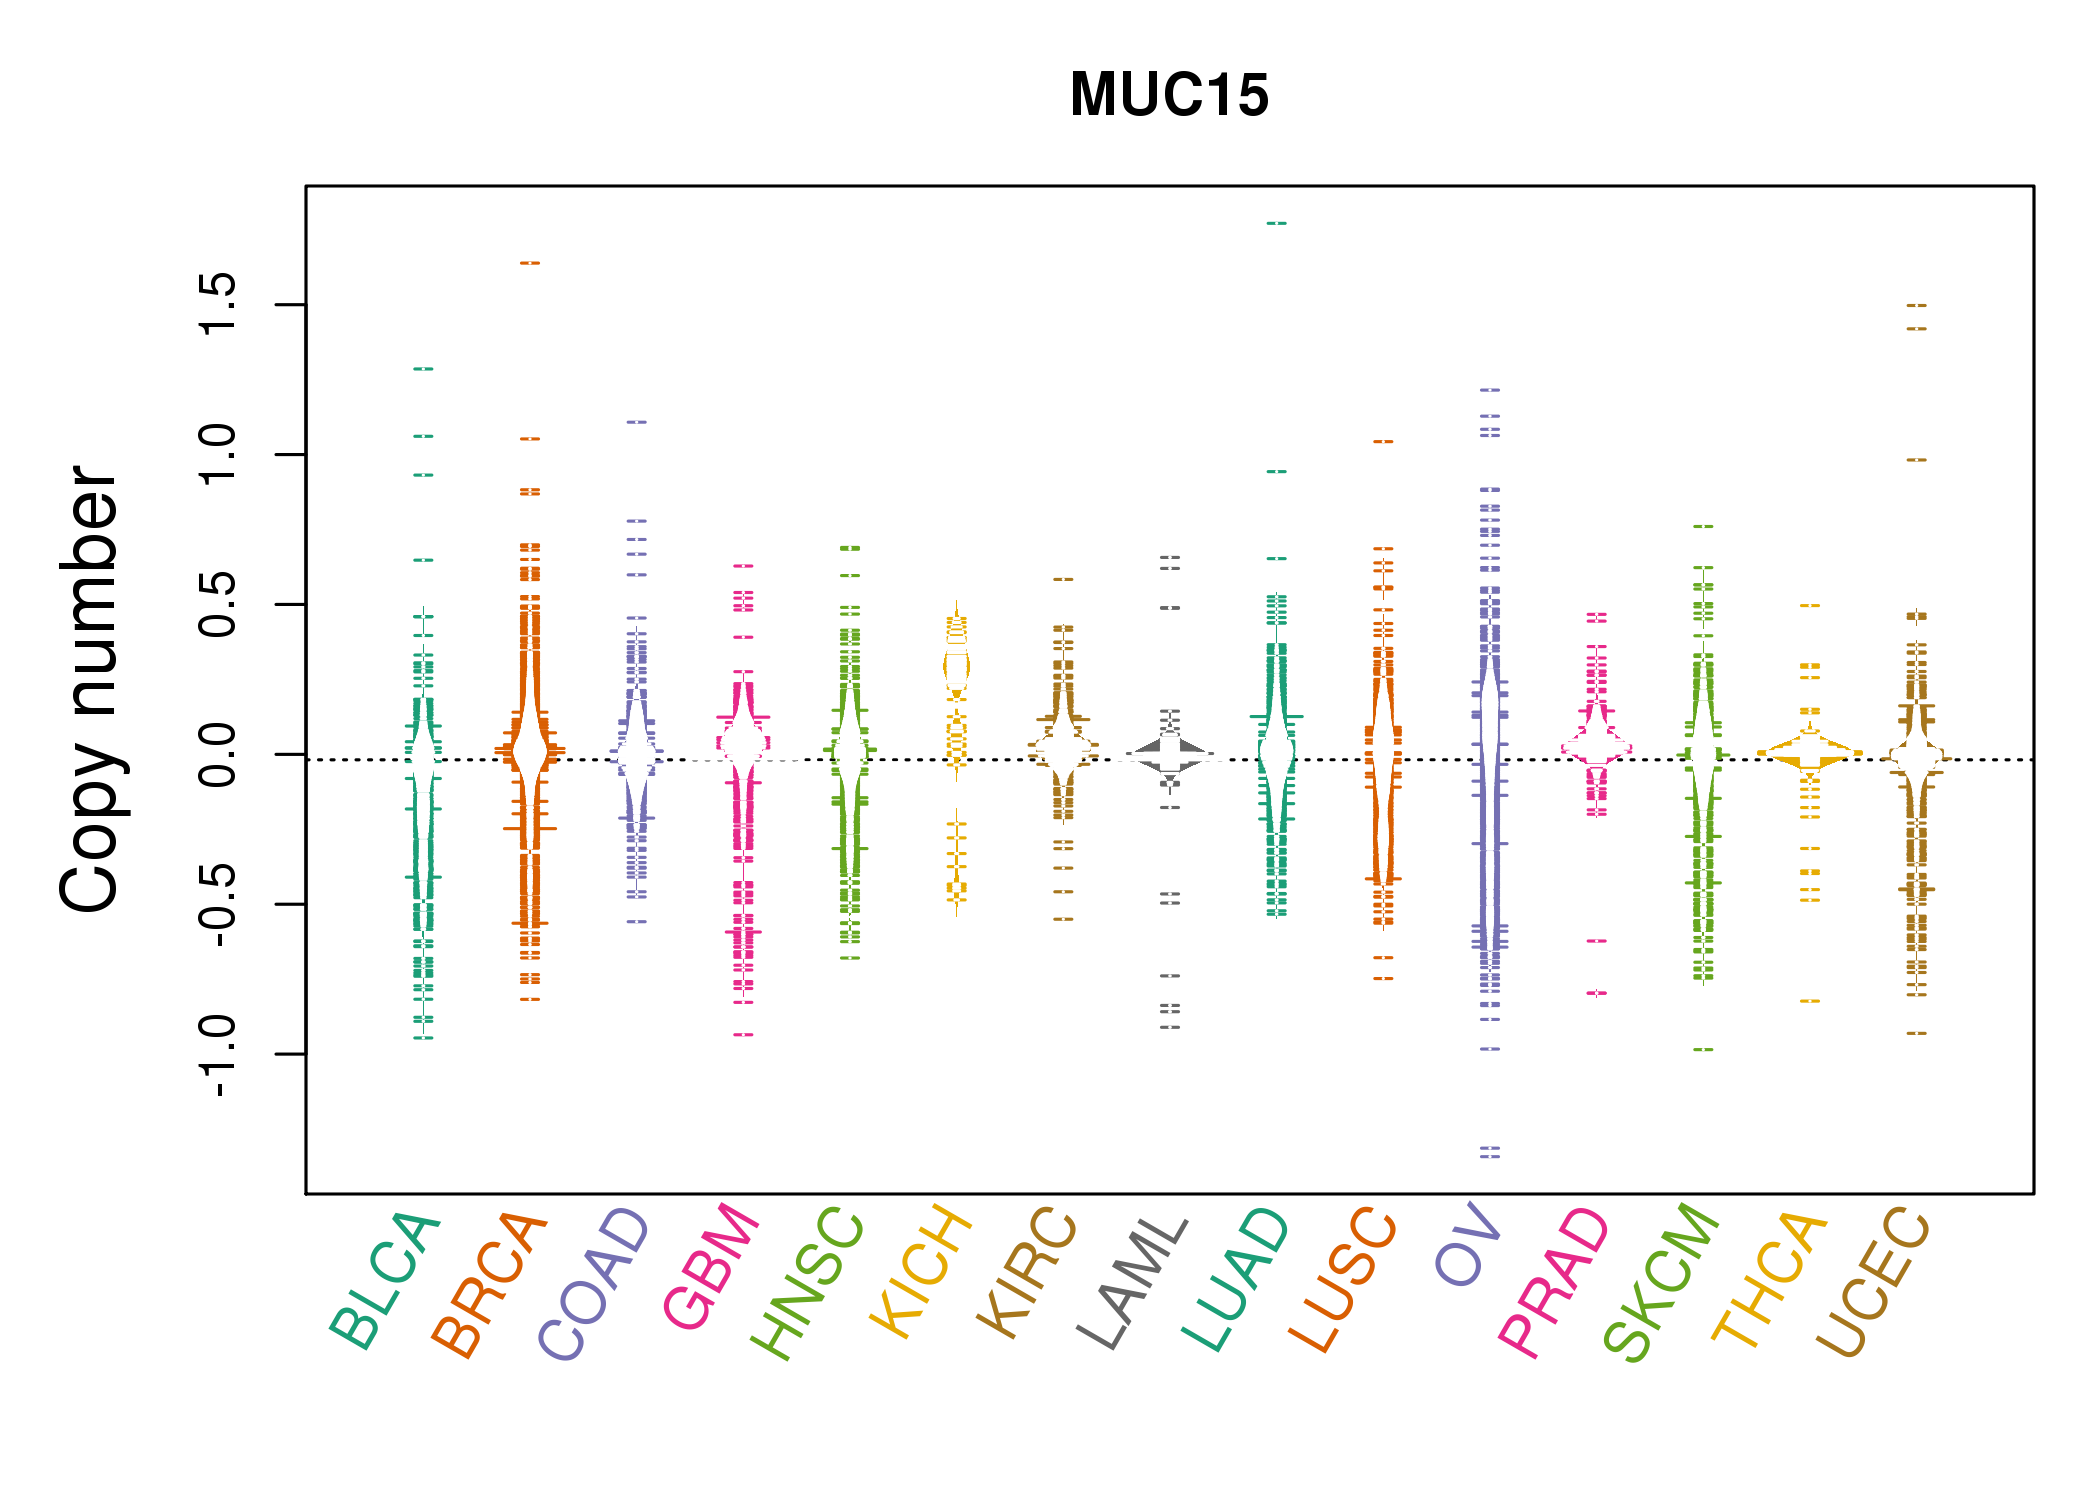 |
| cf) Tissue ID[Tissue type]: BLCA[Bladder Urothelial Carcinoma], BRCA[Breast invasive carcinoma], CESC[Cervical squamous cell carcinoma and endocervical adenocarcinoma], COAD[Colon adenocarcinoma], GBM[Glioblastoma multiforme], Glioma Low Grade, HNSC[Head and Neck squamous cell carcinoma], KICH[Kidney Chromophobe], KIRC[Kidney renal clear cell carcinoma], KIRP[Kidney renal papillary cell carcinoma], LAML[Acute Myeloid Leukemia], LUAD[Lung adenocarcinoma], LUSC[Lung squamous cell carcinoma], OV[Ovarian serous cystadenocarcinoma ], PAAD[Pancreatic adenocarcinoma], PRAD[Prostate adenocarcinoma], SKCM[Skin Cutaneous Melanoma], STAD[Stomach adenocarcinoma], THCA[Thyroid carcinoma], UCEC[Uterine Corpus Endometrial Carcinoma] |
| Top |
| Gene Expression for MUC15 |
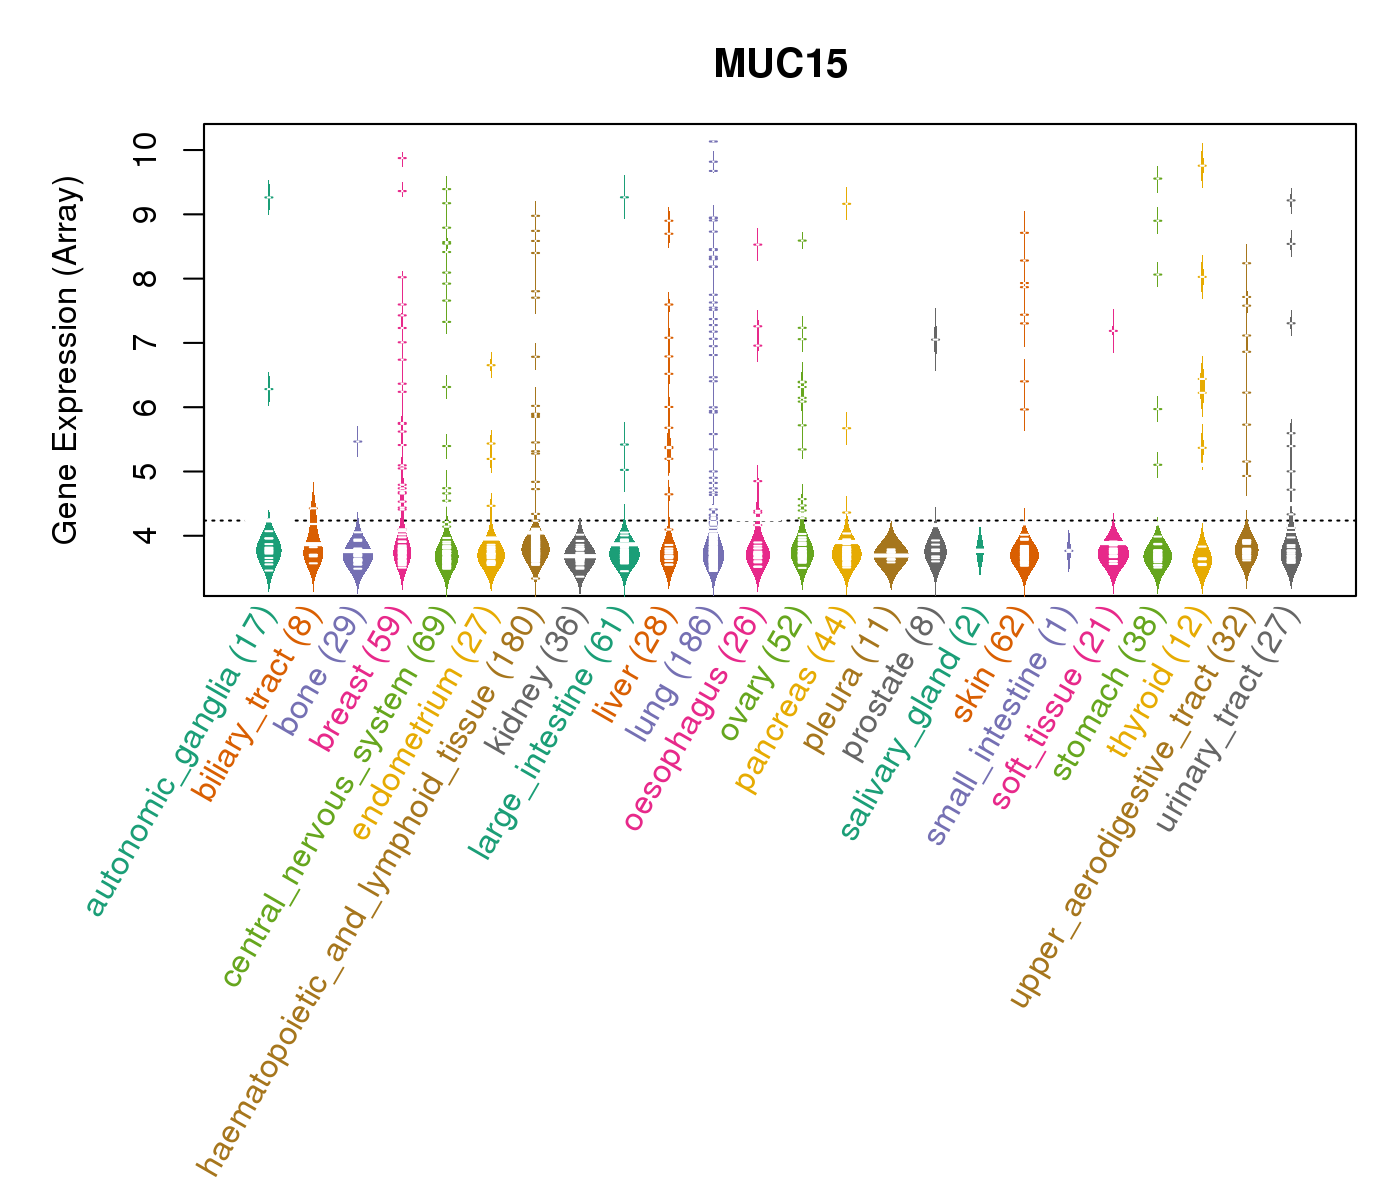
| * CCLE gene expression data were extracted from CCLE_Expression_Entrez_2012-10-18.res: Gene-centric RMA-normalized mRNA expression data. |
 |
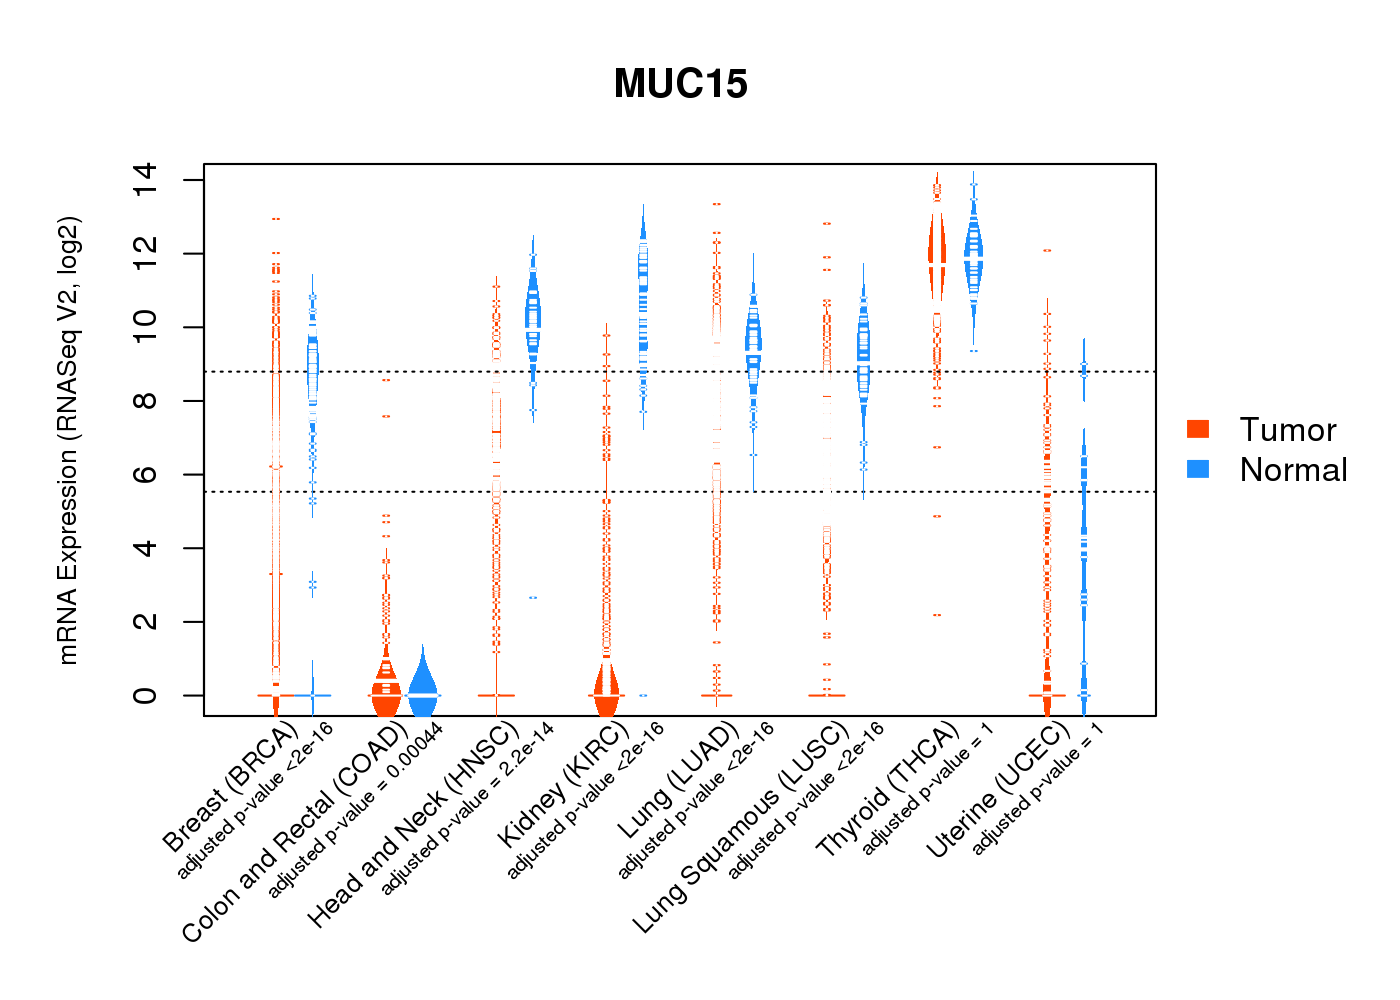
| * Normalized gene expression data of RNASeqV2 was extracted from TCGA using R package TCGA-Assembler. The URLs of all public data files on TCGA DCC data server were gathered at Jan-05-2015. Only eight cancer types have enough normal control samples for differential expression analysis. (t test, adjusted p<0.05 (using Benjamini-Hochberg FDR)) |
 |
| Top |
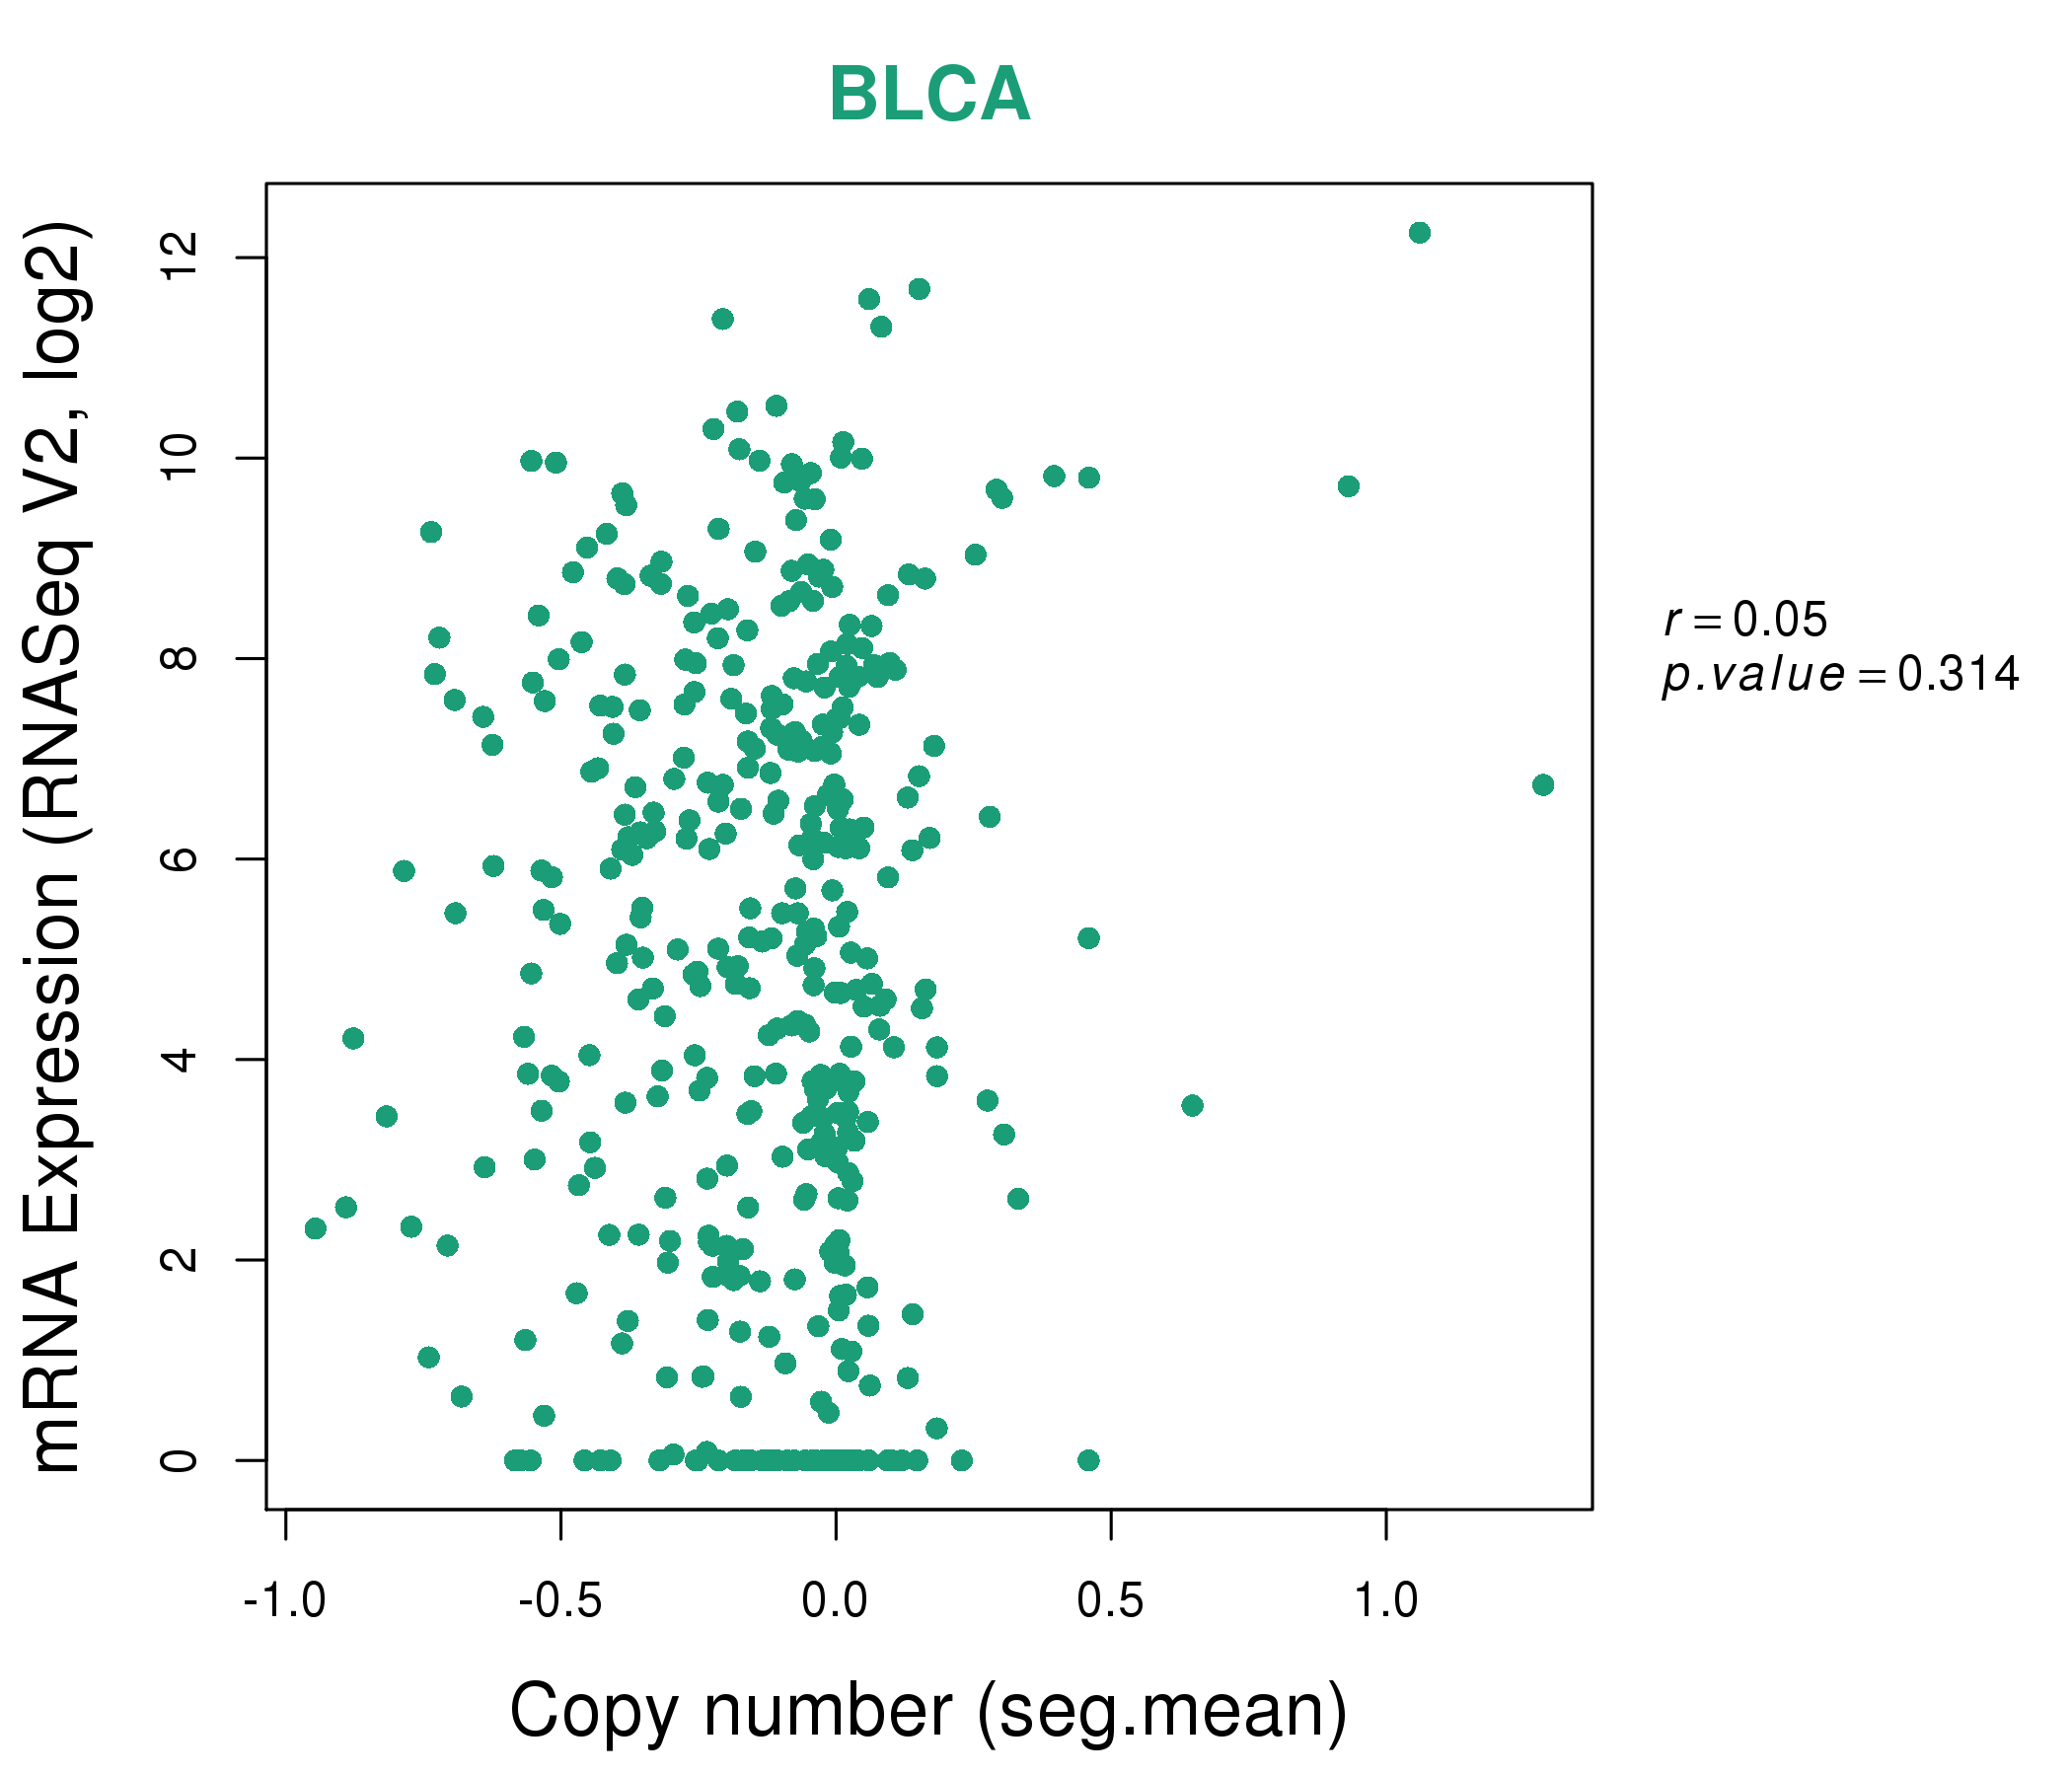
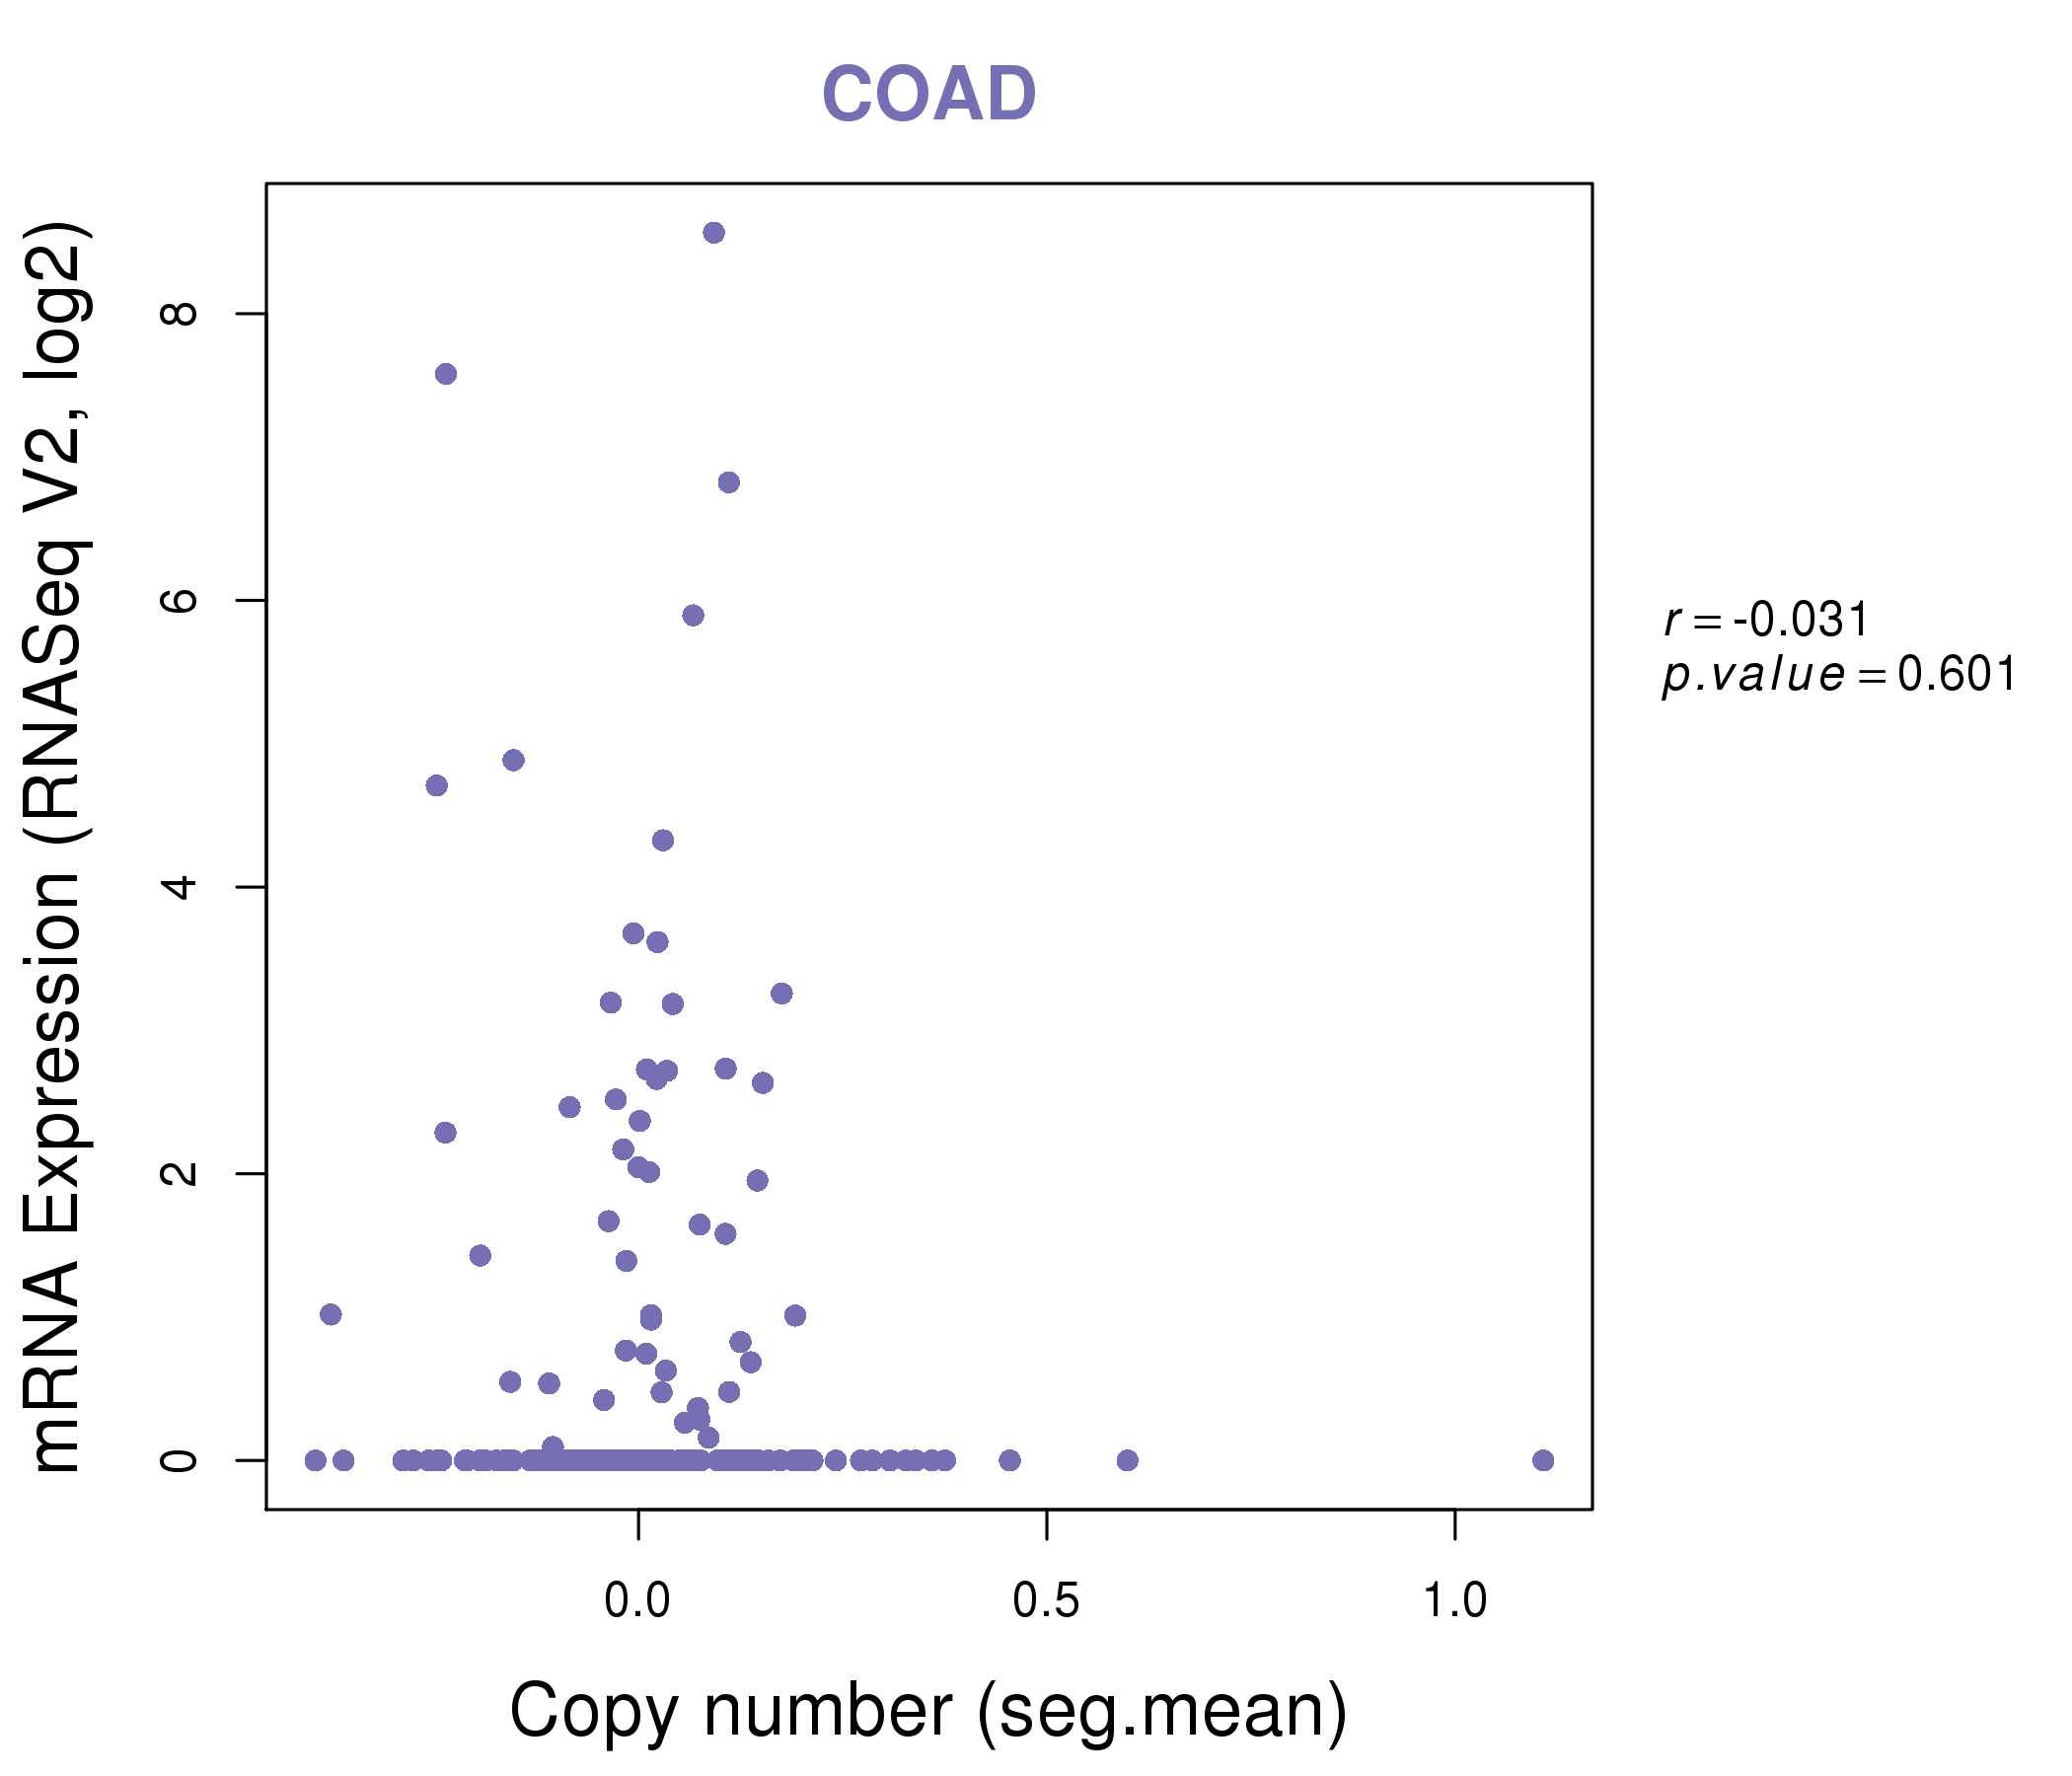
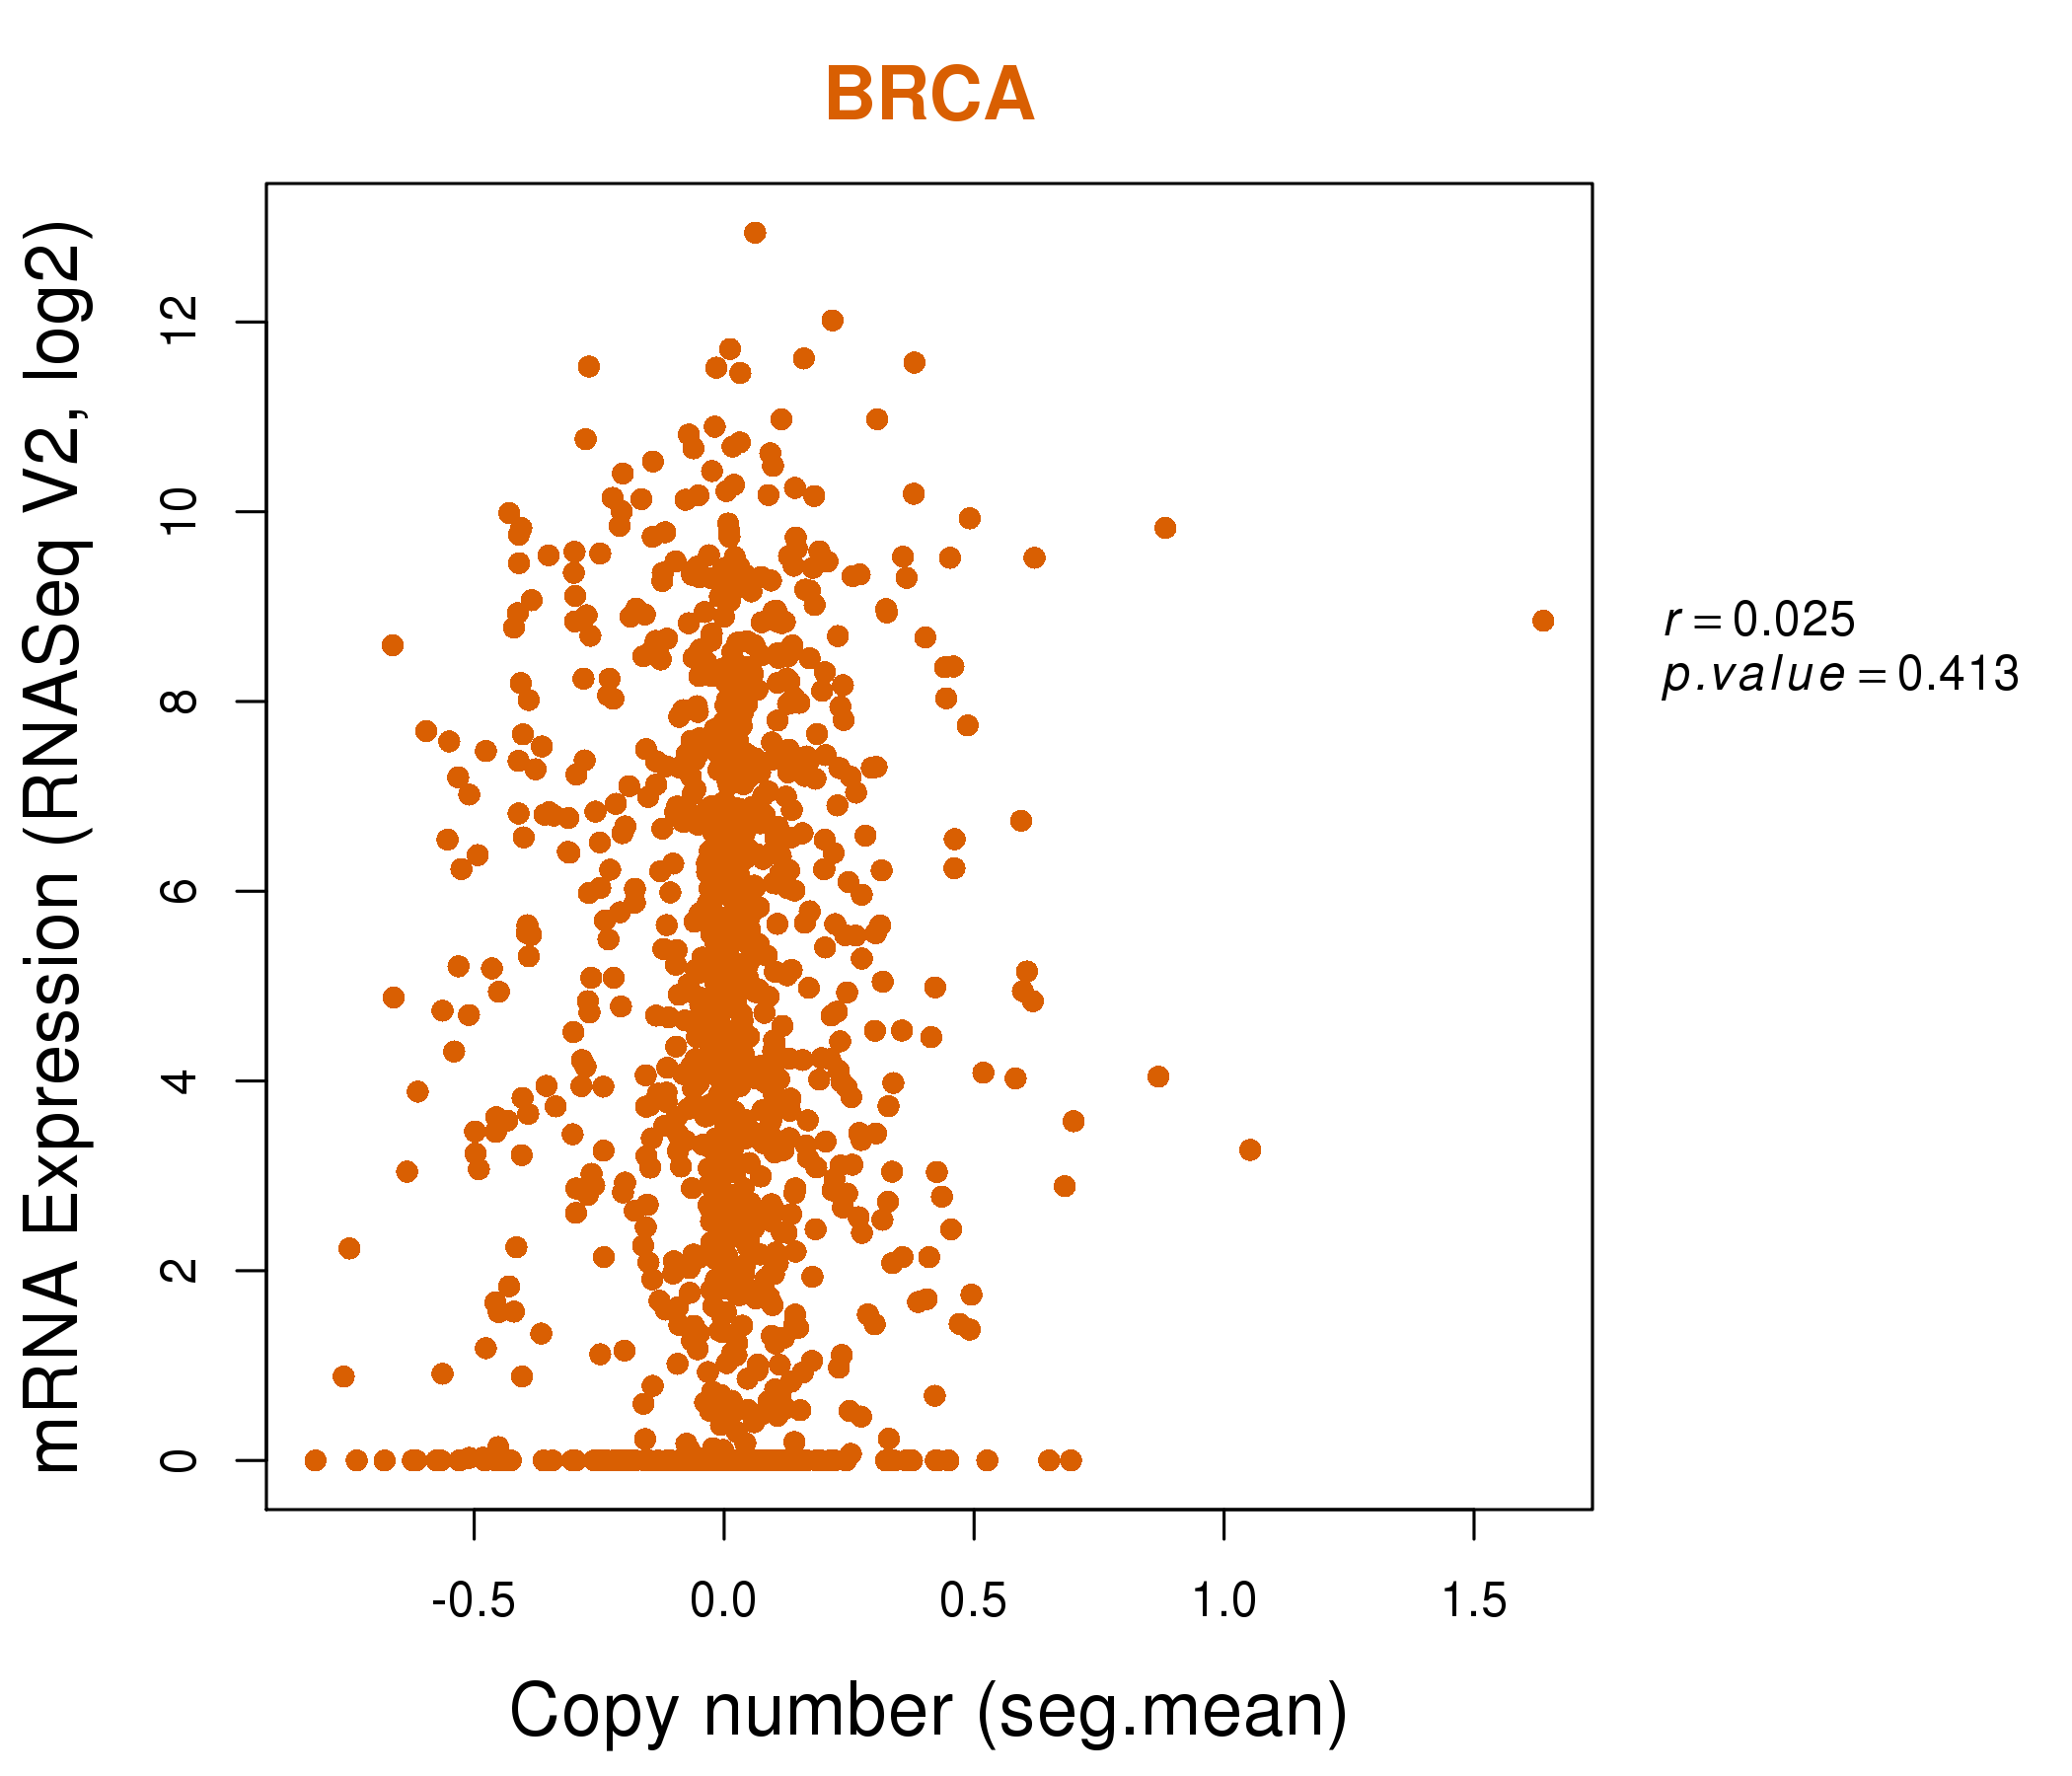
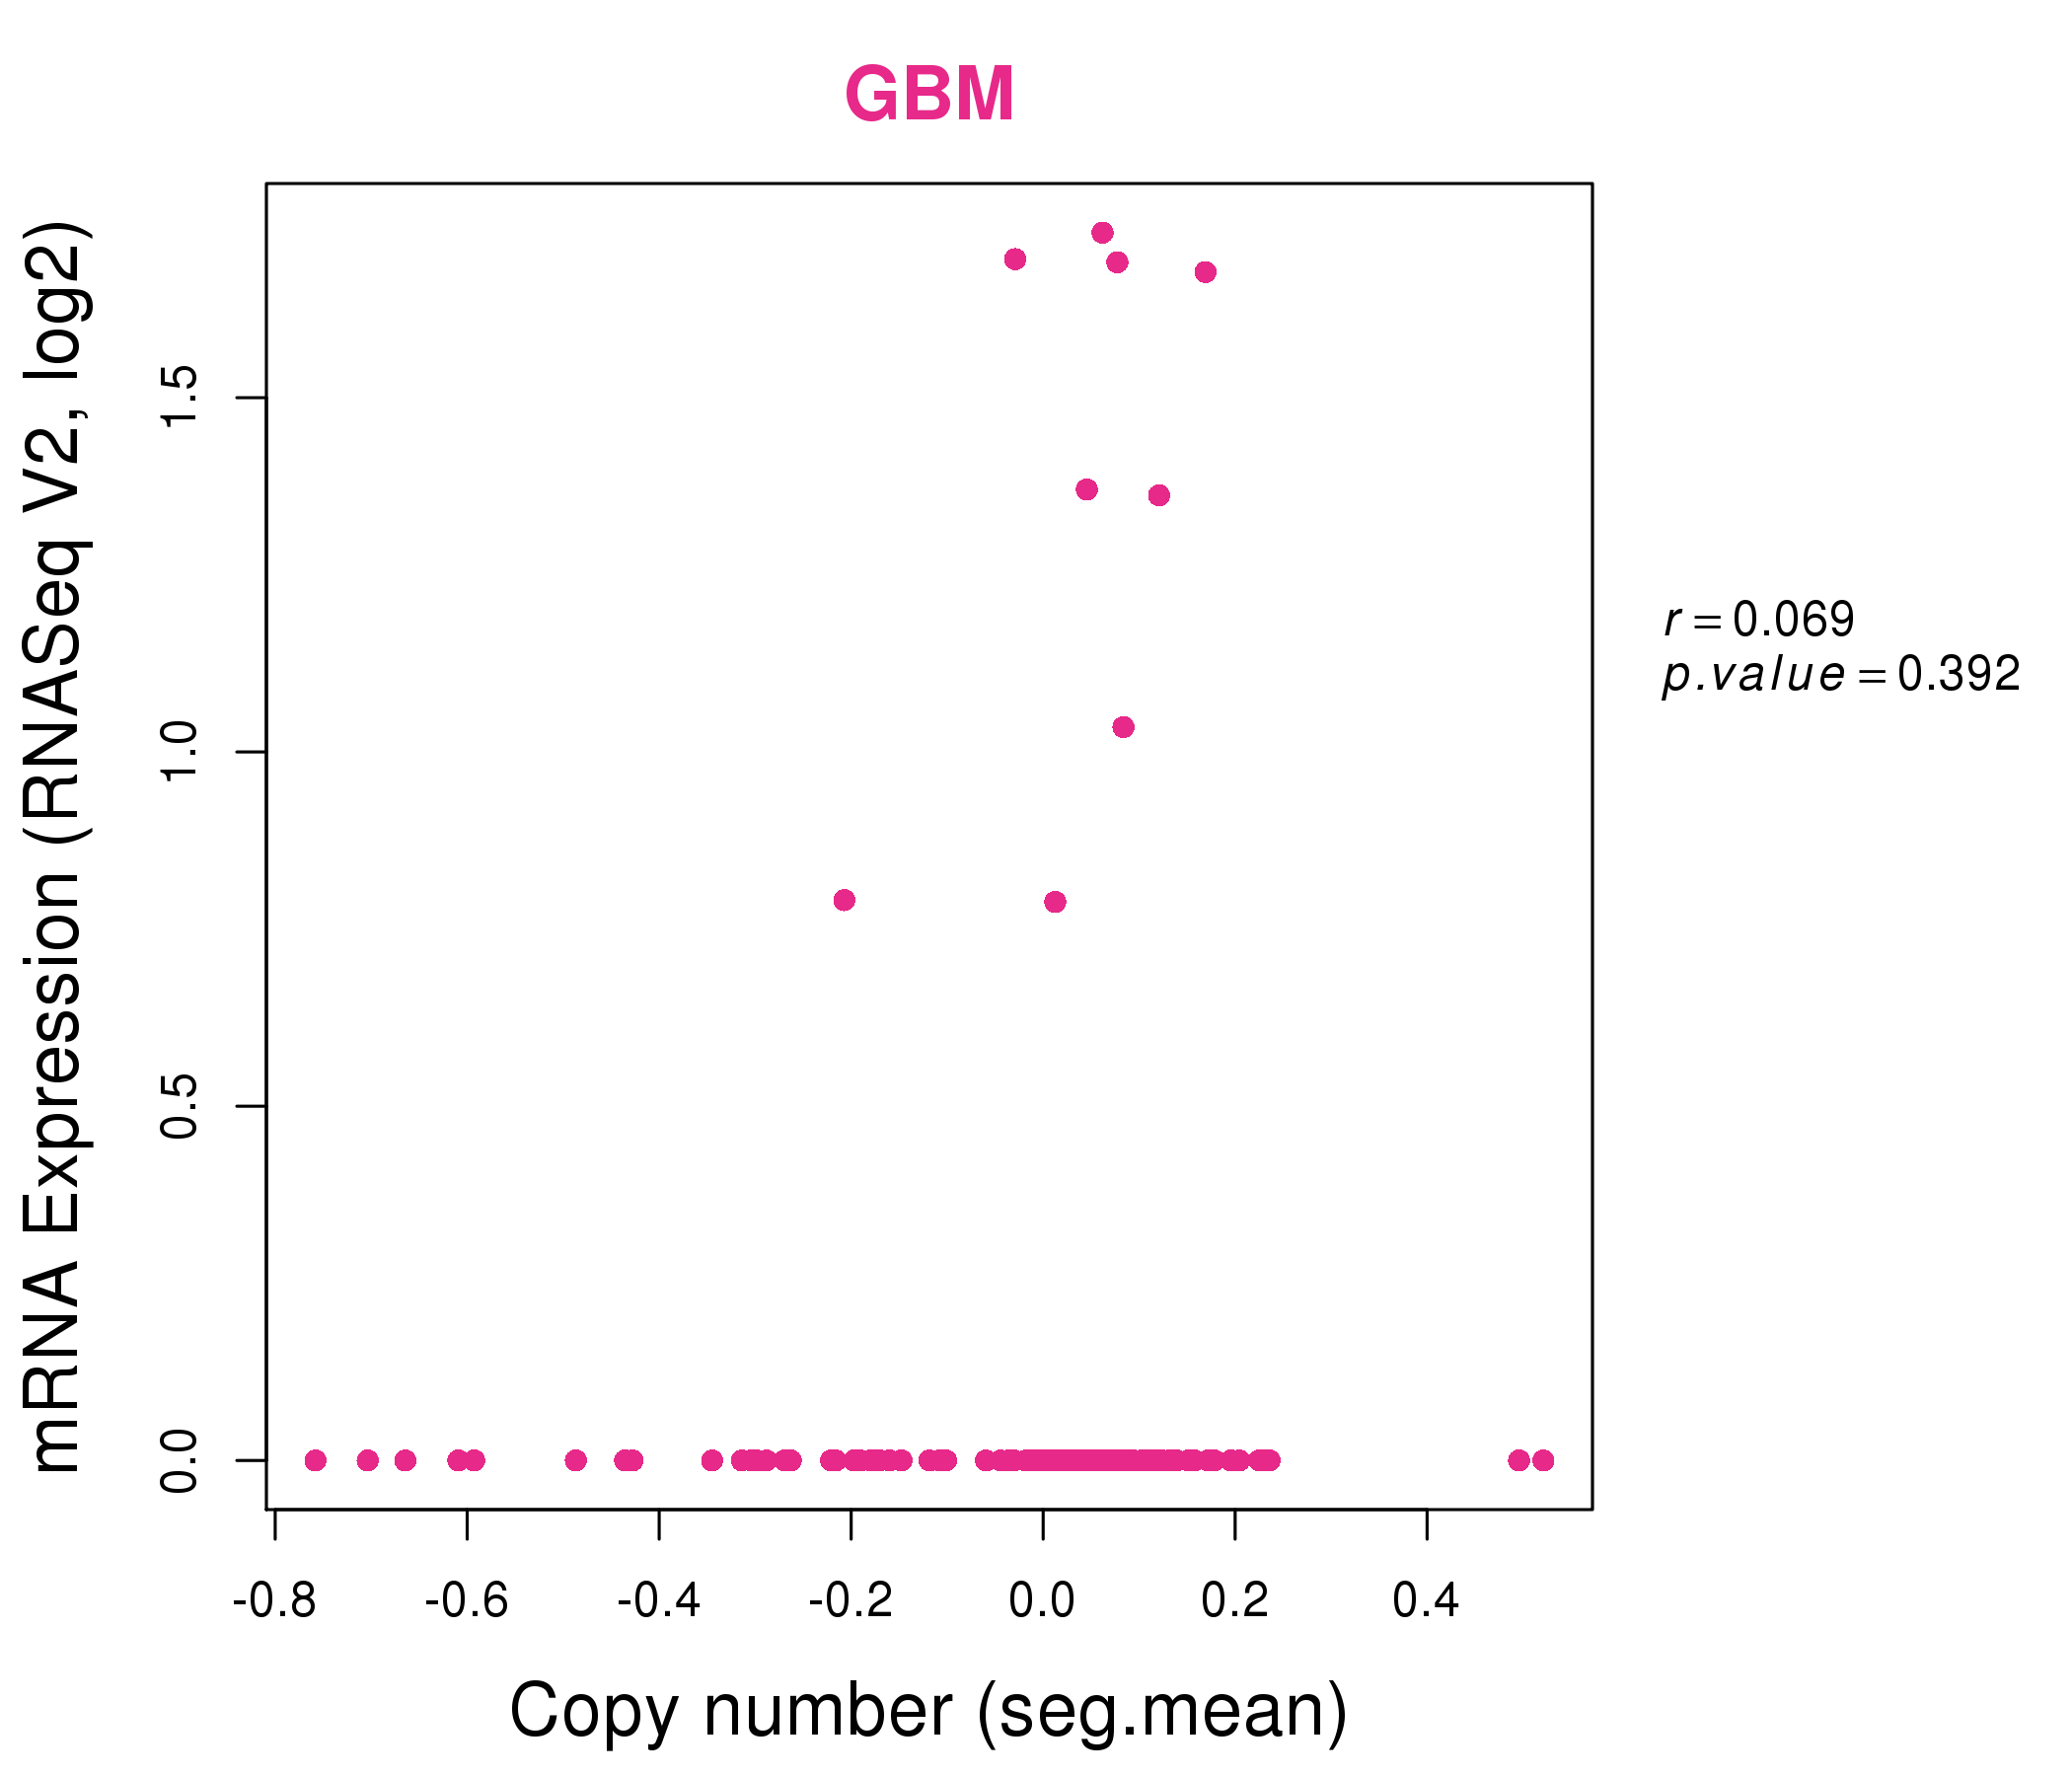
| * This plots show the correlation between CNV and gene expression. |
: Open all plots for all cancer types
 |
|
 |
|
| Top |
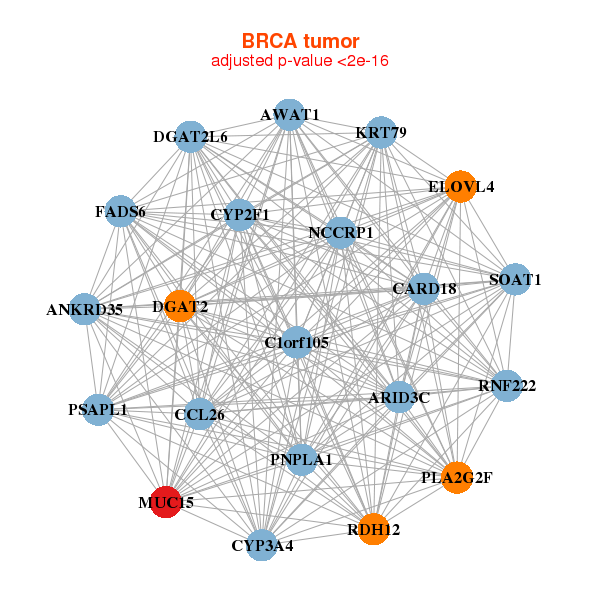
| Gene-Gene Network Information |
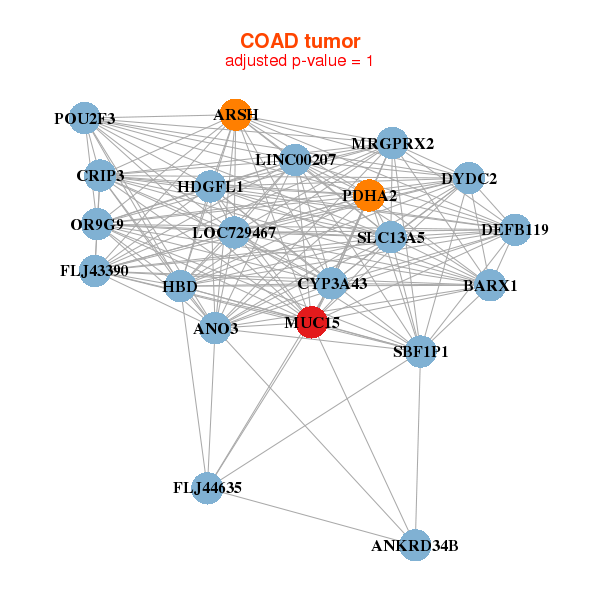
| * Co-Expression network figures were drawn using R package igraph. Only the top 20 genes with the highest correlations were shown. Red circle: input gene, orange circle: cell metabolism gene, sky circle: other gene |
: Open all plots for all cancer types
 |
|
| ANKRD35,ARID3C,AWAT1,C1orf105,CARD18,CCL26,CYP2F1, CYP3A4,DGAT2,DGAT2L6,ELOVL4,FADS6,KRT79,MUC15, NCCRP1,PLA2G2F,PNPLA1,PSAPL1,RDH12,RNF222,SOAT1 | CHIC2,CLCA4,CLDN12,CLDN8,ITGB8,KCNJ16,KCNK2, MPZL2,MUC15,NAV2,NCALD,PERP,PIP5K1B,POU2F3, PRSS16,RERG,SOCS5,SOSTDC1,SOX9,ST6GALNAC5,TANK |
 |
|
| ANKRD34B,ANO3,ARSH,BARX1,CRIP3,CYP3A43,DEFB119, DYDC2,FLJ43390,FLJ44635,HBD,HDGFL1,LOC729467,MRGPRX2, MUC15,LINC00207,OR9G9,PDHA2,POU2F3,SBF1P1,SLC13A5 | C11orf87,C4orf26,CLEC4M,CYP51A1,DHCR7,FDPS,FLJ40504, HMGCS1,ICAM5,INSIG1,KRTAP5-4,LCE1E,LMAN1L,MUC15, MVD,MYH1,MYH2,NSDHL,MSMO1,SQLE,VGLL2 |
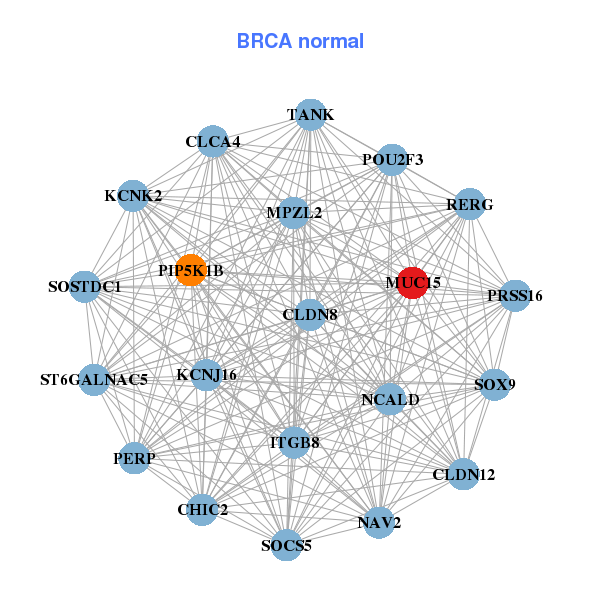
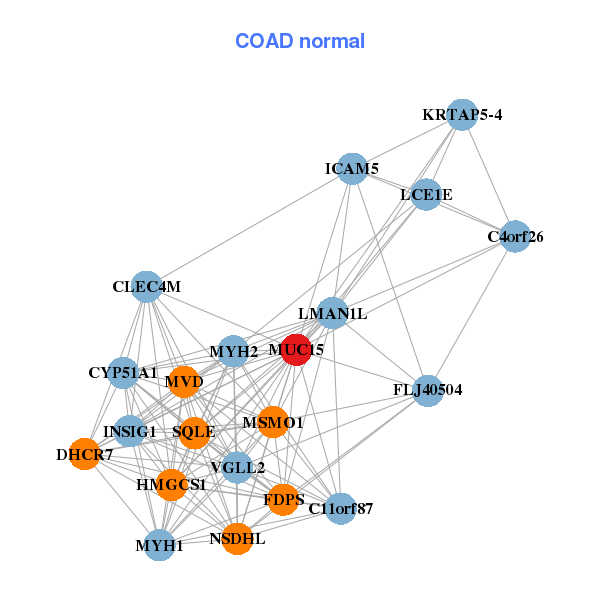
| * Co-Expression network figures were drawn using R package igraph. Only the top 20 genes with the highest correlations were shown. Red circle: input gene, orange circle: cell metabolism gene, sky circle: other gene |
: Open all plots for all cancer types
| Top |
: Open all interacting genes' information including KEGG pathway for all interacting genes from DAVID
| Top |
| Pharmacological Information for MUC15 |
| There's no related Drug. |
| Top |
| Cross referenced IDs for MUC15 |
| * We obtained these cross-references from Uniprot database. It covers 150 different DBs, 18 categories. http://www.uniprot.org/help/cross_references_section |
: Open all cross reference information
|
Copyright © 2016-Present - The Univsersity of Texas Health Science Center at Houston @ |