|
||||||||||||||||||||
| |
| Phenotypic Information (metabolism pathway, cancer, disease, phenome) |
| |
| |
| Gene-Gene Network Information: Co-Expression Network, Interacting Genes & KEGG |
| |
|


| Gene Summary for ALG10B |
| Basic gene info. | Gene symbol | ALG10B |
| Gene name | ALG10B, alpha-1,2-glucosyltransferase | |
| Synonyms | ALG10|KCR1 | |
| Cytomap | UCSC genome browser: 12q12 | |
| Genomic location | chr12 :38710556-38723528 | |
| Type of gene | protein-coding | |
| RefGenes | NM_001013620.3, | |
| Ensembl id | ENSG00000175548 | |
| Description | alpha-1,2-glucosyltransferase ALG10-Aalpha-2-glucosyltransferase ALG10-Basparagine-linked glycosylation 10 homolog B (yeast, alpha-1,2-glucosyltransferase)asparagine-linked glycosylation 10, alpha-1,2-glucosyltransferase homolog Basparagine-linked gly | |
| Modification date | 20141207 | |
| dbXrefs | HGNC : HGNC | |
| Ensembl : ENSG00000175548 | ||
| HPRD : 11923 | ||
| Vega : OTTHUMG00000169298 | ||
| Protein | UniProt: go to UniProt's Cross Reference DB Table | |
| Expression | CleanEX: HS_ALG10B | |
| BioGPS: 144245 | ||
| Gene Expression Atlas: ENSG00000175548 | ||
| The Human Protein Atlas: ENSG00000175548 | ||
| Pathway | NCI Pathway Interaction Database: ALG10B | |
| KEGG: ALG10B | ||
| REACTOME: ALG10B | ||
| ConsensusPathDB | ||
| Pathway Commons: ALG10B | ||
| Metabolism | MetaCyc: ALG10B | |
| HUMANCyc: ALG10B | ||
| Regulation | Ensembl's Regulation: ENSG00000175548 | |
| miRBase: chr12 :38,710,556-38,723,528 | ||
| TargetScan: NM_001013620 | ||
| cisRED: ENSG00000175548 | ||
| Context | iHOP: ALG10B | |
| cancer metabolism search in PubMed: ALG10B | ||
| UCL Cancer Institute: ALG10B | ||
| Assigned class in ccmGDB | C | |
| Top |
| Phenotypic Information for ALG10B(metabolism pathway, cancer, disease, phenome) |
| Cancer | CGAP: ALG10B |
| Familial Cancer Database: ALG10B | |
| * This gene is included in those cancer gene databases. |
|
|
|
|
|
|
| ||||||||||||||
Oncogene 1 | Significant driver gene in | |||||||||||||||||||
| cf) number; DB name 1 Oncogene; http://nar.oxfordjournals.org/content/35/suppl_1/D721.long, 2 Tumor Suppressor gene; https://bioinfo.uth.edu/TSGene/, 3 Cancer Gene Census; http://www.nature.com/nrc/journal/v4/n3/abs/nrc1299.html, 4 CancerGenes; http://nar.oxfordjournals.org/content/35/suppl_1/D721.long, 5 Network of Cancer Gene; http://ncg.kcl.ac.uk/index.php, 1Therapeutic Vulnerabilities in Cancer; http://cbio.mskcc.org/cancergenomics/statius/ |
| REACTOME_METABOLISM_OF_PROTEINS | |
| OMIM | |
| Orphanet | |
| Disease | KEGG Disease: ALG10B |
| MedGen: ALG10B (Human Medical Genetics with Condition) | |
| ClinVar: ALG10B | |
| Phenotype | MGI: ALG10B (International Mouse Phenotyping Consortium) |
| PhenomicDB: ALG10B | |
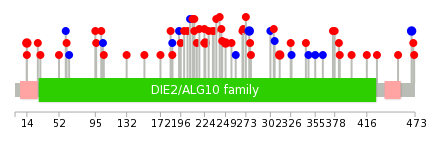
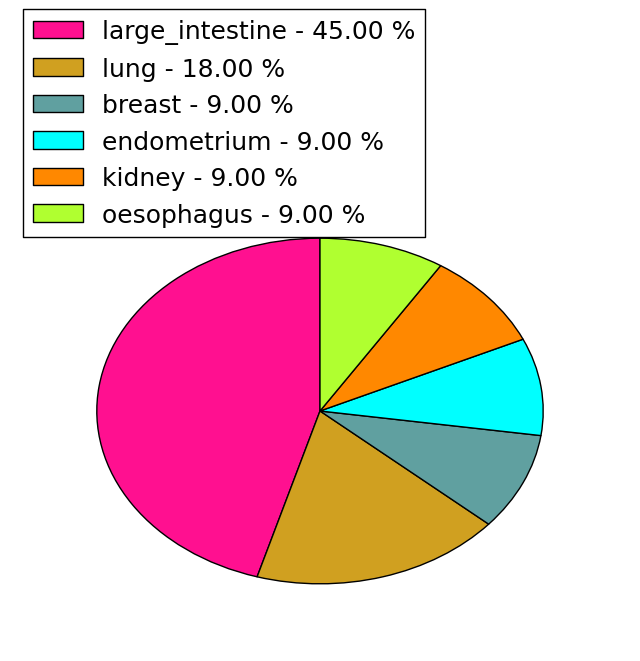
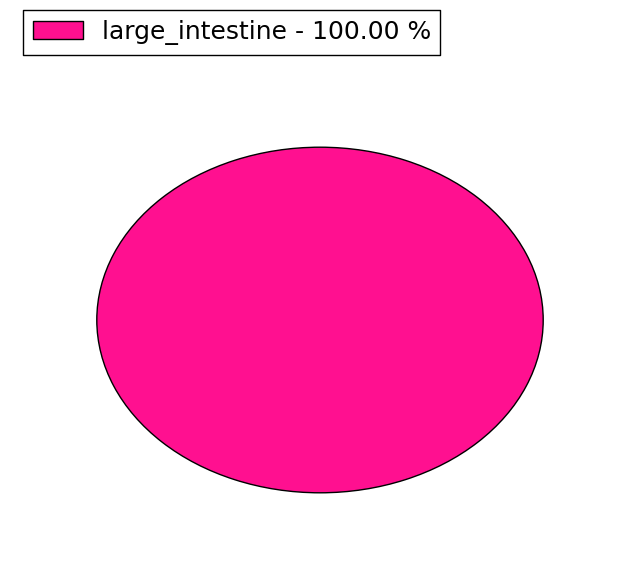
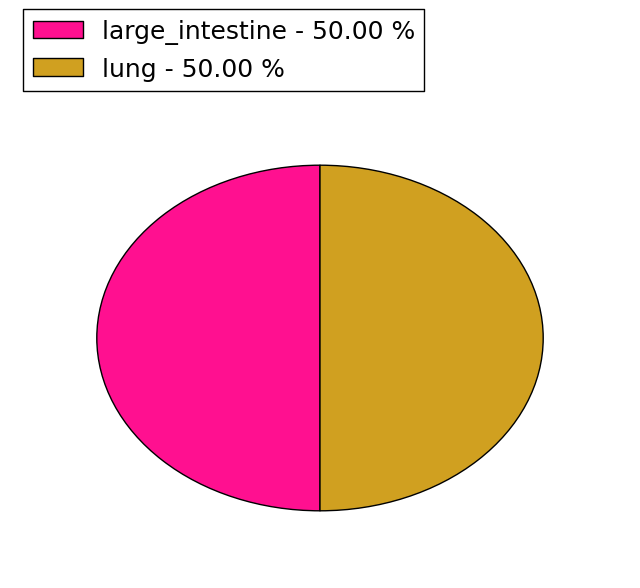
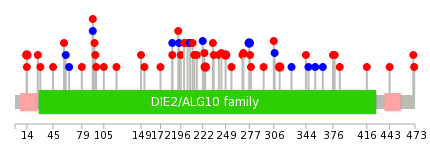
| Mutations for ALG10B |
| * Under tables are showing count per each tissue to give us broad intuition about tissue specific mutation patterns.You can go to the detailed page for each mutation database's web site. |
| There's no structural variation information in COSMIC data for this gene. |
| * From mRNA Sanger sequences, Chitars2.0 arranged chimeric transcripts. This table shows ALG10B related fusion information. |
| ID | Head Gene | Tail Gene | Accession | Gene_a | qStart_a | qEnd_a | Chromosome_a | tStart_a | tEnd_a | Gene_a | qStart_a | qEnd_a | Chromosome_a | tStart_a | tEnd_a |
| AI382716 | RPS4X | 10 | 64 | X | 71492453 | 71492507 | ALG10B | 62 | 205 | 12 | 38716185 | 38716327 | |
| Top |
| There's no copy number variation information in COSMIC data for this gene. |
| Top |
|
 |
| Top |
| Stat. for Non-Synonymous SNVs (# total SNVs=44) | (# total SNVs=11) |
 |  |
(# total SNVs=2) | (# total SNVs=2) |
 |  |
| Top |
| * When you move the cursor on each content, you can see more deailed mutation information on the Tooltip. Those are primary_site,primary_histology,mutation(aa),pubmedID. |
| GRCh37 position | Mutation(aa) | Unique sampleID count |
| chr12:38714340-38714340 | p.M249I | 2 |
| chr12:38714267-38714267 | p.G225V | 2 |
| chr12:38714532-38714532 | p.K313N | 2 |
| chr12:38710735-38710735 | p.S14G | 2 |
| chr12:38714424-38714424 | p.G277G | 2 |
| chr12:38714227-38714227 | p.E212Q | 2 |
| chr12:38715000-38715000 | p.Q469Q | 2 |
| chr12:38714144-38714144 | p.M184K | 1 |
| chr12:38714490-38714491 | p.S302fs*9 | 1 |
| chr12:38714245-38714245 | p.D218N | 1 |
| Top |
|
 |
| Point Mutation/ Tissue ID | 1 | 2 | 3 | 4 | 5 | 6 | 7 | 8 | 9 | 10 | 11 | 12 | 13 | 14 | 15 | 16 | 17 | 18 | 19 | 20 |
| # sample | 4 | 13 | 1 | 1 | 3 | 1 | 9 | 2 | 5 | 7 | 5 | 1 | 6 | |||||||
| # mutation | 4 | 13 | 1 | 2 | 3 | 1 | 11 | 2 | 5 | 7 | 5 | 1 | 6 | |||||||
| nonsynonymous SNV | 3 | 10 | 1 | 2 | 2 | 1 | 9 | 1 | 5 | 4 | 4 | 1 | 5 | |||||||
| synonymous SNV | 1 | 3 | 1 | 2 | 1 | 3 | 1 | 1 |
| cf) Tissue ID; Tissue type (1; BLCA[Bladder Urothelial Carcinoma], 2; BRCA[Breast invasive carcinoma], 3; CESC[Cervical squamous cell carcinoma and endocervical adenocarcinoma], 4; COAD[Colon adenocarcinoma], 5; GBM[Glioblastoma multiforme], 6; Glioma Low Grade, 7; HNSC[Head and Neck squamous cell carcinoma], 8; KICH[Kidney Chromophobe], 9; KIRC[Kidney renal clear cell carcinoma], 10; KIRP[Kidney renal papillary cell carcinoma], 11; LAML[Acute Myeloid Leukemia], 12; LUAD[Lung adenocarcinoma], 13; LUSC[Lung squamous cell carcinoma], 14; OV[Ovarian serous cystadenocarcinoma ], 15; PAAD[Pancreatic adenocarcinoma], 16; PRAD[Prostate adenocarcinoma], 17; SKCM[Skin Cutaneous Melanoma], 18:STAD[Stomach adenocarcinoma], 19:THCA[Thyroid carcinoma], 20:UCEC[Uterine Corpus Endometrial Carcinoma]) |
| Top |
| * We represented just top 10 SNVs. When you move the cursor on each content, you can see more deailed mutation information on the Tooltip. Those are primary_site, primary_histology, mutation(aa), pubmedID. |
| Genomic Position | Mutation(aa) | Unique sampleID count |
| chr12:38714424 | p.G277G | 2 |
| chr12:38710735 | p.K313N | 2 |
| chr12:38714267 | p.S14G | 2 |
| chr12:38714532 | p.G225V | 2 |
| chr12:38714340 | p.M249I | 2 |
| chr12:38714038 | p.S92F | 1 |
| chr12:38714574 | p.K204Q | 1 |
| chr12:38714221 | p.C443W | 1 |
| chr12:38715009 | p.S92S | 1 |
| chr12:38712071 | p.E207E | 1 |
| * Copy number data were extracted from TCGA using R package TCGA-Assembler. The URLs of all public data files on TCGA DCC data server were gathered on Jan-05-2015. Function ProcessCNAData in TCGA-Assembler package was used to obtain gene-level copy number value which is calculated as the average copy number of the genomic region of a gene. |
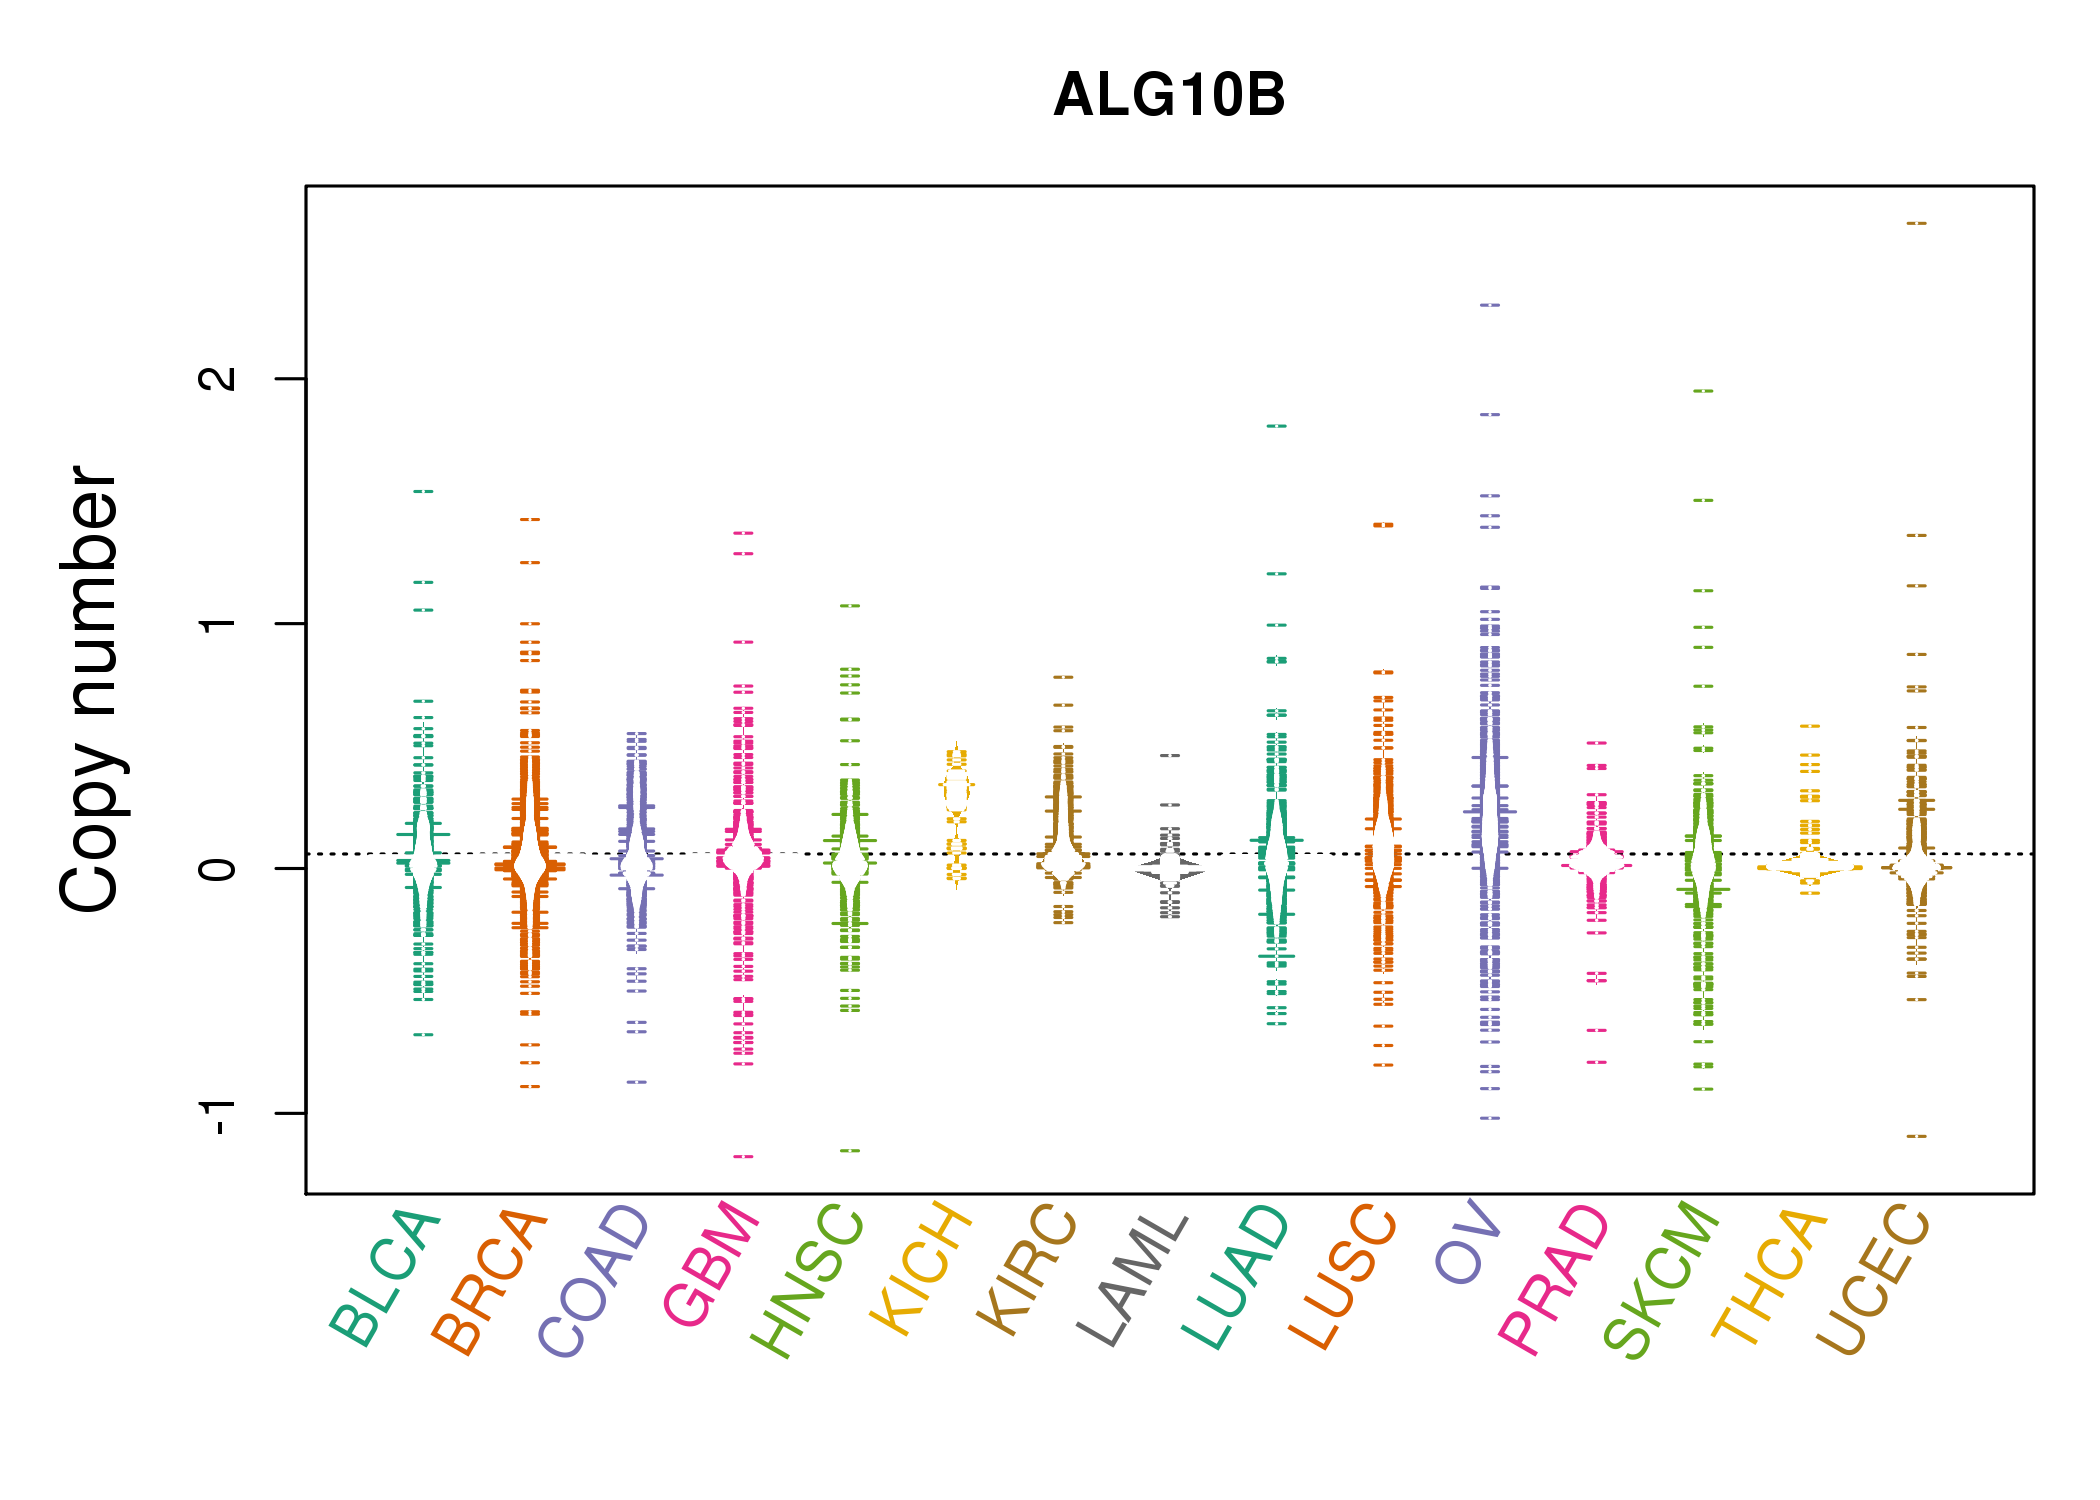 |
| cf) Tissue ID[Tissue type]: BLCA[Bladder Urothelial Carcinoma], BRCA[Breast invasive carcinoma], CESC[Cervical squamous cell carcinoma and endocervical adenocarcinoma], COAD[Colon adenocarcinoma], GBM[Glioblastoma multiforme], Glioma Low Grade, HNSC[Head and Neck squamous cell carcinoma], KICH[Kidney Chromophobe], KIRC[Kidney renal clear cell carcinoma], KIRP[Kidney renal papillary cell carcinoma], LAML[Acute Myeloid Leukemia], LUAD[Lung adenocarcinoma], LUSC[Lung squamous cell carcinoma], OV[Ovarian serous cystadenocarcinoma ], PAAD[Pancreatic adenocarcinoma], PRAD[Prostate adenocarcinoma], SKCM[Skin Cutaneous Melanoma], STAD[Stomach adenocarcinoma], THCA[Thyroid carcinoma], UCEC[Uterine Corpus Endometrial Carcinoma] |
| Top |
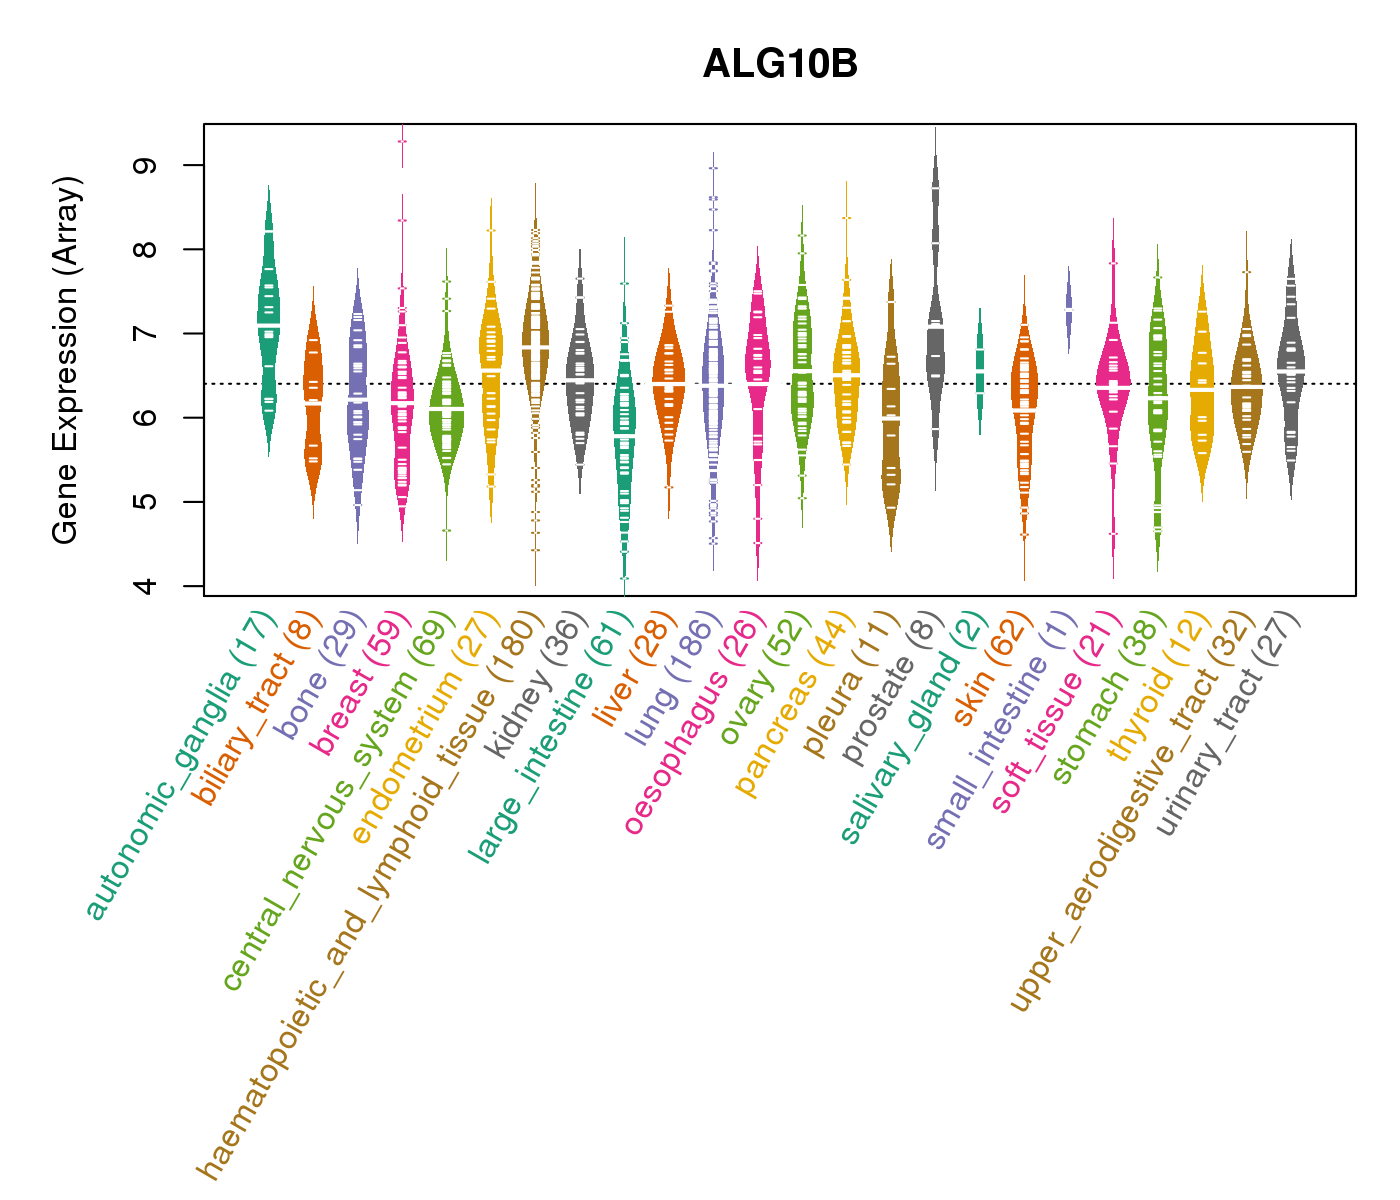
| Gene Expression for ALG10B |
| * CCLE gene expression data were extracted from CCLE_Expression_Entrez_2012-10-18.res: Gene-centric RMA-normalized mRNA expression data. |
 |
| * Normalized gene expression data of RNASeqV2 was extracted from TCGA using R package TCGA-Assembler. The URLs of all public data files on TCGA DCC data server were gathered at Jan-05-2015. Only eight cancer types have enough normal control samples for differential expression analysis. (t test, adjusted p<0.05 (using Benjamini-Hochberg FDR)) |
 |
| Top |
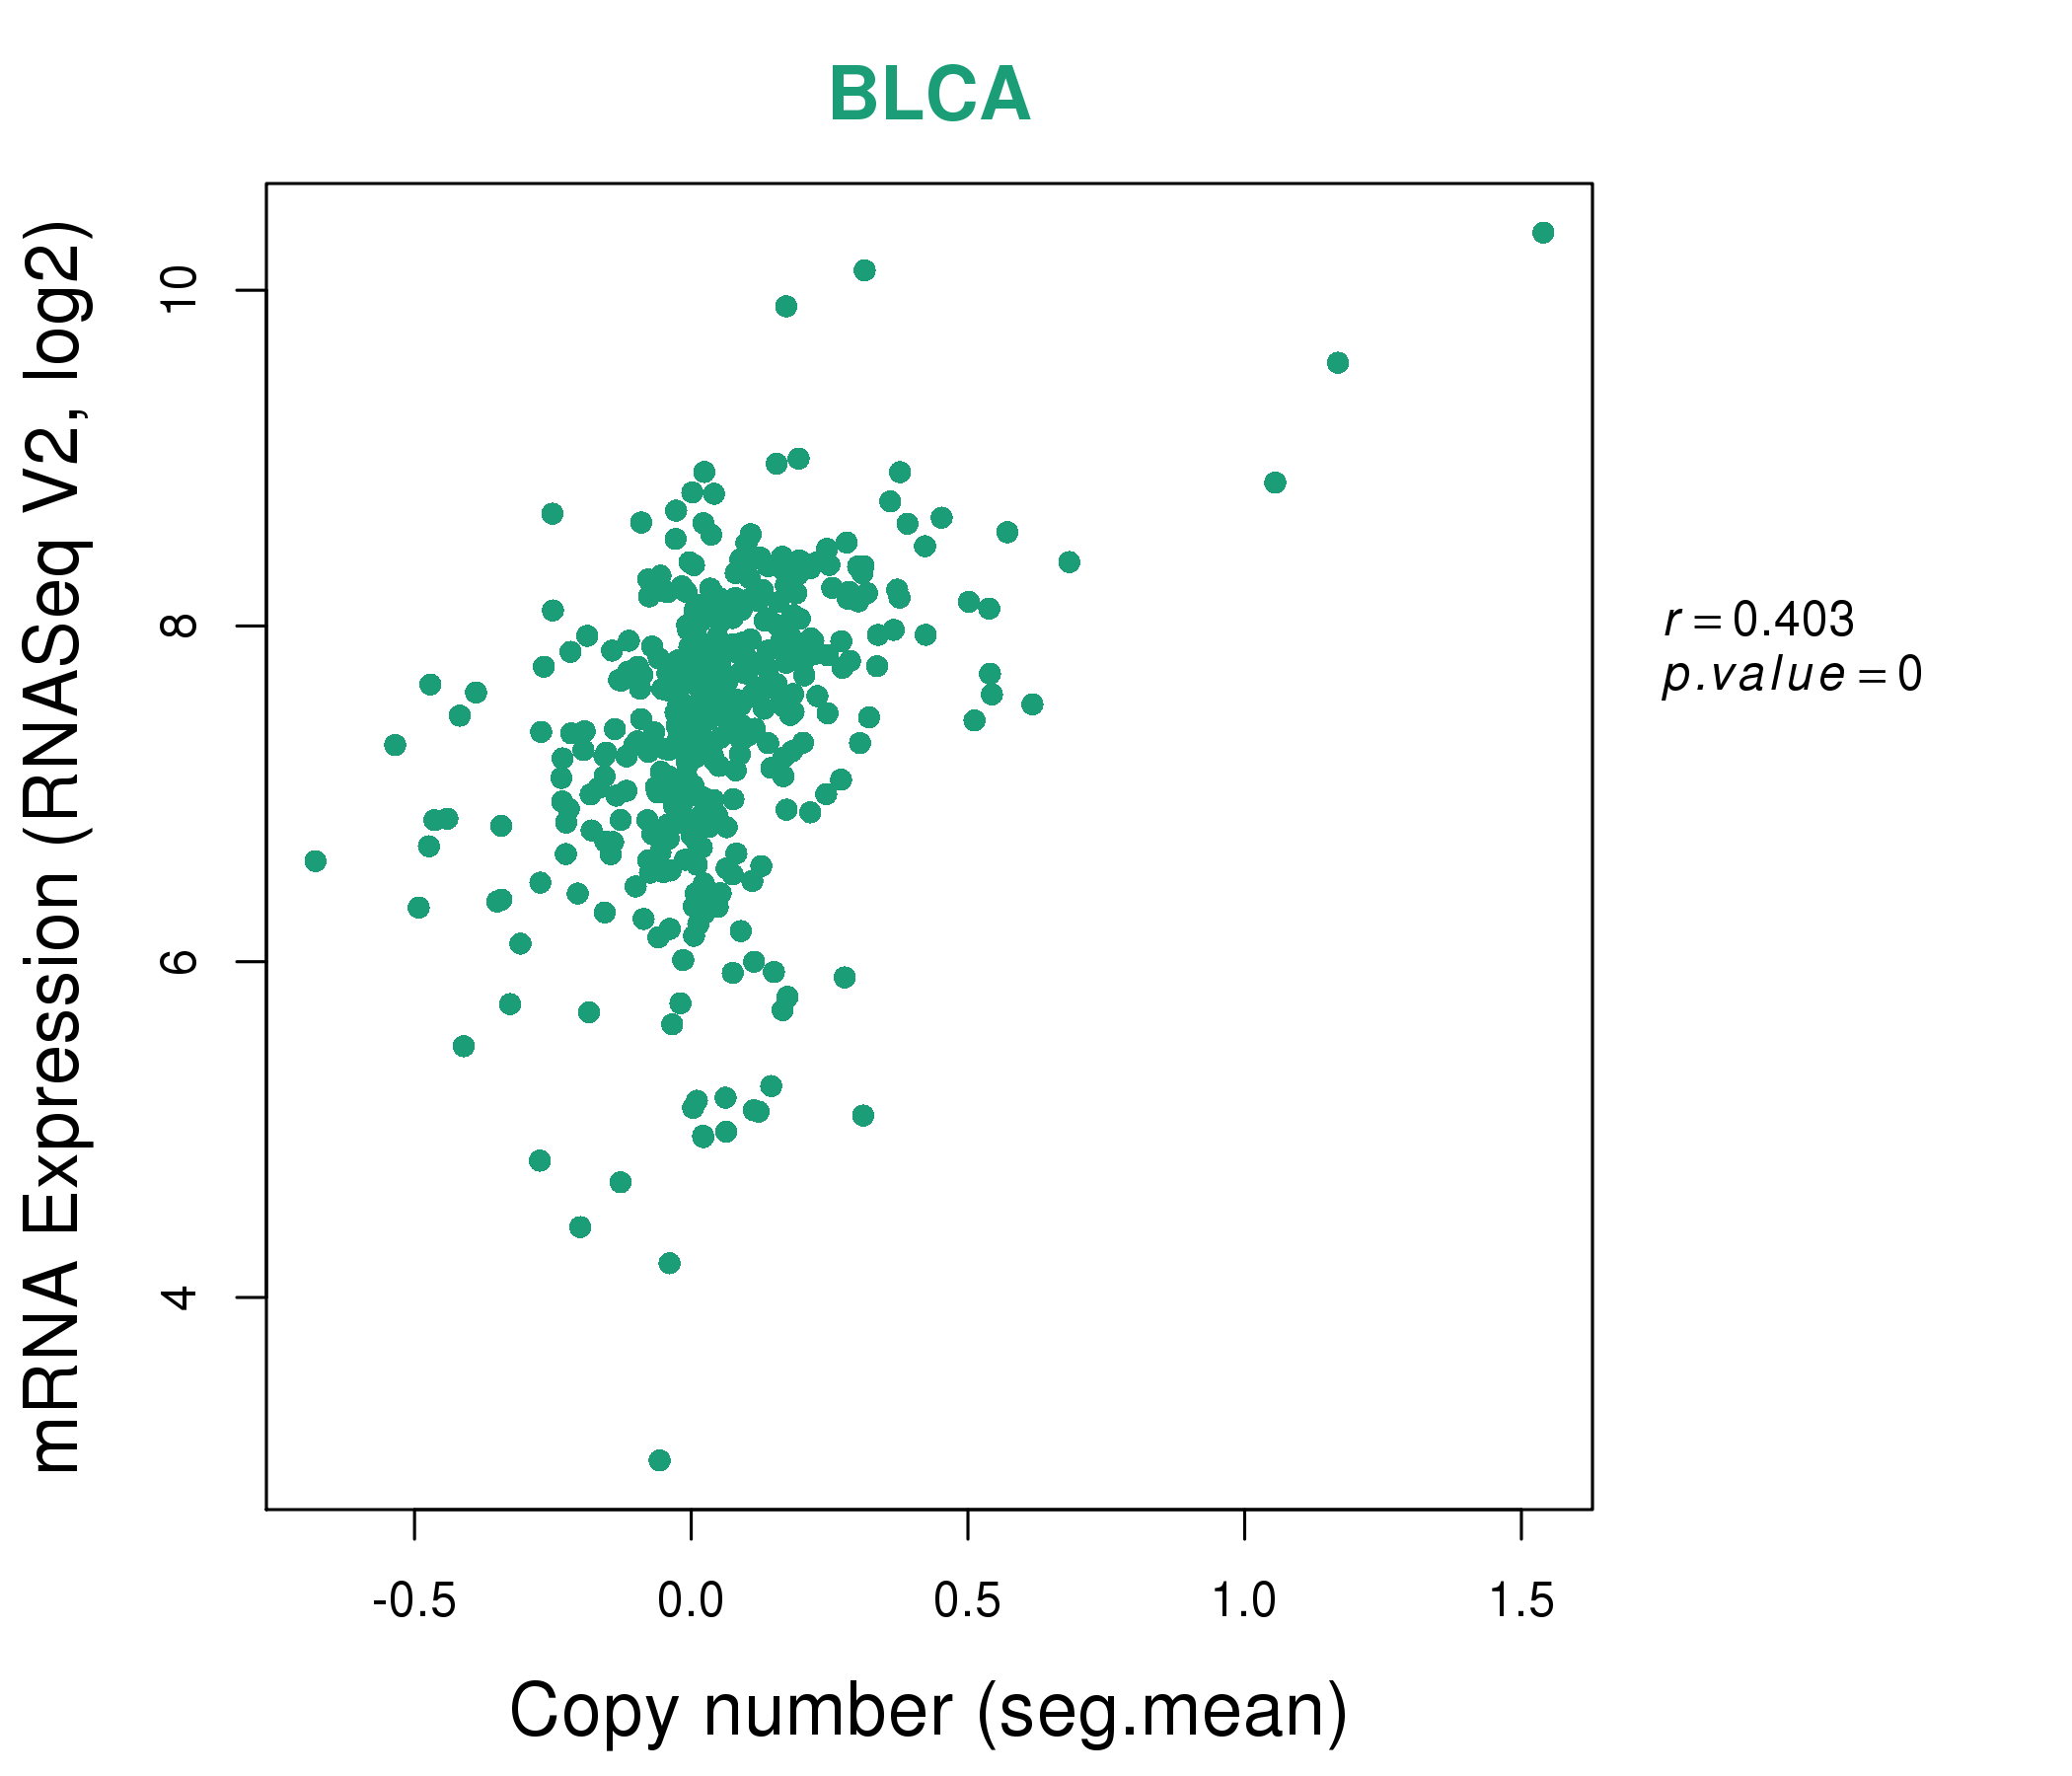
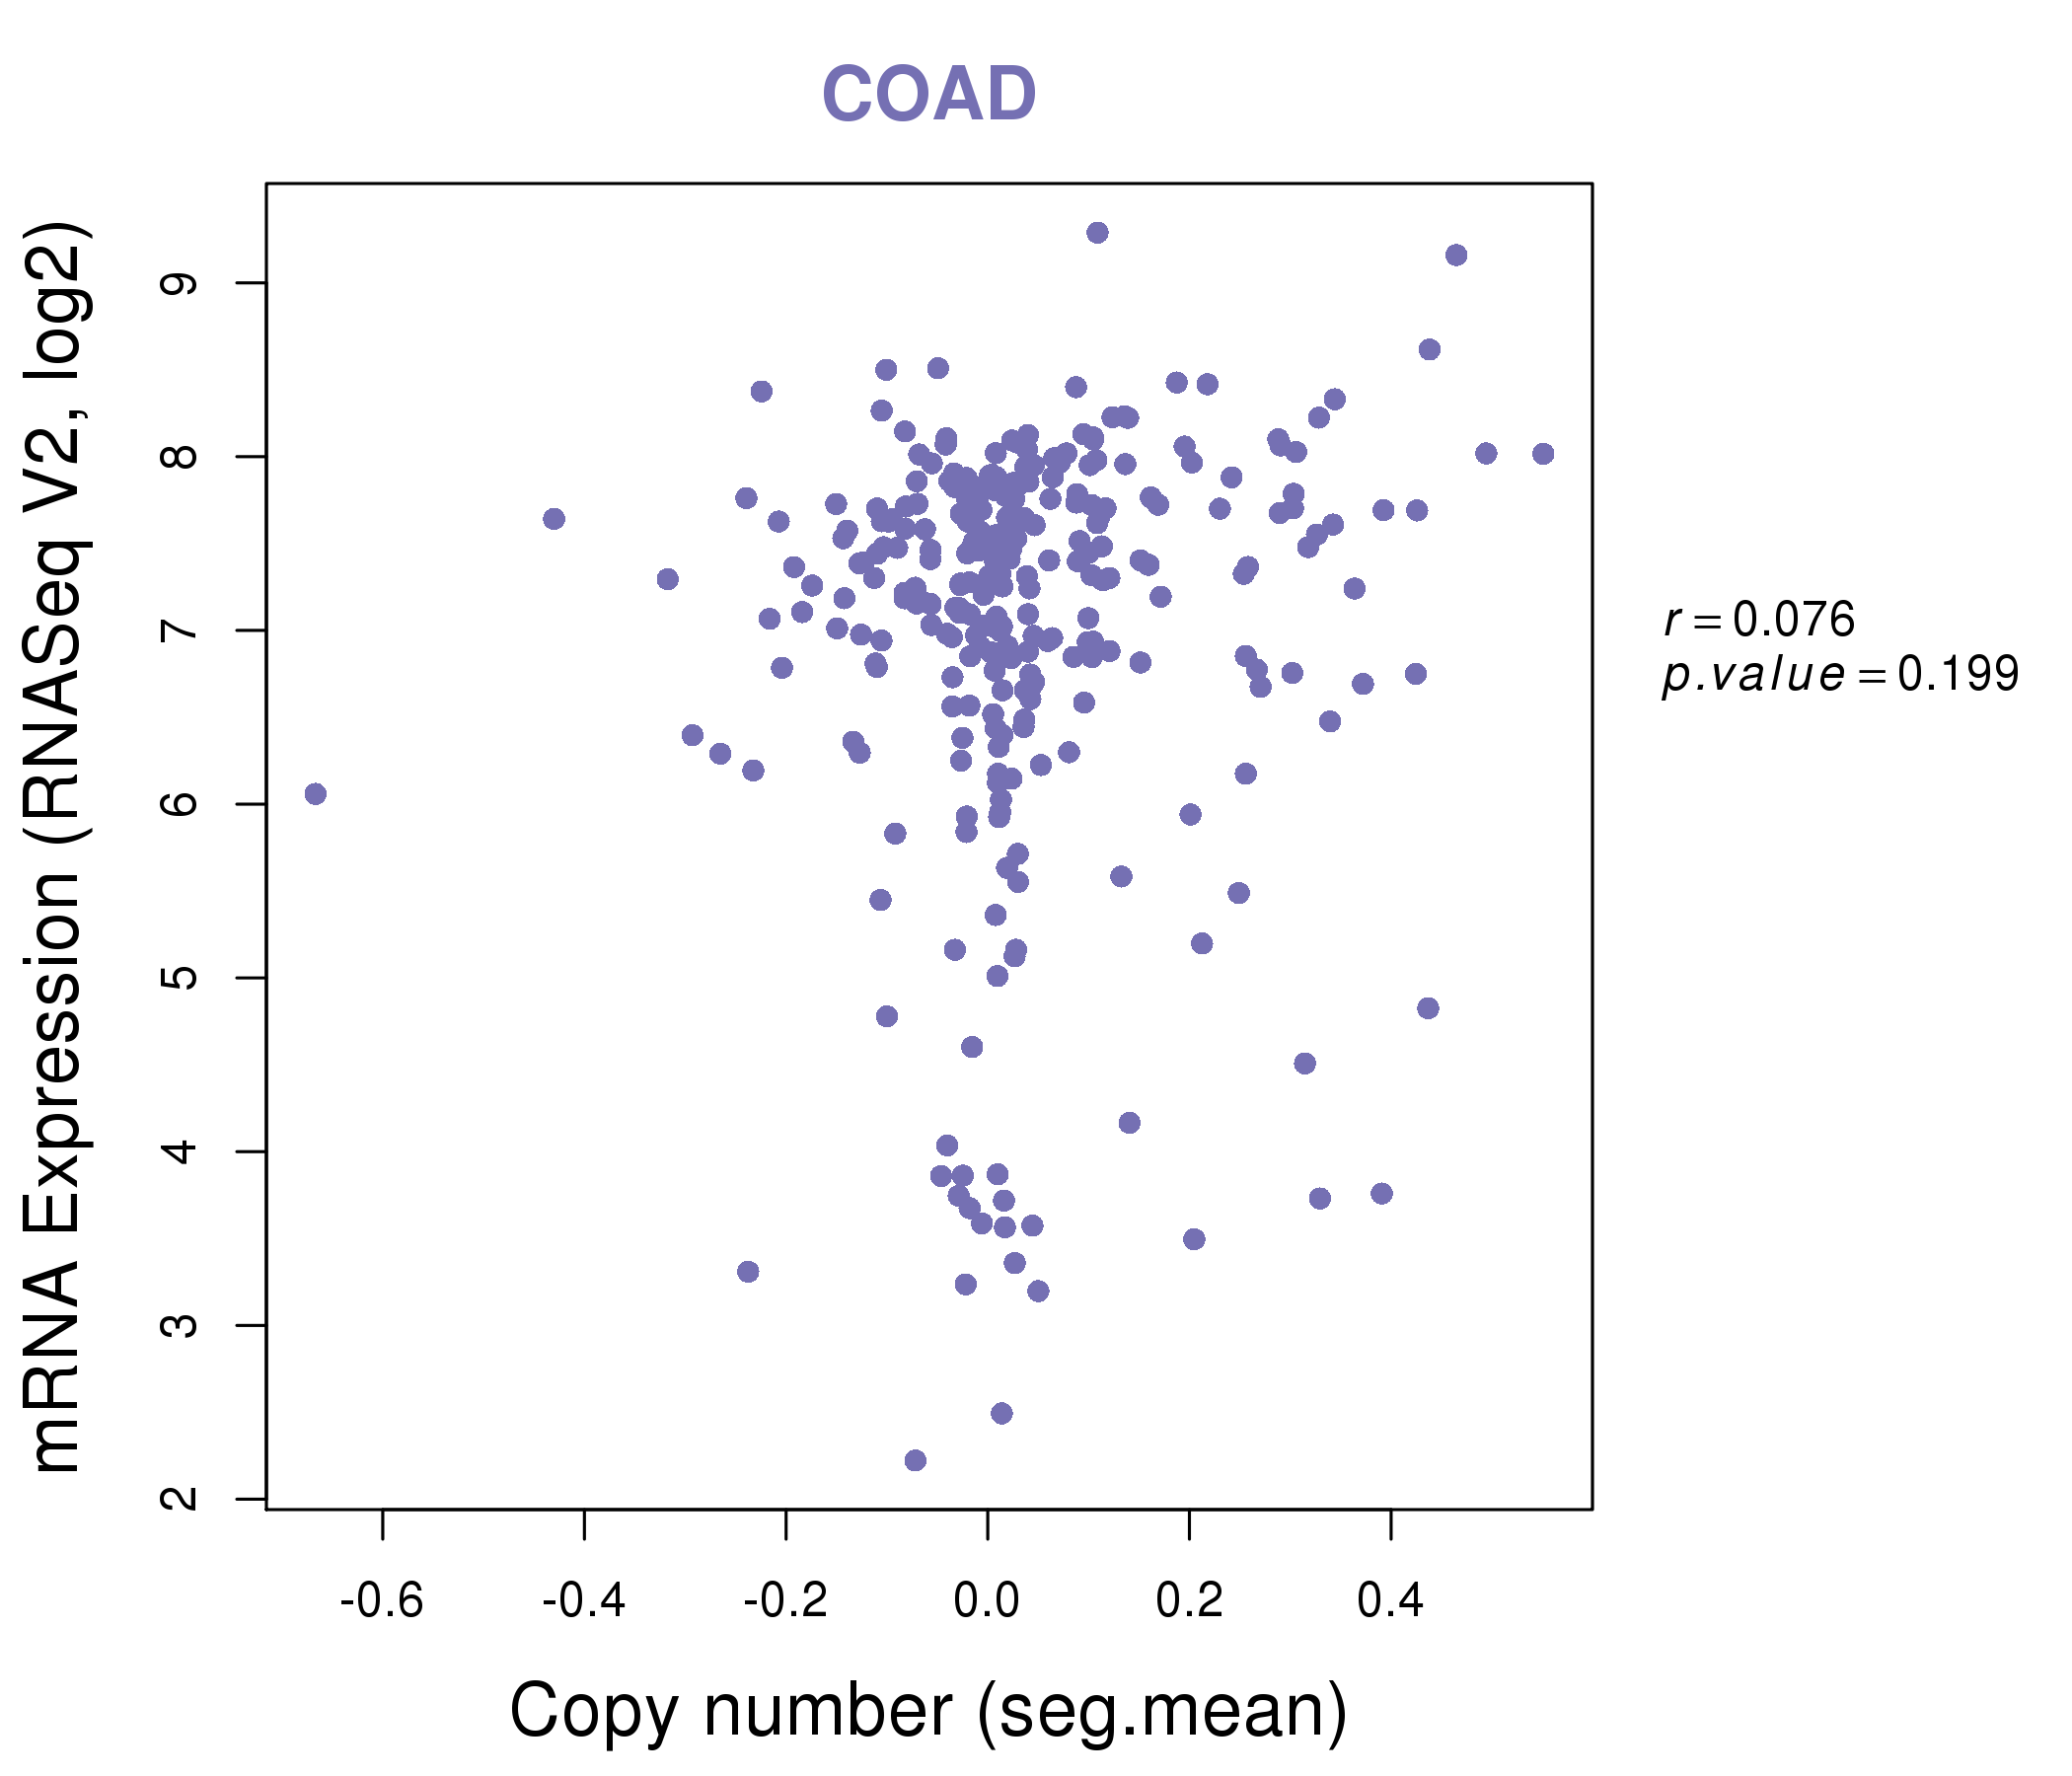
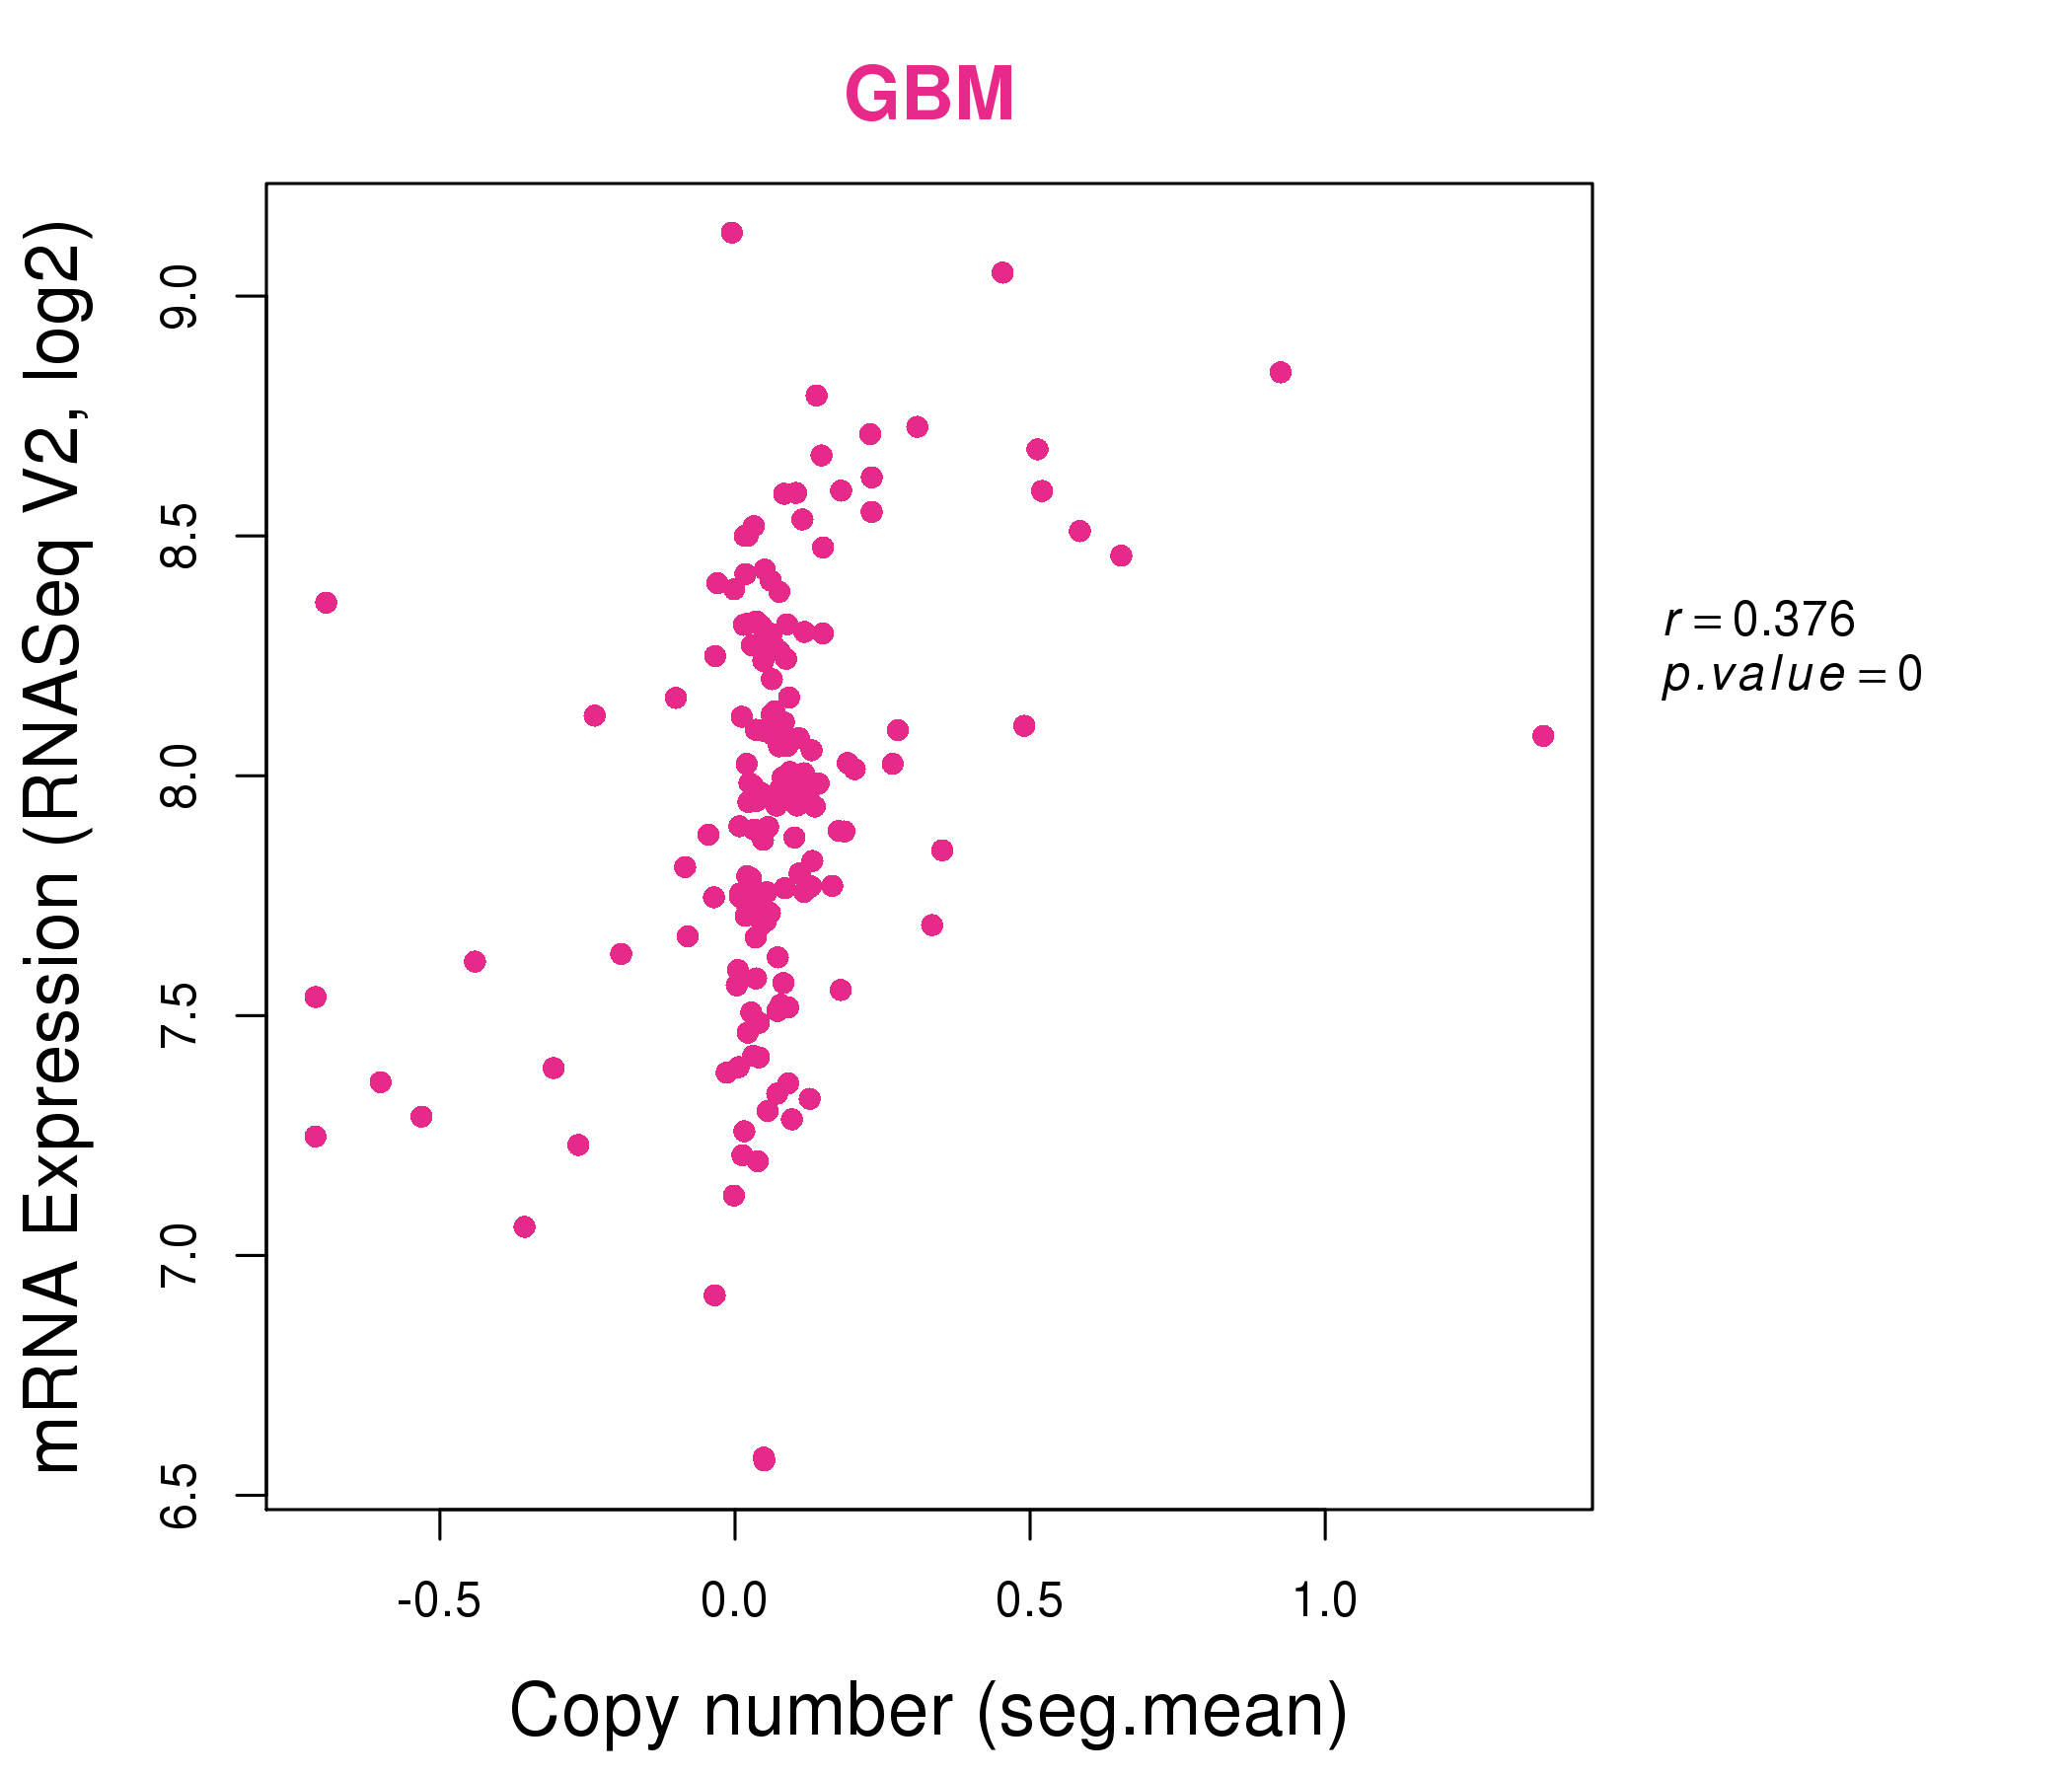
| * This plots show the correlation between CNV and gene expression. |
: Open all plots for all cancer types
 |
|
 |
|

| Top |
| Gene-Gene Network Information |
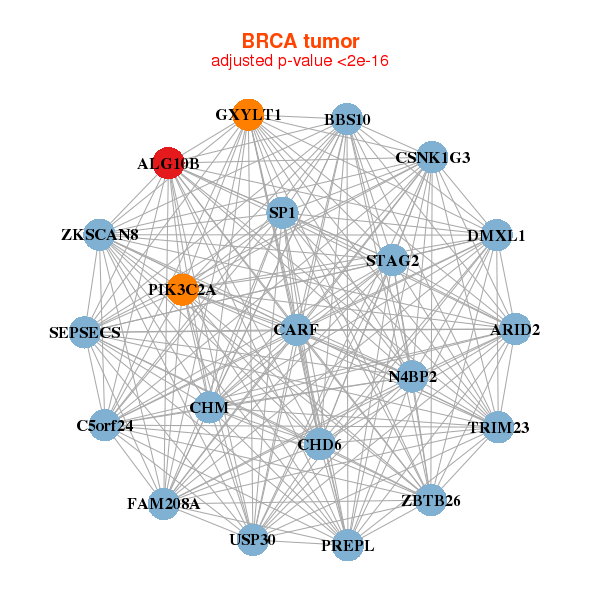
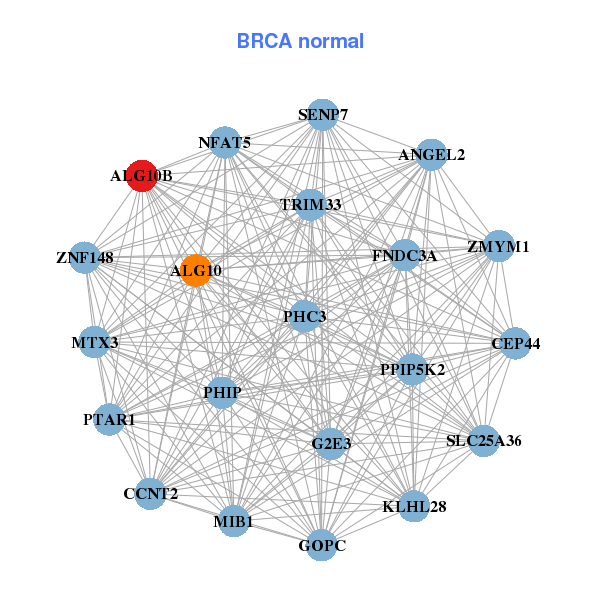
| * Co-Expression network figures were drawn using R package igraph. Only the top 20 genes with the highest correlations were shown. Red circle: input gene, orange circle: cell metabolism gene, sky circle: other gene |
: Open all plots for all cancer types
 |
|
| ALG10B,CARF,ARID2,BBS10,FAM208A,C5orf24,CHD6, CHM,CSNK1G3,DMXL1,GXYLT1,N4BP2,PIK3C2A,PREPL, SEPSECS,SP1,STAG2,TRIM23,USP30,ZBTB26,ZKSCAN8 | ALG10,ALG10B,ANGEL2,CCNT2,FNDC3A,G2E3,GOPC, CEP44,KLHL28,MIB1,MTX3,NFAT5,PHC3,PHIP, PPIP5K2,PTAR1,SENP7,SLC25A36,TRIM33,ZMYM1,ZNF148 |
 |
|
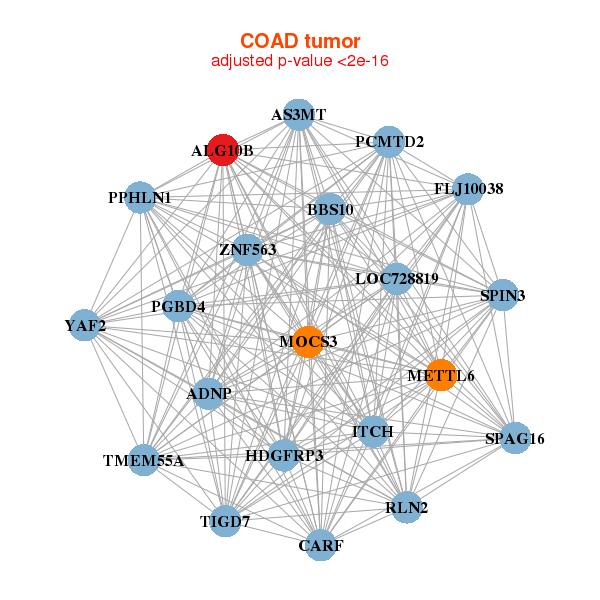
| ADNP,ALG10B,CARF,AS3MT,BBS10,FLJ10038,HDGFRP3, ITCH,LOC728819,METTL6,MOCS3,PCMTD2,PGBD4,PPHLN1, RLN2,SPAG16,SPIN3,TIGD7,TMEM55A,YAF2,ZNF563 | ALG10B,C22orf15,DCAF16,FRS2,HKR1,KIAA0355,LOC100101266, PAN3,PLEKHA5,RNMT,SHPRH,ZBTB44,ZNF112,ZNF12, ZNF141,ZNF146,ZNF283,ZNF317,ZNF33A,ZNF417,ZNF738 |
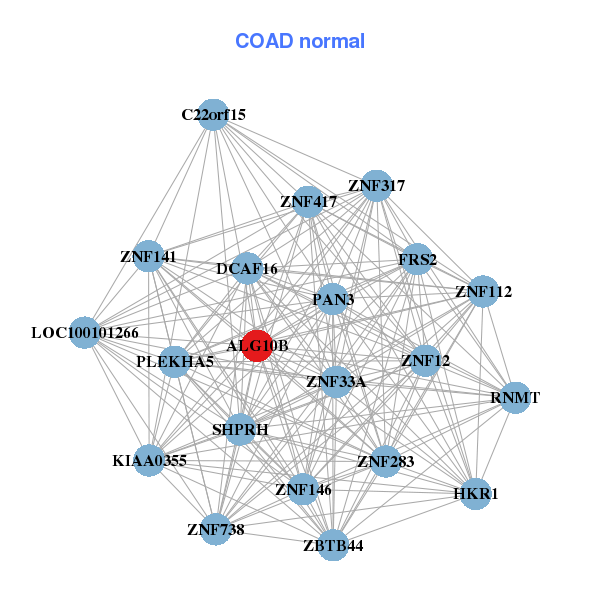
| * Co-Expression network figures were drawn using R package igraph. Only the top 20 genes with the highest correlations were shown. Red circle: input gene, orange circle: cell metabolism gene, sky circle: other gene |
: Open all plots for all cancer types
| Top |
: Open all interacting genes' information including KEGG pathway for all interacting genes from DAVID
| Top |
| Pharmacological Information for ALG10B |
| There's no related Drug. |
| Top |
| Cross referenced IDs for ALG10B |
| * We obtained these cross-references from Uniprot database. It covers 150 different DBs, 18 categories. http://www.uniprot.org/help/cross_references_section |
: Open all cross reference information
|
Copyright © 2016-Present - The Univsersity of Texas Health Science Center at Houston @ |