|
||||||||||||||||||||
| |
| Phenotypic Information (metabolism pathway, cancer, disease, phenome) |
| |
| |
| Gene-Gene Network Information: Co-Expression Network, Interacting Genes & KEGG |
| |
|


| Gene Summary for RDH12 |
| Basic gene info. | Gene symbol | RDH12 |
| Gene name | retinol dehydrogenase 12 (all-trans/9-cis/11-cis) | |
| Synonyms | LCA13|LCA3|RP53|SDR7C2 | |
| Cytomap | UCSC genome browser: 14q24.1 | |
| Genomic location | chr14 :68168602-68201168 | |
| Type of gene | protein-coding | |
| RefGenes | NM_152443.2, | |
| Ensembl id | ENSG00000139988 | |
| Description | all-trans and 9-cis retinol dehydrogenaseretinol dehydrogenase 12retinol dehydrogenase 12, all-trans and 9-cisshort chain dehydrogenase/reductase family 7C, member 2 | |
| Modification date | 20141219 | |
| dbXrefs | MIM : 608830 | |
| HGNC : HGNC | ||
| Ensembl : ENSG00000139988 | ||
| HPRD : 10585 | ||
| Vega : OTTHUMG00000170032 | ||
| Protein | UniProt: go to UniProt's Cross Reference DB Table | |
| Expression | CleanEX: HS_RDH12 | |
| BioGPS: 145226 | ||
| Gene Expression Atlas: ENSG00000139988 | ||
| The Human Protein Atlas: ENSG00000139988 | ||
| Pathway | NCI Pathway Interaction Database: RDH12 | |
| KEGG: RDH12 | ||
| REACTOME: RDH12 | ||
| ConsensusPathDB | ||
| Pathway Commons: RDH12 | ||
| Metabolism | MetaCyc: RDH12 | |
| HUMANCyc: RDH12 | ||
| Regulation | Ensembl's Regulation: ENSG00000139988 | |
| miRBase: chr14 :68,168,602-68,201,168 | ||
| TargetScan: NM_152443 | ||
| cisRED: ENSG00000139988 | ||
| Context | iHOP: RDH12 | |
| cancer metabolism search in PubMed: RDH12 | ||
| UCL Cancer Institute: RDH12 | ||
| Assigned class in ccmGDB | C | |
| Top |
| Phenotypic Information for RDH12(metabolism pathway, cancer, disease, phenome) |
| Cancer | CGAP: RDH12 |
| Familial Cancer Database: RDH12 | |
| * This gene is included in those cancer gene databases. |
|
|
|
|
|
| . | ||||||||||||||
Oncogene 1 | Significant driver gene in | |||||||||||||||||||
| cf) number; DB name 1 Oncogene; http://nar.oxfordjournals.org/content/35/suppl_1/D721.long, 2 Tumor Suppressor gene; https://bioinfo.uth.edu/TSGene/, 3 Cancer Gene Census; http://www.nature.com/nrc/journal/v4/n3/abs/nrc1299.html, 4 CancerGenes; http://nar.oxfordjournals.org/content/35/suppl_1/D721.long, 5 Network of Cancer Gene; http://ncg.kcl.ac.uk/index.php, 1Therapeutic Vulnerabilities in Cancer; http://cbio.mskcc.org/cancergenomics/statius/ |
| KEGG_RETINOL_METABOLISM | |
| OMIM | |
| Orphanet | |
| Disease | KEGG Disease: RDH12 |
| MedGen: RDH12 (Human Medical Genetics with Condition) | |
| ClinVar: RDH12 | |
| Phenotype | MGI: RDH12 (International Mouse Phenotyping Consortium) |
| PhenomicDB: RDH12 | |
| Mutations for RDH12 |
| * Under tables are showing count per each tissue to give us broad intuition about tissue specific mutation patterns.You can go to the detailed page for each mutation database's web site. |
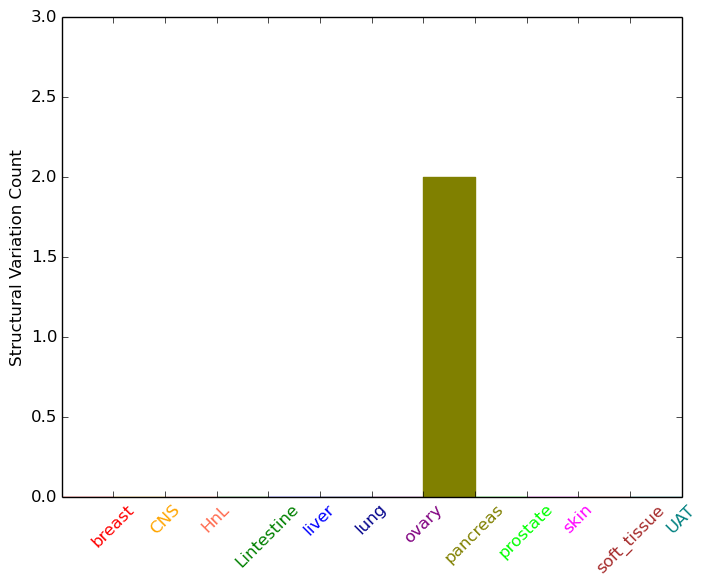
| - Statistics for Tissue and Mutation type | Top |
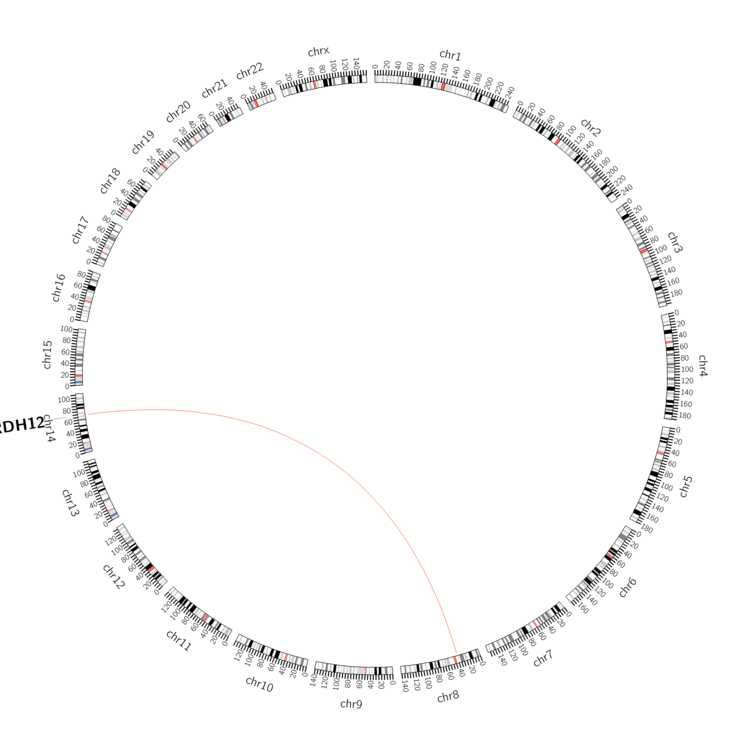 |
| - For Inter-chromosomal Variations |
| * Inter-chromosomal variantions includes 'interchromosomal amplicon to amplicon', 'interchromosomal amplicon to non-amplified dna', 'interchromosomal insertion', 'Interchromosomal unknown type'. |
 |
| - For Intra-chromosomal Variations |
| There's no intra-chromosomal structural variation. |
| Sample | Symbol_a | Chr_a | Start_a | End_a | Symbol_b | Chr_b | Start_b | End_b |
| cf) Tissue number; Tissue name (1;Breast, 2;Central_nervous_system, 3;Haematopoietic_and_lymphoid_tissue, 4;Large_intestine, 5;Liver, 6;Lung, 7;Ovary, 8;Pancreas, 9;Prostate, 10;Skin, 11;Soft_tissue, 12;Upper_aerodigestive_tract) |
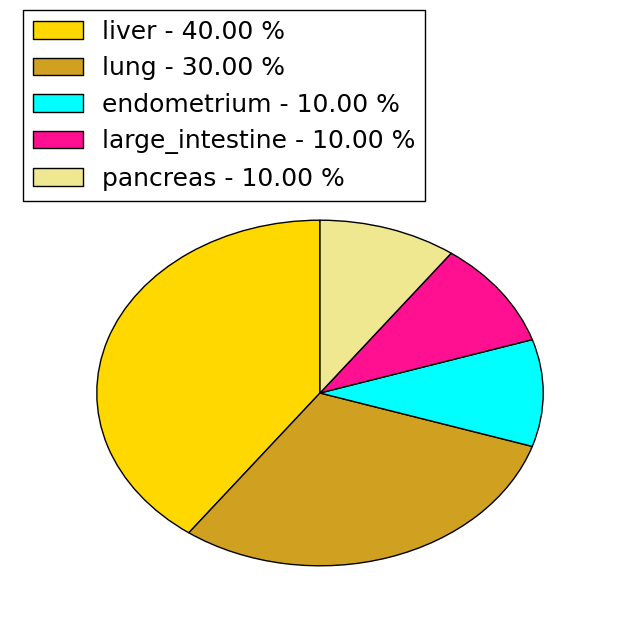
| * From mRNA Sanger sequences, Chitars2.0 arranged chimeric transcripts. This table shows RDH12 related fusion information. |
| ID | Head Gene | Tail Gene | Accession | Gene_a | qStart_a | qEnd_a | Chromosome_a | tStart_a | tEnd_a | Gene_a | qStart_a | qEnd_a | Chromosome_a | tStart_a | tEnd_a |
| Top |
| There's no copy number variation information in COSMIC data for this gene. |
| Top |
|
 |
| Top |
| Stat. for Non-Synonymous SNVs (# total SNVs=29) | (# total SNVs=10) |
 |  |
(# total SNVs=0) | (# total SNVs=0) |
| Top |
| * When you move the cursor on each content, you can see more deailed mutation information on the Tooltip. Those are primary_site,primary_histology,mutation(aa),pubmedID. |
| GRCh37 position | Mutation(aa) | Unique sampleID count |
| chr14:68193795-68193795 | p.K182N | 5 |
| chr14:68200555-68200555 | p.R314Q | 4 |
| chr14:68191872-68191872 | p.E82K | 3 |
| chr14:68195964-68195964 | p.R239W | 2 |
| chr14:68191259-68191259 | p.G46G | 2 |
| chr14:68193731-68193731 | p.R161Q | 2 |
| chr14:68192765-68192765 | p.? | 2 |
| chr14:68200490-68200490 | p.P292P | 2 |
| chr14:68200517-68200517 | p.E301E | 2 |
| chr14:68193827-68193827 | p.R193H | 1 |
| Top |
|
 |
| Point Mutation/ Tissue ID | 1 | 2 | 3 | 4 | 5 | 6 | 7 | 8 | 9 | 10 | 11 | 12 | 13 | 14 | 15 | 16 | 17 | 18 | 19 | 20 |
| # sample | 1 | 1 | 7 | 3 | 1 | 1 | 2 | 1 | 5 | 1 | 5 | |||||||||
| # mutation | 1 | 1 | 6 | 3 | 1 | 1 | 2 | 1 | 5 | 1 | 5 | |||||||||
| nonsynonymous SNV | 1 | 5 | 3 | 2 | 1 | 2 | 1 | 4 | ||||||||||||
| synonymous SNV | 1 | 1 | 1 | 1 | 3 | 1 |
| cf) Tissue ID; Tissue type (1; BLCA[Bladder Urothelial Carcinoma], 2; BRCA[Breast invasive carcinoma], 3; CESC[Cervical squamous cell carcinoma and endocervical adenocarcinoma], 4; COAD[Colon adenocarcinoma], 5; GBM[Glioblastoma multiforme], 6; Glioma Low Grade, 7; HNSC[Head and Neck squamous cell carcinoma], 8; KICH[Kidney Chromophobe], 9; KIRC[Kidney renal clear cell carcinoma], 10; KIRP[Kidney renal papillary cell carcinoma], 11; LAML[Acute Myeloid Leukemia], 12; LUAD[Lung adenocarcinoma], 13; LUSC[Lung squamous cell carcinoma], 14; OV[Ovarian serous cystadenocarcinoma ], 15; PAAD[Pancreatic adenocarcinoma], 16; PRAD[Prostate adenocarcinoma], 17; SKCM[Skin Cutaneous Melanoma], 18:STAD[Stomach adenocarcinoma], 19:THCA[Thyroid carcinoma], 20:UCEC[Uterine Corpus Endometrial Carcinoma]) |
| Top |
| * We represented just top 10 SNVs. When you move the cursor on each content, you can see more deailed mutation information on the Tooltip. Those are primary_site, primary_histology, mutation(aa), pubmedID. |
| Genomic Position | Mutation(aa) | Unique sampleID count |
| chr14:68200555 | p.R314Q | 3 |
| chr14:68191259 | p.G46G | 2 |
| chr14:68192801 | p.S174S | 1 |
| chr14:68191267 | p.F251F | 1 |
| chr14:68192802 | p.T49M | 1 |
| chr14:68191275 | p.L277V | 1 |
| chr14:68192813 | p.G52C | 1 |
| chr14:68191281 | p.L277L | 1 |
| chr14:68192857 | p.E54K | 1 |
| chr14:68191292 | p.R57S | 1 |
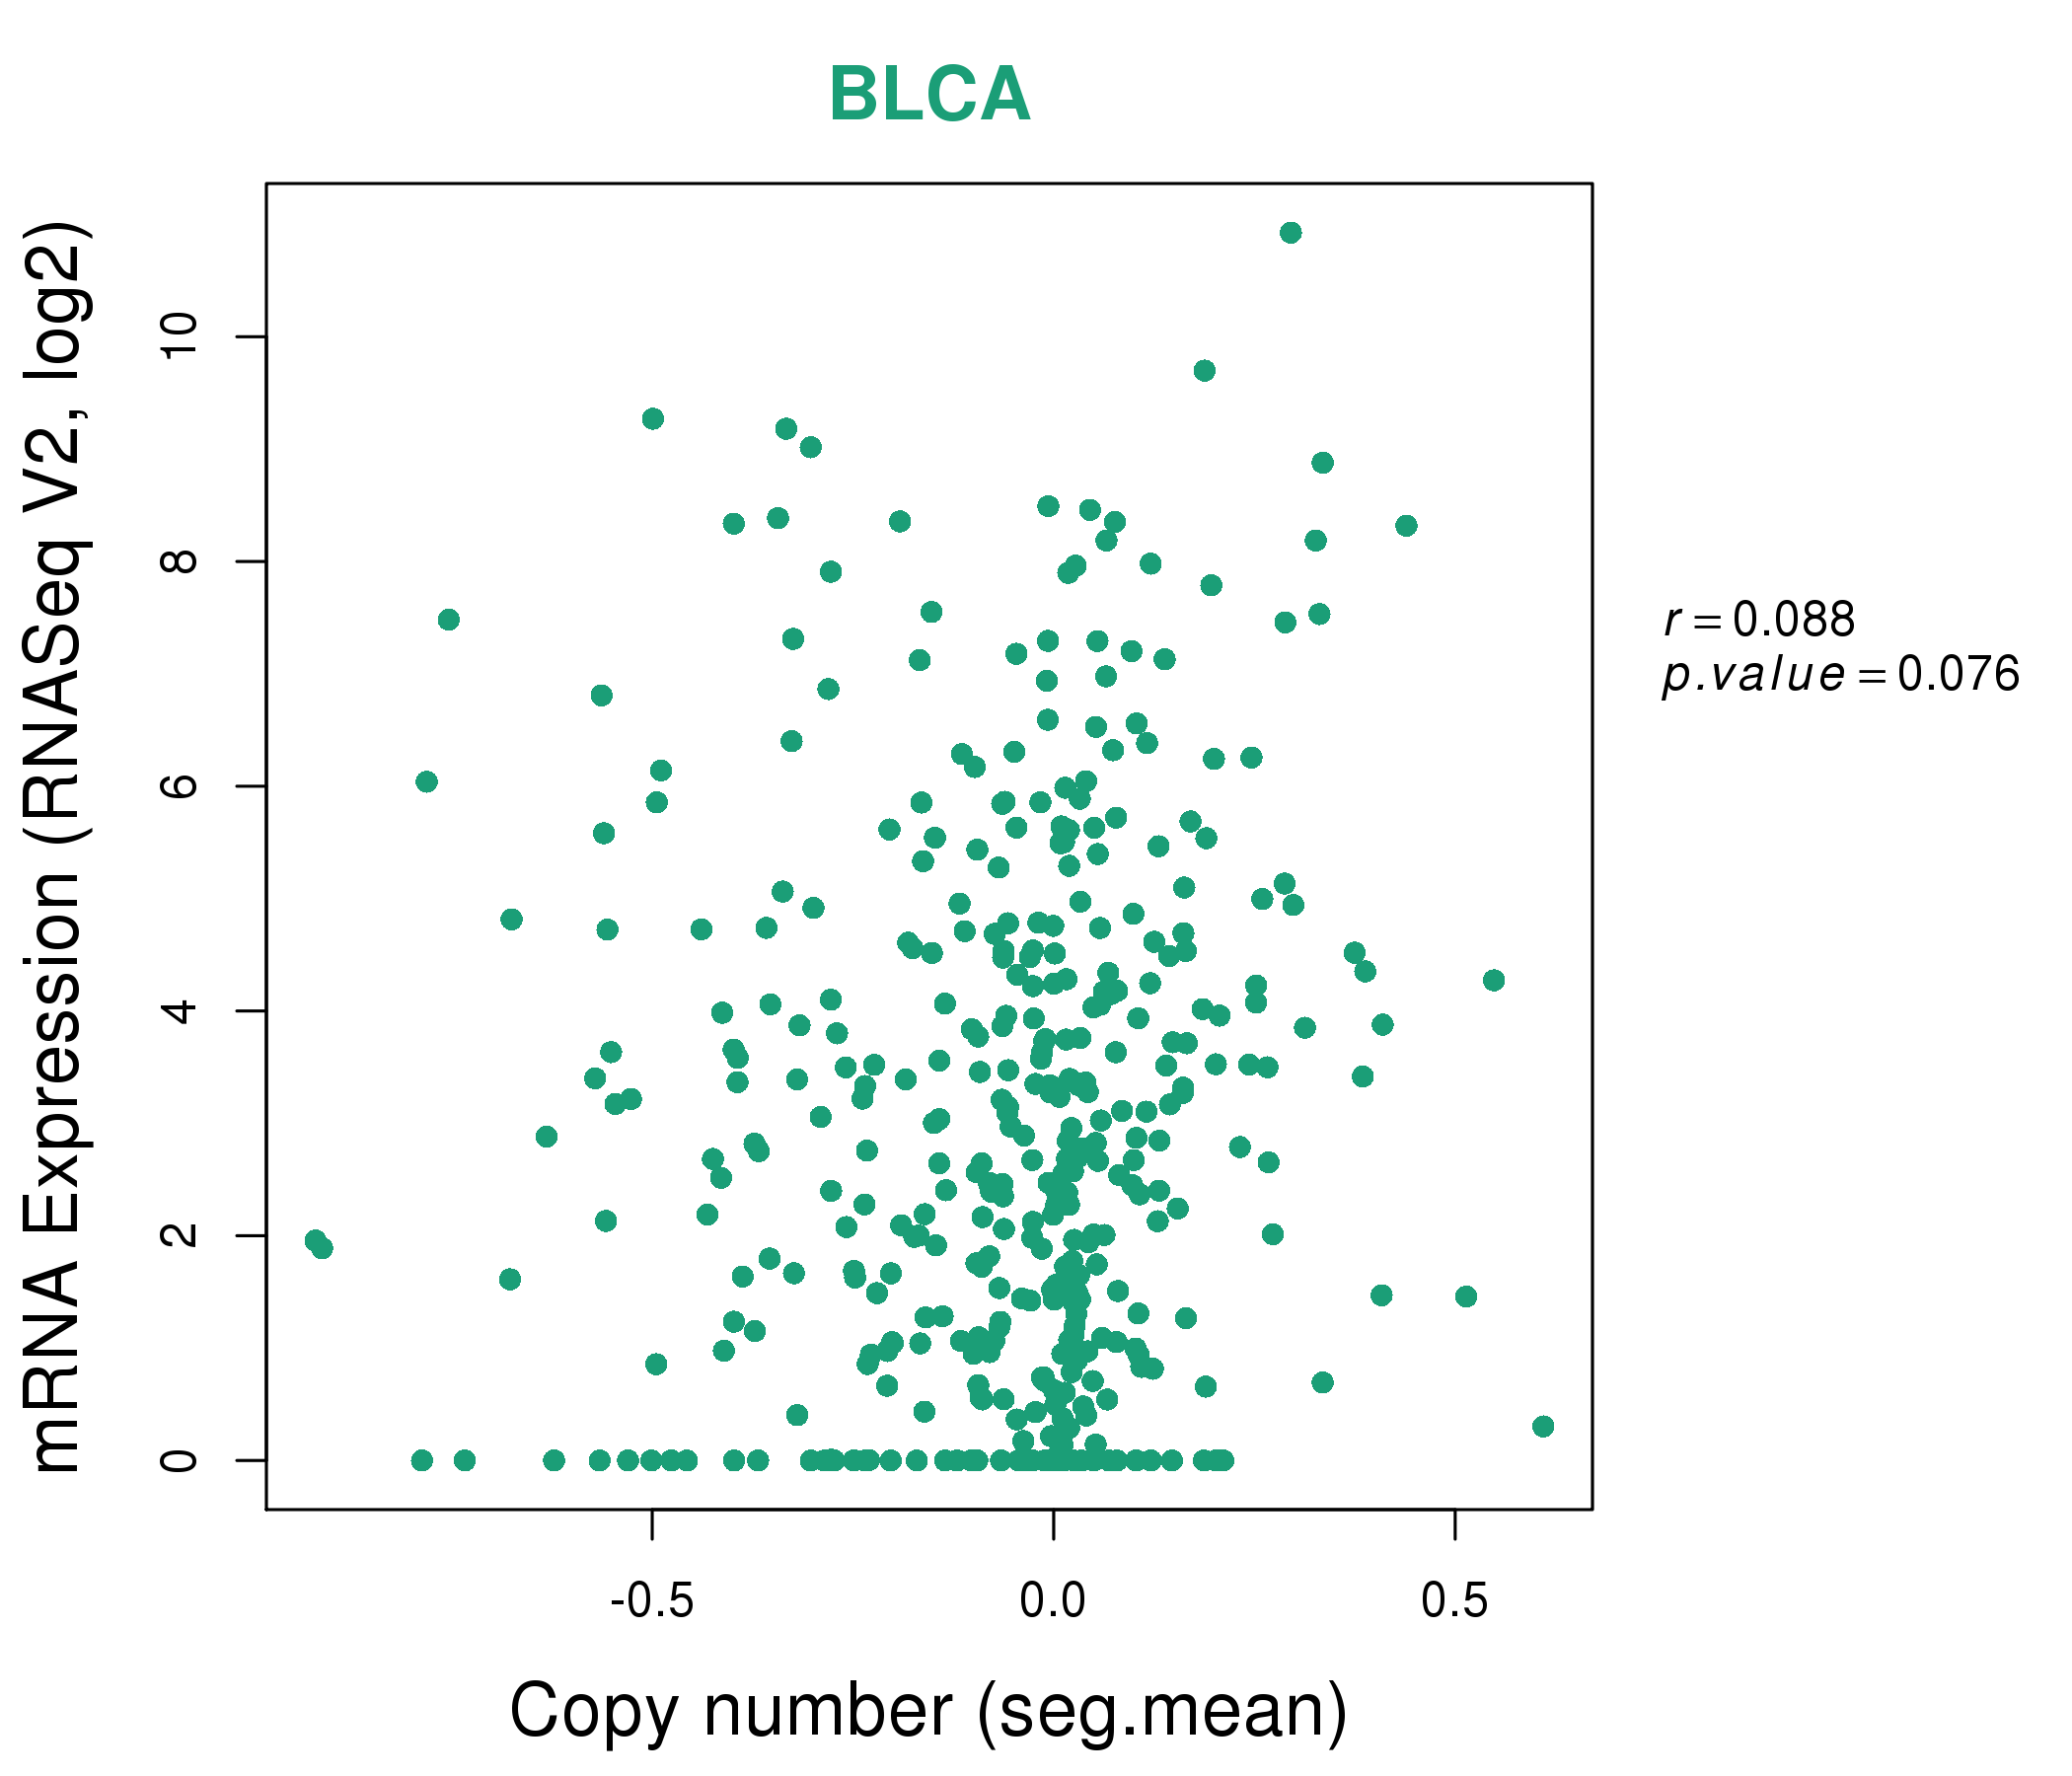
| * Copy number data were extracted from TCGA using R package TCGA-Assembler. The URLs of all public data files on TCGA DCC data server were gathered on Jan-05-2015. Function ProcessCNAData in TCGA-Assembler package was used to obtain gene-level copy number value which is calculated as the average copy number of the genomic region of a gene. |
 |
| cf) Tissue ID[Tissue type]: BLCA[Bladder Urothelial Carcinoma], BRCA[Breast invasive carcinoma], CESC[Cervical squamous cell carcinoma and endocervical adenocarcinoma], COAD[Colon adenocarcinoma], GBM[Glioblastoma multiforme], Glioma Low Grade, HNSC[Head and Neck squamous cell carcinoma], KICH[Kidney Chromophobe], KIRC[Kidney renal clear cell carcinoma], KIRP[Kidney renal papillary cell carcinoma], LAML[Acute Myeloid Leukemia], LUAD[Lung adenocarcinoma], LUSC[Lung squamous cell carcinoma], OV[Ovarian serous cystadenocarcinoma ], PAAD[Pancreatic adenocarcinoma], PRAD[Prostate adenocarcinoma], SKCM[Skin Cutaneous Melanoma], STAD[Stomach adenocarcinoma], THCA[Thyroid carcinoma], UCEC[Uterine Corpus Endometrial Carcinoma] |
| Top |
| Gene Expression for RDH12 |
| * CCLE gene expression data were extracted from CCLE_Expression_Entrez_2012-10-18.res: Gene-centric RMA-normalized mRNA expression data. |
 |
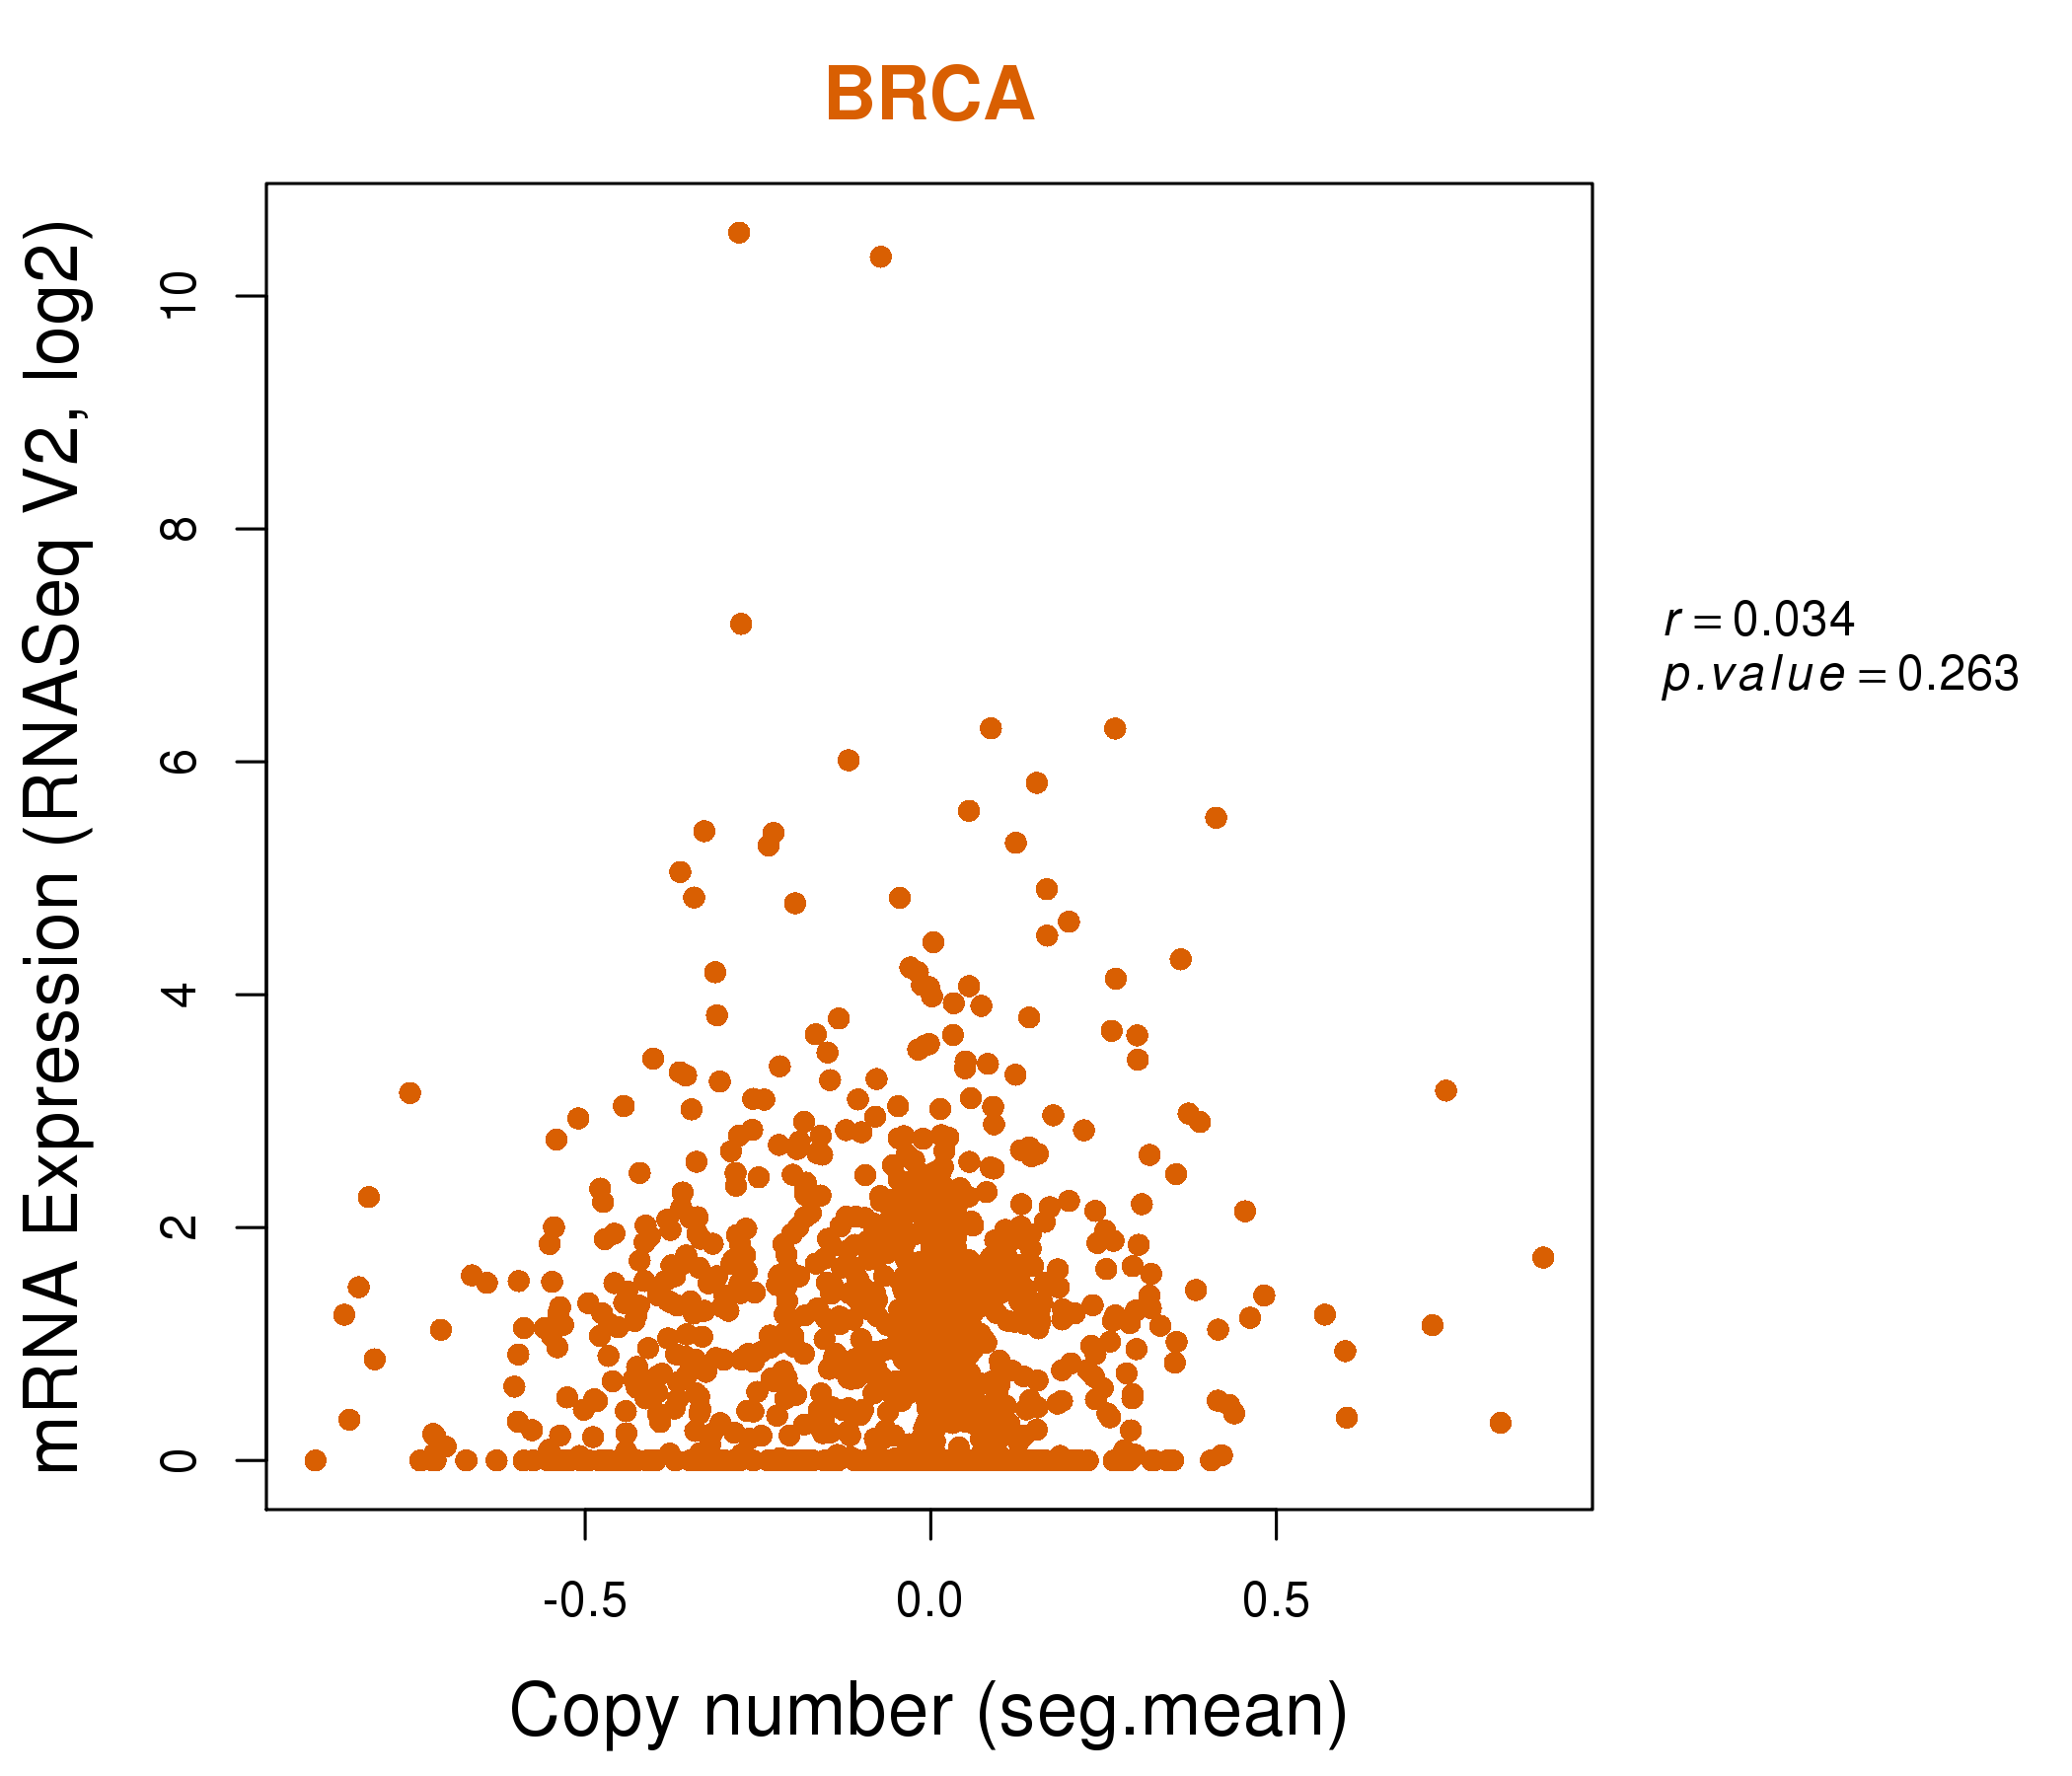
| * Normalized gene expression data of RNASeqV2 was extracted from TCGA using R package TCGA-Assembler. The URLs of all public data files on TCGA DCC data server were gathered at Jan-05-2015. Only eight cancer types have enough normal control samples for differential expression analysis. (t test, adjusted p<0.05 (using Benjamini-Hochberg FDR)) |
 |
| Top |
| * This plots show the correlation between CNV and gene expression. |
: Open all plots for all cancer types
 |
|
 |
|

| Top |
| Gene-Gene Network Information |
| * Co-Expression network figures were drawn using R package igraph. Only the top 20 genes with the highest correlations were shown. Red circle: input gene, orange circle: cell metabolism gene, sky circle: other gene |
: Open all plots for all cancer types
 |
| ||||
| AADACL2,ACER1,C1orf105,CARD18,CYP2F1,CYP3A4,DGAT2, FGF22,KPRP,KRT78,KRT79,KRTDAP,LCE1A,LCE1F, LCE2A,LIPM,NKPD1,PLA2G2F,PNPLA1,PSAPL1,RDH12 | ACP5,SOWAHD,CALM3,CPLX4,CRNN,CTSD,CYP2S1, DEFB126,GM2A,GPR32,GRN,IL17C,MICAL1,PSG9, PTCRA,RDH12,SCGB2A1,SERPINB11,SIGLEC7,SLC29A3,SNORA25 | ||||
 |
| ||||
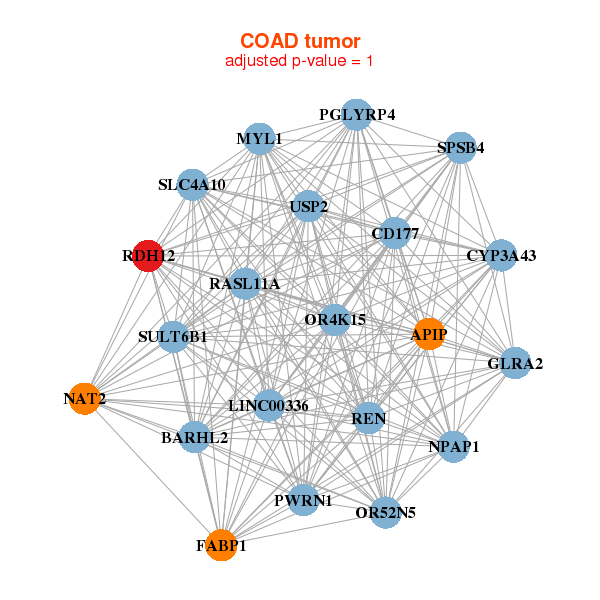
| APIP,BARHL2,NPAP1,LINC00336,CD177,CYP3A43,FABP1, GLRA2,MYL1,NAT2,OR4K15,OR52N5,PGLYRP4,PWRN1, RASL11A,RDH12,REN,SLC4A10,SPSB4,SULT6B1,USP2 | ALOX12,C10orf113,CCDC173,CCDC70,CSAG2,DEFA1B,DMP1, FAM47A,FKSG83,GKN1,HBM,IL1RAPL1,KRT3,LOC100128023, OR52N1,PATE3,PYCR2,RDH12,TBC1D28,TRMT61A,TTTY9B |


| * Co-Expression network figures were drawn using R package igraph. Only the top 20 genes with the highest correlations were shown. Red circle: input gene, orange circle: cell metabolism gene, sky circle: other gene |
: Open all plots for all cancer types
| Top |
: Open all interacting genes' information including KEGG pathway for all interacting genes from DAVID
| Top |
| Pharmacological Information for RDH12 |
| DB Category | DB Name | DB's ID and Url link |
| * Gene Centered Interaction Network. |
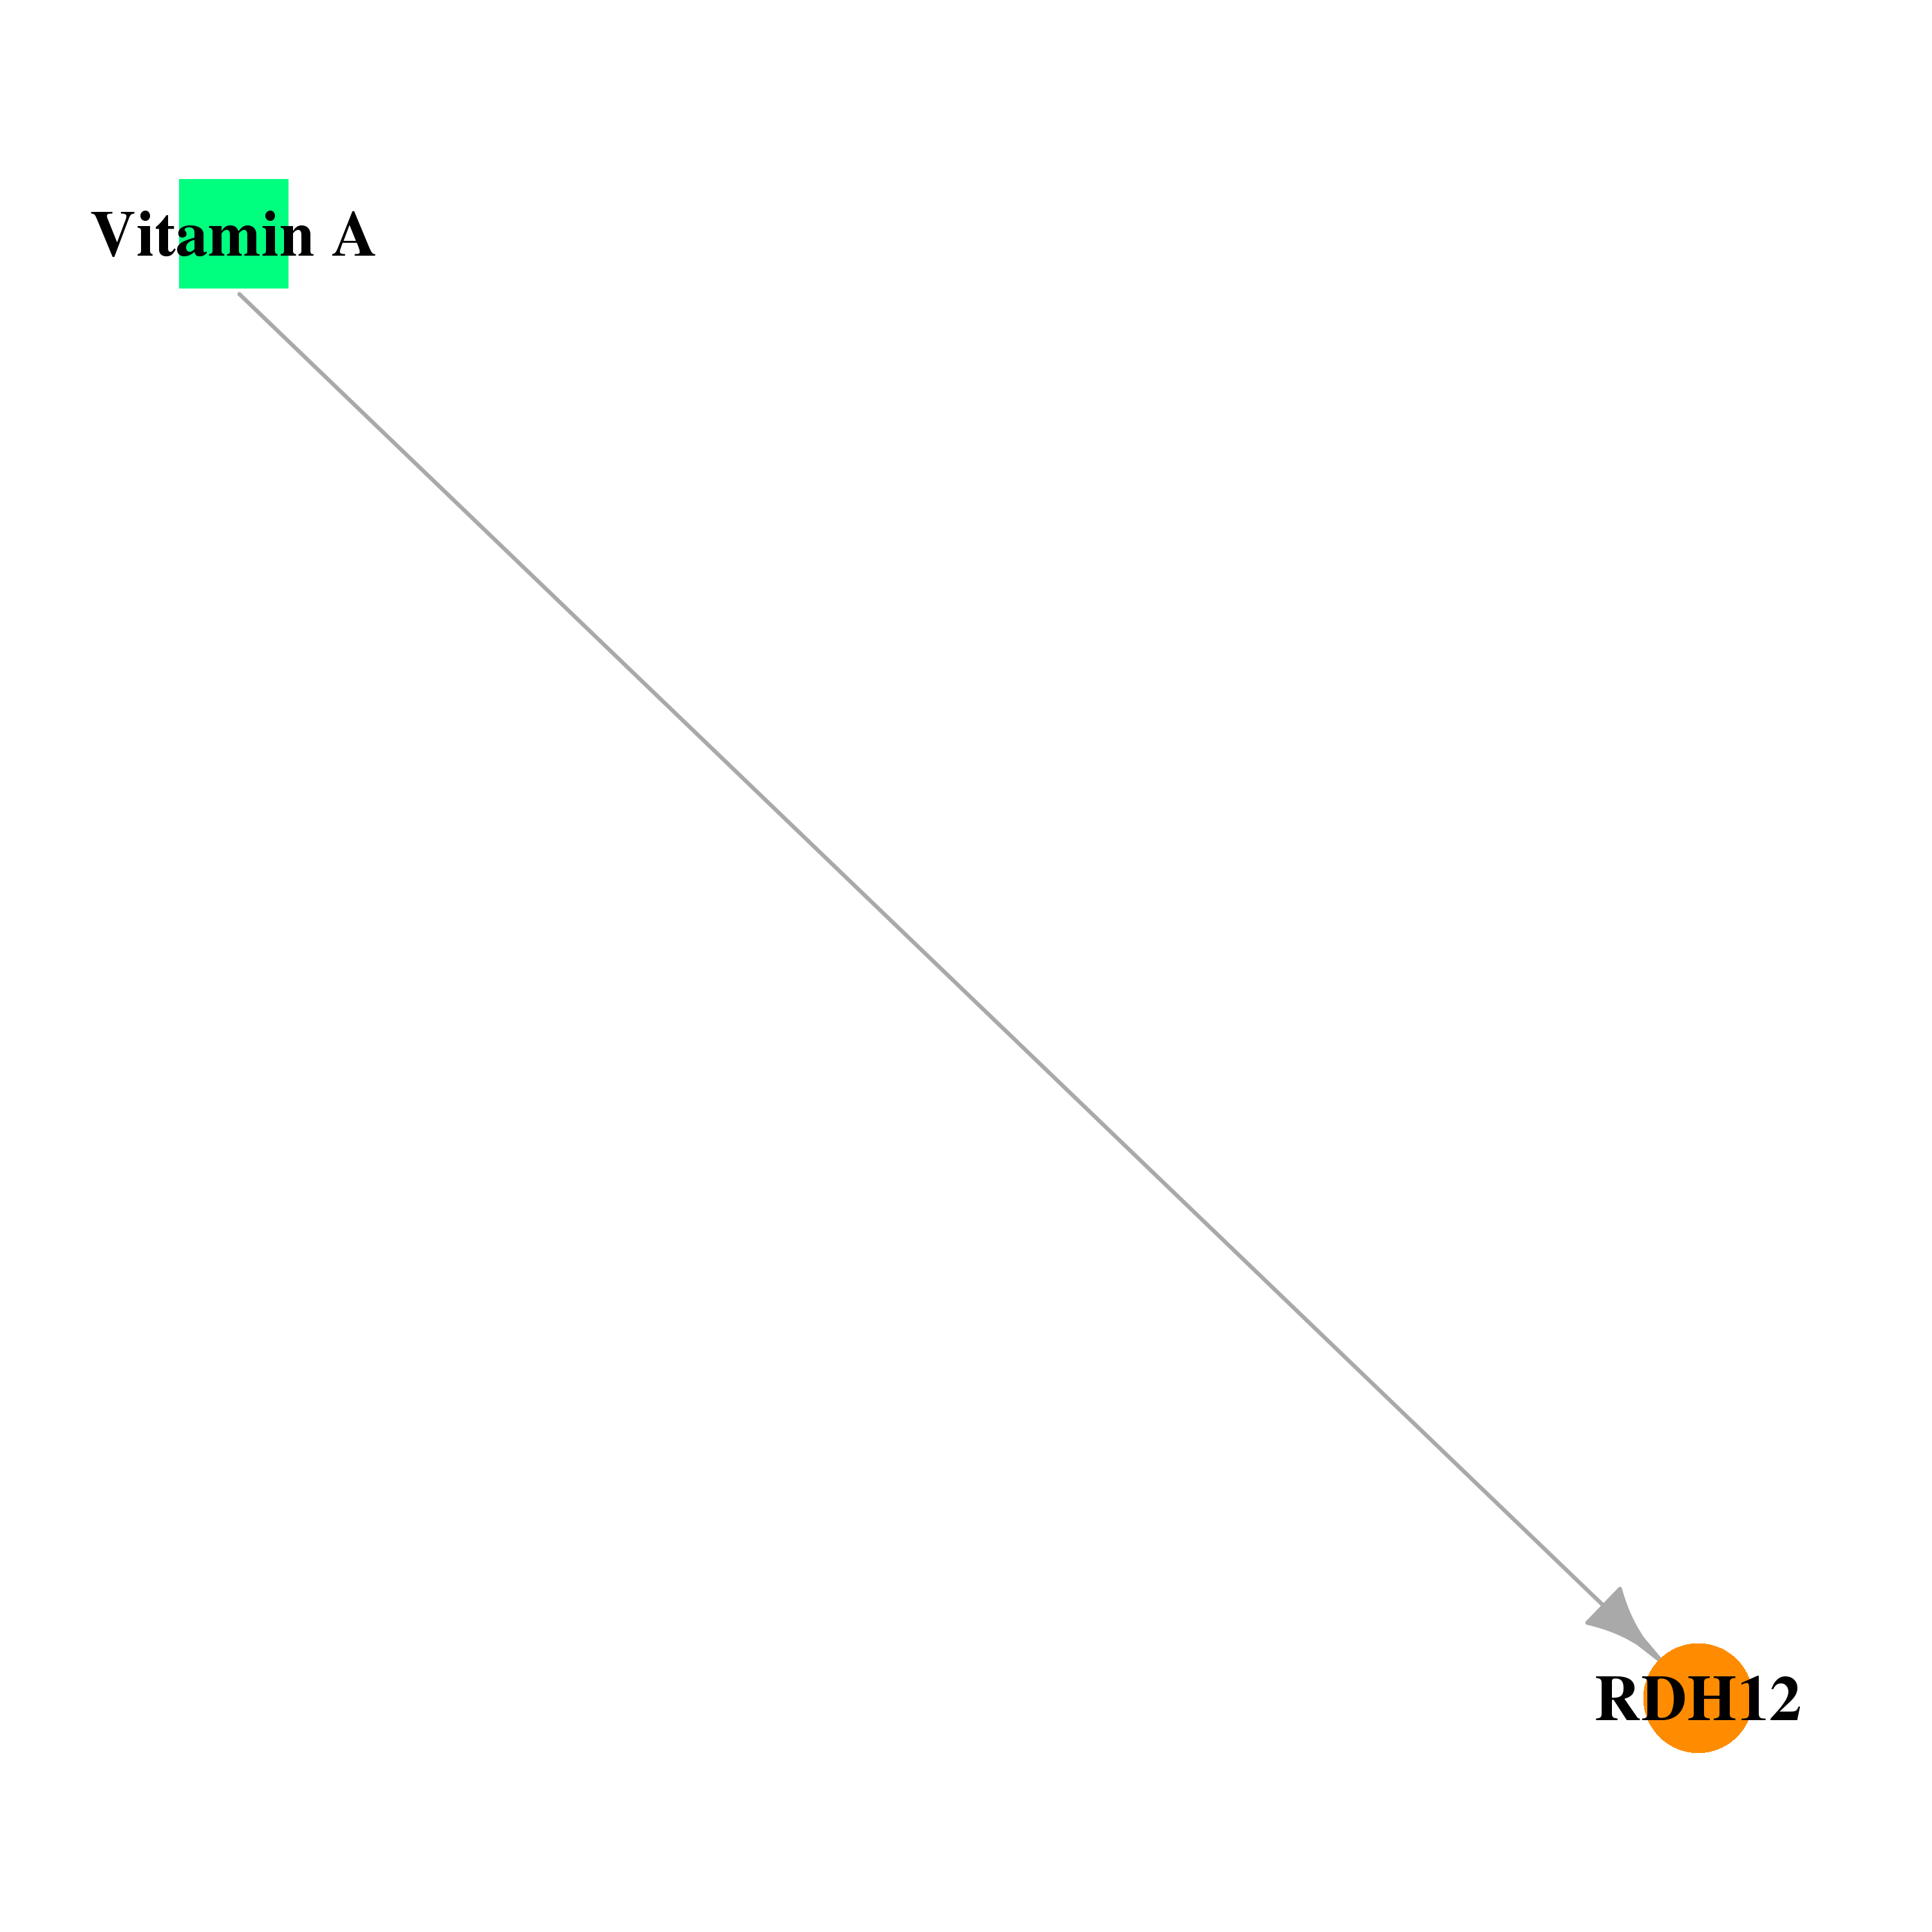 |
| * Drug Centered Interaction Network. |
| DrugBank ID | Target Name | Drug Groups | Generic Name | Drug Centered Network | Drug Structure |
| DB00162 | retinol dehydrogenase 12 (all-trans/9-cis/11-cis) | approved; nutraceutical | Vitamin A | 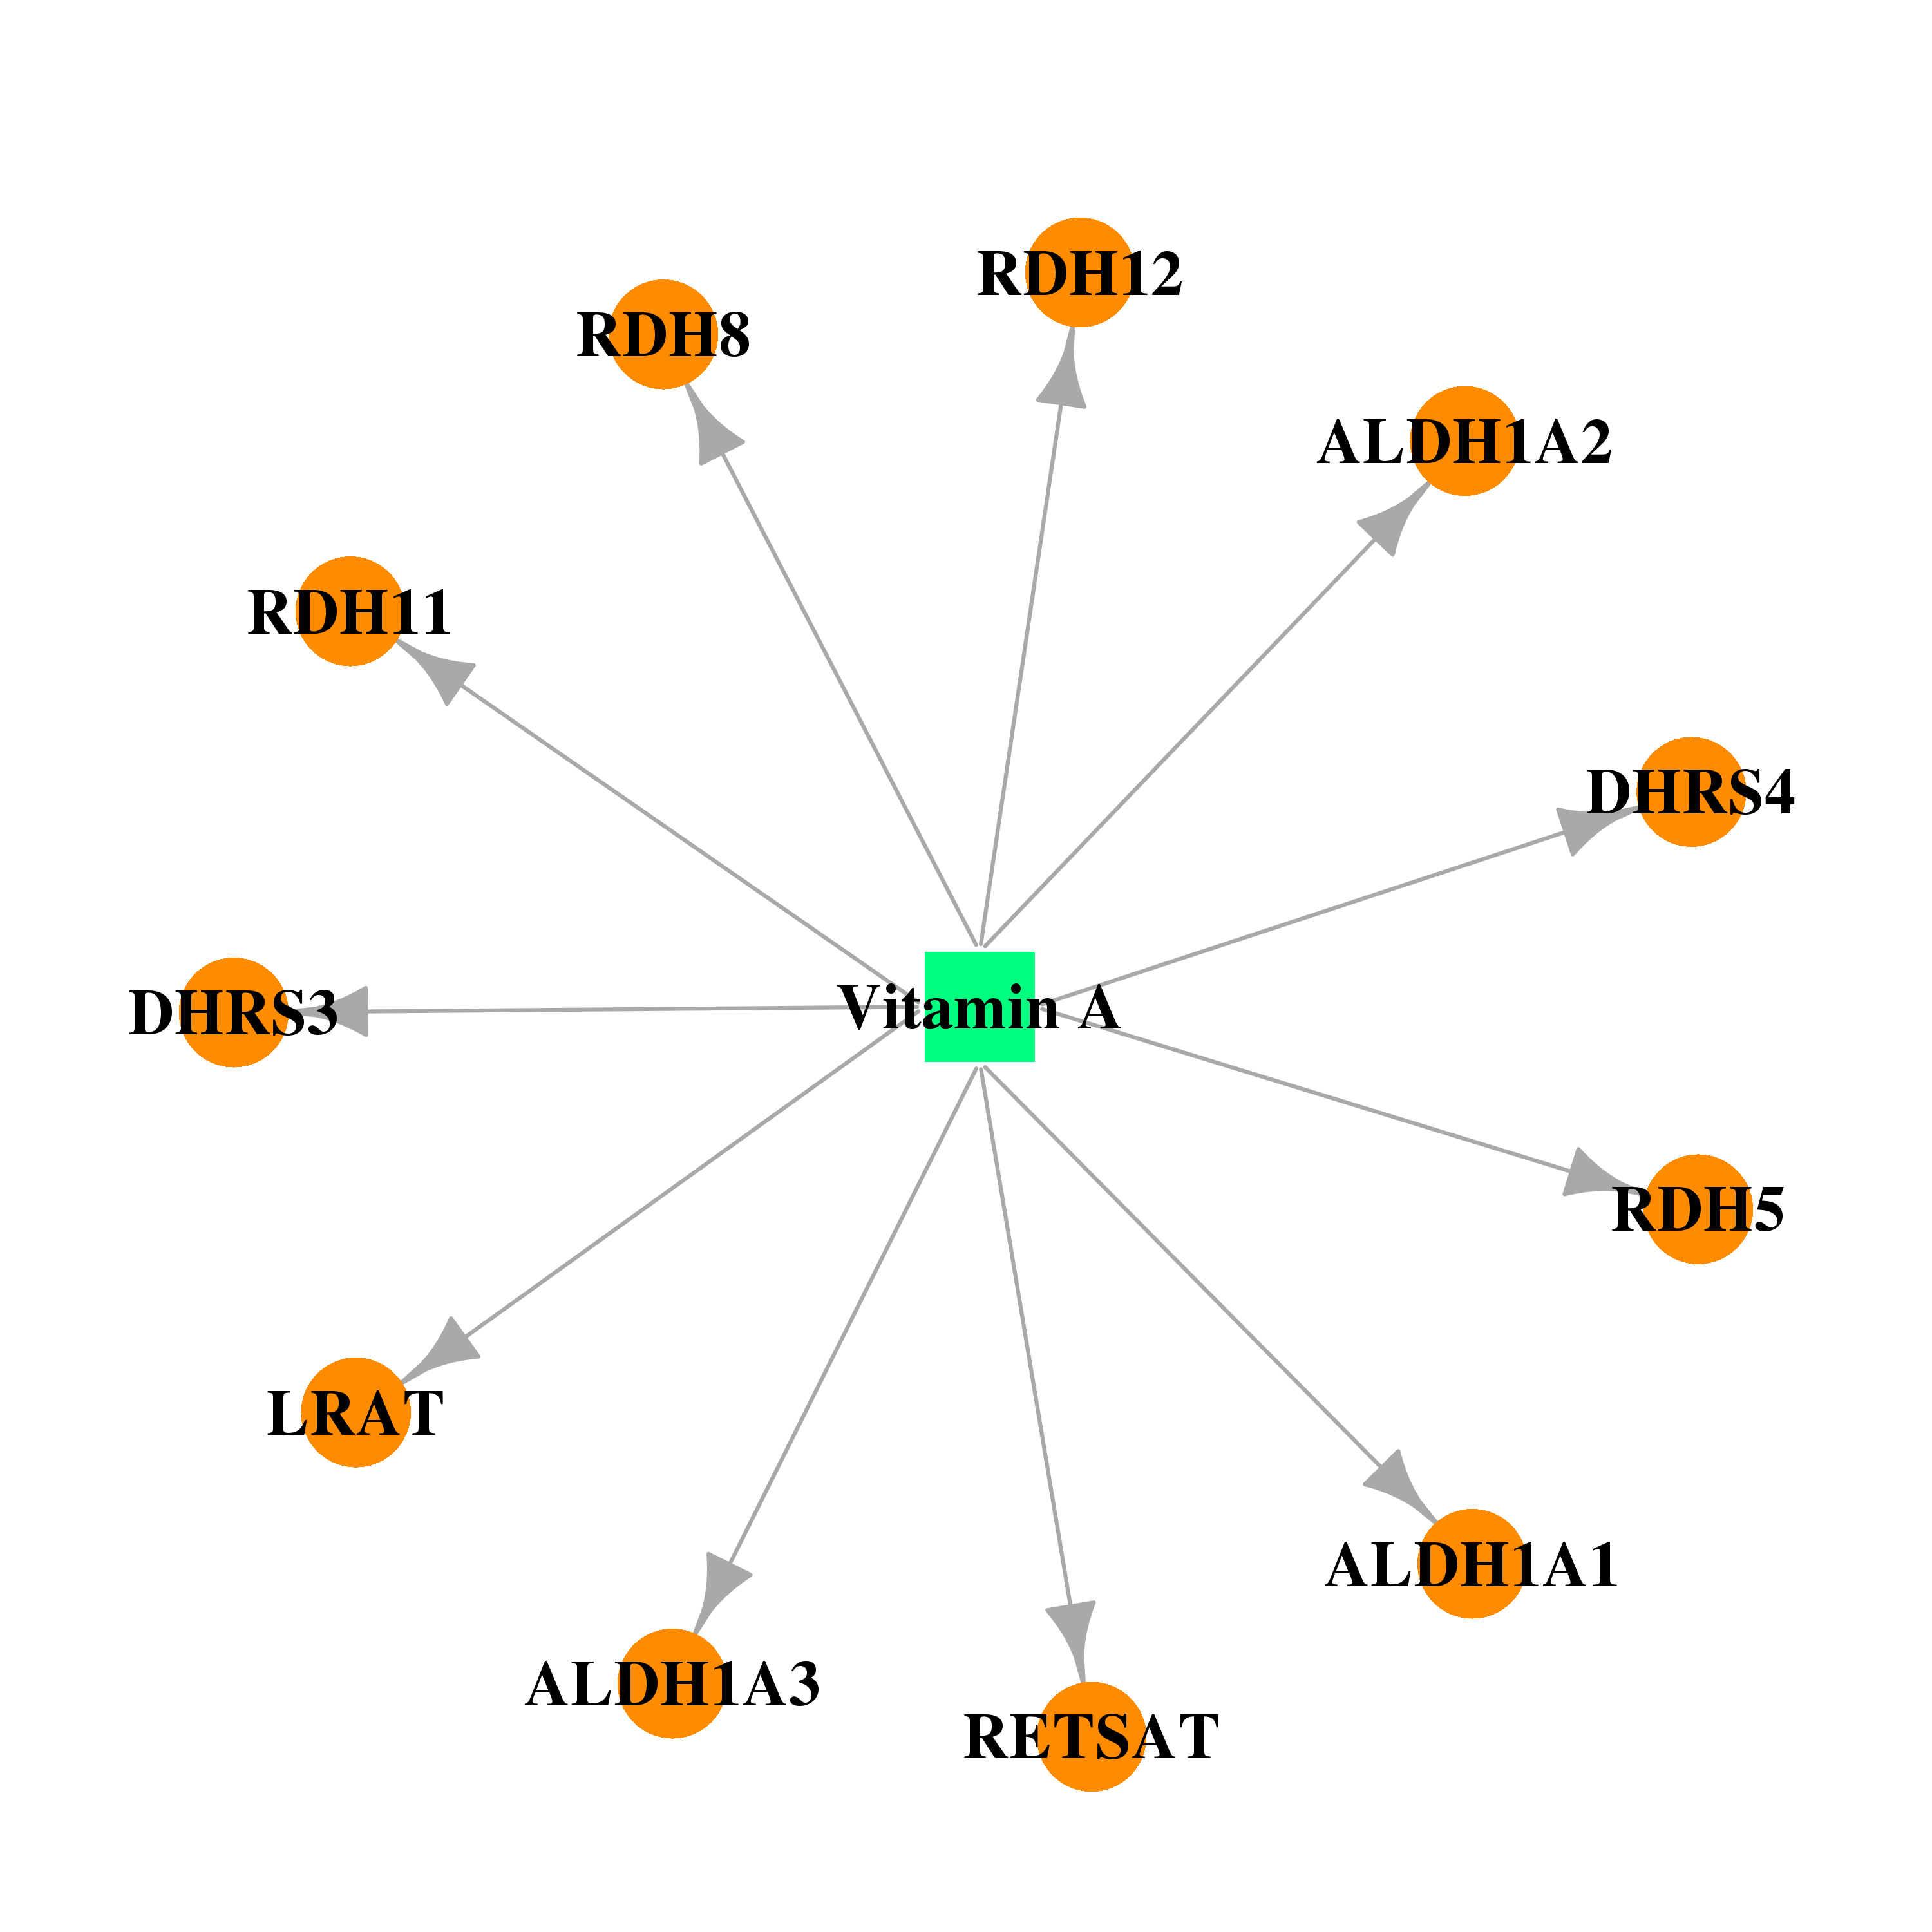 | 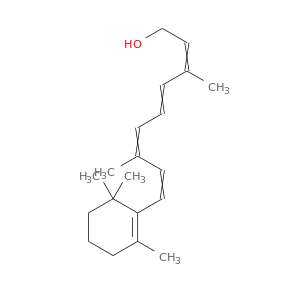 |
| Top |
| Cross referenced IDs for RDH12 |
| * We obtained these cross-references from Uniprot database. It covers 150 different DBs, 18 categories. http://www.uniprot.org/help/cross_references_section |
: Open all cross reference information
|
Copyright © 2016-Present - The Univsersity of Texas Health Science Center at Houston @ |