|
||||||||||||||||||||||||||||||||||||||||||||||||||||||||||||||||||||||||||||||||||||||||||||||||||||||||||||||||||||||||||||||||||||||||||||||||||||||||||||||||||||||||||||||||||||||||||||||||||||||||||||||||||||||||||||||||||||||||||||||||||||||||||||||||||||||||||||||||||||||||||||||||||||||||||||||||||||||||||
| |
| Phenotypic Information (metabolism pathway, cancer, disease, phenome) |
| |
| |
| Gene-Gene Network Information: Co-Expression Network, Interacting Genes & KEGG |
| |
|


| Gene Summary for NCAN |
| Basic gene info. | Gene symbol | NCAN |
| Gene name | neurocan | |
| Synonyms | CSPG3 | |
| Cytomap | UCSC genome browser: 19p12 | |
| Genomic location | chr19 :19322781-19363061 | |
| Type of gene | protein-coding | |
| RefGenes | NM_004386.2, | |
| Ensembl id | ENSG00000130287 | |
| Description | chondroitin sulfate proteoglycan 3 (neurocan)neurocan core proteinneurocan proteoglycan | |
| Modification date | 20141207 | |
| dbXrefs | MIM : 600826 | |
| HGNC : HGNC | ||
| Ensembl : ENSG00000130287 | ||
| HPRD : 02897 | ||
| Vega : OTTHUMG00000182218 | ||
| Protein | UniProt: go to UniProt's Cross Reference DB Table | |
| Expression | CleanEX: HS_NCAN | |
| BioGPS: 1463 | ||
| Gene Expression Atlas: ENSG00000130287 | ||
| The Human Protein Atlas: ENSG00000130287 | ||
| Pathway | NCI Pathway Interaction Database: NCAN | |
| KEGG: NCAN | ||
| REACTOME: NCAN | ||
| ConsensusPathDB | ||
| Pathway Commons: NCAN | ||
| Metabolism | MetaCyc: NCAN | |
| HUMANCyc: NCAN | ||
| Regulation | Ensembl's Regulation: ENSG00000130287 | |
| miRBase: chr19 :19,322,781-19,363,061 | ||
| TargetScan: NM_004386 | ||
| cisRED: ENSG00000130287 | ||
| Context | iHOP: NCAN | |
| cancer metabolism search in PubMed: NCAN | ||
| UCL Cancer Institute: NCAN | ||
| Assigned class in ccmGDB | C | |
| Top |
| Phenotypic Information for NCAN(metabolism pathway, cancer, disease, phenome) |
| Cancer | CGAP: NCAN |
| Familial Cancer Database: NCAN | |
| * This gene is included in those cancer gene databases. |
|
|
|
|
|
| . | ||||||||||||||||||||||||||||||||||||||||||||||||||||||||||||||||||||||||||||||||||||||||||||||||||||||||||||||||||||||||||||||||||||||||||||||||||||||||||||||||||||||||||||||||||||||||||||||||||||||||||||||||||||||||||||||||||||||||||||||||||||||||||||||||||||||||||||||||||||||||||||||||||||||||||||||||||||
Oncogene 1 | Significant driver gene in | |||||||||||||||||||||||||||||||||||||||||||||||||||||||||||||||||||||||||||||||||||||||||||||||||||||||||||||||||||||||||||||||||||||||||||||||||||||||||||||||||||||||||||||||||||||||||||||||||||||||||||||||||||||||||||||||||||||||||||||||||||||||||||||||||||||||||||||||||||||||||||||||||||||||||||||||||||||||||
| cf) number; DB name 1 Oncogene; http://nar.oxfordjournals.org/content/35/suppl_1/D721.long, 2 Tumor Suppressor gene; https://bioinfo.uth.edu/TSGene/, 3 Cancer Gene Census; http://www.nature.com/nrc/journal/v4/n3/abs/nrc1299.html, 4 CancerGenes; http://nar.oxfordjournals.org/content/35/suppl_1/D721.long, 5 Network of Cancer Gene; http://ncg.kcl.ac.uk/index.php, 1Therapeutic Vulnerabilities in Cancer; http://cbio.mskcc.org/cancergenomics/statius/ |
| REACTOME_METABOLISM_OF_CARBOHYDRATES | |
| OMIM | |
| Orphanet | |
| Disease | KEGG Disease: NCAN |
| MedGen: NCAN (Human Medical Genetics with Condition) | |
| ClinVar: NCAN | |
| Phenotype | MGI: NCAN (International Mouse Phenotyping Consortium) |
| PhenomicDB: NCAN | |
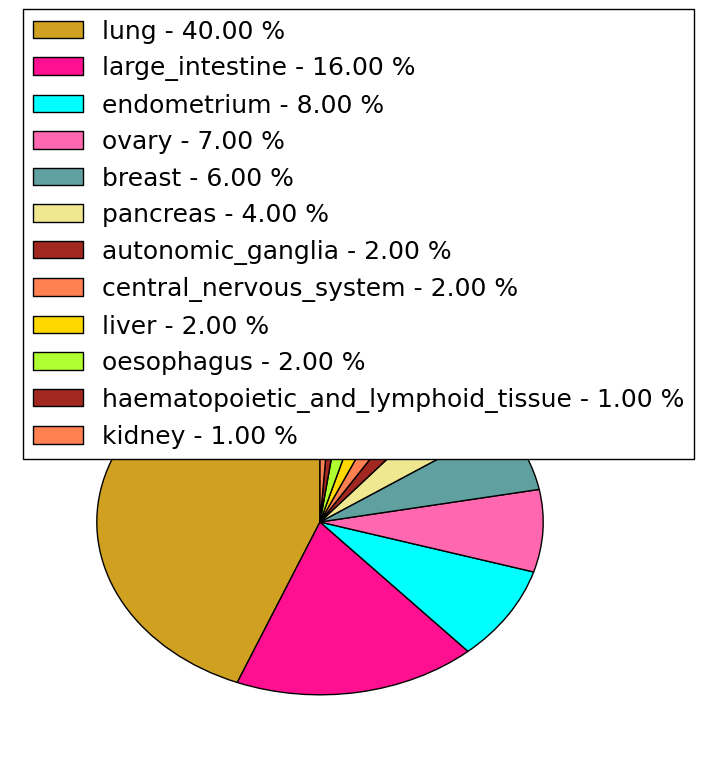
| Mutations for NCAN |
| * Under tables are showing count per each tissue to give us broad intuition about tissue specific mutation patterns.You can go to the detailed page for each mutation database's web site. |
| - Statistics for Tissue and Mutation type | Top |
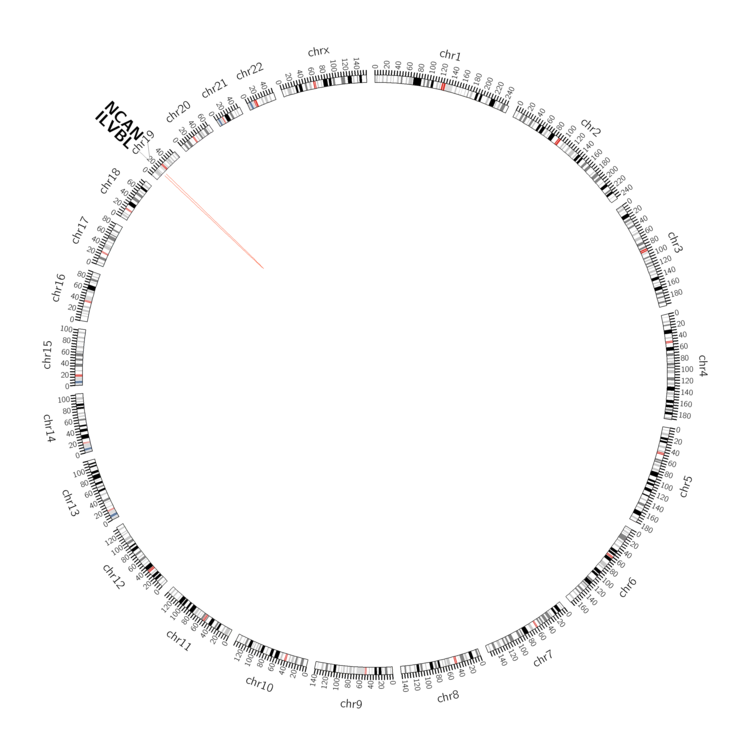 |
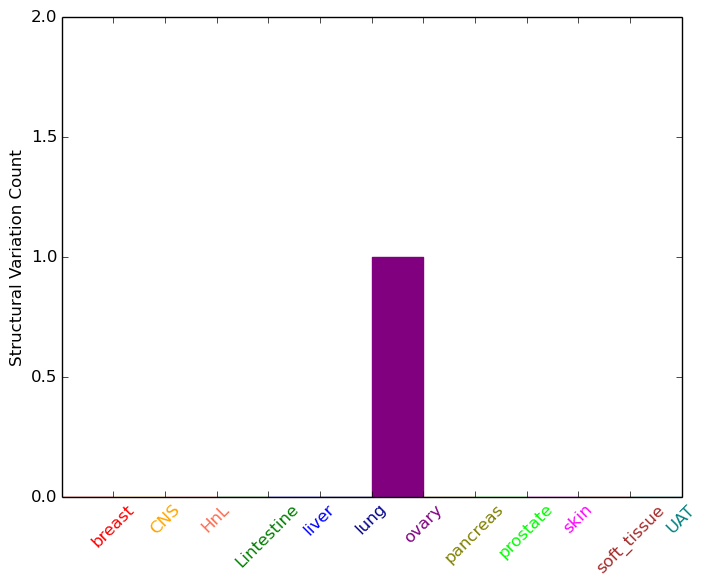
| - For Inter-chromosomal Variations |
| There's no inter-chromosomal structural variation. |
| - For Intra-chromosomal Variations |
| * Intra-chromosomal variantions includes 'intrachromosomal amplicon to amplicon', 'intrachromosomal amplicon to non-amplified dna', 'intrachromosomal deletion', 'intrachromosomal fold-back inversion', 'intrachromosomal inversion', 'intrachromosomal tandem duplication', 'Intrachromosomal unknown type', 'intrachromosomal with inverted orientation', 'intrachromosomal with non-inverted orientation'. |
 |
| Sample | Symbol_a | Chr_a | Start_a | End_a | Symbol_b | Chr_b | Start_b | End_b |
| ovary | NCAN | chr19 | 19325939 | 19325959 | ILVBL | chr19 | 15230744 | 15230764 |
| cf) Tissue number; Tissue name (1;Breast, 2;Central_nervous_system, 3;Haematopoietic_and_lymphoid_tissue, 4;Large_intestine, 5;Liver, 6;Lung, 7;Ovary, 8;Pancreas, 9;Prostate, 10;Skin, 11;Soft_tissue, 12;Upper_aerodigestive_tract) |
| * From mRNA Sanger sequences, Chitars2.0 arranged chimeric transcripts. This table shows NCAN related fusion information. |
| ID | Head Gene | Tail Gene | Accession | Gene_a | qStart_a | qEnd_a | Chromosome_a | tStart_a | tEnd_a | Gene_a | qStart_a | qEnd_a | Chromosome_a | tStart_a | tEnd_a |
| T05316 | ZNF605 | 1 | 209 | 12 | 133504765 | 133504973 | NCAN | 209 | 339 | 19 | 19360841 | 19360971 | |
| Top |
| Mutation type/ Tissue ID | brca | cns | cerv | endome | haematopo | kidn | Lintest | liver | lung | ns | ovary | pancre | prost | skin | stoma | thyro | urina | |||
| Total # sample | 2 | 2 | ||||||||||||||||||
| GAIN (# sample) | 2 | 2 | ||||||||||||||||||
| LOSS (# sample) |
| cf) Tissue ID; Tissue type (1; Breast, 2; Central_nervous_system, 3; Cervix, 4; Endometrium, 5; Haematopoietic_and_lymphoid_tissue, 6; Kidney, 7; Large_intestine, 8; Liver, 9; Lung, 10; NS, 11; Ovary, 12; Pancreas, 13; Prostate, 14; Skin, 15; Stomach, 16; Thyroid, 17; Urinary_tract) |
| Top |
|
 |
| Top |
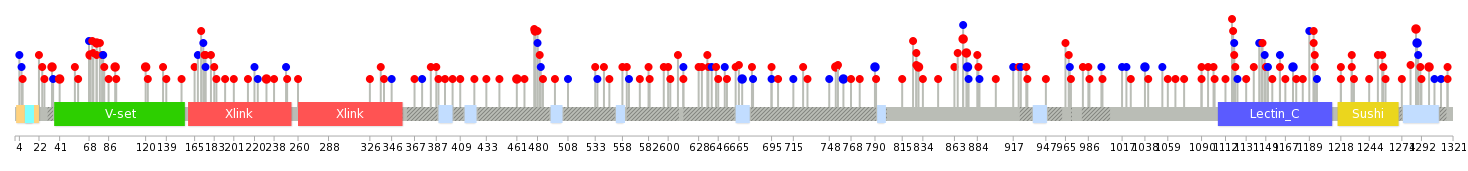
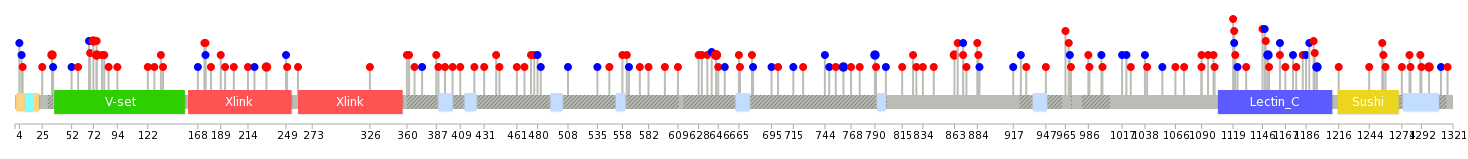
| Stat. for Non-Synonymous SNVs (# total SNVs=113) | (# total SNVs=35) |
 |  |
(# total SNVs=1) | (# total SNVs=0) |
 |
| Top |
| * When you move the cursor on each content, you can see more deailed mutation information on the Tooltip. Those are primary_site,primary_histology,mutation(aa),pubmedID. |
| GRCh37 position | Mutation(aa) | Unique sampleID count |
| chr19:19329772-19329772 | p.K41M | 2 |
| chr19:19339050-19339050 | p.T874M | 2 |
| chr19:19337655-19337655 | p.R478M | 2 |
| chr19:19339054-19339054 | p.T875T | 2 |
| chr19:19360615-19360615 | p.H1287Q | 2 |
| chr19:19356206-19356206 | p.G1193W | 2 |
| chr19:19338690-19338690 | p.P754L | 2 |
| chr19:19360618-19360618 | p.Q1288Q | 2 |
| chr19:19338433-19338433 | p.P668P | 2 |
| chr19:19329924-19329924 | p.P92S | 2 |
| Top |
|
 |
| Point Mutation/ Tissue ID | 1 | 2 | 3 | 4 | 5 | 6 | 7 | 8 | 9 | 10 | 11 | 12 | 13 | 14 | 15 | 16 | 17 | 18 | 19 | 20 |
| # sample | 3 | 4 | 2 | 13 | 4 | 9 | 2 | 23 | 14 | 7 | 4 | 26 | 22 | 1 | 12 | |||||
| # mutation | 3 | 4 | 2 | 14 | 4 | 9 | 2 | 24 | 15 | 7 | 4 | 38 | 24 | 1 | 15 | |||||
| nonsynonymous SNV | 3 | 2 | 2 | 12 | 2 | 6 | 1 | 18 | 12 | 7 | 2 | 25 | 19 | 1 | 8 | |||||
| synonymous SNV | 2 | 2 | 2 | 3 | 1 | 6 | 3 | 2 | 13 | 5 | 7 |
| cf) Tissue ID; Tissue type (1; BLCA[Bladder Urothelial Carcinoma], 2; BRCA[Breast invasive carcinoma], 3; CESC[Cervical squamous cell carcinoma and endocervical adenocarcinoma], 4; COAD[Colon adenocarcinoma], 5; GBM[Glioblastoma multiforme], 6; Glioma Low Grade, 7; HNSC[Head and Neck squamous cell carcinoma], 8; KICH[Kidney Chromophobe], 9; KIRC[Kidney renal clear cell carcinoma], 10; KIRP[Kidney renal papillary cell carcinoma], 11; LAML[Acute Myeloid Leukemia], 12; LUAD[Lung adenocarcinoma], 13; LUSC[Lung squamous cell carcinoma], 14; OV[Ovarian serous cystadenocarcinoma ], 15; PAAD[Pancreatic adenocarcinoma], 16; PRAD[Prostate adenocarcinoma], 17; SKCM[Skin Cutaneous Melanoma], 18:STAD[Stomach adenocarcinoma], 19:THCA[Thyroid carcinoma], 20:UCEC[Uterine Corpus Endometrial Carcinoma]) |
| Top |
| * We represented just top 10 SNVs. When you move the cursor on each content, you can see more deailed mutation information on the Tooltip. Those are primary_site, primary_histology, mutation(aa), pubmedID. |
| Genomic Position | Mutation(aa) | Unique sampleID count |
| chr19:19338359 | p.L644V | 3 |
| chr19:19335156 | p.R75W | 2 |
| chr19:19329864 | p.R1299H | 2 |
| chr19:19338799 | p.V863L | 2 |
| chr19:19329873 | p.R231H | 2 |
| chr19:19334879 | p.N1196N | 2 |
| chr19:19349079 | p.F761F | 2 |
| chr19:19329750 | p.E34K | 2 |
| chr19:19351455 | p.L790L | 2 |
| chr19:19338712 | p.I1151I | 2 |
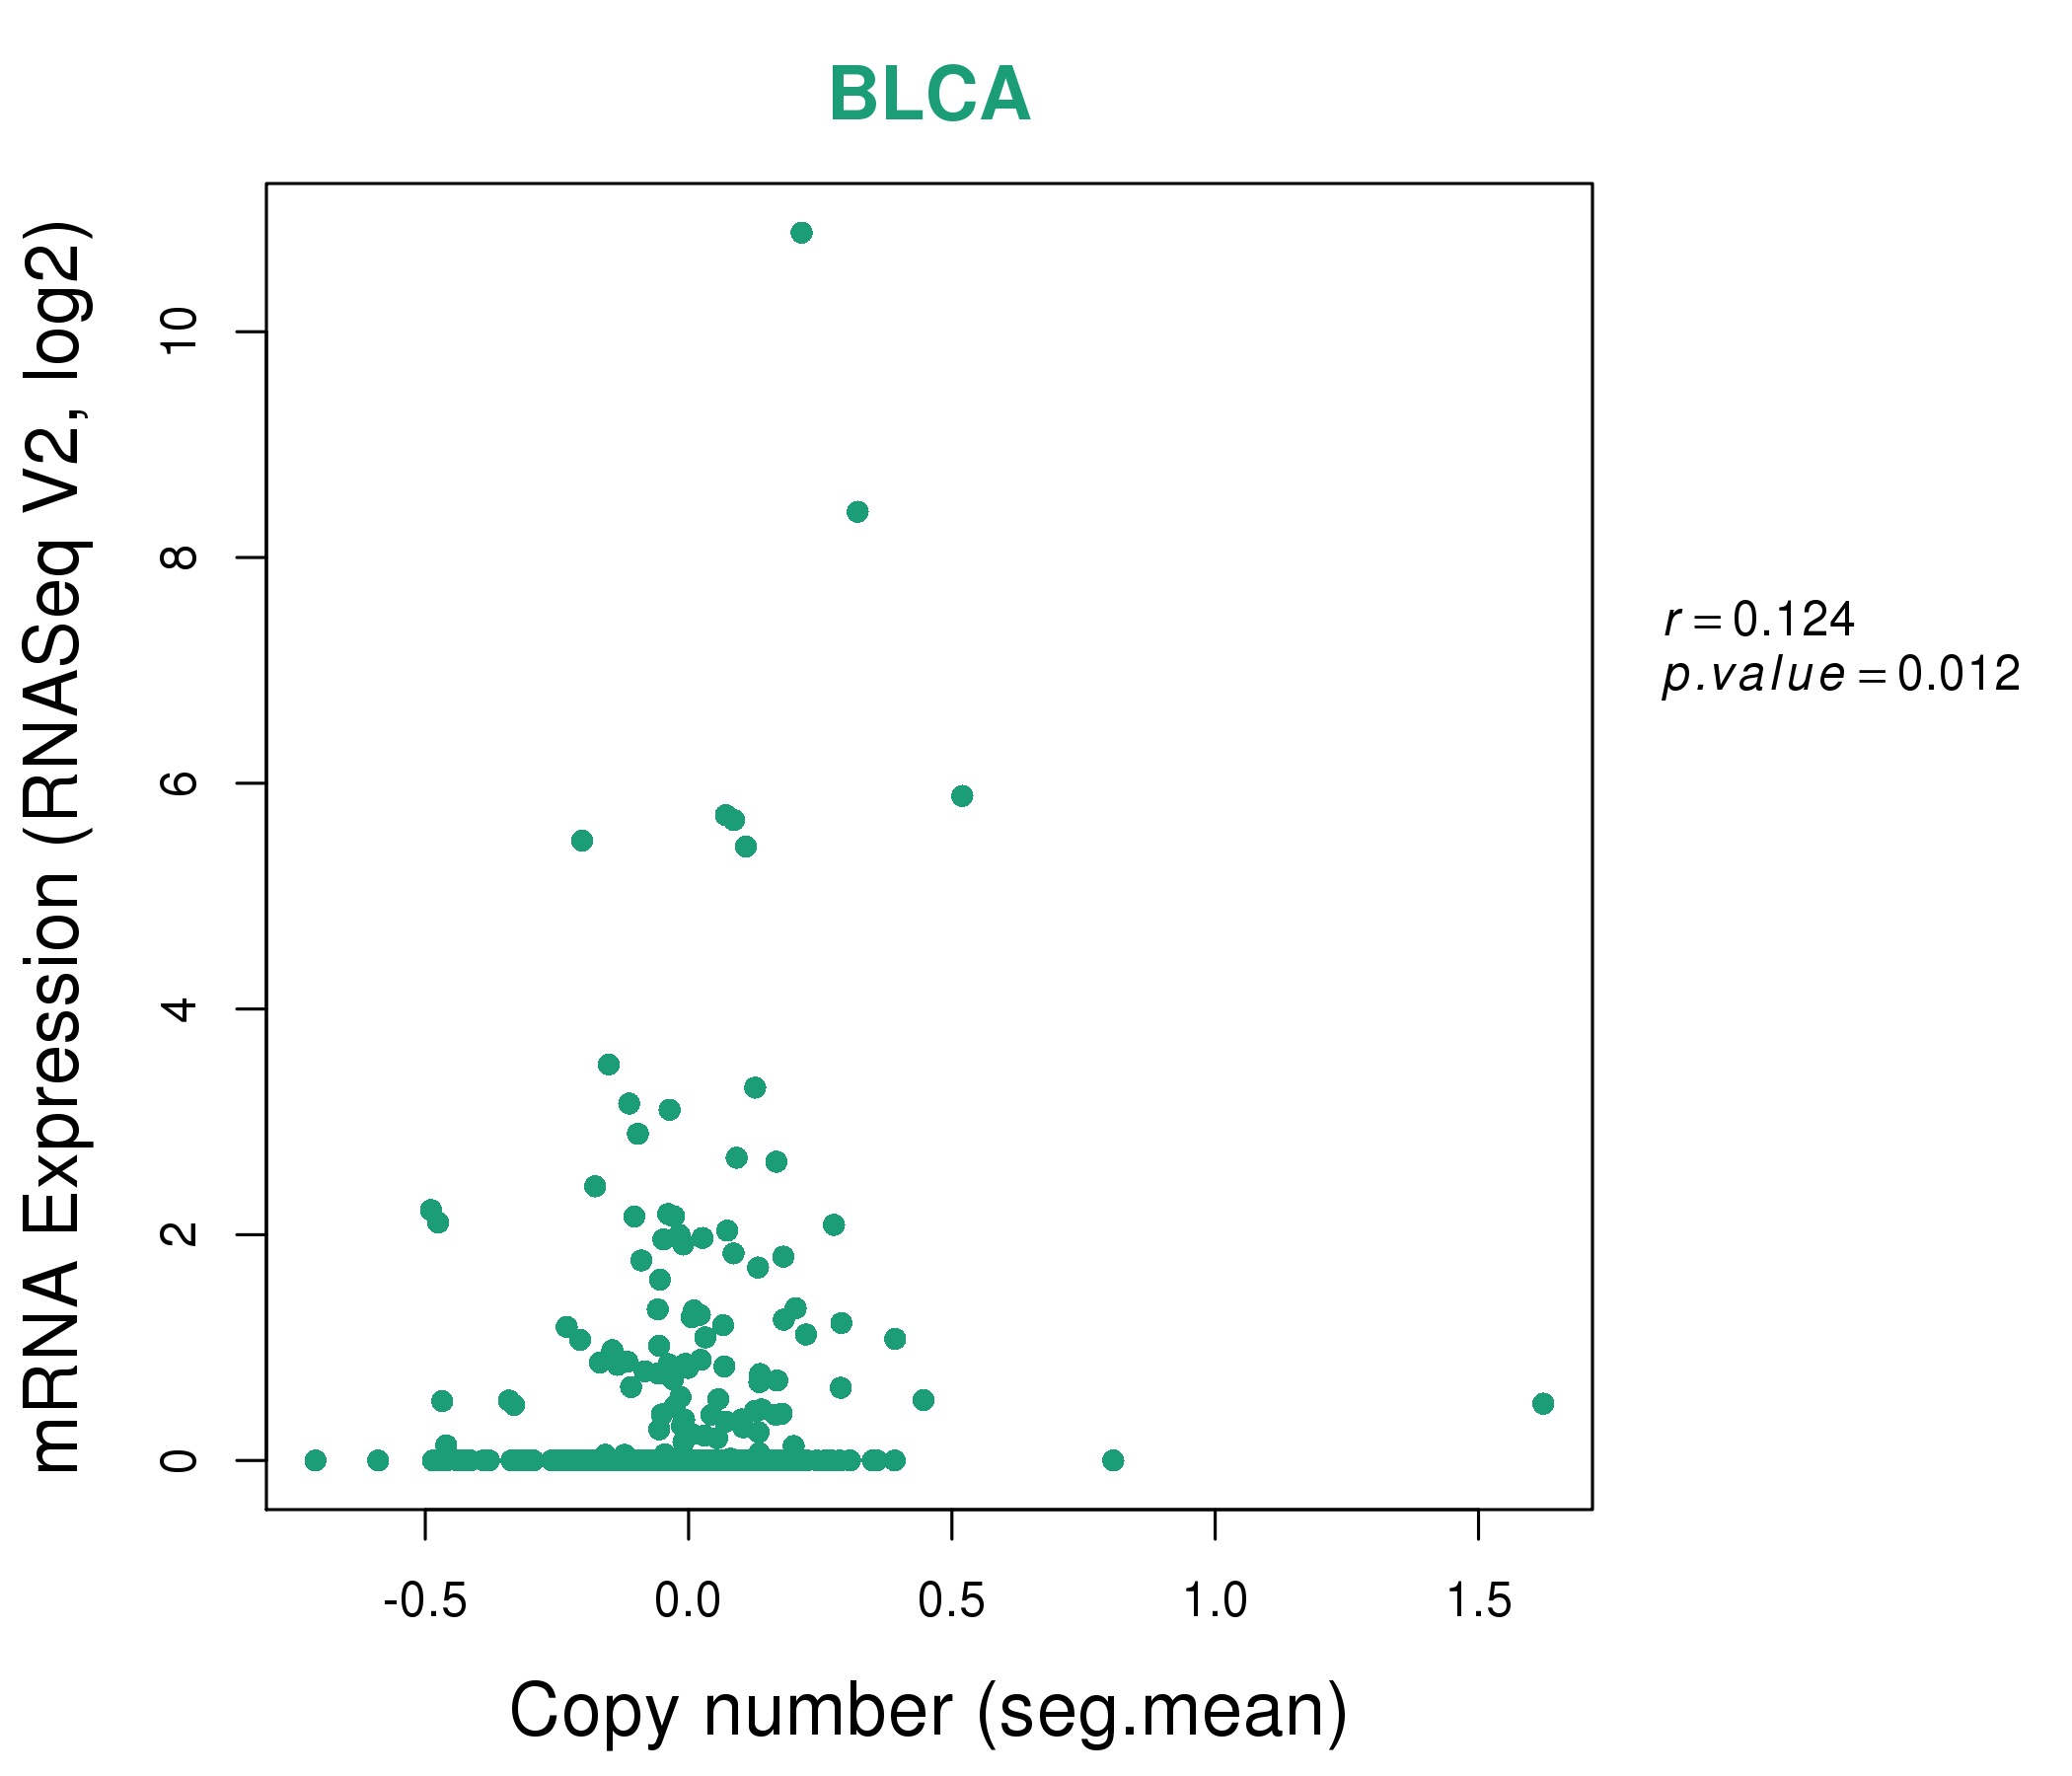
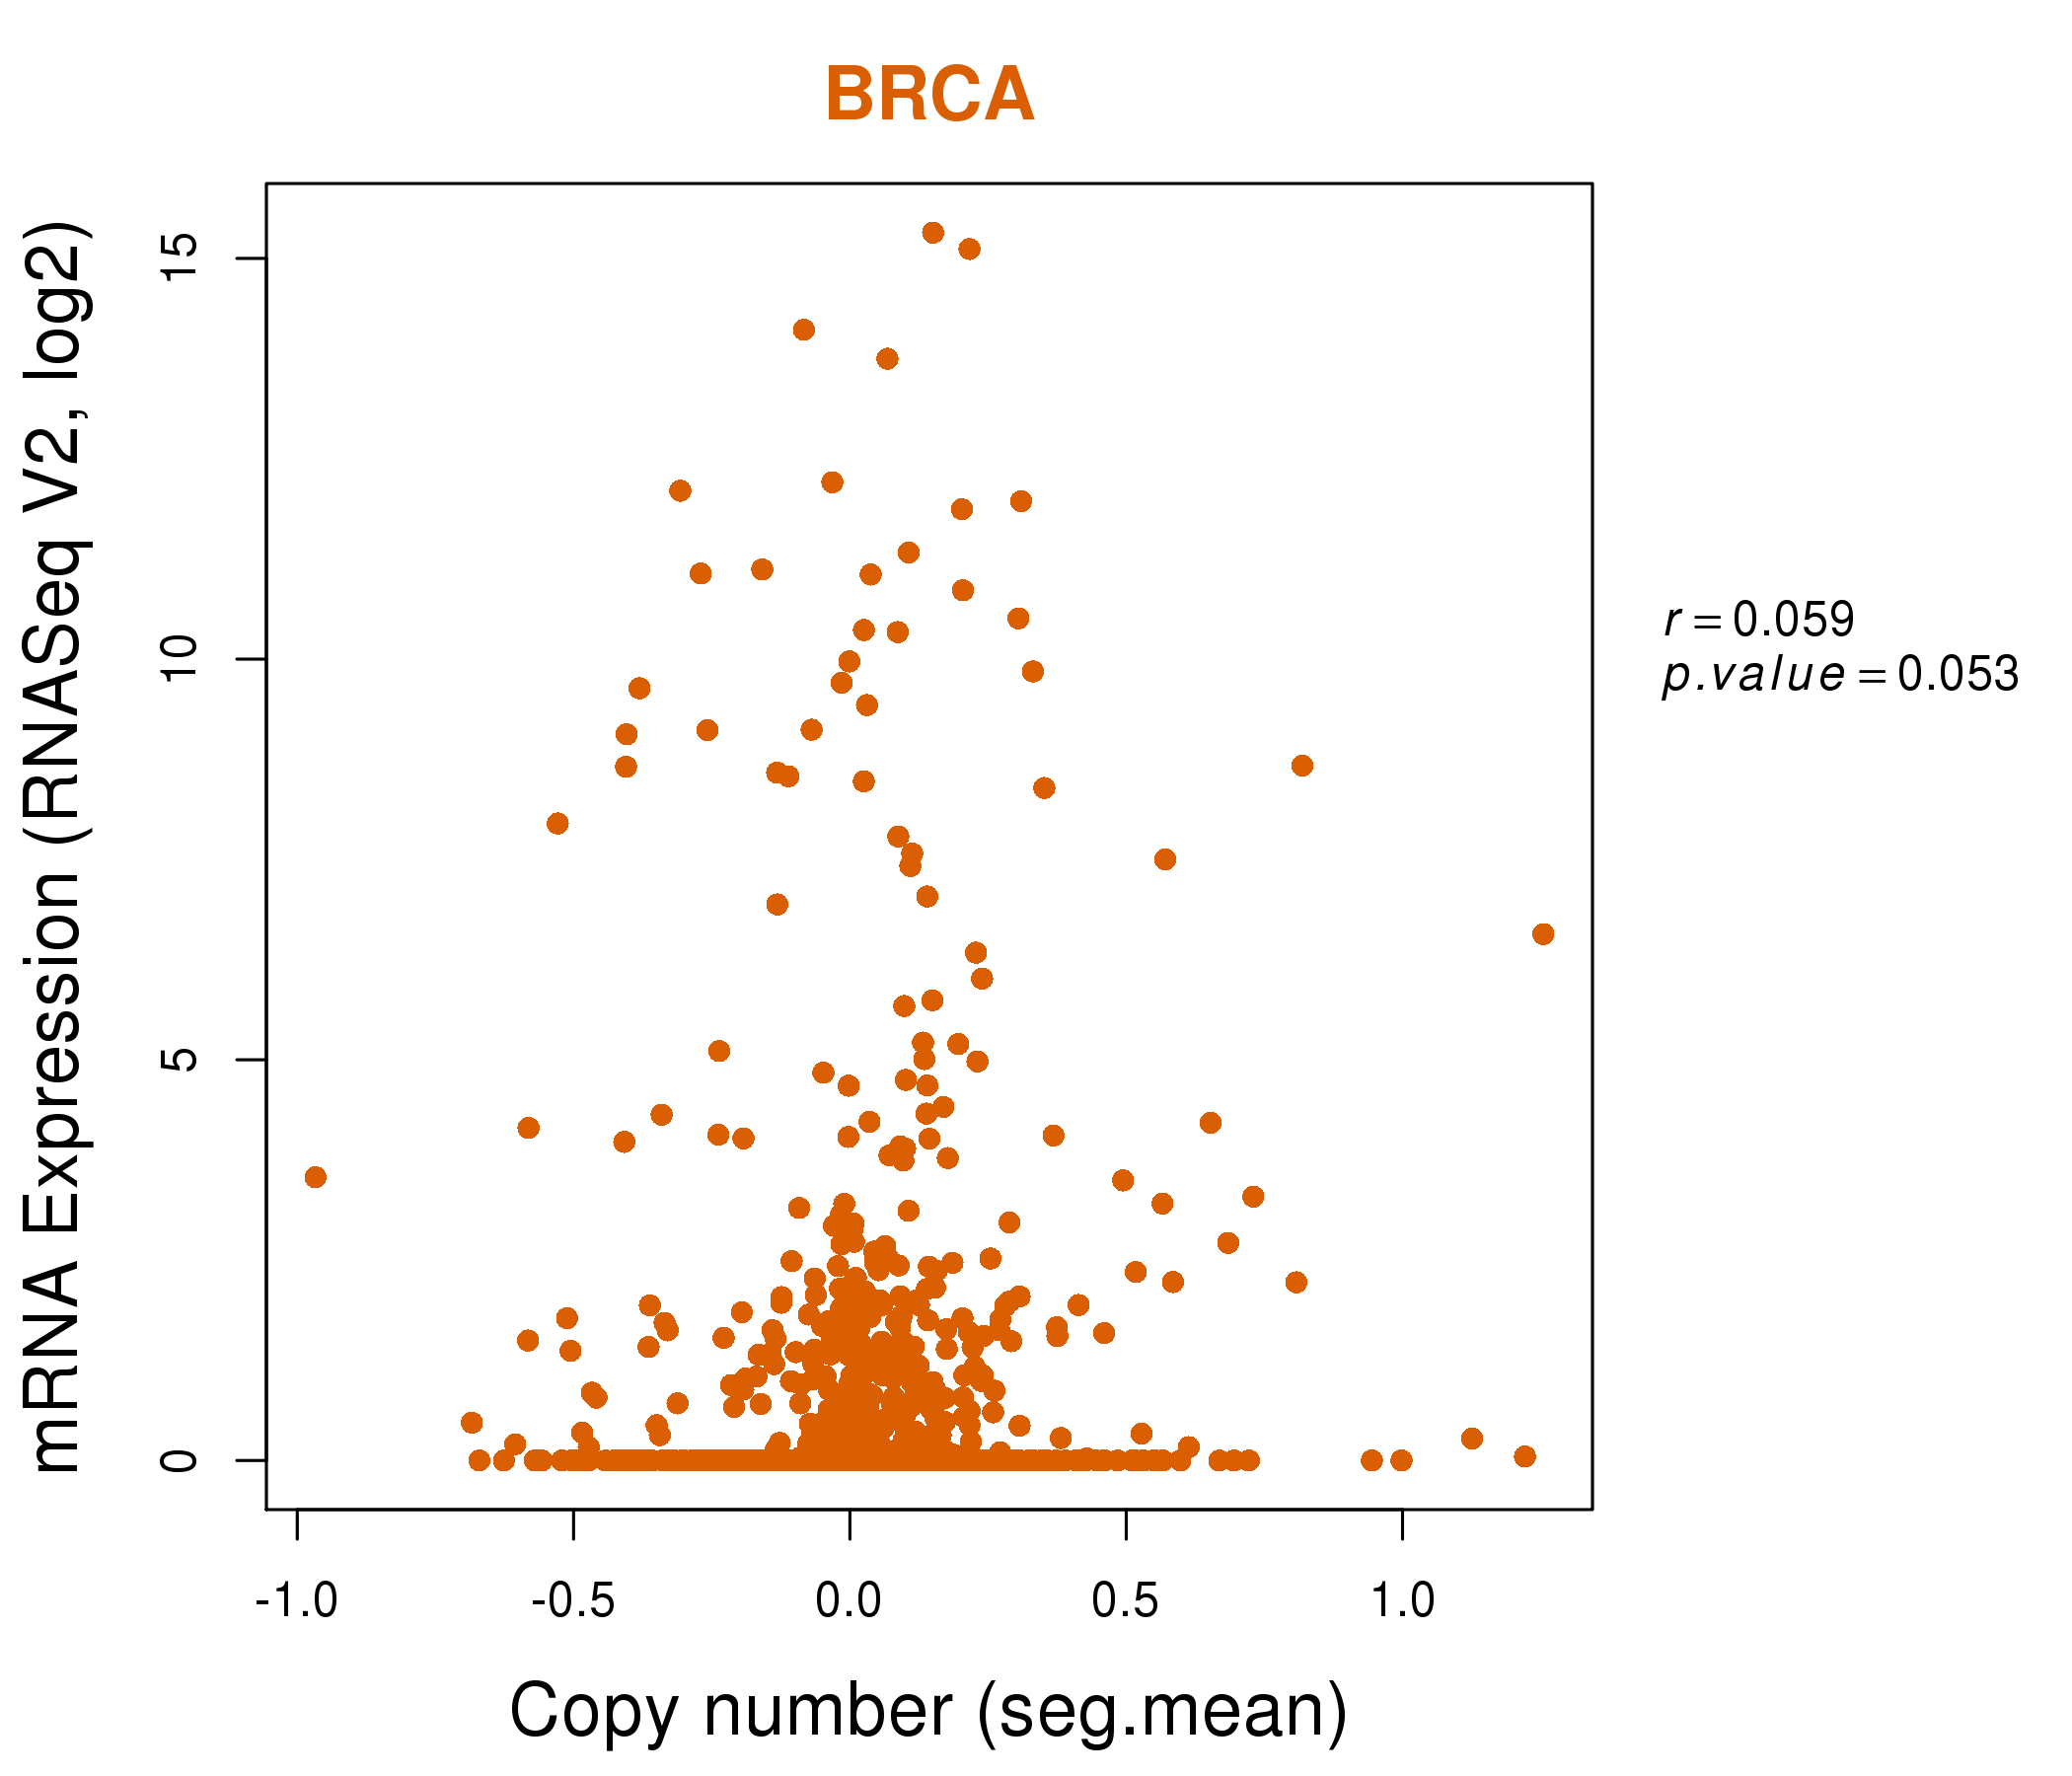
| * Copy number data were extracted from TCGA using R package TCGA-Assembler. The URLs of all public data files on TCGA DCC data server were gathered on Jan-05-2015. Function ProcessCNAData in TCGA-Assembler package was used to obtain gene-level copy number value which is calculated as the average copy number of the genomic region of a gene. |
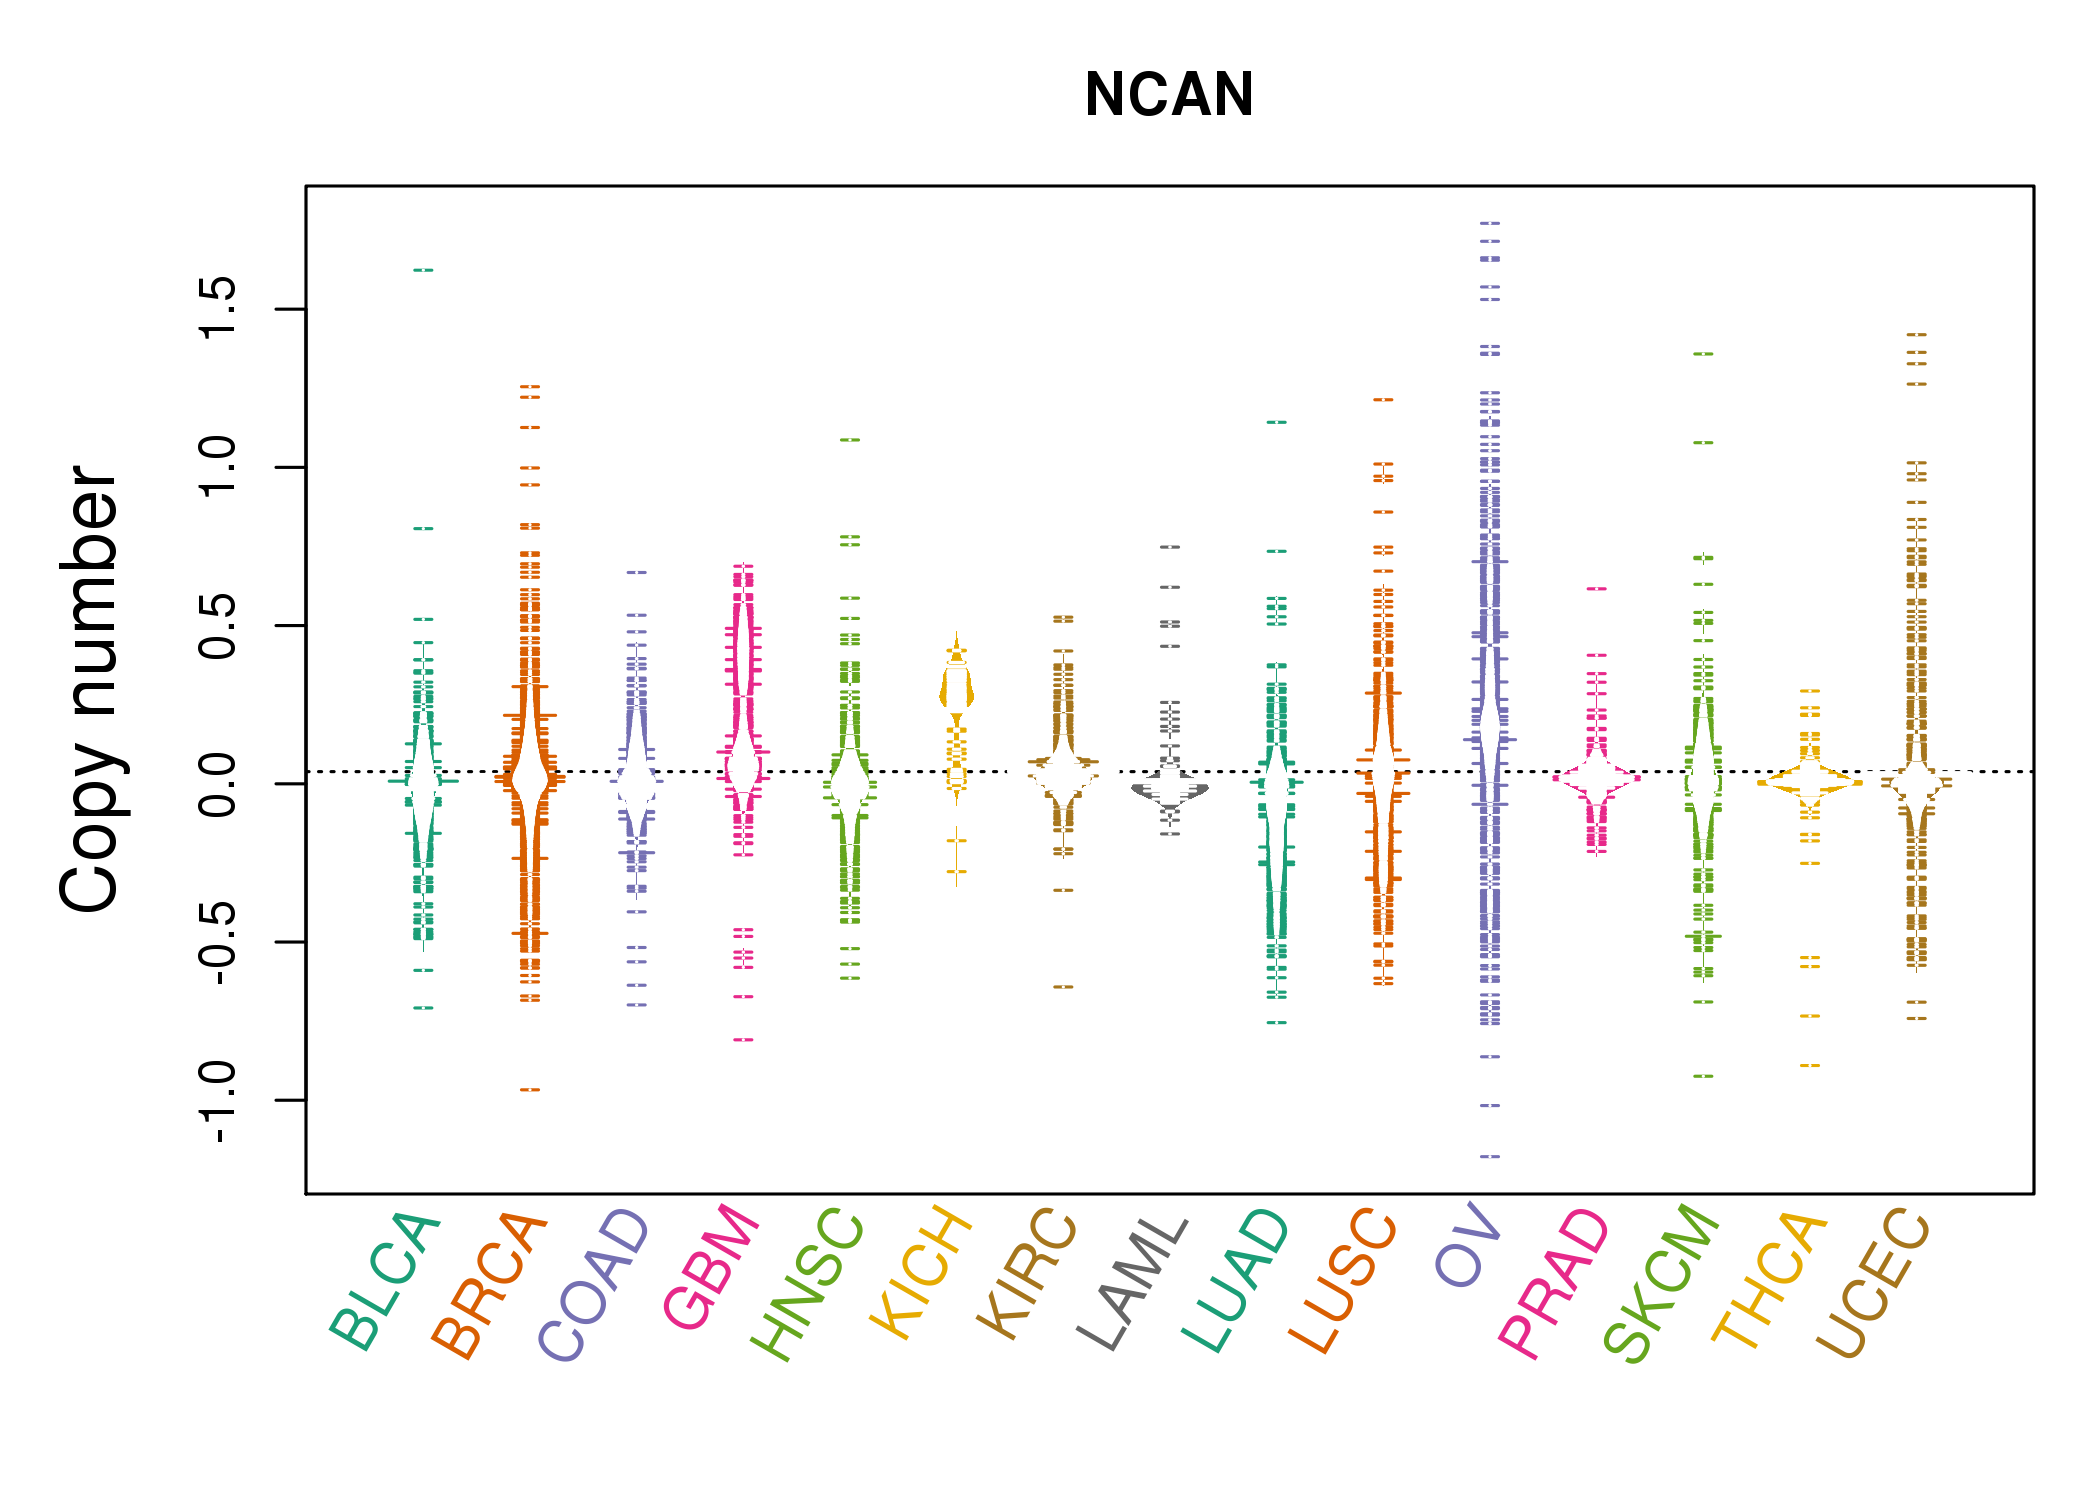 |
| cf) Tissue ID[Tissue type]: BLCA[Bladder Urothelial Carcinoma], BRCA[Breast invasive carcinoma], CESC[Cervical squamous cell carcinoma and endocervical adenocarcinoma], COAD[Colon adenocarcinoma], GBM[Glioblastoma multiforme], Glioma Low Grade, HNSC[Head and Neck squamous cell carcinoma], KICH[Kidney Chromophobe], KIRC[Kidney renal clear cell carcinoma], KIRP[Kidney renal papillary cell carcinoma], LAML[Acute Myeloid Leukemia], LUAD[Lung adenocarcinoma], LUSC[Lung squamous cell carcinoma], OV[Ovarian serous cystadenocarcinoma ], PAAD[Pancreatic adenocarcinoma], PRAD[Prostate adenocarcinoma], SKCM[Skin Cutaneous Melanoma], STAD[Stomach adenocarcinoma], THCA[Thyroid carcinoma], UCEC[Uterine Corpus Endometrial Carcinoma] |
| Top |
| Gene Expression for NCAN |
| * CCLE gene expression data were extracted from CCLE_Expression_Entrez_2012-10-18.res: Gene-centric RMA-normalized mRNA expression data. |
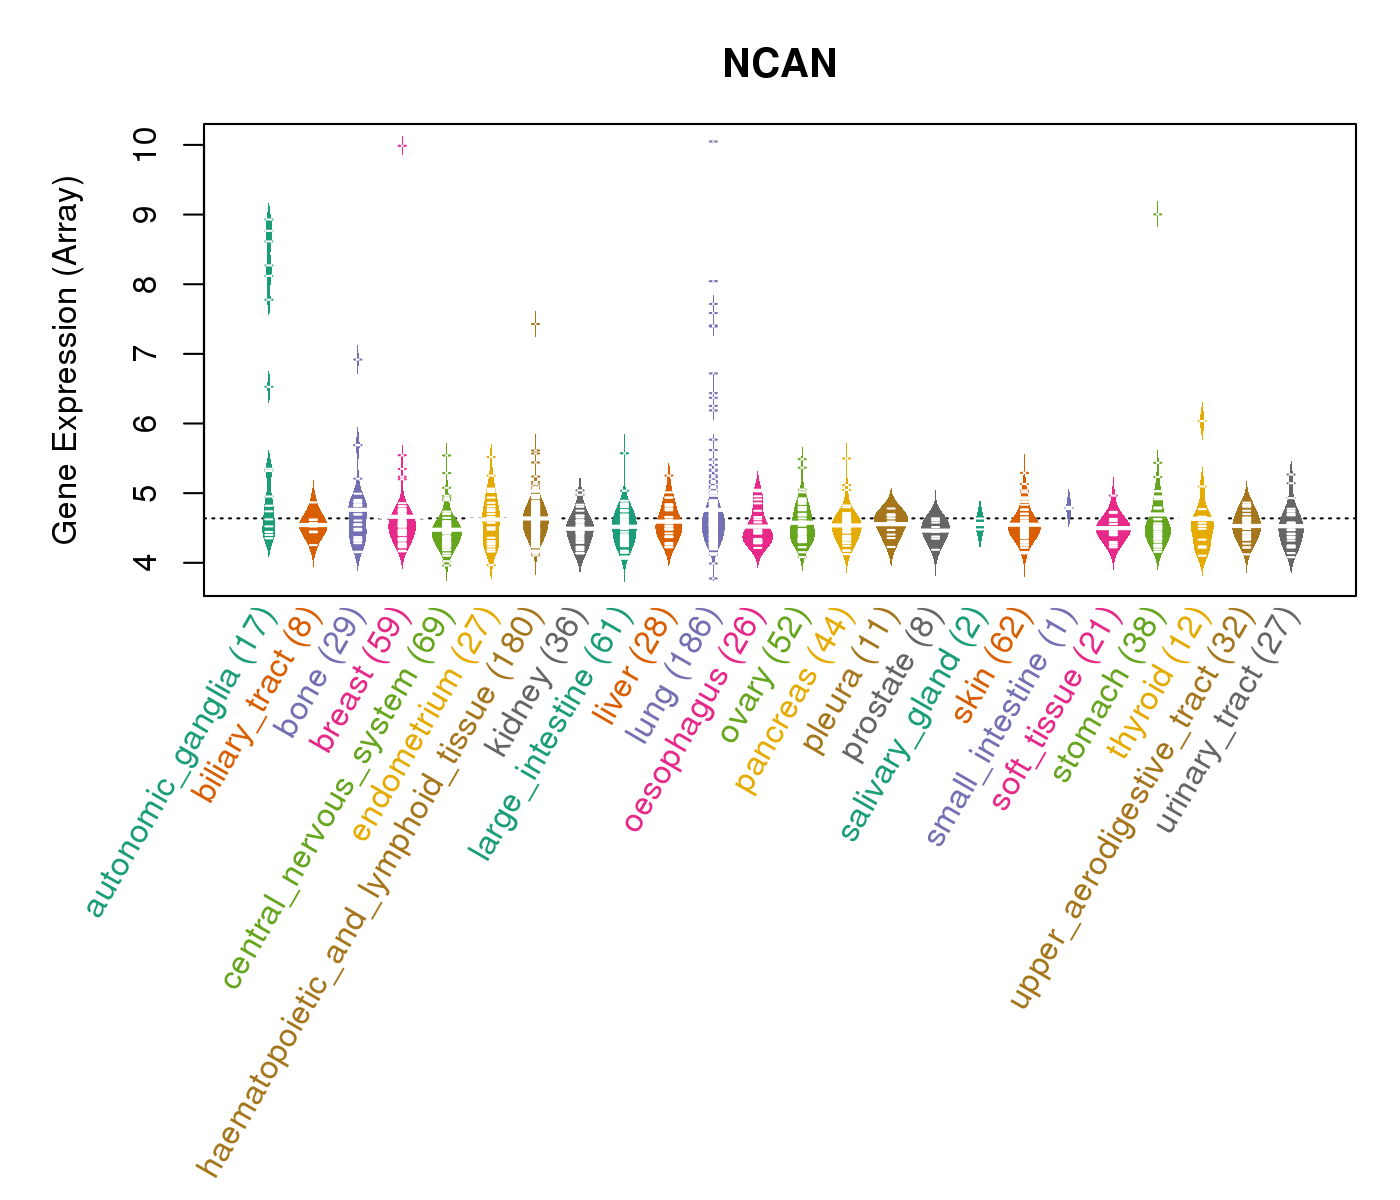 |
| * Normalized gene expression data of RNASeqV2 was extracted from TCGA using R package TCGA-Assembler. The URLs of all public data files on TCGA DCC data server were gathered at Jan-05-2015. Only eight cancer types have enough normal control samples for differential expression analysis. (t test, adjusted p<0.05 (using Benjamini-Hochberg FDR)) |
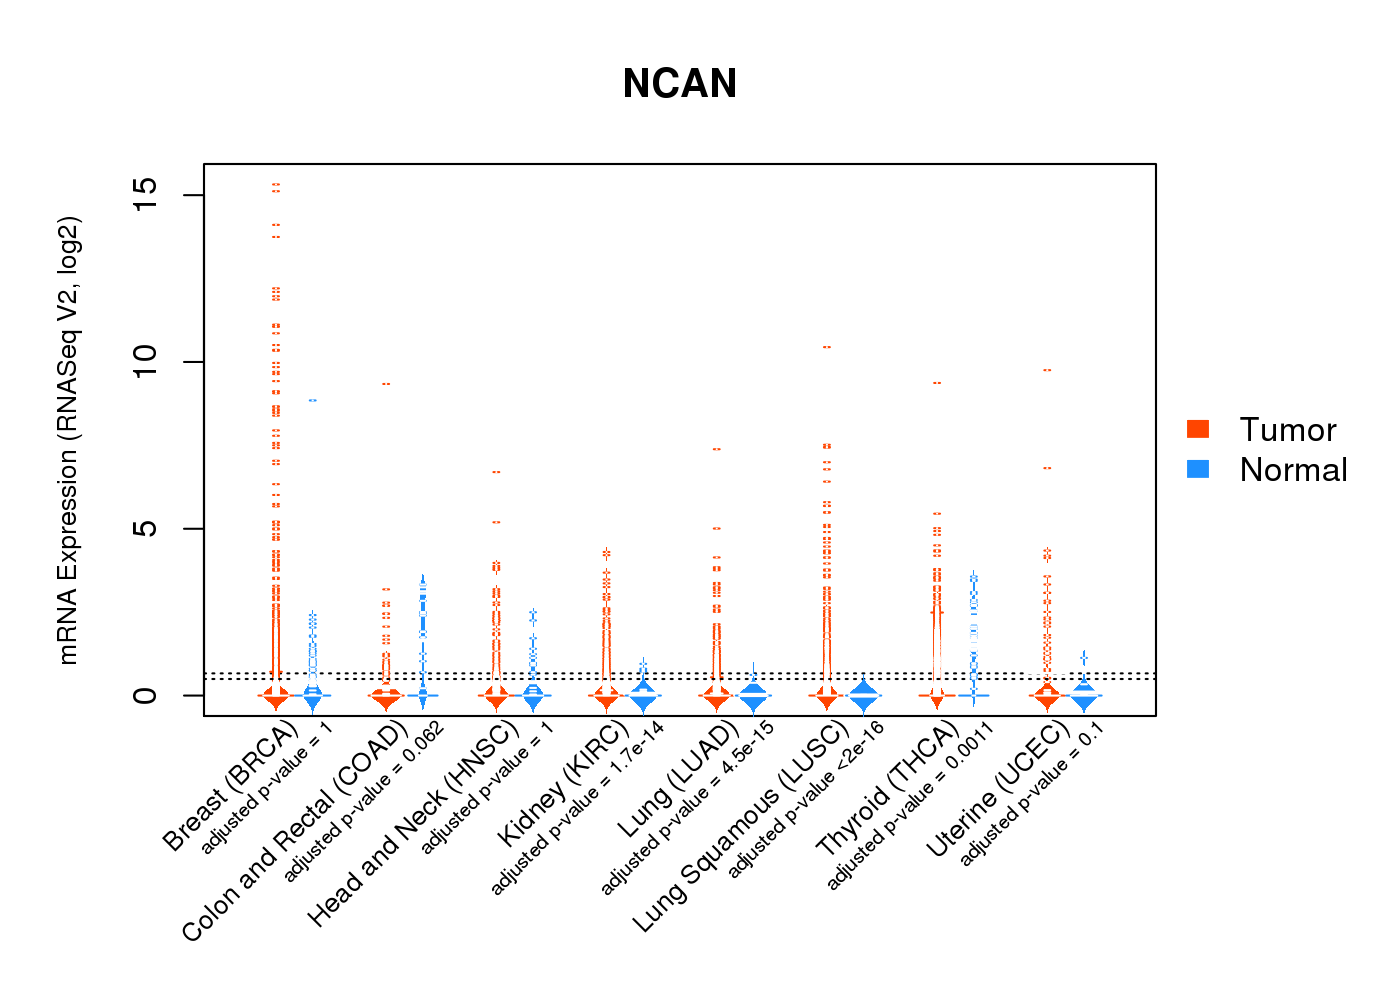 |
| Top |
| * This plots show the correlation between CNV and gene expression. |
: Open all plots for all cancer types
 |
|
 |
|

| Top |
| Gene-Gene Network Information |
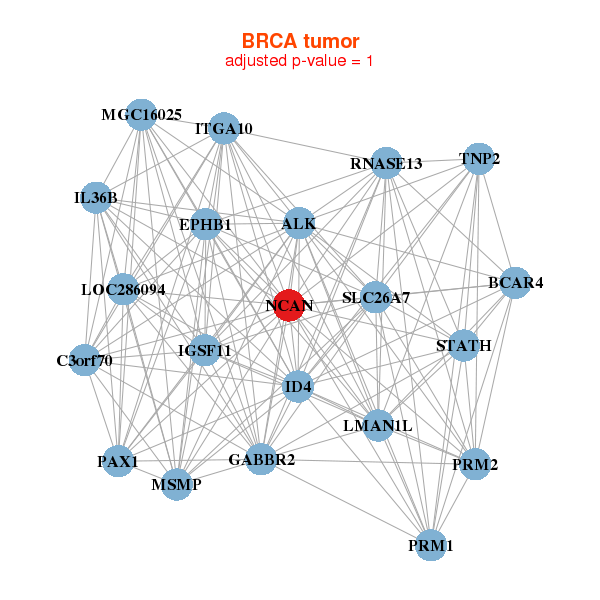
| * Co-Expression network figures were drawn using R package igraph. Only the top 20 genes with the highest correlations were shown. Red circle: input gene, orange circle: cell metabolism gene, sky circle: other gene |
: Open all plots for all cancer types
 |
|
| ALK,BCAR4,C3orf70,EPHB1,GABBR2,ID4,IGSF11, IL36B,ITGA10,LMAN1L,LOC286094,MGC16025,MSMP,NCAN, PAX1,PRM1,PRM2,RNASE13,SLC26A7,STATH,TNP2 | CHP2,COL11A2,AMER2,GPR151,GUCA2B,HTR3D,IFNL3, LIN28B,LINC00461,LOC731789,LYPD5,LYZL1,NCAN,ONECUT2, OR4E2,PIRT,PRSS33,SLC34A1,TCAM1P,TGM6,TLX1NB |
 |
|
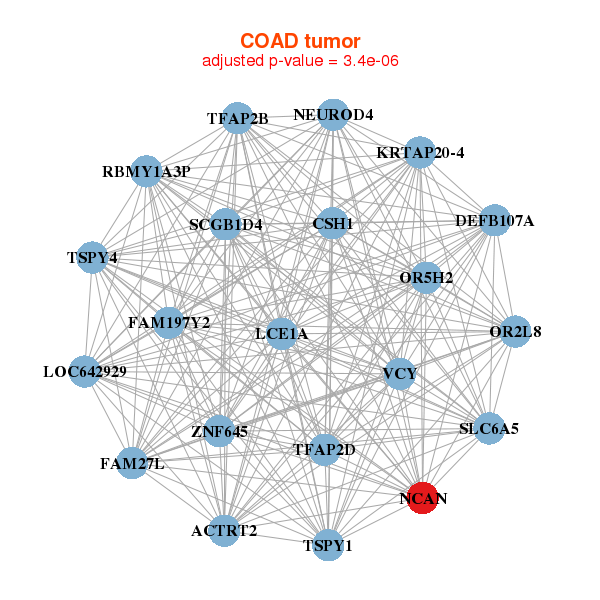
| ACTRT2,CSH1,DEFB107A,FAM197Y2,FAM27L,KRTAP20-4,LCE1A, LOC642929,NCAN,NEUROD4,OR2L8,OR5H2,RBMY1A3P,SCGB1D4, SLC6A5,TFAP2B,TFAP2D,TSPY1,TSPY4,VCY,ZNF645 | AK5,APC2,APLP1,FNDC9,CAMK2N2,CDH10,DLGAP2, FAIM2,HS3ST5,KIF3A,LGI4,MAGED4,MYT1L,NALCN, NCAN,NDRG4,NMNAT2,PHOX2B,RPH3A,SYT1,TMEM59L |
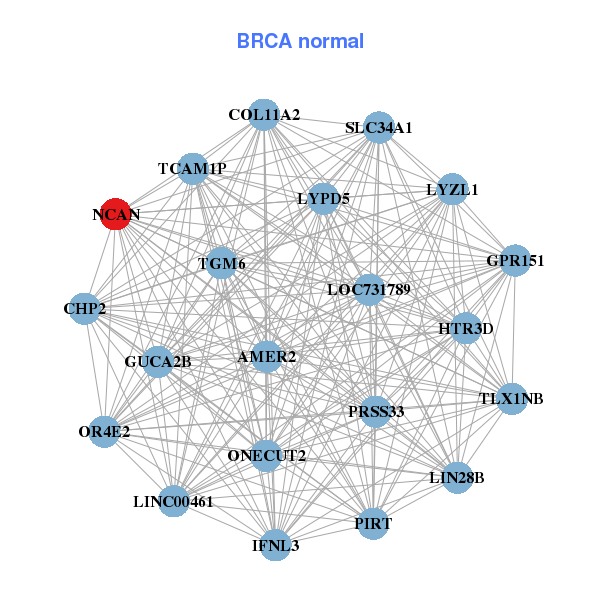
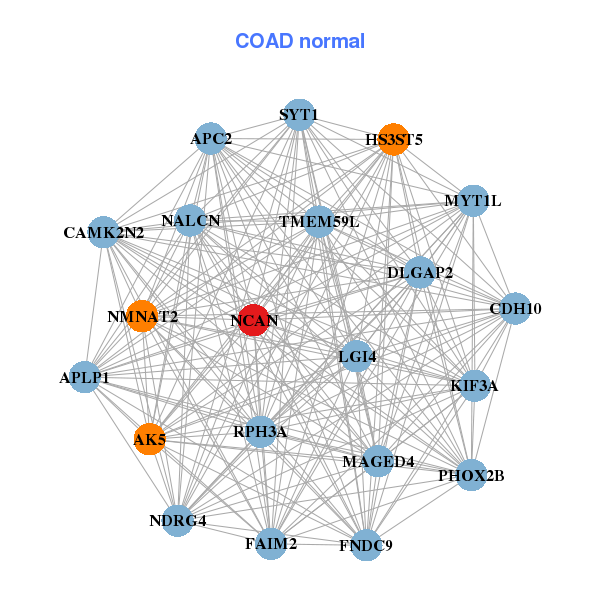
| * Co-Expression network figures were drawn using R package igraph. Only the top 20 genes with the highest correlations were shown. Red circle: input gene, orange circle: cell metabolism gene, sky circle: other gene |
: Open all plots for all cancer types
| Top |
: Open all interacting genes' information including KEGG pathway for all interacting genes from DAVID
| Top |
| Pharmacological Information for NCAN |
| There's no related Drug. |
| Top |
| Cross referenced IDs for NCAN |
| * We obtained these cross-references from Uniprot database. It covers 150 different DBs, 18 categories. http://www.uniprot.org/help/cross_references_section |
: Open all cross reference information
|
Copyright © 2016-Present - The Univsersity of Texas Health Science Center at Houston @ |