|
||||||||||||||||||||||||||||||||||||||||||||||||||||||||||||||||||||||||||||||||||||||||||||||||||||||||||||||||||||||||||||||||||||||||||||||||||||||||||||||||||||||||||||||||||||||||||||||||||||||||||||||||||||||||||||||||||||||||||||||||||||||||||||||||||||||||||||||||||||||||||||||||||||||||||||||||||||||||||
| |
| Phenotypic Information (metabolism pathway, cancer, disease, phenome) |
| |
| |
| Gene-Gene Network Information: Co-Expression Network, Interacting Genes & KEGG |
| |
|


| Gene Summary for CSPG4 |
| Basic gene info. | Gene symbol | CSPG4 |
| Gene name | chondroitin sulfate proteoglycan 4 | |
| Synonyms | HMW-MAA|MCSP|MCSPG|MEL-CSPG|MSK16|NG2 | |
| Cytomap | UCSC genome browser: 15q24.2 | |
| Genomic location | chr15 :75966662-76005189 | |
| Type of gene | protein-coding | |
| RefGenes | NM_001897.4, | |
| Ensembl id | ENSG00000173546 | |
| Description | chondroitin sulfate proteoglycan 4 (melanoma-associated)chondroitin sulfate proteoglycan NG2melanoma chondroitin sulfate proteoglycanmelanoma-associated chondroitin sulfate proteoglycan | |
| Modification date | 20141207 | |
| dbXrefs | MIM : 601172 | |
| HGNC : HGNC | ||
| Ensembl : ENSG00000173546 | ||
| HPRD : 03105 | ||
| Vega : OTTHUMG00000142836 | ||
| Protein | UniProt: go to UniProt's Cross Reference DB Table | |
| Expression | CleanEX: HS_CSPG4 | |
| BioGPS: 1464 | ||
| Gene Expression Atlas: ENSG00000173546 | ||
| The Human Protein Atlas: ENSG00000173546 | ||
| Pathway | NCI Pathway Interaction Database: CSPG4 | |
| KEGG: CSPG4 | ||
| REACTOME: CSPG4 | ||
| ConsensusPathDB | ||
| Pathway Commons: CSPG4 | ||
| Metabolism | MetaCyc: CSPG4 | |
| HUMANCyc: CSPG4 | ||
| Regulation | Ensembl's Regulation: ENSG00000173546 | |
| miRBase: chr15 :75,966,662-76,005,189 | ||
| TargetScan: NM_001897 | ||
| cisRED: ENSG00000173546 | ||
| Context | iHOP: CSPG4 | |
| cancer metabolism search in PubMed: CSPG4 | ||
| UCL Cancer Institute: CSPG4 | ||
| Assigned class in ccmGDB | C | |
| Top |
| Phenotypic Information for CSPG4(metabolism pathway, cancer, disease, phenome) |
| Cancer | CGAP: CSPG4 |
| Familial Cancer Database: CSPG4 | |
| * This gene is included in those cancer gene databases. |
|
|
|
|
|
| . | ||||||||||||||||||||||||||||||||||||||||||||||||||||||||||||||||||||||||||||||||||||||||||||||||||||||||||||||||||||||||||||||||||||||||||||||||||||||||||||||||||||||||||||||||||||||||||||||||||||||||||||||||||||||||||||||||||||||||||||||||||||||||||||||||||||||||||||||||||||||||||||||||||||||||||||||||||||
Oncogene 1 | Significant driver gene in | |||||||||||||||||||||||||||||||||||||||||||||||||||||||||||||||||||||||||||||||||||||||||||||||||||||||||||||||||||||||||||||||||||||||||||||||||||||||||||||||||||||||||||||||||||||||||||||||||||||||||||||||||||||||||||||||||||||||||||||||||||||||||||||||||||||||||||||||||||||||||||||||||||||||||||||||||||||||||
| cf) number; DB name 1 Oncogene; http://nar.oxfordjournals.org/content/35/suppl_1/D721.long, 2 Tumor Suppressor gene; https://bioinfo.uth.edu/TSGene/, 3 Cancer Gene Census; http://www.nature.com/nrc/journal/v4/n3/abs/nrc1299.html, 4 CancerGenes; http://nar.oxfordjournals.org/content/35/suppl_1/D721.long, 5 Network of Cancer Gene; http://ncg.kcl.ac.uk/index.php, 1Therapeutic Vulnerabilities in Cancer; http://cbio.mskcc.org/cancergenomics/statius/ |
| REACTOME_METABOLISM_OF_CARBOHYDRATES | |
| OMIM | |
| Orphanet | |
| Disease | KEGG Disease: CSPG4 |
| MedGen: CSPG4 (Human Medical Genetics with Condition) | |
| ClinVar: CSPG4 | |
| Phenotype | MGI: CSPG4 (International Mouse Phenotyping Consortium) |
| PhenomicDB: CSPG4 | |
| Mutations for CSPG4 |
| * Under tables are showing count per each tissue to give us broad intuition about tissue specific mutation patterns.You can go to the detailed page for each mutation database's web site. |
| There's no structural variation information in COSMIC data for this gene. |
| * From mRNA Sanger sequences, Chitars2.0 arranged chimeric transcripts. This table shows CSPG4 related fusion information. |
| ID | Head Gene | Tail Gene | Accession | Gene_a | qStart_a | qEnd_a | Chromosome_a | tStart_a | tEnd_a | Gene_a | qStart_a | qEnd_a | Chromosome_a | tStart_a | tEnd_a |
| CD172355 | CSPG4 | 1 | 508 | 15 | 75977076 | 75977889 | SON | 506 | 806 | 21 | 34945612 | 34948153 | |
| Top |
| Mutation type/ Tissue ID | brca | cns | cerv | endome | haematopo | kidn | Lintest | liver | lung | ns | ovary | pancre | prost | skin | stoma | thyro | urina | |||
| Total # sample | 1 | |||||||||||||||||||
| GAIN (# sample) | 1 | |||||||||||||||||||
| LOSS (# sample) |
| cf) Tissue ID; Tissue type (1; Breast, 2; Central_nervous_system, 3; Cervix, 4; Endometrium, 5; Haematopoietic_and_lymphoid_tissue, 6; Kidney, 7; Large_intestine, 8; Liver, 9; Lung, 10; NS, 11; Ovary, 12; Pancreas, 13; Prostate, 14; Skin, 15; Stomach, 16; Thyroid, 17; Urinary_tract) |
| Top |
|
 |
| Top |
| Stat. for Non-Synonymous SNVs (# total SNVs=133) | (# total SNVs=74) |
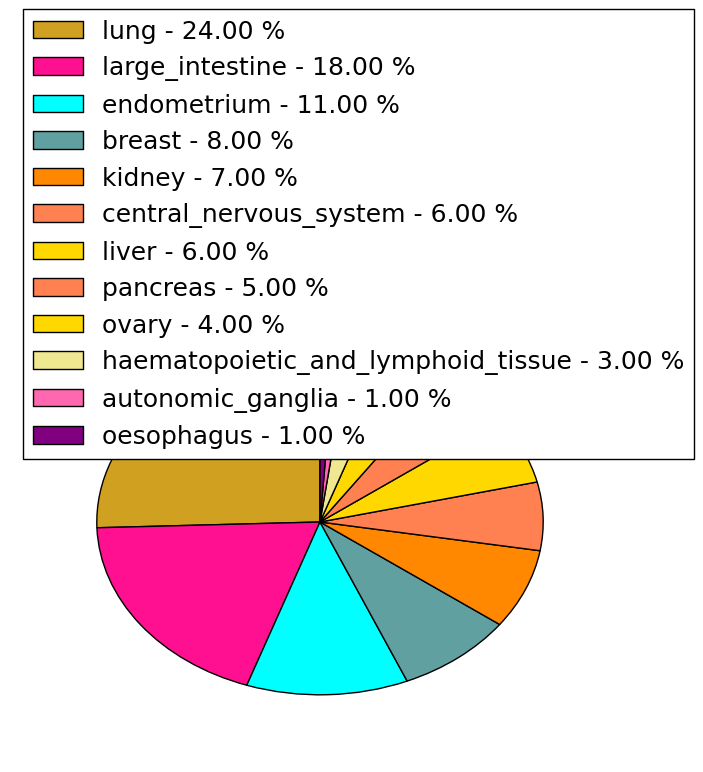 | 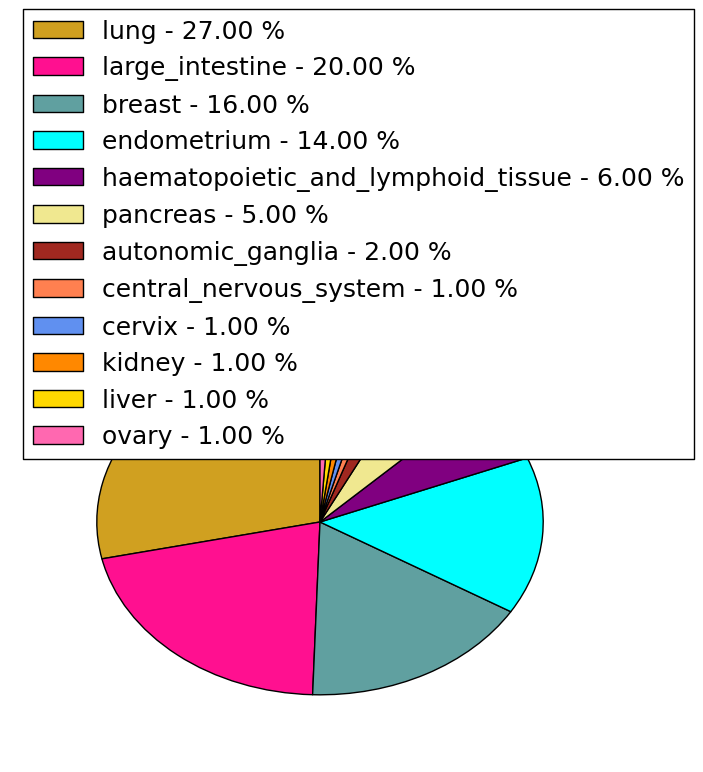 |
(# total SNVs=3) | (# total SNVs=1) |
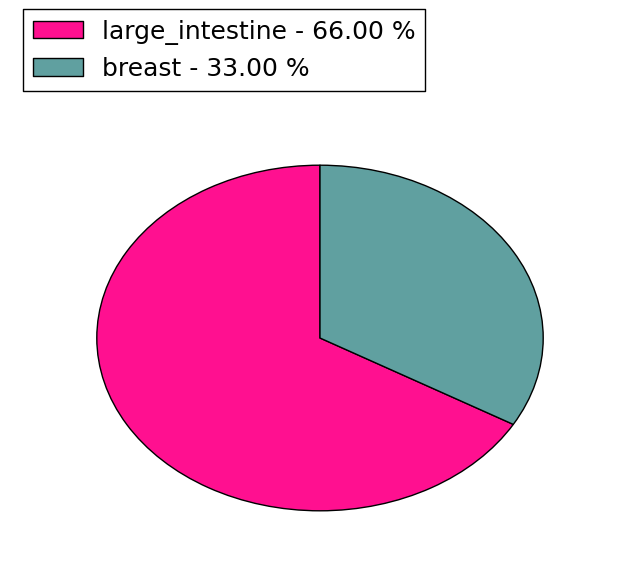 |  |
| Top |
| * When you move the cursor on each content, you can see more deailed mutation information on the Tooltip. Those are primary_site,primary_histology,mutation(aa),pubmedID. |
| GRCh37 position | Mutation(aa) | Unique sampleID count |
| chr15:75982085-75982085 | p.E441K | 6 |
| chr15:75968836-75968836 | p.G2008G | 3 |
| chr15:75982428-75982428 | p.G326G | 3 |
| chr15:75982058-75982058 | p.R450W | 3 |
| chr15:75982072-75982072 | p.A445V | 3 |
| chr15:75968309-75968309 | p.T2184M | 3 |
| chr15:75981507-75981507 | p.G633G | 3 |
| chr15:75982239-75982239 | p.D389D | 3 |
| chr15:75968340-75968340 | p.A2174P | 3 |
| chr15:75981976-75981976 | p.R477H | 3 |
| Top |
|
 |
| Point Mutation/ Tissue ID | 1 | 2 | 3 | 4 | 5 | 6 | 7 | 8 | 9 | 10 | 11 | 12 | 13 | 14 | 15 | 16 | 17 | 18 | 19 | 20 |
| # sample | 3 | 12 | 1 | 15 | 4 | 6 | 5 | 1 | 1 | 23 | 5 | 3 | 3 | 14 | 18 | 1 | 18 | |||
| # mutation | 3 | 12 | 2 | 18 | 4 | 6 | 5 | 1 | 1 | 26 | 7 | 3 | 3 | 16 | 24 | 1 | 23 | |||
| nonsynonymous SNV | 2 | 5 | 1 | 11 | 3 | 3 | 4 | 1 | 1 | 17 | 3 | 2 | 2 | 7 | 17 | 1 | 14 | |||
| synonymous SNV | 1 | 7 | 1 | 7 | 1 | 3 | 1 | 9 | 4 | 1 | 1 | 9 | 7 | 9 |
| cf) Tissue ID; Tissue type (1; BLCA[Bladder Urothelial Carcinoma], 2; BRCA[Breast invasive carcinoma], 3; CESC[Cervical squamous cell carcinoma and endocervical adenocarcinoma], 4; COAD[Colon adenocarcinoma], 5; GBM[Glioblastoma multiforme], 6; Glioma Low Grade, 7; HNSC[Head and Neck squamous cell carcinoma], 8; KICH[Kidney Chromophobe], 9; KIRC[Kidney renal clear cell carcinoma], 10; KIRP[Kidney renal papillary cell carcinoma], 11; LAML[Acute Myeloid Leukemia], 12; LUAD[Lung adenocarcinoma], 13; LUSC[Lung squamous cell carcinoma], 14; OV[Ovarian serous cystadenocarcinoma ], 15; PAAD[Pancreatic adenocarcinoma], 16; PRAD[Prostate adenocarcinoma], 17; SKCM[Skin Cutaneous Melanoma], 18:STAD[Stomach adenocarcinoma], 19:THCA[Thyroid carcinoma], 20:UCEC[Uterine Corpus Endometrial Carcinoma]) |
| Top |
| * We represented just top 10 SNVs. When you move the cursor on each content, you can see more deailed mutation information on the Tooltip. Those are primary_site, primary_histology, mutation(aa), pubmedID. |
| Genomic Position | Mutation(aa) | Unique sampleID count |
| chr15:75983101 | p.G2008G | 2 |
| chr15:75979817 | p.D498E | 2 |
| chr15:75968105 | p.T102M | 2 |
| chr15:75968313 | p.V1197I | 2 |
| chr15:75981912 | p.T2252M | 2 |
| chr15:75968836 | p.R2183W | 2 |
| chr15:75968548 | p.G258G | 2 |
| chr15:75982632 | p.P2104P | 2 |
| chr15:75980437 | p.T400P | 1 |
| chr15:75981934 | p.L1605L | 1 |
| * Copy number data were extracted from TCGA using R package TCGA-Assembler. The URLs of all public data files on TCGA DCC data server were gathered on Jan-05-2015. Function ProcessCNAData in TCGA-Assembler package was used to obtain gene-level copy number value which is calculated as the average copy number of the genomic region of a gene. |
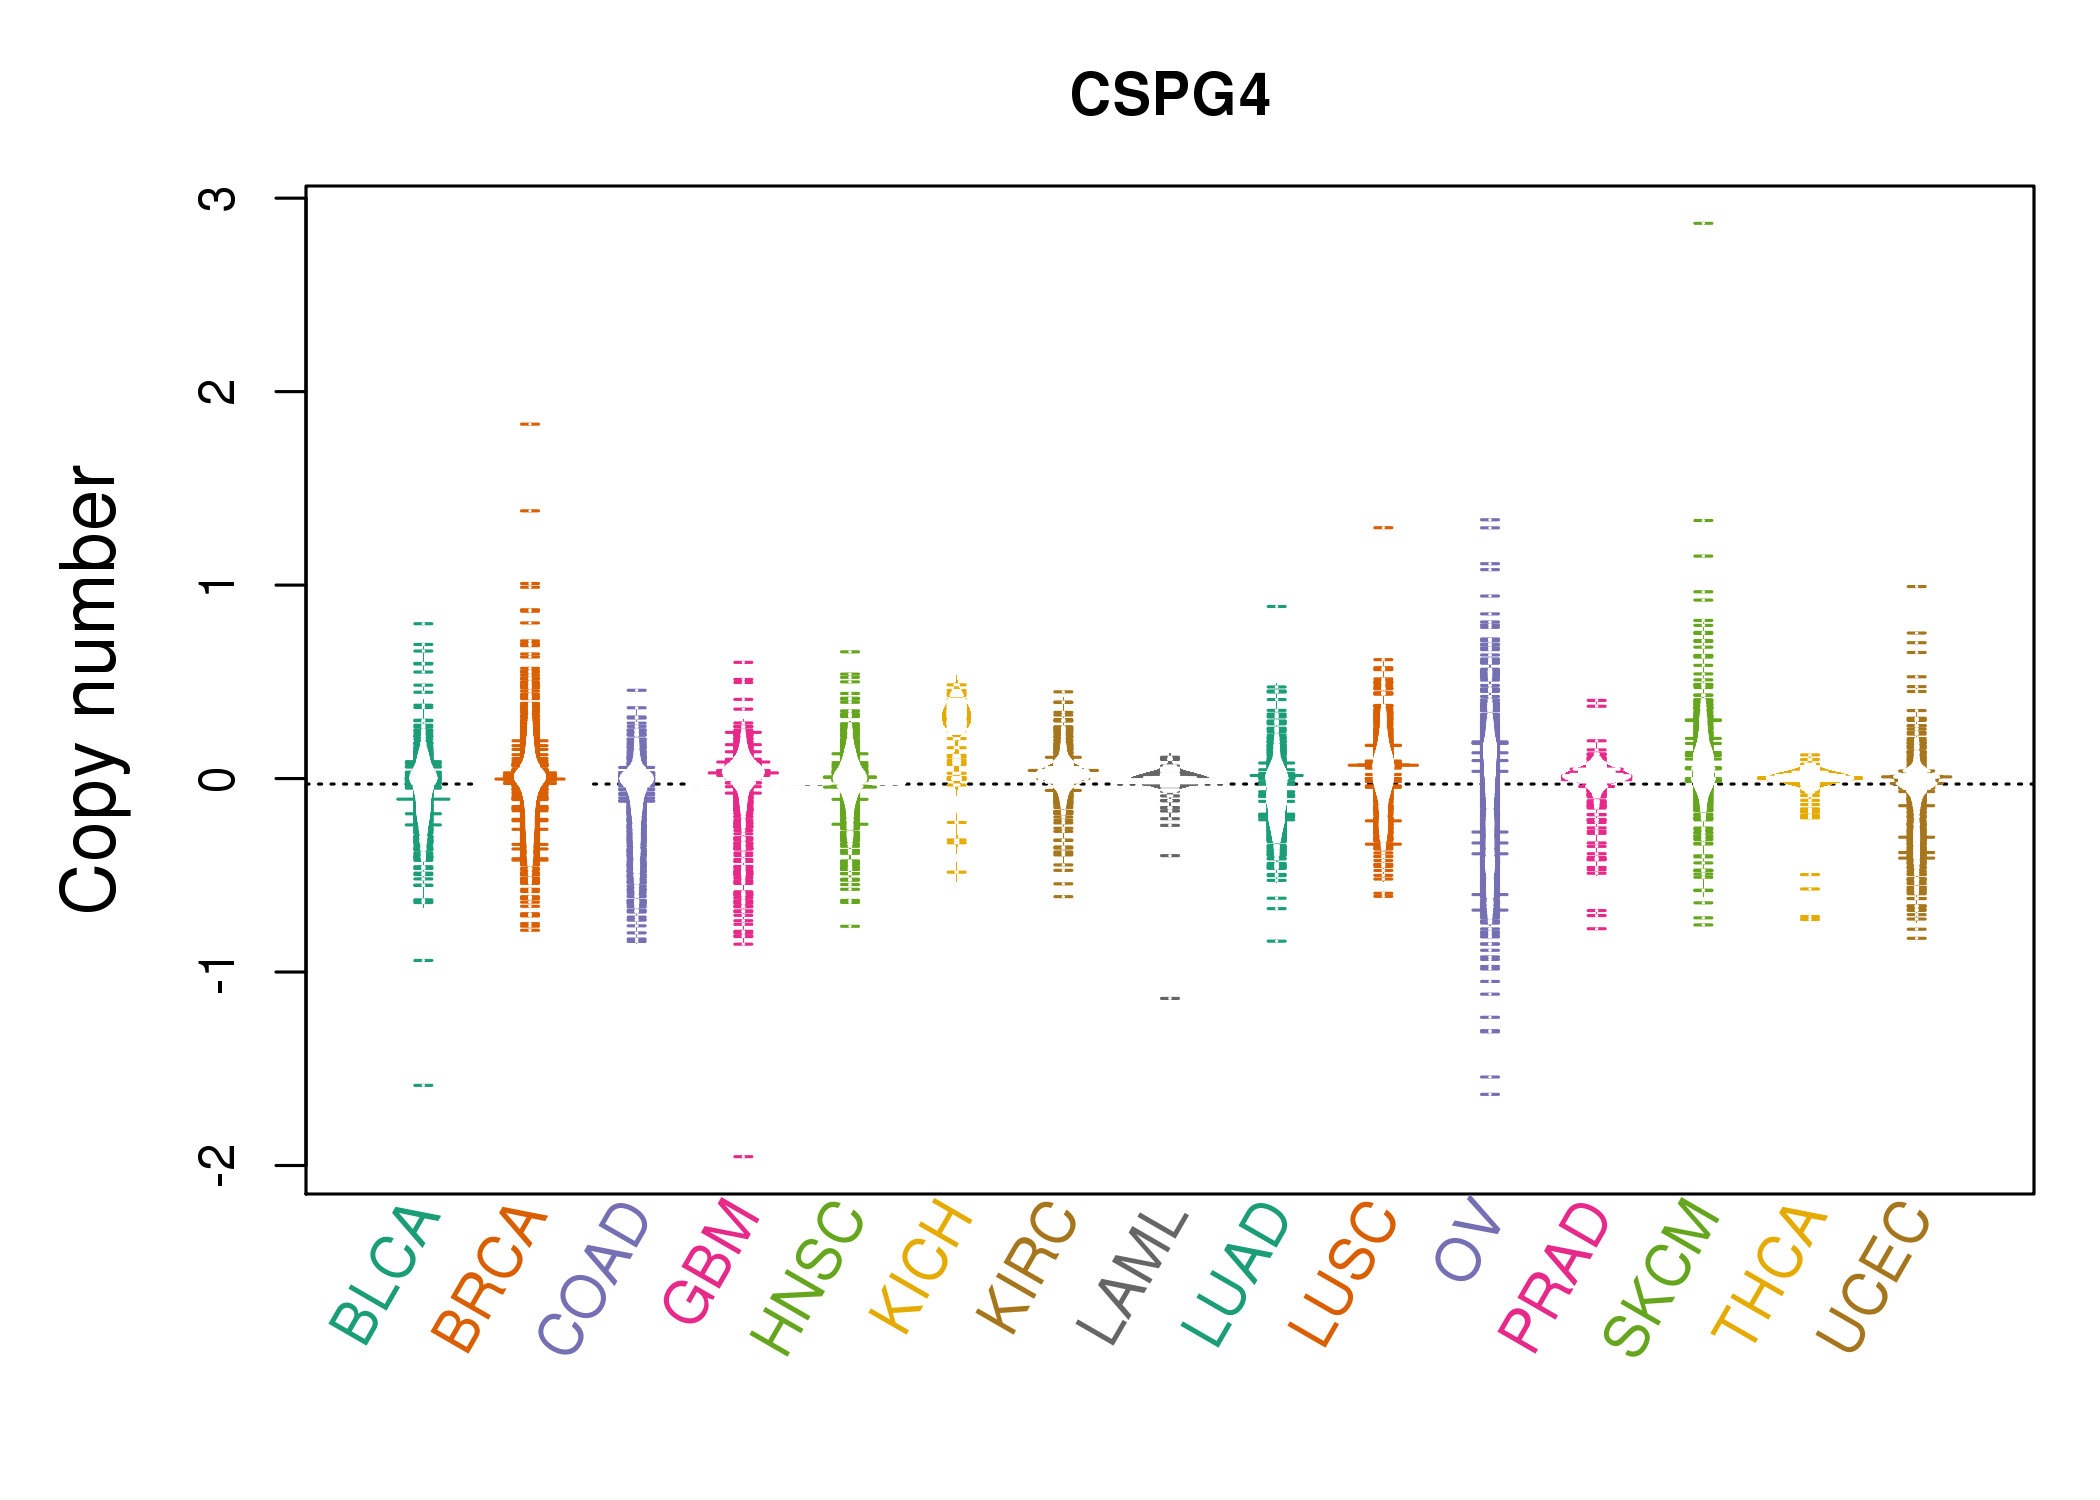 |
| cf) Tissue ID[Tissue type]: BLCA[Bladder Urothelial Carcinoma], BRCA[Breast invasive carcinoma], CESC[Cervical squamous cell carcinoma and endocervical adenocarcinoma], COAD[Colon adenocarcinoma], GBM[Glioblastoma multiforme], Glioma Low Grade, HNSC[Head and Neck squamous cell carcinoma], KICH[Kidney Chromophobe], KIRC[Kidney renal clear cell carcinoma], KIRP[Kidney renal papillary cell carcinoma], LAML[Acute Myeloid Leukemia], LUAD[Lung adenocarcinoma], LUSC[Lung squamous cell carcinoma], OV[Ovarian serous cystadenocarcinoma ], PAAD[Pancreatic adenocarcinoma], PRAD[Prostate adenocarcinoma], SKCM[Skin Cutaneous Melanoma], STAD[Stomach adenocarcinoma], THCA[Thyroid carcinoma], UCEC[Uterine Corpus Endometrial Carcinoma] |
| Top |
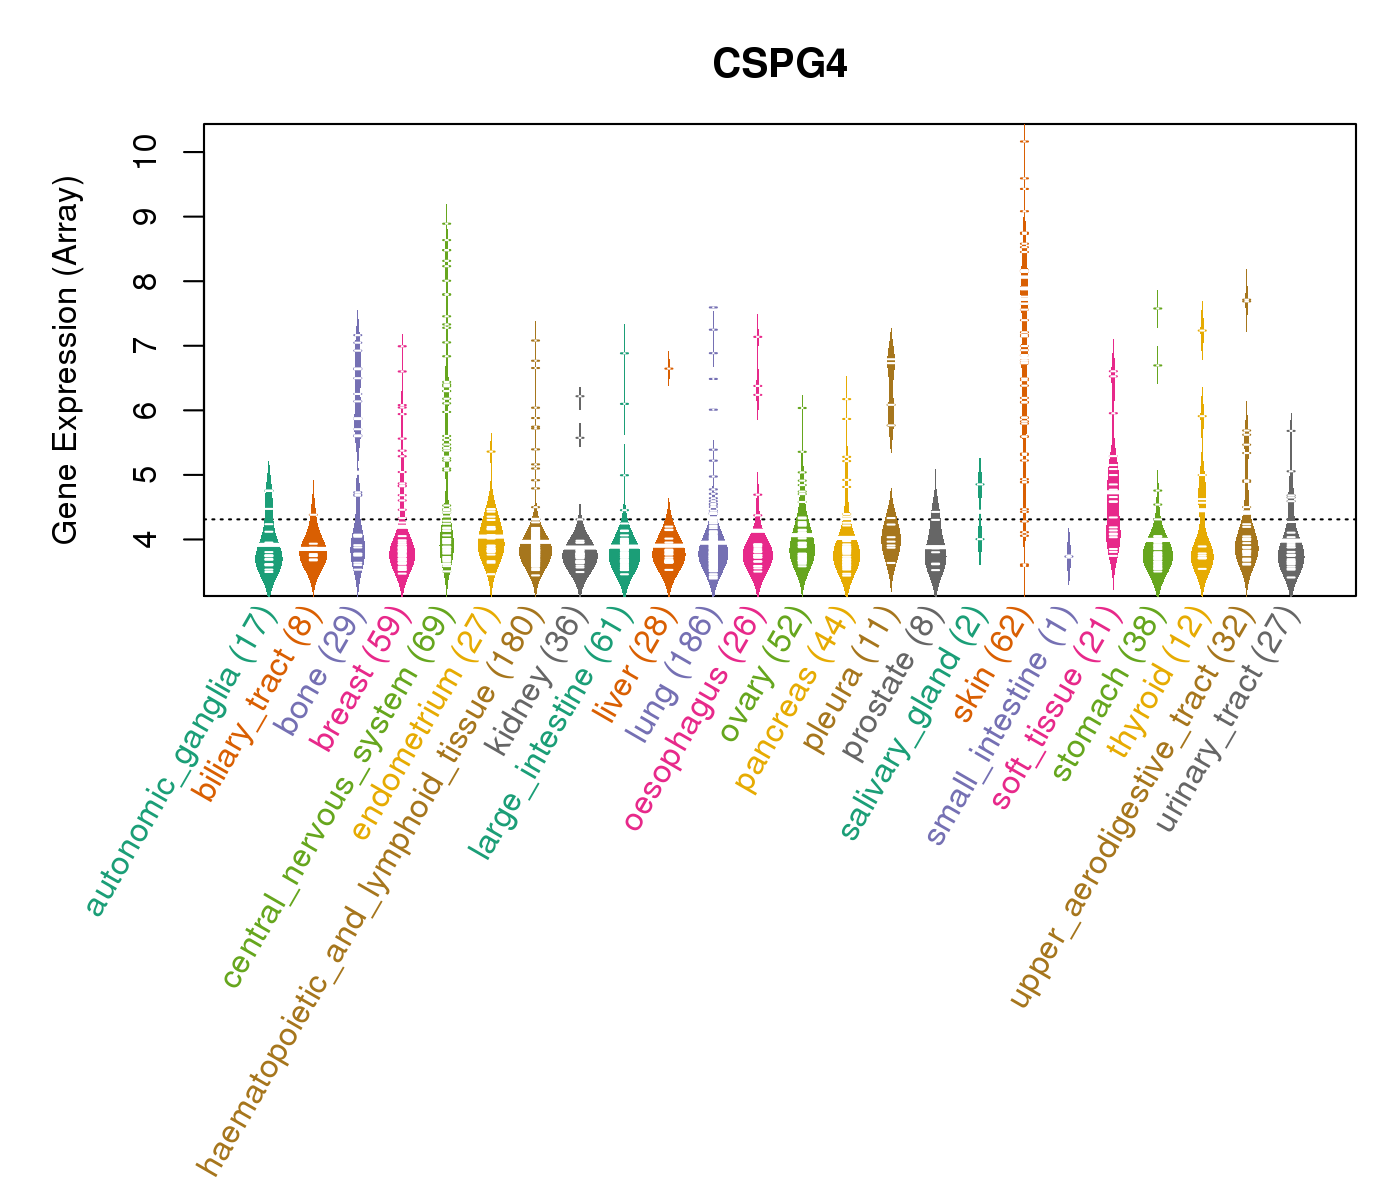
| Gene Expression for CSPG4 |
| * CCLE gene expression data were extracted from CCLE_Expression_Entrez_2012-10-18.res: Gene-centric RMA-normalized mRNA expression data. |
 |
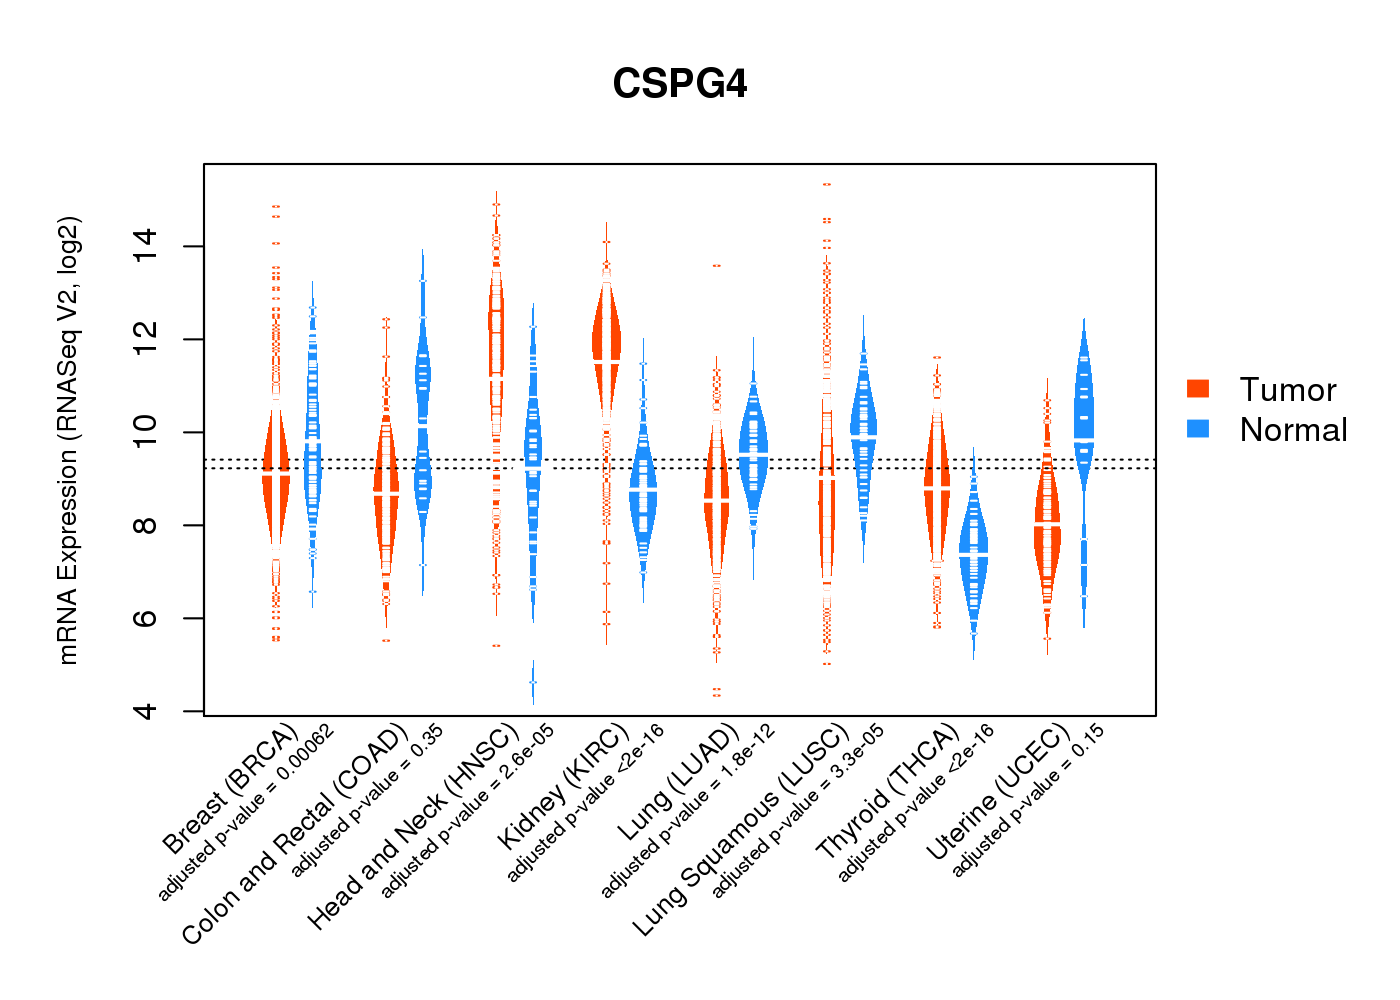
| * Normalized gene expression data of RNASeqV2 was extracted from TCGA using R package TCGA-Assembler. The URLs of all public data files on TCGA DCC data server were gathered at Jan-05-2015. Only eight cancer types have enough normal control samples for differential expression analysis. (t test, adjusted p<0.05 (using Benjamini-Hochberg FDR)) |
 |
| Top |
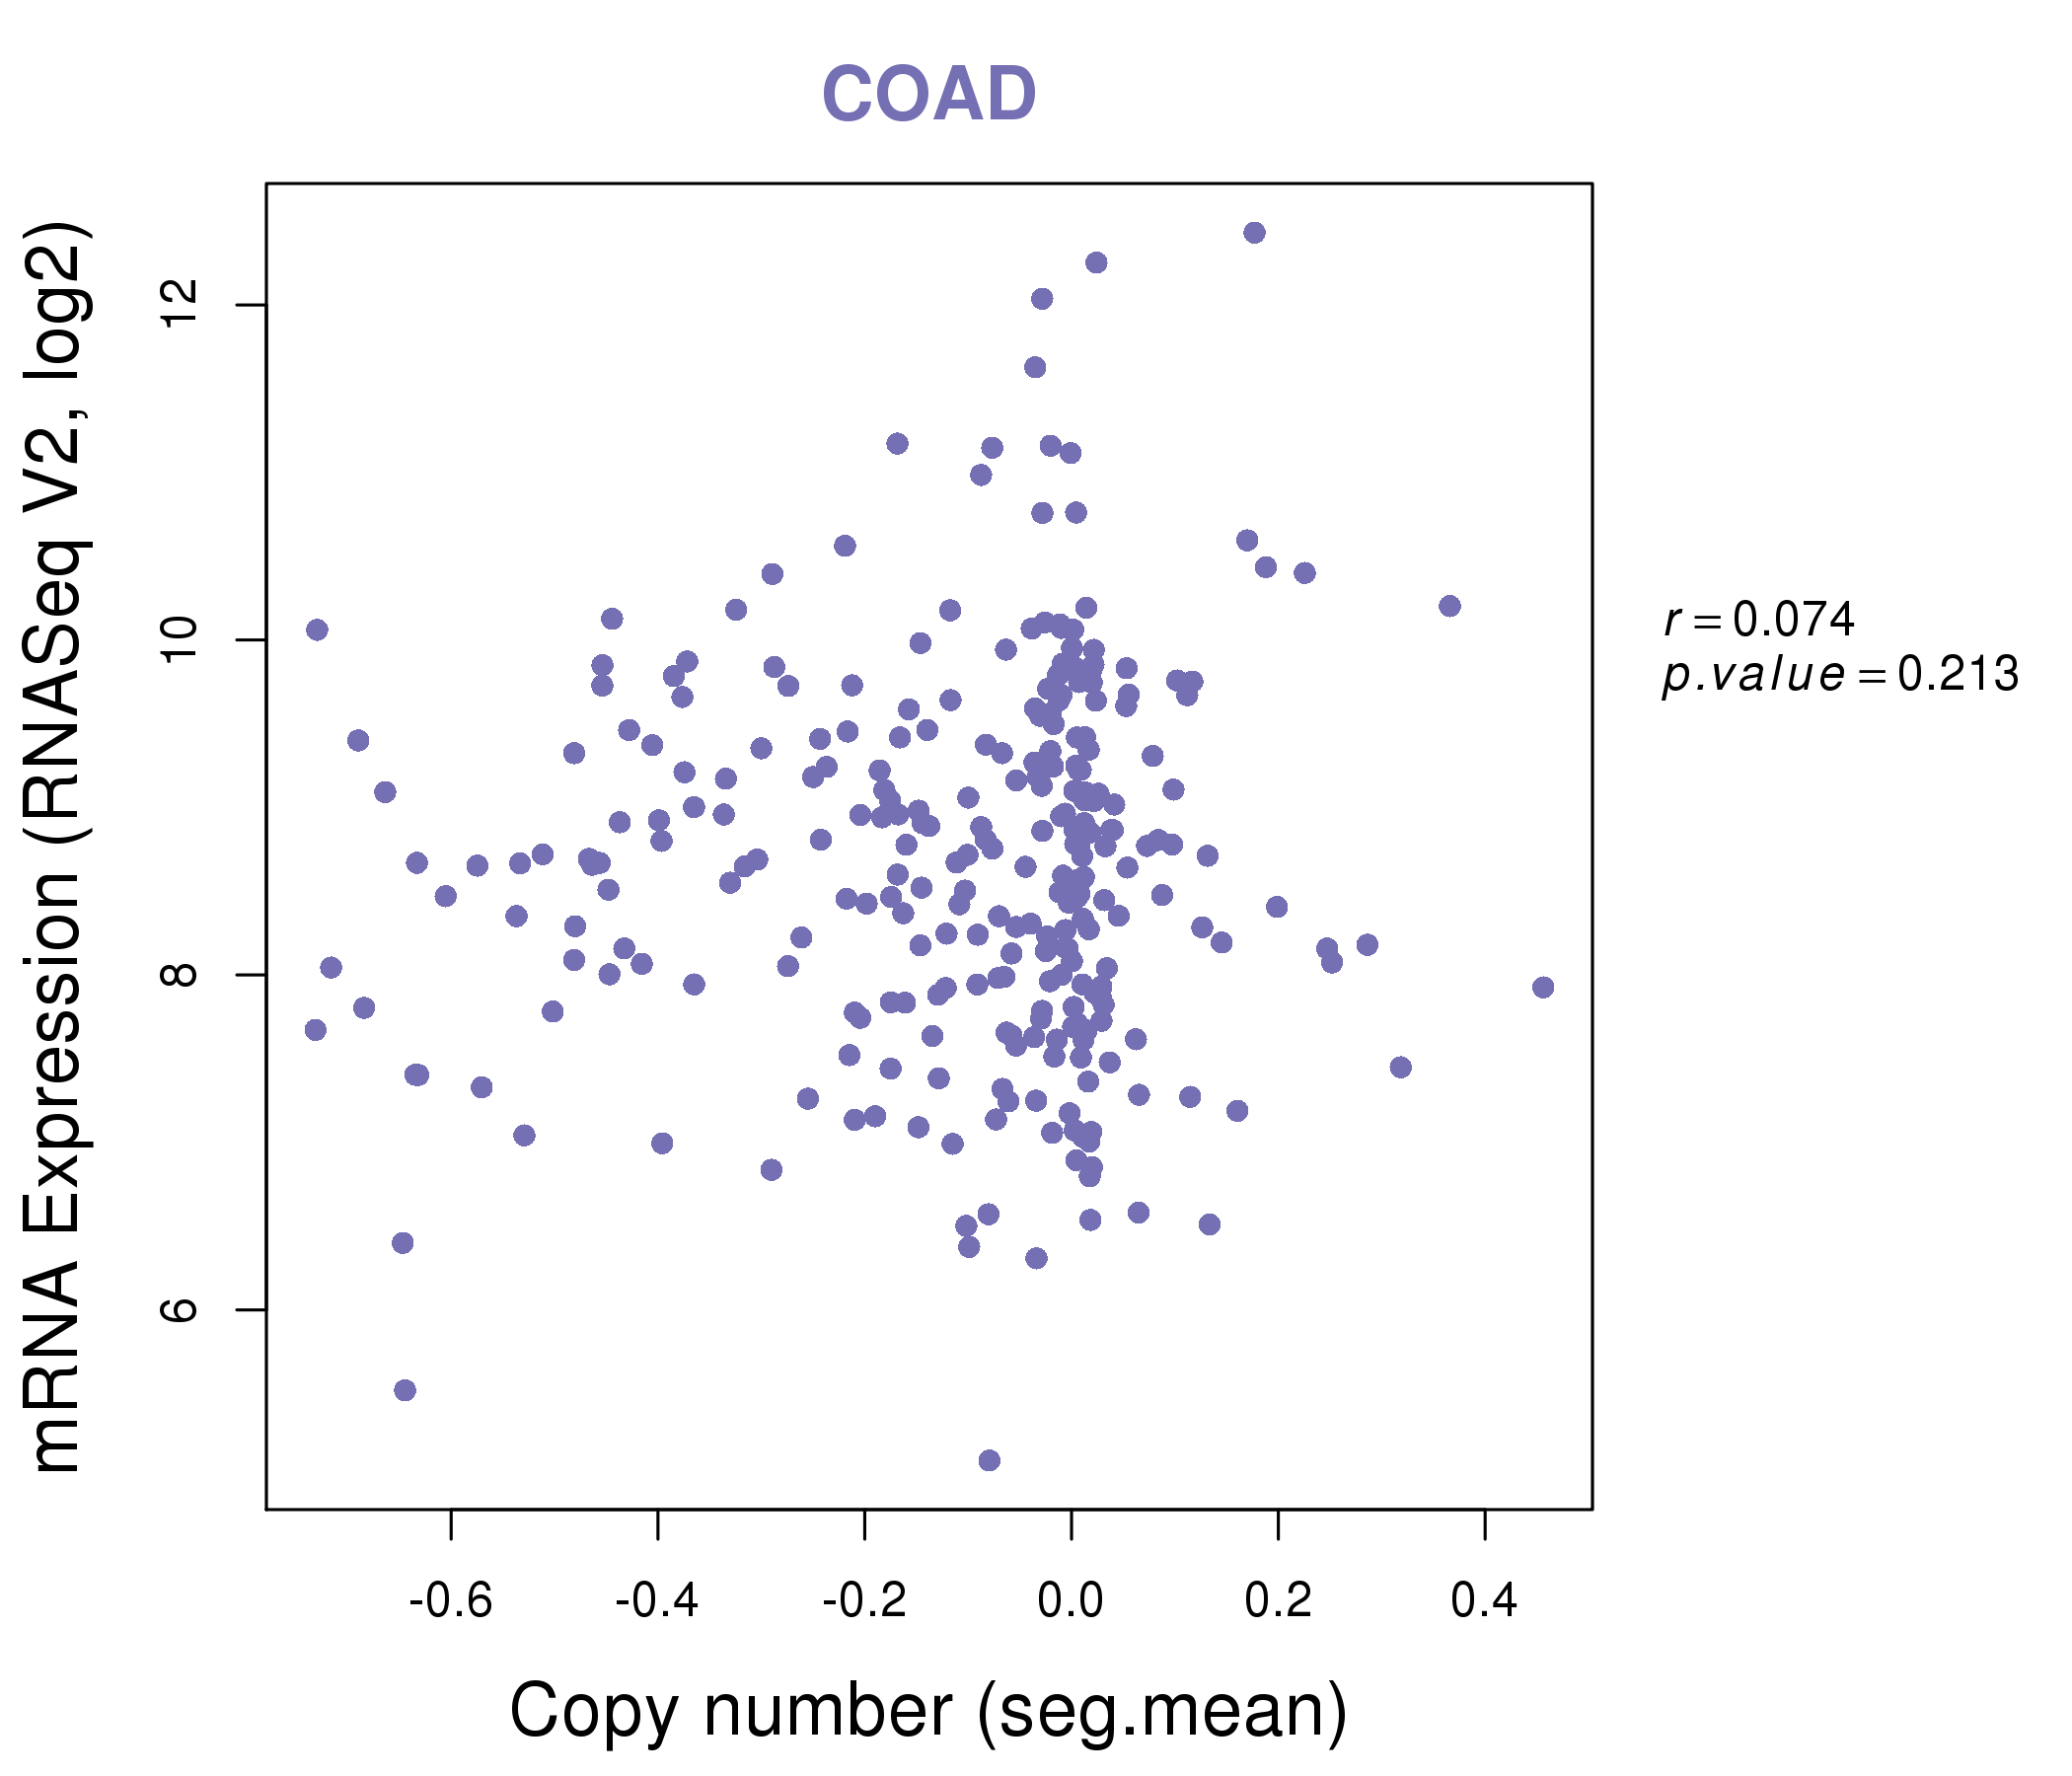
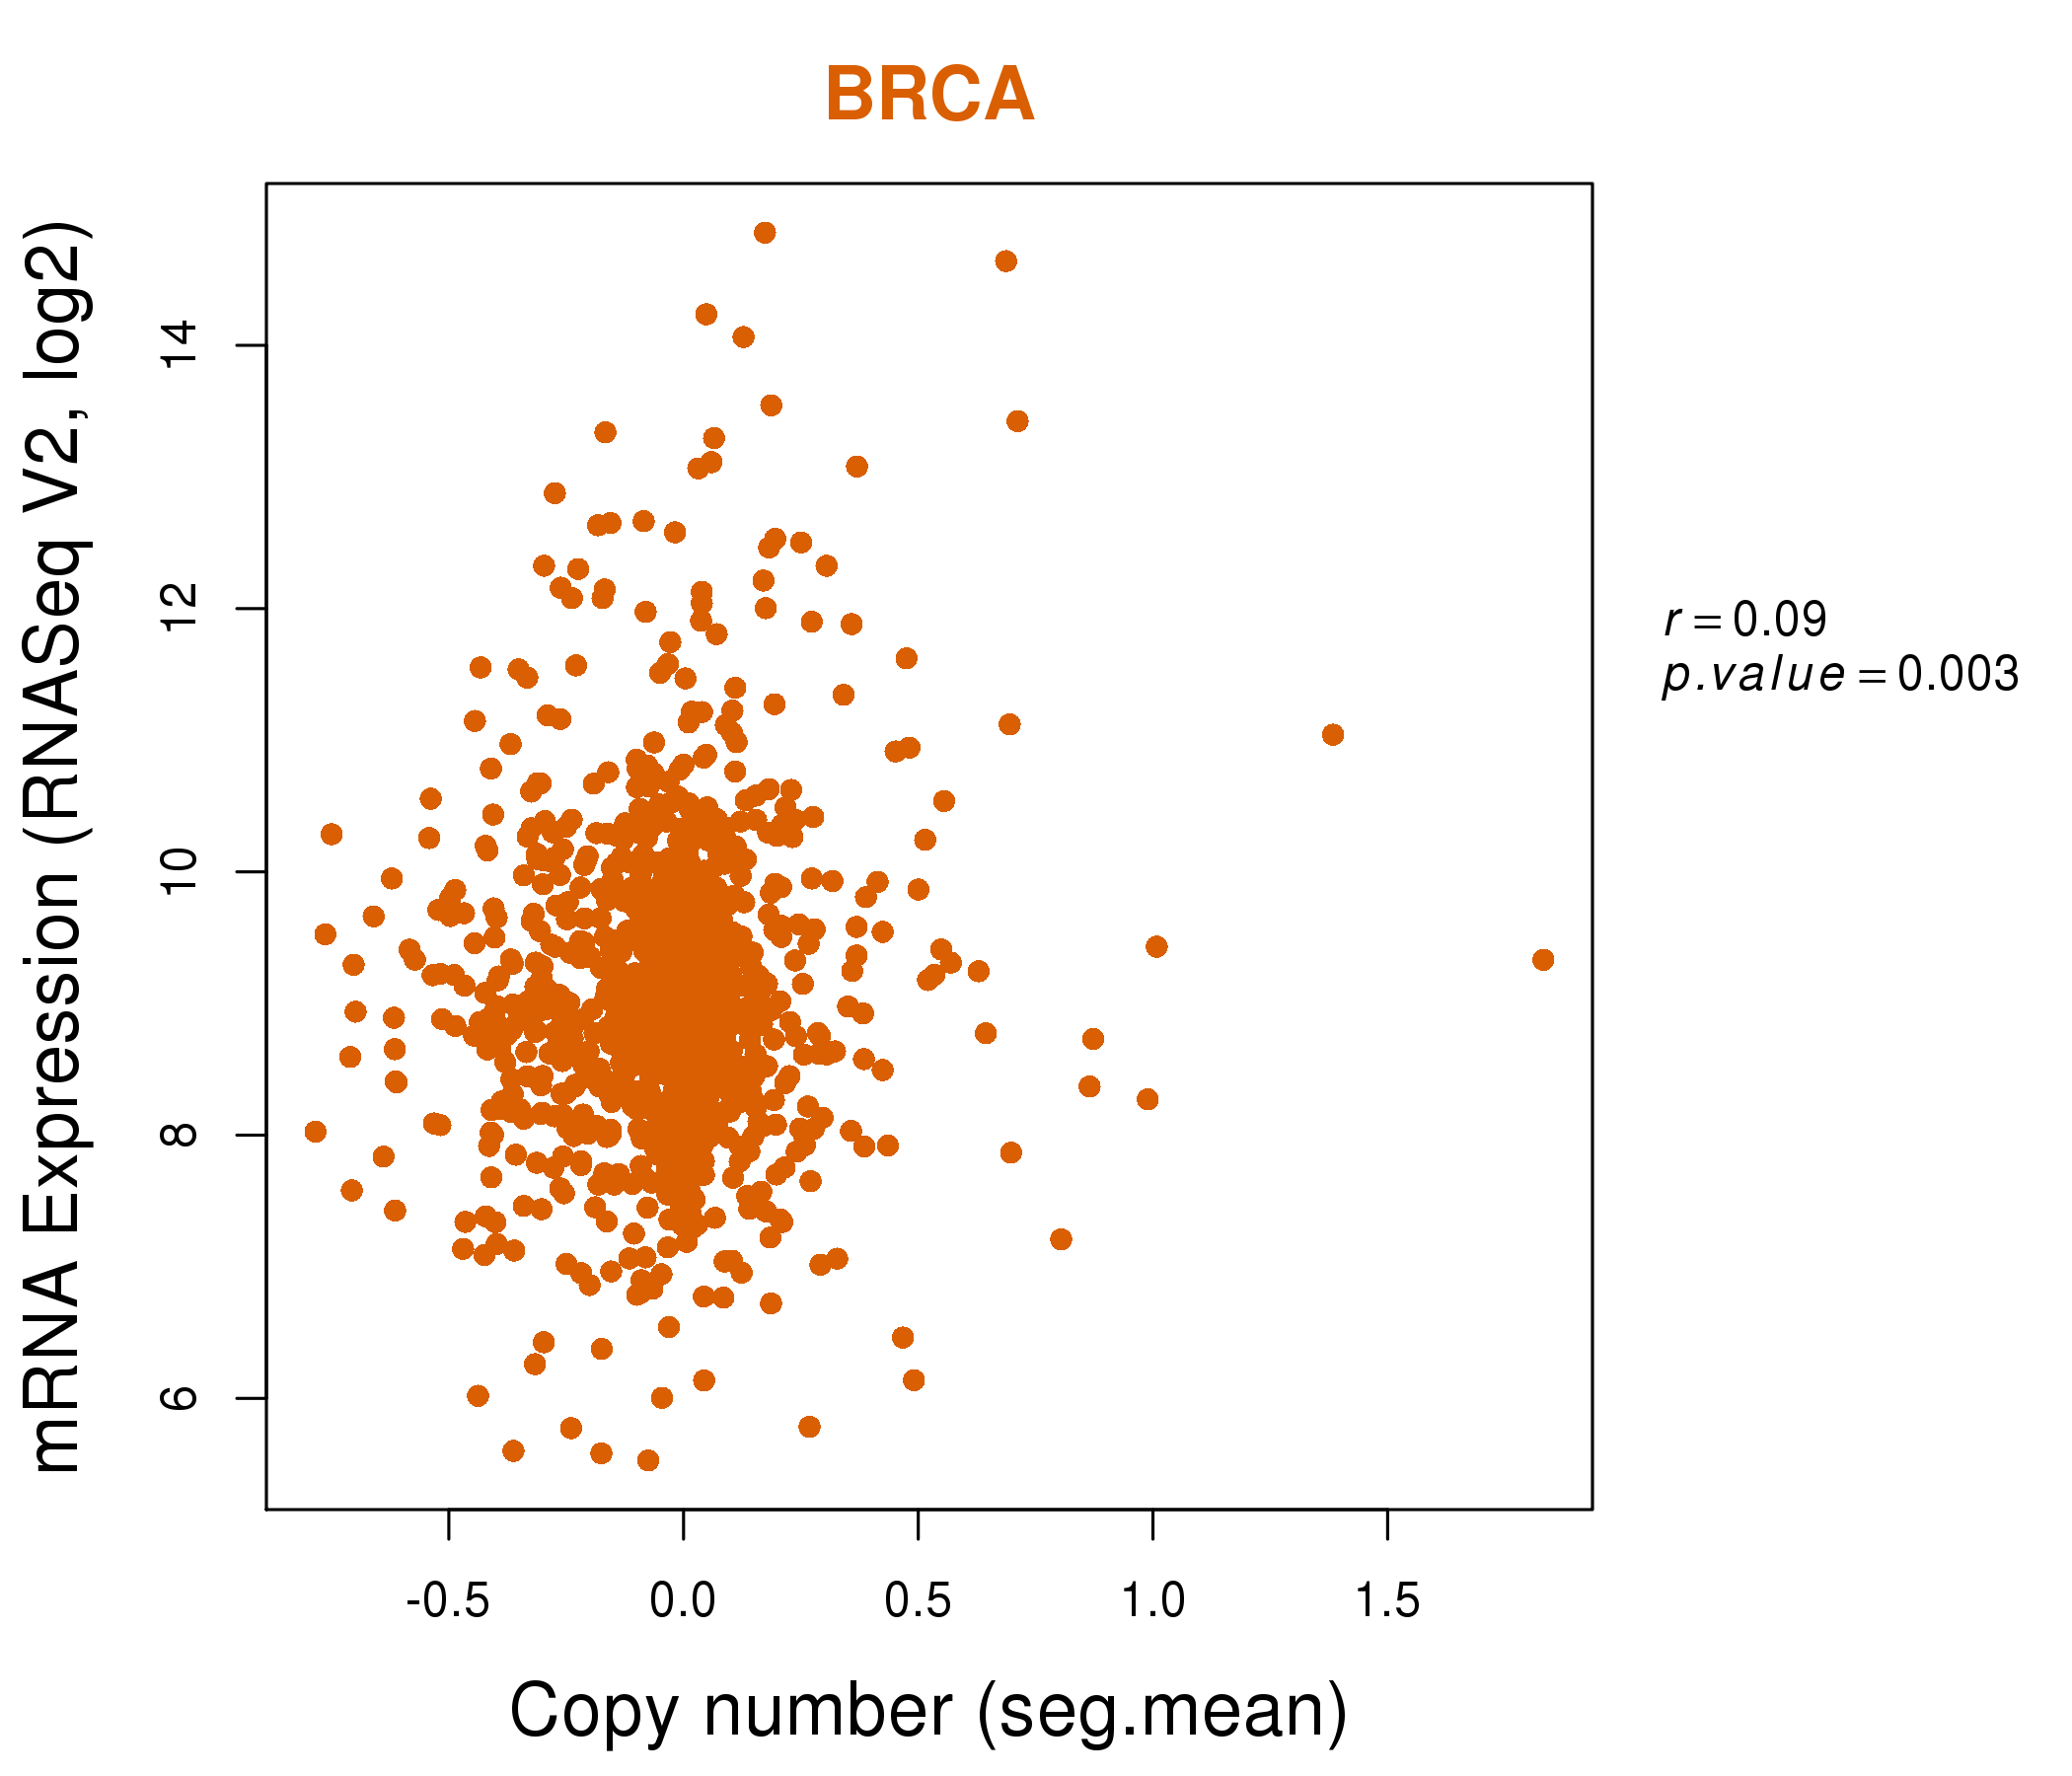
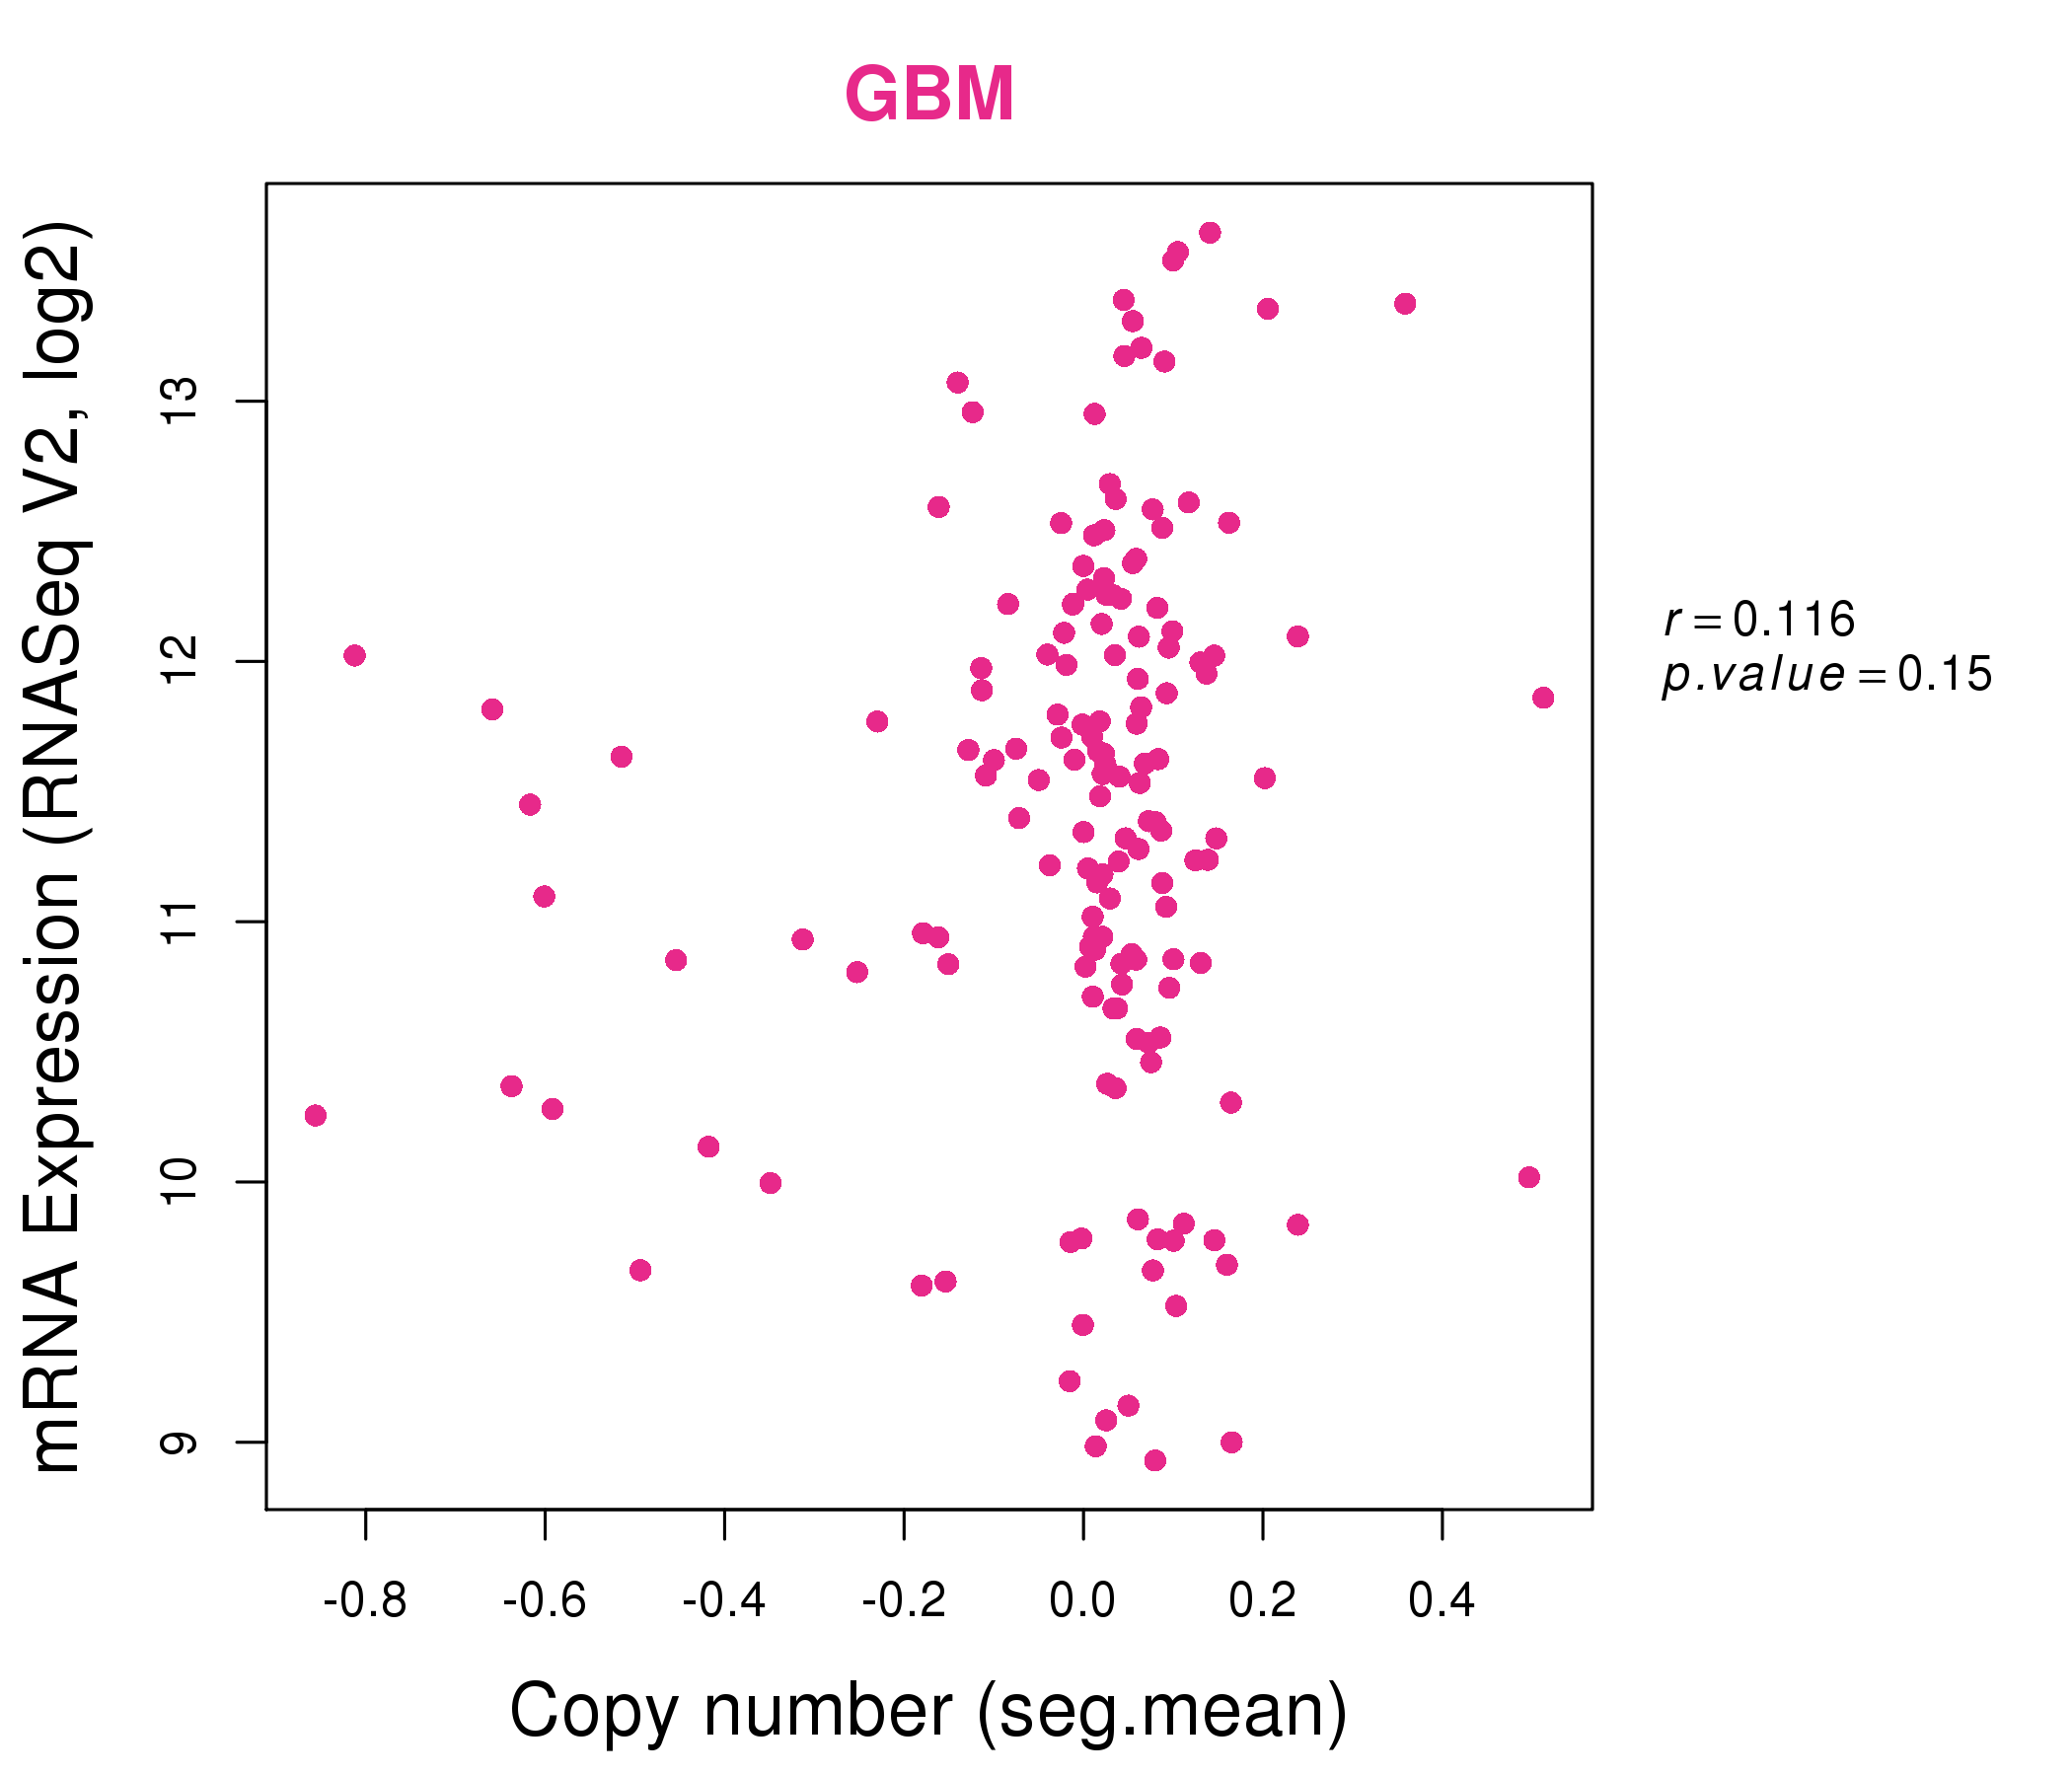
| * This plots show the correlation between CNV and gene expression. |
: Open all plots for all cancer types
 |
|
 |
|
| Top |
| Gene-Gene Network Information |
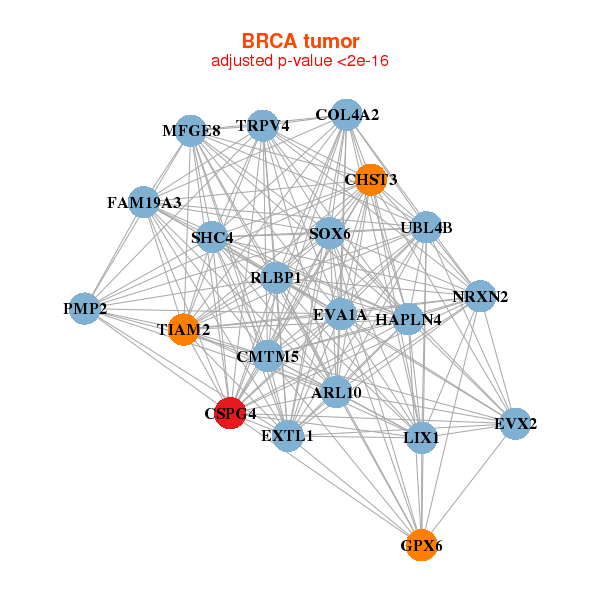
| * Co-Expression network figures were drawn using R package igraph. Only the top 20 genes with the highest correlations were shown. Red circle: input gene, orange circle: cell metabolism gene, sky circle: other gene |
: Open all plots for all cancer types
 |
|
| ARL10,CHST3,CMTM5,COL4A2,CSPG4,EVX2,EXTL1, EVA1A,FAM19A3,GPX6,HAPLN4,LIX1,MFGE8,NRXN2, PMP2,RLBP1,SHC4,SOX6,TIAM2,TRPV4,UBL4B | ABHD15,ACACB,AFAP1L1,AGPAT2,ALDH1L1,AQP7P1,C14orf180, CAMK1,CEBPA,CIDEC,COL4A2,CSPG4,ITGA7,LIPE, MLXIPL,PC,PKDCC,PLA2G16,PNPLA2,RXRA,TMEM132C |
 |
|
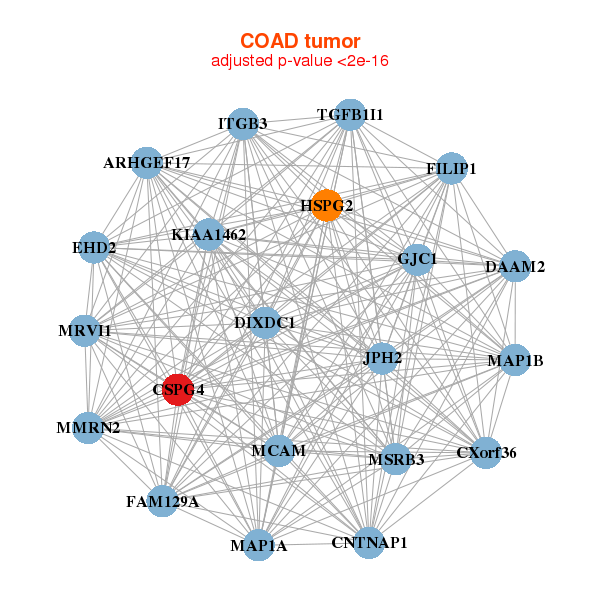
| ARHGEF17,CNTNAP1,CSPG4,CXorf36,DAAM2,DIXDC1,EHD2, FAM129A,FILIP1,GJC1,HSPG2,ITGB3,JPH2,KIAA1462, MAP1A,MAP1B,MCAM,MMRN2,MRVI1,MSRB3,TGFB1I1 | ADARB1,AHNAK2,COL4A1,CSPG4,DCHS1,DMD,DOCK3, EHD2,EVC,FRMPD4,FYCO1,GLI2,LAMA5,LAMB2, MAP4,NBEA,POU3F4,PRICKLE2,RNF150,RYR3,TEAD1 |

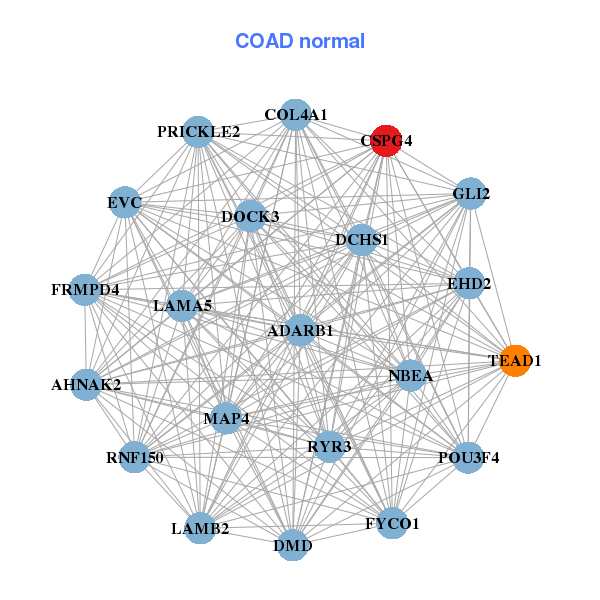
| * Co-Expression network figures were drawn using R package igraph. Only the top 20 genes with the highest correlations were shown. Red circle: input gene, orange circle: cell metabolism gene, sky circle: other gene |
: Open all plots for all cancer types
| Top |
: Open all interacting genes' information including KEGG pathway for all interacting genes from DAVID
| Top |
| Pharmacological Information for CSPG4 |
| There's no related Drug. |
| Top |
| Cross referenced IDs for CSPG4 |
| * We obtained these cross-references from Uniprot database. It covers 150 different DBs, 18 categories. http://www.uniprot.org/help/cross_references_section |
: Open all cross reference information
|
Copyright © 2016-Present - The Univsersity of Texas Health Science Center at Houston @ |