|
||||||||||||||||||||||||||||||||||||||||||||||||||||||||||||||||||||||||||||||||||||||||||||||||||||||||||||||||||||||||||||||||||||||||||||||||||||||||||||||||||||||||||||||||||||||||||||||||||||||||||||||||||||||||||||||||||||||||||||||||||||||||||||||||||||||||||||||||||||||||||||||||||||||||||||||||||||||||||
| |
| Phenotypic Information (metabolism pathway, cancer, disease, phenome) |
| |
| |
| Gene-Gene Network Information: Co-Expression Network, Interacting Genes & KEGG |
| |
|


| Gene Summary for B3GNTL1 |
| Basic gene info. | Gene symbol | B3GNTL1 |
| Gene name | UDP-GlcNAc:betaGal beta-1,3-N-acetylglucosaminyltransferase-like 1 | |
| Synonyms | B3GNT8 | |
| Cytomap | UCSC genome browser: 17q25.3 | |
| Genomic location | chr17 :80901666-81009686 | |
| Type of gene | protein-coding | |
| RefGenes | NM_001009905.1, | |
| Ensembl id | ENSG00000175711 | |
| Description | BGnT-8BGnT-like protein 1UDP-GlcNAc:betaGal beta-1,3-N-acetylglucosaminyltransferase 8UDP-GlcNAc:betaGal beta-1,3-N-acetylglucosaminyltransferase-like protein 1beta-1,3-Gn-T8beta-1,3-N-acetylglucosaminyltransferase 8beta1,3-N-acetylglucosaminyltrans | |
| Modification date | 20141207 | |
| dbXrefs | MIM : 615337 | |
| HGNC : HGNC | ||
| Ensembl : ENSG00000175711 | ||
| HPRD : 14071 | ||
| HPRD : 18527 | ||
| Vega : OTTHUMG00000177788 | ||
| Protein | UniProt: go to UniProt's Cross Reference DB Table | |
| Expression | CleanEX: HS_B3GNTL1 | |
| BioGPS: 146712 | ||
| Gene Expression Atlas: ENSG00000175711 | ||
| The Human Protein Atlas: ENSG00000175711 | ||
| Pathway | NCI Pathway Interaction Database: B3GNTL1 | |
| KEGG: B3GNTL1 | ||
| REACTOME: B3GNTL1 | ||
| ConsensusPathDB | ||
| Pathway Commons: B3GNTL1 | ||
| Metabolism | MetaCyc: B3GNTL1 | |
| HUMANCyc: B3GNTL1 | ||
| Regulation | Ensembl's Regulation: ENSG00000175711 | |
| miRBase: chr17 :80,901,666-81,009,686 | ||
| TargetScan: NM_001009905 | ||
| cisRED: ENSG00000175711 | ||
| Context | iHOP: B3GNTL1 | |
| cancer metabolism search in PubMed: B3GNTL1 | ||
| UCL Cancer Institute: B3GNTL1 | ||
| Assigned class in ccmGDB | C | |
| Top |
| Phenotypic Information for B3GNTL1(metabolism pathway, cancer, disease, phenome) |
| Cancer | CGAP: B3GNTL1 |
| Familial Cancer Database: B3GNTL1 | |
| * This gene is included in those cancer gene databases. |
|
|
|
|
|
| . | ||||||||||||||||||||||||||||||||||||||||||||||||||||||||||||||||||||||||||||||||||||||||||||||||||||||||||||||||||||||||||||||||||||||||||||||||||||||||||||||||||||||||||||||||||||||||||||||||||||||||||||||||||||||||||||||||||||||||||||||||||||||||||||||||||||||||||||||||||||||||||||||||||||||||||||||||||||
Oncogene 1 | Significant driver gene in | |||||||||||||||||||||||||||||||||||||||||||||||||||||||||||||||||||||||||||||||||||||||||||||||||||||||||||||||||||||||||||||||||||||||||||||||||||||||||||||||||||||||||||||||||||||||||||||||||||||||||||||||||||||||||||||||||||||||||||||||||||||||||||||||||||||||||||||||||||||||||||||||||||||||||||||||||||||||||
| cf) number; DB name 1 Oncogene; http://nar.oxfordjournals.org/content/35/suppl_1/D721.long, 2 Tumor Suppressor gene; https://bioinfo.uth.edu/TSGene/, 3 Cancer Gene Census; http://www.nature.com/nrc/journal/v4/n3/abs/nrc1299.html, 4 CancerGenes; http://nar.oxfordjournals.org/content/35/suppl_1/D721.long, 5 Network of Cancer Gene; http://ncg.kcl.ac.uk/index.php, 1Therapeutic Vulnerabilities in Cancer; http://cbio.mskcc.org/cancergenomics/statius/ |
| REACTOME_METABOLISM_OF_PROTEINS | |
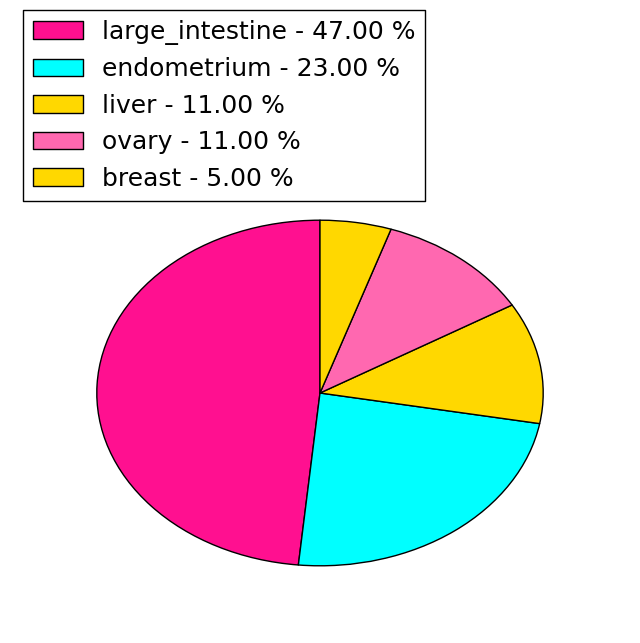
| Mutations for B3GNTL1 |
| * Under tables are showing count per each tissue to give us broad intuition about tissue specific mutation patterns.You can go to the detailed page for each mutation database's web site. |
| - Statistics for Tissue and Mutation type | Top |
 |
| - For Inter-chromosomal Variations |
| * Inter-chromosomal variantions includes 'interchromosomal amplicon to amplicon', 'interchromosomal amplicon to non-amplified dna', 'interchromosomal insertion', 'Interchromosomal unknown type'. |
 |
| - For Intra-chromosomal Variations |
| There's no intra-chromosomal structural variation. |
| Sample | Symbol_a | Chr_a | Start_a | End_a | Symbol_b | Chr_b | Start_b | End_b |
| pancreas | B3GNTL1 | chr17 | 80905227 | 80905247 | B3GNTL1 | chr17 | 80916533 | 80916553 |
| cf) Tissue number; Tissue name (1;Breast, 2;Central_nervous_system, 3;Haematopoietic_and_lymphoid_tissue, 4;Large_intestine, 5;Liver, 6;Lung, 7;Ovary, 8;Pancreas, 9;Prostate, 10;Skin, 11;Soft_tissue, 12;Upper_aerodigestive_tract) |
| * From mRNA Sanger sequences, Chitars2.0 arranged chimeric transcripts. This table shows B3GNTL1 related fusion information. |
| ID | Head Gene | Tail Gene | Accession | Gene_a | qStart_a | qEnd_a | Chromosome_a | tStart_a | tEnd_a | Gene_a | qStart_a | qEnd_a | Chromosome_a | tStart_a | tEnd_a |
| AW063448 | B3GNTL1 | 13 | 78 | 17 | 80943776 | 80943841 | B3GNTL1 | 75 | 418 | 17 | 80944020 | 80944363 | |
| Top |
| Mutation type/ Tissue ID | brca | cns | cerv | endome | haematopo | kidn | Lintest | liver | lung | ns | ovary | pancre | prost | skin | stoma | thyro | urina | |||
| Total # sample | 3 | 1 | 2 | 1 | ||||||||||||||||
| GAIN (# sample) | ||||||||||||||||||||
| LOSS (# sample) | 3 | 1 | 2 | 1 |
| cf) Tissue ID; Tissue type (1; Breast, 2; Central_nervous_system, 3; Cervix, 4; Endometrium, 5; Haematopoietic_and_lymphoid_tissue, 6; Kidney, 7; Large_intestine, 8; Liver, 9; Lung, 10; NS, 11; Ovary, 12; Pancreas, 13; Prostate, 14; Skin, 15; Stomach, 16; Thyroid, 17; Urinary_tract) |
| Top |
|
 |
| Top |
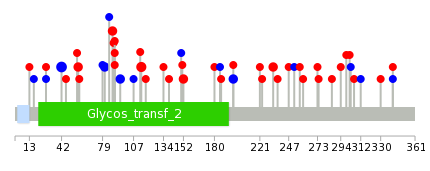
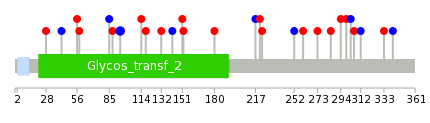
| Stat. for Non-Synonymous SNVs (# total SNVs=16) | (# total SNVs=17) |
 |  |
(# total SNVs=0) | (# total SNVs=0) |
| Top |
| * When you move the cursor on each content, you can see more deailed mutation information on the Tooltip. Those are primary_site,primary_histology,mutation(aa),pubmedID. |
| GRCh37 position | Mutation(aa) | Unique sampleID count |
| chr17:81006596-81006596 | p.Q42Q | 4 |
| chr17:80992912-80992912 | p.S114L | 3 |
| chr17:81006361-81006361 | p.P88L | 2 |
| chr17:80923536-80923536 | p.E197E | 2 |
| chr17:81006381-81006381 | p.I81I | 2 |
| chr17:81006553-81006553 | p.A57T | 2 |
| chr17:80992968-80992968 | p.Y95Y | 2 |
| chr17:80963040-80963040 | p.R152Q | 2 |
| chr17:81006356-81006356 | p.P90T | 2 |
| chr17:80918961-80918961 | p.P233S | 2 |
| Top |
|
 |
| Point Mutation/ Tissue ID | 1 | 2 | 3 | 4 | 5 | 6 | 7 | 8 | 9 | 10 | 11 | 12 | 13 | 14 | 15 | 16 | 17 | 18 | 19 | 20 |
| # sample | 2 | 1 | 1 | 3 | 1 | 2 | 1 | 1 | 8 | 3 | 1 | 5 | ||||||||
| # mutation | 2 | 1 | 1 | 3 | 1 | 2 | 1 | 1 | 8 | 3 | 1 | 5 | ||||||||
| nonsynonymous SNV | 2 | 2 | 1 | 2 | 1 | 7 | 2 | 1 | 1 | |||||||||||
| synonymous SNV | 1 | 1 | 1 | 1 | 1 | 1 | 4 |
| cf) Tissue ID; Tissue type (1; BLCA[Bladder Urothelial Carcinoma], 2; BRCA[Breast invasive carcinoma], 3; CESC[Cervical squamous cell carcinoma and endocervical adenocarcinoma], 4; COAD[Colon adenocarcinoma], 5; GBM[Glioblastoma multiforme], 6; Glioma Low Grade, 7; HNSC[Head and Neck squamous cell carcinoma], 8; KICH[Kidney Chromophobe], 9; KIRC[Kidney renal clear cell carcinoma], 10; KIRP[Kidney renal papillary cell carcinoma], 11; LAML[Acute Myeloid Leukemia], 12; LUAD[Lung adenocarcinoma], 13; LUSC[Lung squamous cell carcinoma], 14; OV[Ovarian serous cystadenocarcinoma ], 15; PAAD[Pancreatic adenocarcinoma], 16; PRAD[Prostate adenocarcinoma], 17; SKCM[Skin Cutaneous Melanoma], 18:STAD[Stomach adenocarcinoma], 19:THCA[Thyroid carcinoma], 20:UCEC[Uterine Corpus Endometrial Carcinoma]) |
| Top |
| * We represented just top 10 SNVs. When you move the cursor on each content, you can see more deailed mutation information on the Tooltip. Those are primary_site, primary_histology, mutation(aa), pubmedID. |
| Genomic Position | Mutation(aa) | Unique sampleID count |
| chr17:80992968 | p.Y95Y | 2 |
| chr17:80972342 | p.D223N | 1 |
| chr17:80915279 | p.N28D | 1 |
| chr17:80972384 | p.R221S | 1 |
| chr17:80915317 | p.G217G | 1 |
| chr17:80992912 | p.P180A | 1 |
| chr17:80915340 | p.R152Q | 1 |
| chr17:80904842 | p.A341A | 1 |
| chr17:80918991 | p.E151K | 1 |
| chr17:81006361 | p.V333L | 1 |
| * Copy number data were extracted from TCGA using R package TCGA-Assembler. The URLs of all public data files on TCGA DCC data server were gathered on Jan-05-2015. Function ProcessCNAData in TCGA-Assembler package was used to obtain gene-level copy number value which is calculated as the average copy number of the genomic region of a gene. |
 |
| cf) Tissue ID[Tissue type]: BLCA[Bladder Urothelial Carcinoma], BRCA[Breast invasive carcinoma], CESC[Cervical squamous cell carcinoma and endocervical adenocarcinoma], COAD[Colon adenocarcinoma], GBM[Glioblastoma multiforme], Glioma Low Grade, HNSC[Head and Neck squamous cell carcinoma], KICH[Kidney Chromophobe], KIRC[Kidney renal clear cell carcinoma], KIRP[Kidney renal papillary cell carcinoma], LAML[Acute Myeloid Leukemia], LUAD[Lung adenocarcinoma], LUSC[Lung squamous cell carcinoma], OV[Ovarian serous cystadenocarcinoma ], PAAD[Pancreatic adenocarcinoma], PRAD[Prostate adenocarcinoma], SKCM[Skin Cutaneous Melanoma], STAD[Stomach adenocarcinoma], THCA[Thyroid carcinoma], UCEC[Uterine Corpus Endometrial Carcinoma] |
| Top |
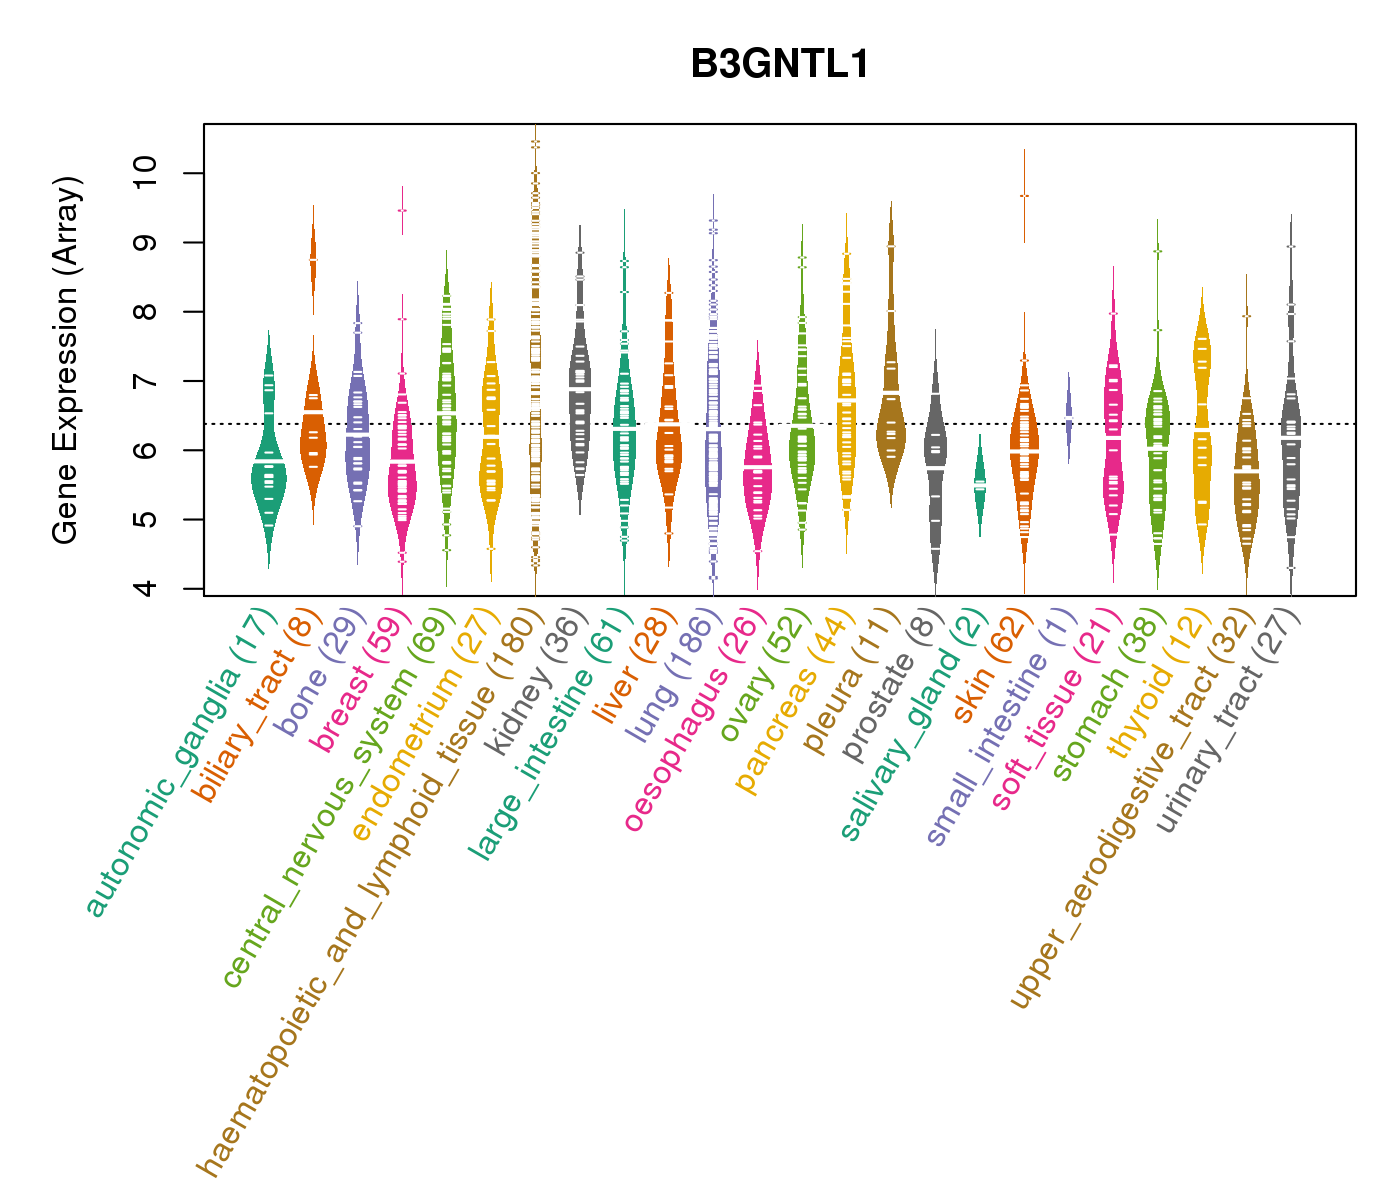
| Gene Expression for B3GNTL1 |
| * CCLE gene expression data were extracted from CCLE_Expression_Entrez_2012-10-18.res: Gene-centric RMA-normalized mRNA expression data. |
 |
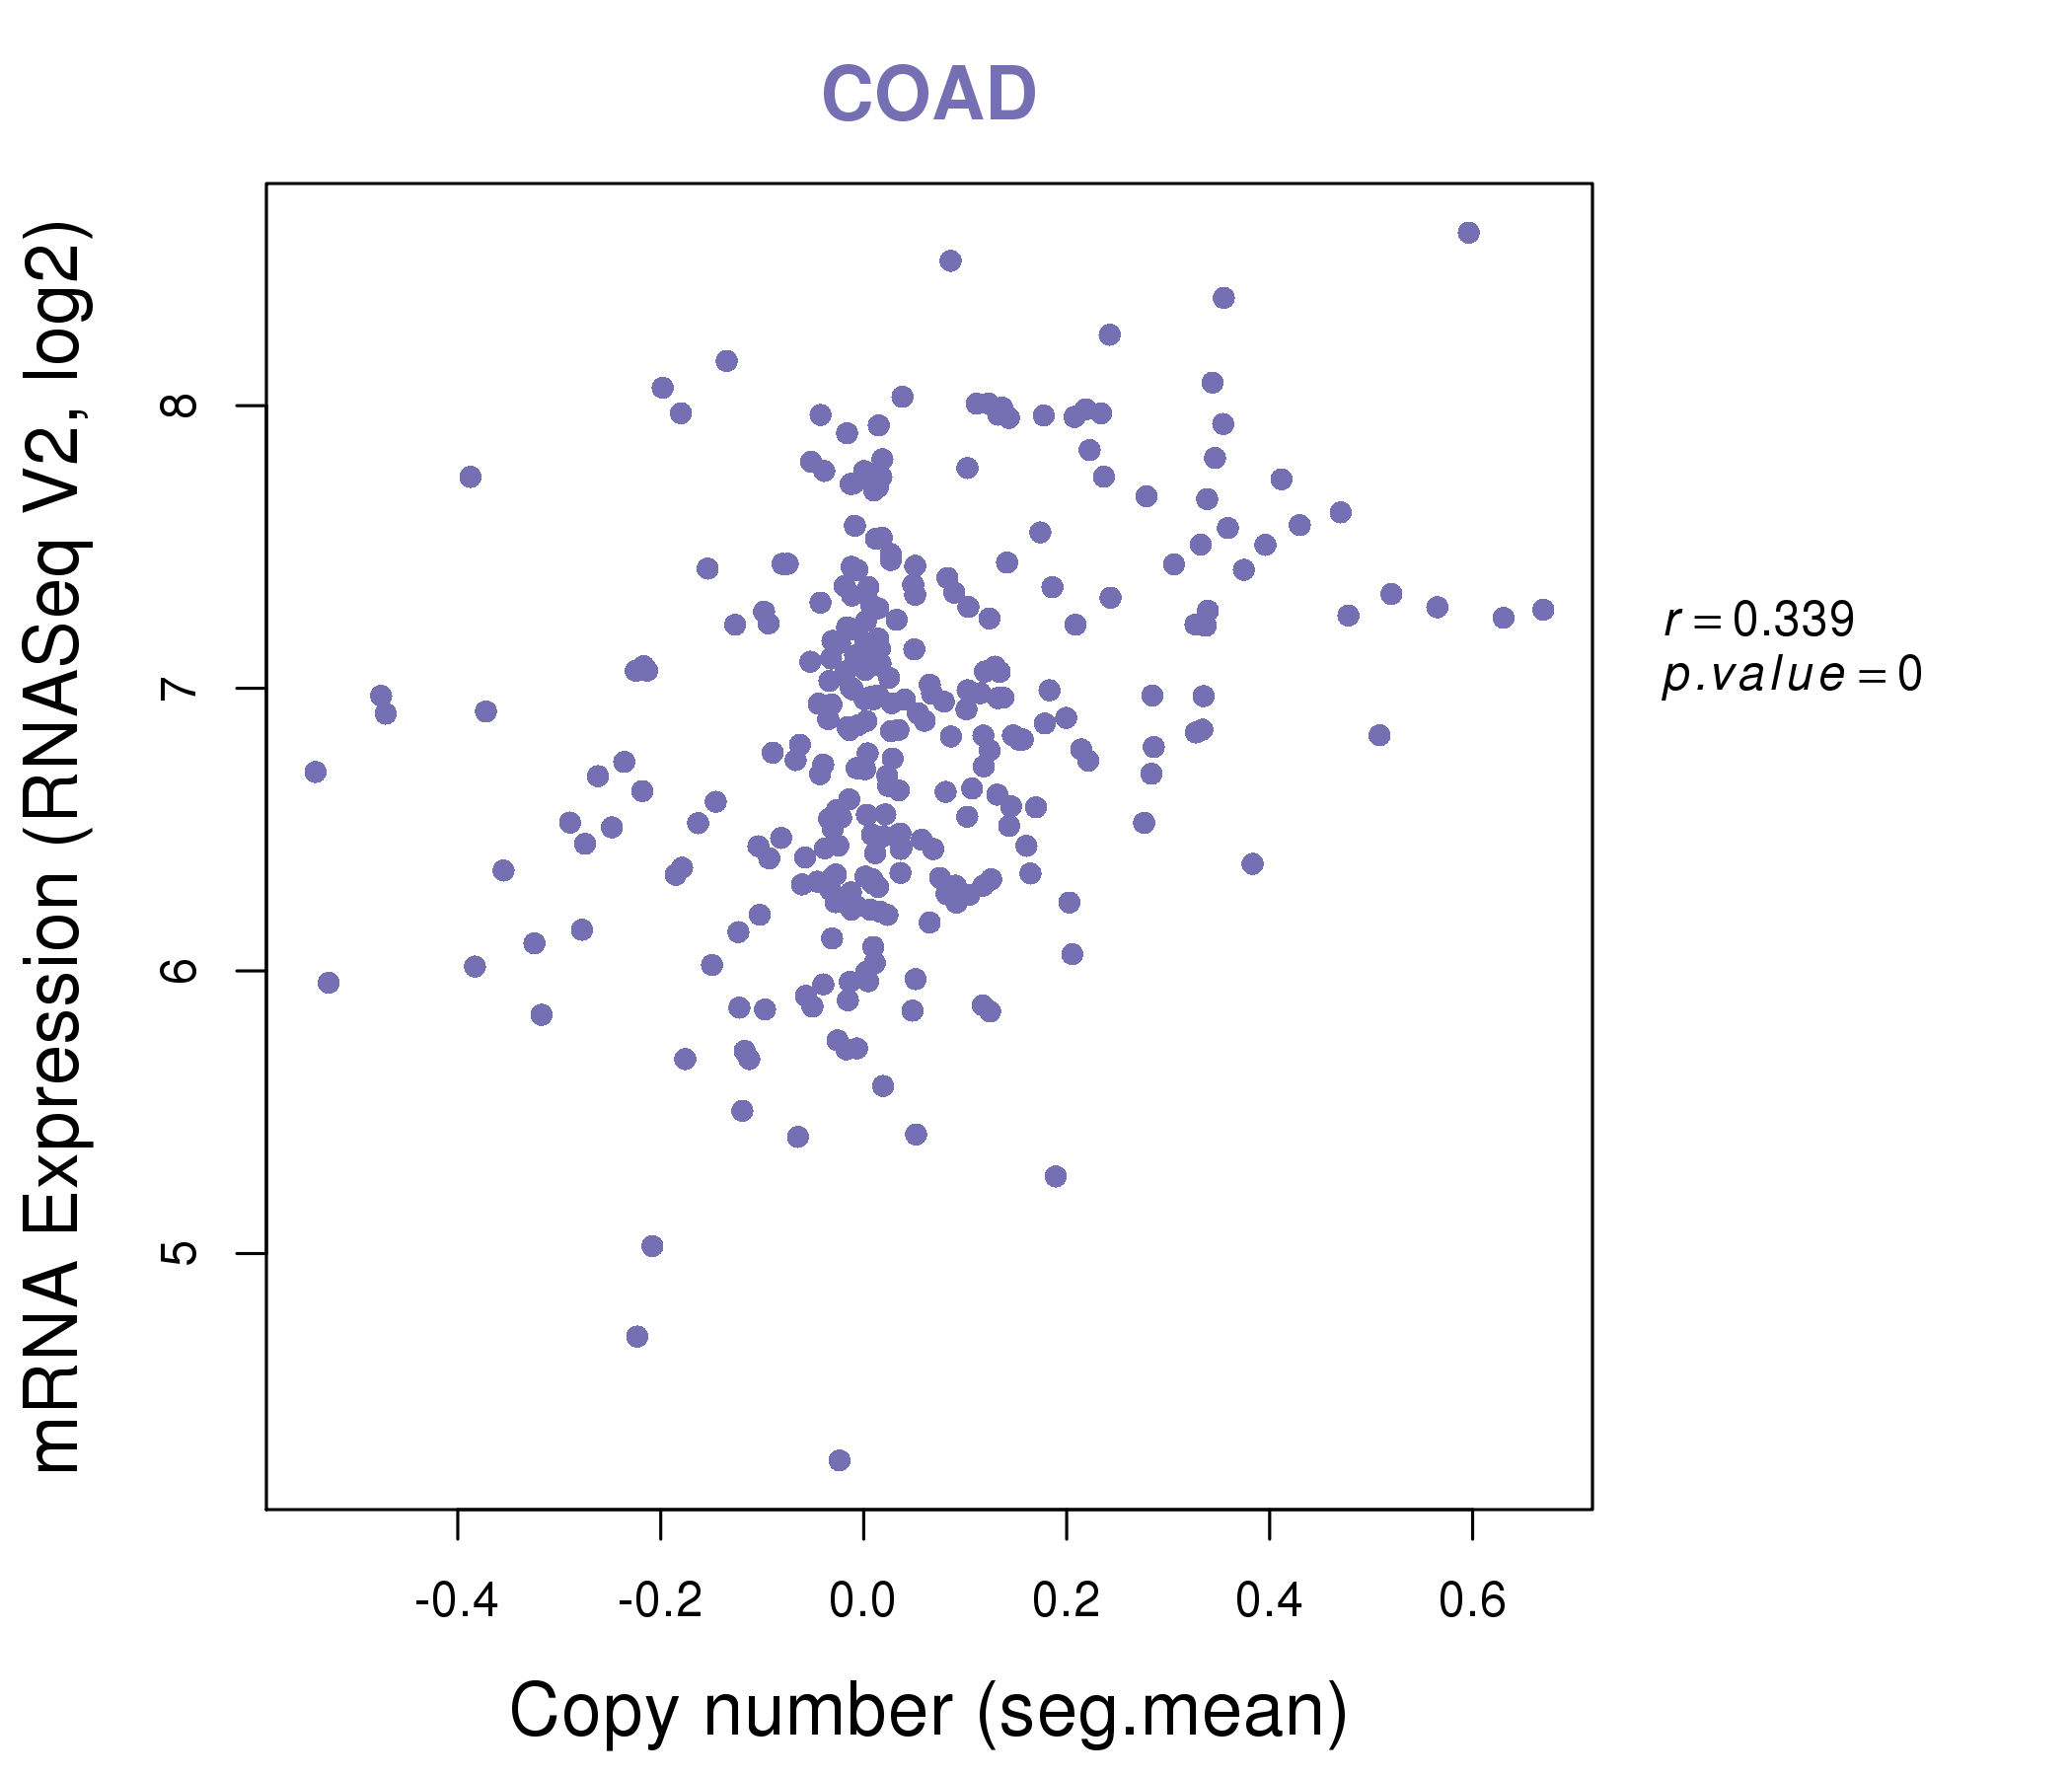
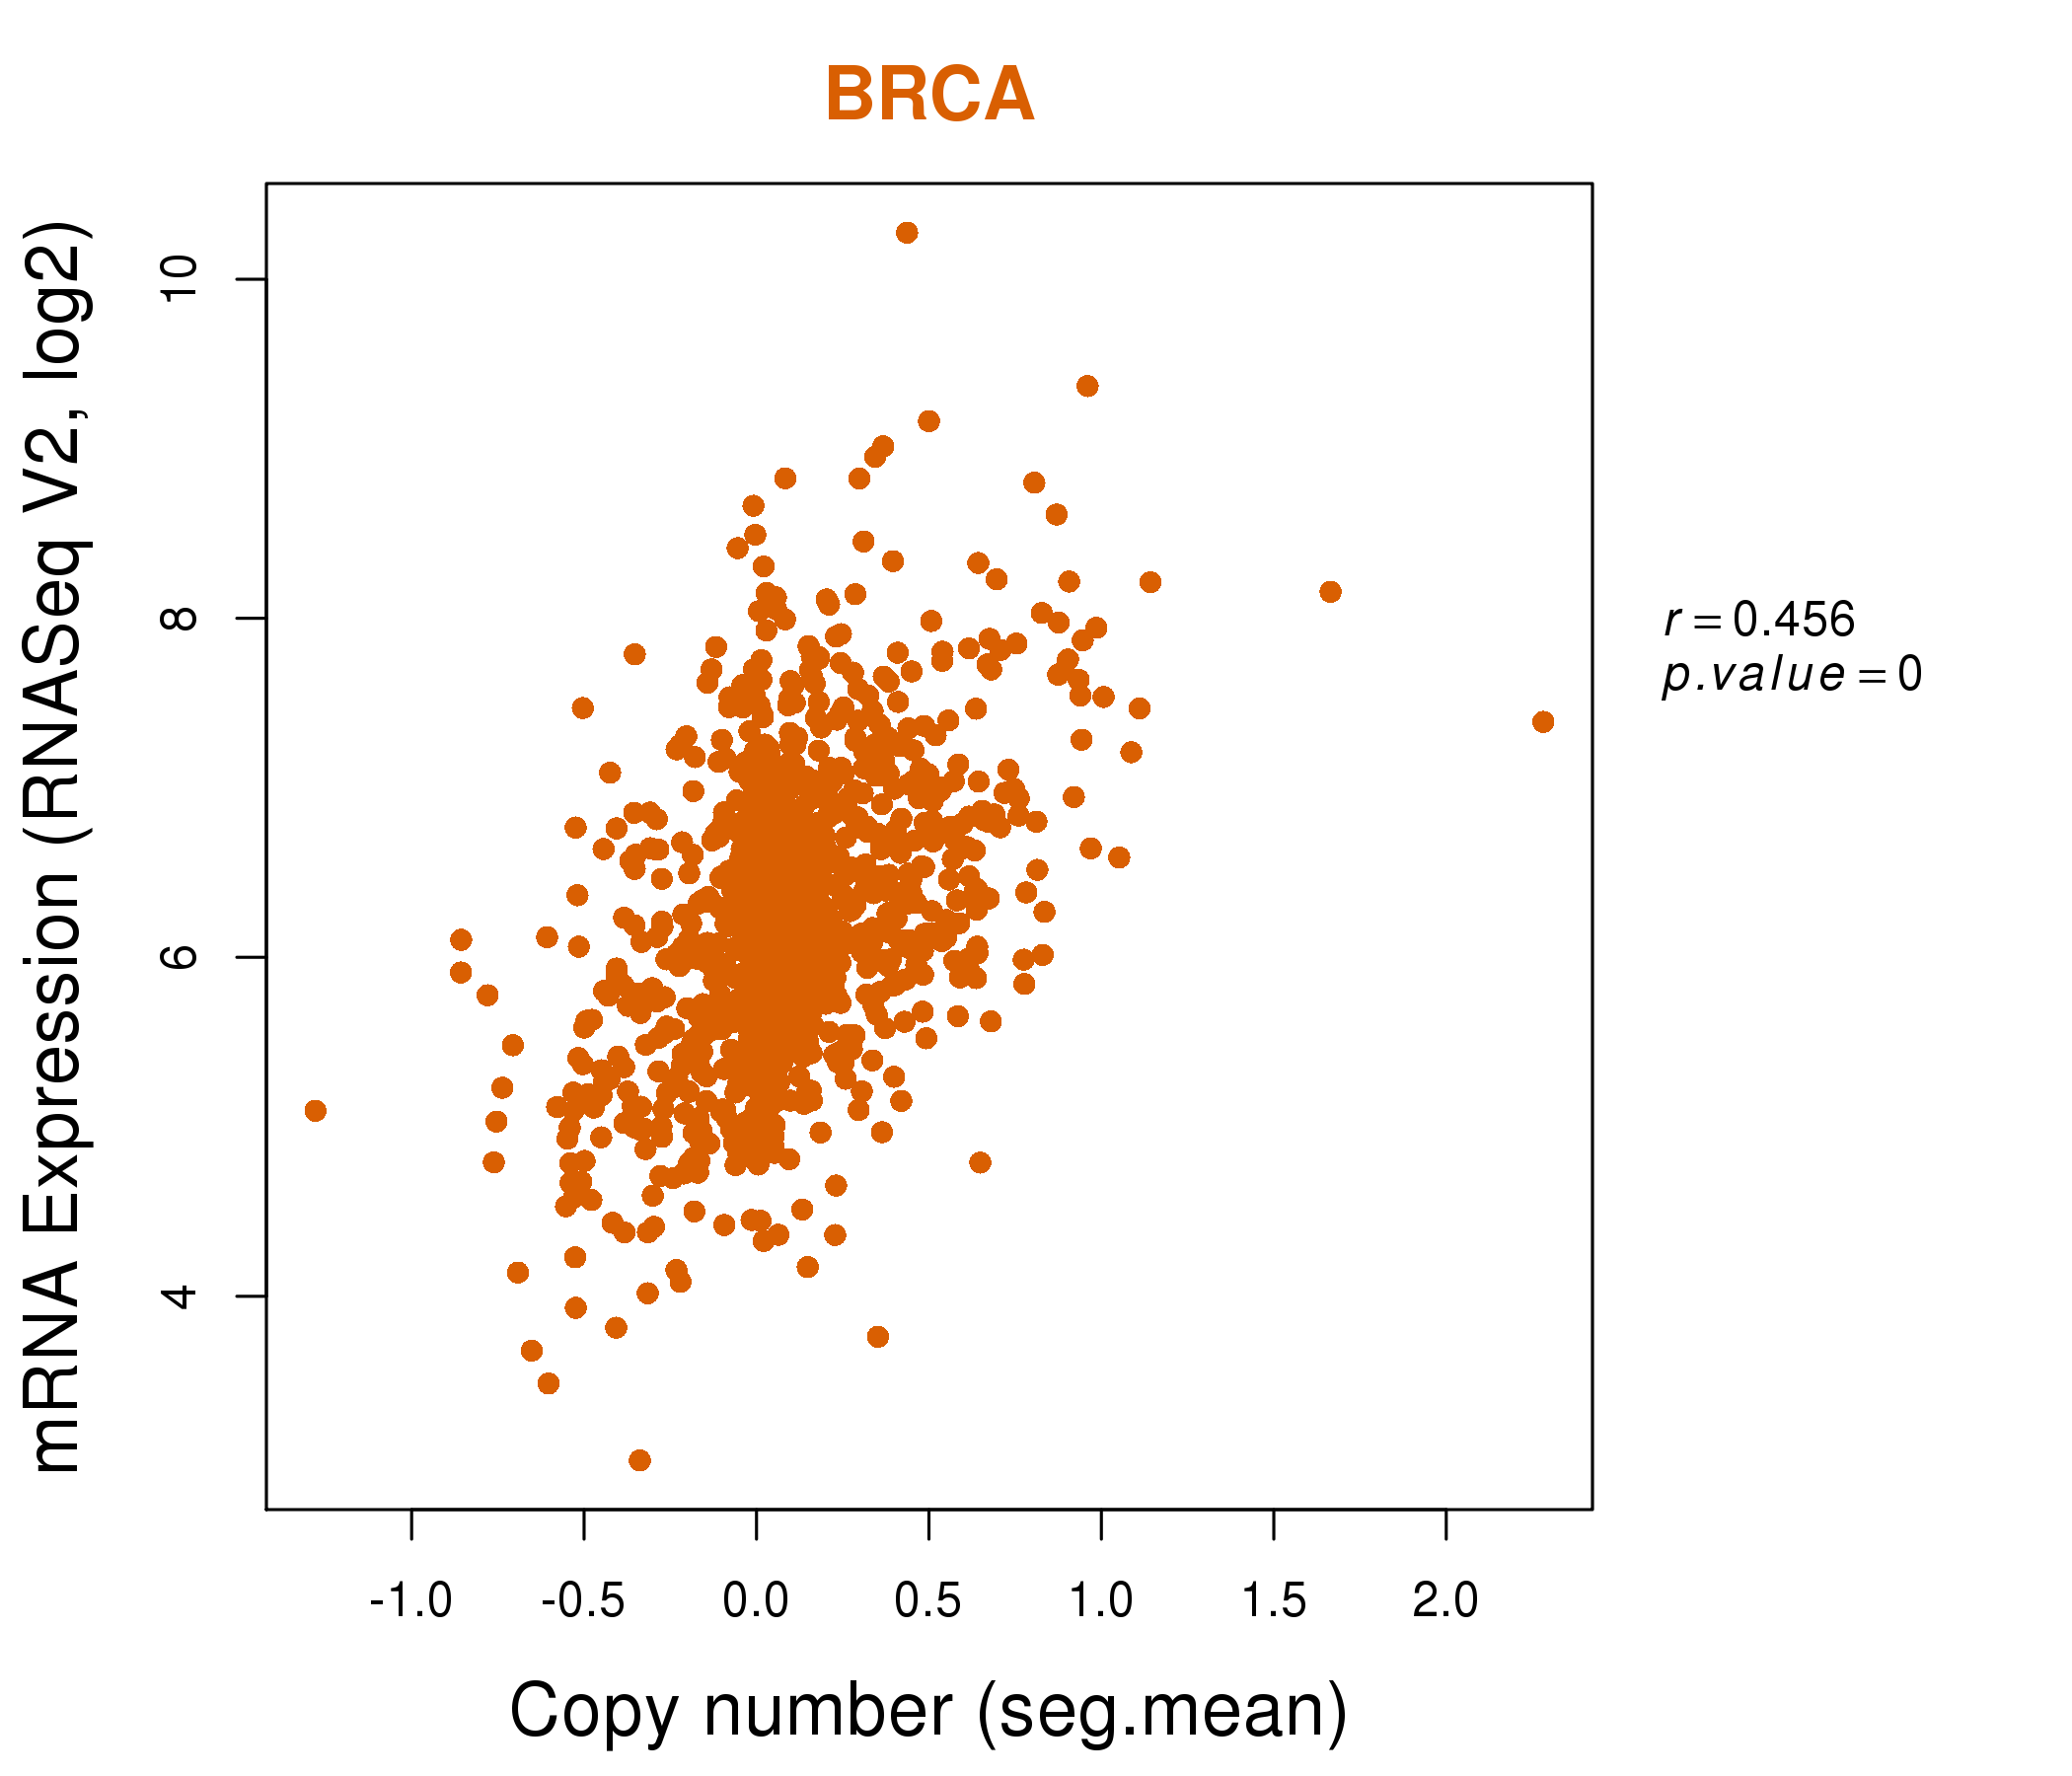
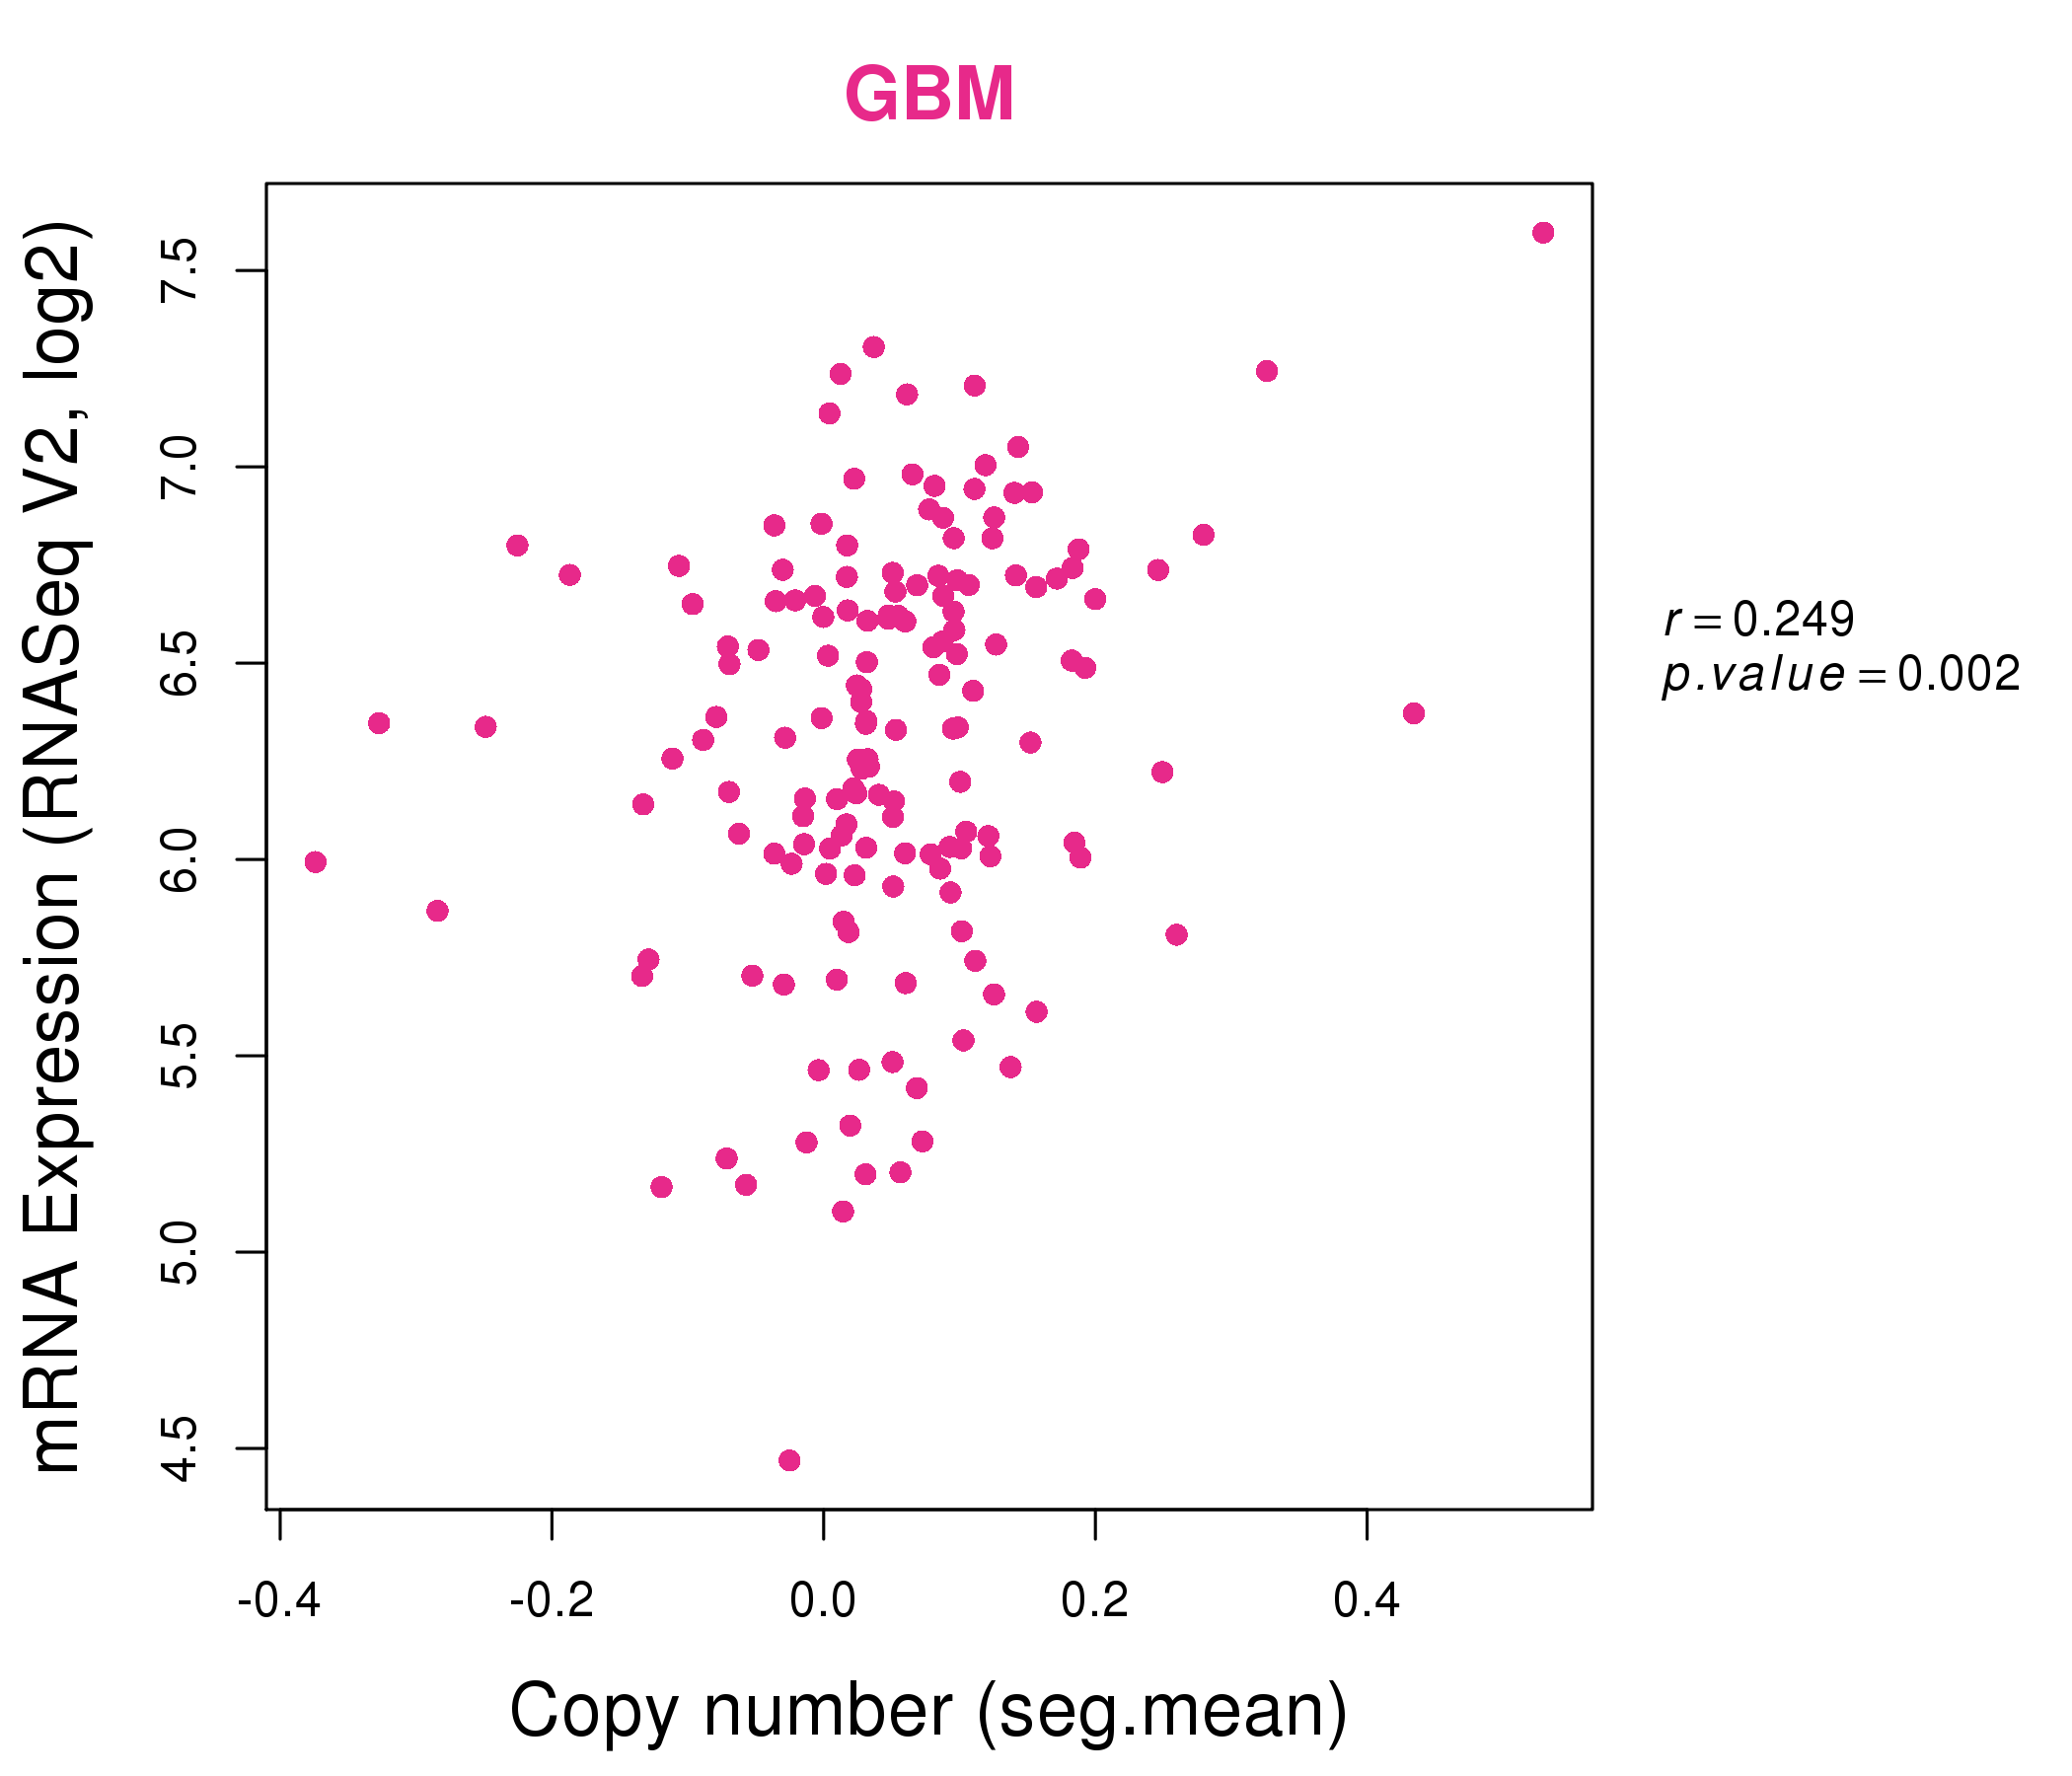
| * Normalized gene expression data of RNASeqV2 was extracted from TCGA using R package TCGA-Assembler. The URLs of all public data files on TCGA DCC data server were gathered at Jan-05-2015. Only eight cancer types have enough normal control samples for differential expression analysis. (t test, adjusted p<0.05 (using Benjamini-Hochberg FDR)) |
 |
| Top |
| * This plots show the correlation between CNV and gene expression. |
: Open all plots for all cancer types
 |
|
 |
|
| Top |
| Gene-Gene Network Information |
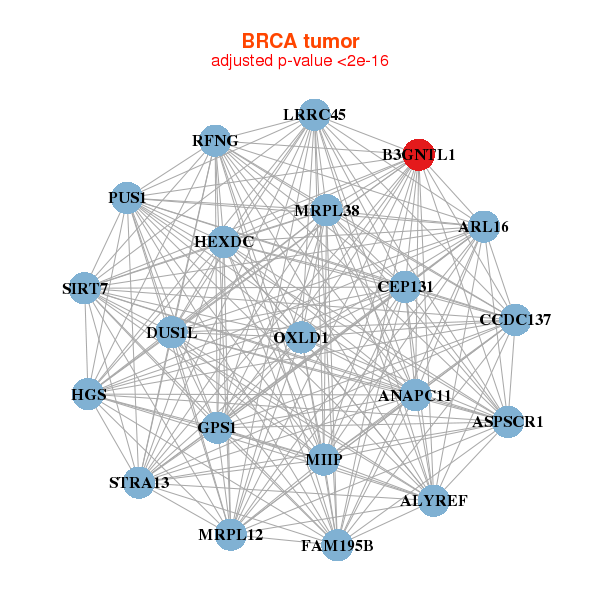
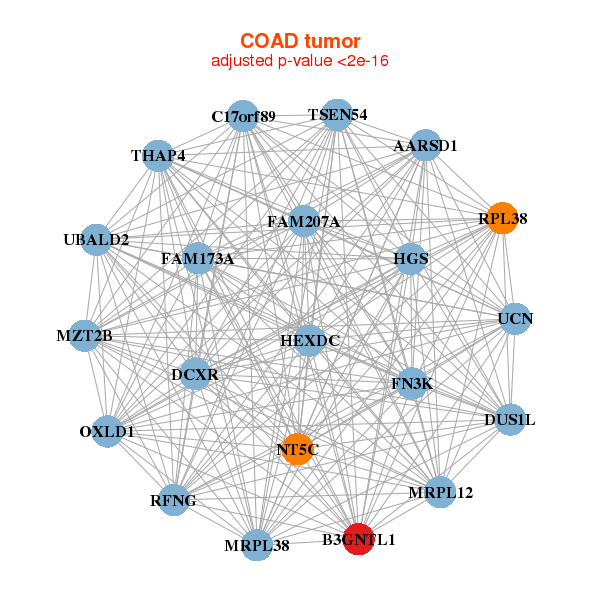
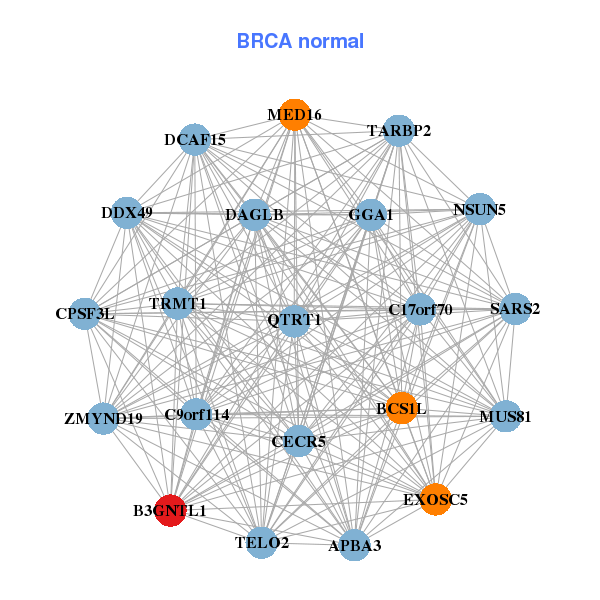
| * Co-Expression network figures were drawn using R package igraph. Only the top 20 genes with the highest correlations were shown. Red circle: input gene, orange circle: cell metabolism gene, sky circle: other gene |
: Open all plots for all cancer types
 |
|
| ANAPC11,ARL16,ASPSCR1,CEP131,B3GNTL1,OXLD1,CCDC137, DUS1L,FAM195B,GPS1,HEXDC,HGS,LRRC45,MIIP, MRPL12,MRPL38,PUS1,RFNG,SIRT7,STRA13,ALYREF | APBA3,B3GNTL1,BCS1L,C17orf70,C9orf114,CECR5,CPSF3L, DAGLB,DCAF15,DDX49,EXOSC5,GGA1,MED16,MUS81, NSUN5,QTRT1,SARS2,TARBP2,TELO2,TRMT1,ZMYND19 |
 |
|
| AARSD1,B3GNTL1,C17orf89,OXLD1,FAM207A,DCXR,DUS1L, UBALD2,MZT2B,FAM173A,FN3K,HEXDC,HGS,MRPL12, MRPL38,NT5C,RFNG,RPL38,THAP4,TSEN54,UCN | ALG1,APRT,B3GNTL1,C19orf48,C9orf142,DDX56,FPGS, KAT2A,MRPL4,NAT9,POLR3D,PPP5C,PRMT5,PYCR1, RUVBL2,SARS2,SLC35B2,SSBP4,TMEM161A,WDR46,ZDHHC16 |
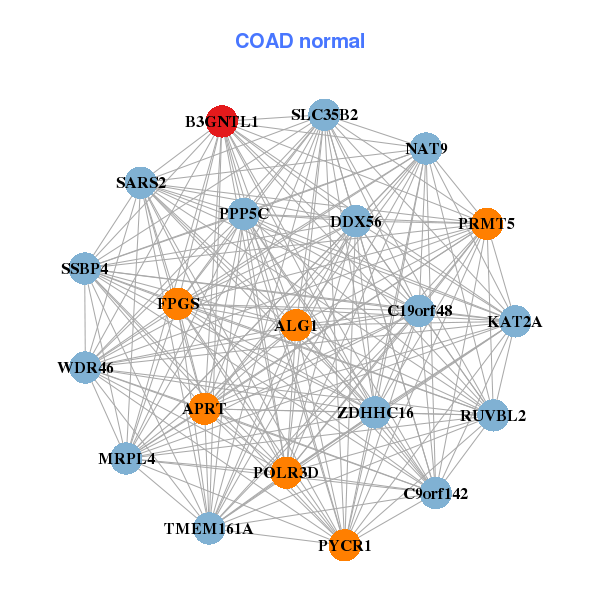
| * Co-Expression network figures were drawn using R package igraph. Only the top 20 genes with the highest correlations were shown. Red circle: input gene, orange circle: cell metabolism gene, sky circle: other gene |
: Open all plots for all cancer types
| Top |
: Open all interacting genes' information including KEGG pathway for all interacting genes from DAVID
| Top |
| Pharmacological Information for B3GNTL1 |
| There's no related Drug. |
| Top |
| Cross referenced IDs for B3GNTL1 |
| * We obtained these cross-references from Uniprot database. It covers 150 different DBs, 18 categories. http://www.uniprot.org/help/cross_references_section |
: Open all cross reference information
|
Copyright © 2016-Present - The Univsersity of Texas Health Science Center at Houston @ |