|
||||||||||||||||||||
| |
| Phenotypic Information (metabolism pathway, cancer, disease, phenome) |
| |
| |
| Gene-Gene Network Information: Co-Expression Network, Interacting Genes & KEGG |
| |
|


| Gene Summary for SLC25A10 |
| Top |
| Phenotypic Information for SLC25A10(metabolism pathway, cancer, disease, phenome) |
| Cancer | CGAP: SLC25A10 |
| Familial Cancer Database: SLC25A10 | |
| * This gene is included in those cancer gene databases. |
|
|
|
|
|
| . | ||||||||||||||
Oncogene 1 | Significant driver gene in | |||||||||||||||||||
| cf) number; DB name 1 Oncogene; http://nar.oxfordjournals.org/content/35/suppl_1/D721.long, 2 Tumor Suppressor gene; https://bioinfo.uth.edu/TSGene/, 3 Cancer Gene Census; http://www.nature.com/nrc/journal/v4/n3/abs/nrc1299.html, 4 CancerGenes; http://nar.oxfordjournals.org/content/35/suppl_1/D721.long, 5 Network of Cancer Gene; http://ncg.kcl.ac.uk/index.php, 1Therapeutic Vulnerabilities in Cancer; http://cbio.mskcc.org/cancergenomics/statius/ |
| REACTOME_SULFUR_AMINO_ACID_METABOLISM REACTOME_METABOLISM_OF_AMINO_ACIDS_AND_DERIVATIVES REACTOME_METABOLISM_OF_CARBOHYDRATES REACTOME_GLUCOSE_METABOLISM | |
| Mutations for SLC25A10 |
| * Under tables are showing count per each tissue to give us broad intuition about tissue specific mutation patterns.You can go to the detailed page for each mutation database's web site. |
| - Statistics for Tissue and Mutation type | Top |
 |
| - For Inter-chromosomal Variations |
| There's no inter-chromosomal structural variation. |
| - For Intra-chromosomal Variations |
| * Intra-chromosomal variantions includes 'intrachromosomal amplicon to amplicon', 'intrachromosomal amplicon to non-amplified dna', 'intrachromosomal deletion', 'intrachromosomal fold-back inversion', 'intrachromosomal inversion', 'intrachromosomal tandem duplication', 'Intrachromosomal unknown type', 'intrachromosomal with inverted orientation', 'intrachromosomal with non-inverted orientation'. |
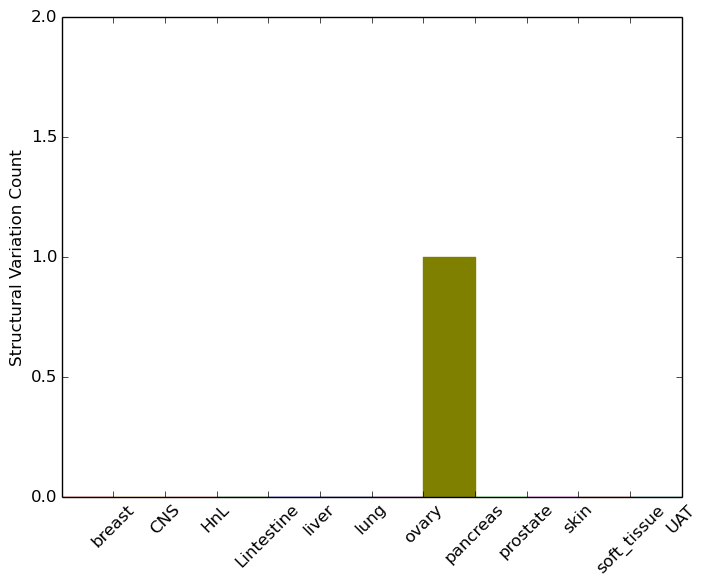 |
| Sample | Symbol_a | Chr_a | Start_a | End_a | Symbol_b | Chr_b | Start_b | End_b |
| pancreas | SLC25A10 | chr17 | 79679636 | 79679656 | SLC25A10 | chr17 | 79679804 | 79679824 |
| cf) Tissue number; Tissue name (1;Breast, 2;Central_nervous_system, 3;Haematopoietic_and_lymphoid_tissue, 4;Large_intestine, 5;Liver, 6;Lung, 7;Ovary, 8;Pancreas, 9;Prostate, 10;Skin, 11;Soft_tissue, 12;Upper_aerodigestive_tract) |
| * From mRNA Sanger sequences, Chitars2.0 arranged chimeric transcripts. This table shows SLC25A10 related fusion information. |
| ID | Head Gene | Tail Gene | Accession | Gene_a | qStart_a | qEnd_a | Chromosome_a | tStart_a | tEnd_a | Gene_a | qStart_a | qEnd_a | Chromosome_a | tStart_a | tEnd_a |
| DA998089 | EEF2 | 1 | 274 | 19 | 3984161 | 3985461 | SLC25A10 | 275 | 557 | 17 | 79679488 | 79682608 | |
| Top |
| There's no copy number variation information in COSMIC data for this gene. |
| Top |
|
 |
| Top |
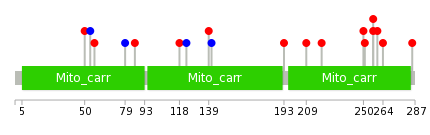
| Stat. for Non-Synonymous SNVs (# total SNVs=11) | (# total SNVs=10) |
 |  |
(# total SNVs=1) | (# total SNVs=0) |
 |
| Top |
| * When you move the cursor on each content, you can see more deailed mutation information on the Tooltip. Those are primary_site,primary_histology,mutation(aa),pubmedID. |
| GRCh37 position | Mutation(aa) | Unique sampleID count |
| chr17:79687107-79687107 | p.*288C | 6 |
| chr17:79682051-79682051 | p.T54T | 4 |
| chr17:79686917-79686917 | p.K254N | 2 |
| chr17:79682558-79682558 | p.R88R | 2 |
| chr17:79682023-79682023 | p.T45R | 2 |
| chr17:79682059-79682059 | p.I57N | 2 |
| chr17:79682089-79682089 | p.S67L | 1 |
| chr17:79683871-79683871 | p.R150H | 1 |
| chr17:79686909-79686909 | p.Y253fs*>35 | 1 |
| chr17:79682531-79682531 | p.F79F | 1 |
| Top |
|
 |
| Point Mutation/ Tissue ID | 1 | 2 | 3 | 4 | 5 | 6 | 7 | 8 | 9 | 10 | 11 | 12 | 13 | 14 | 15 | 16 | 17 | 18 | 19 | 20 |
| # sample | 1 | 1 | 1 | 4 | 3 | 1 | 4 | 4 | ||||||||||||
| # mutation | 1 | 1 | 1 | 4 | 3 | 1 | 4 | 4 | ||||||||||||
| nonsynonymous SNV | 1 | 1 | 4 | 3 | 4 | 2 | ||||||||||||||
| synonymous SNV | 1 | 1 | 2 |
| cf) Tissue ID; Tissue type (1; BLCA[Bladder Urothelial Carcinoma], 2; BRCA[Breast invasive carcinoma], 3; CESC[Cervical squamous cell carcinoma and endocervical adenocarcinoma], 4; COAD[Colon adenocarcinoma], 5; GBM[Glioblastoma multiforme], 6; Glioma Low Grade, 7; HNSC[Head and Neck squamous cell carcinoma], 8; KICH[Kidney Chromophobe], 9; KIRC[Kidney renal clear cell carcinoma], 10; KIRP[Kidney renal papillary cell carcinoma], 11; LAML[Acute Myeloid Leukemia], 12; LUAD[Lung adenocarcinoma], 13; LUSC[Lung squamous cell carcinoma], 14; OV[Ovarian serous cystadenocarcinoma ], 15; PAAD[Pancreatic adenocarcinoma], 16; PRAD[Prostate adenocarcinoma], 17; SKCM[Skin Cutaneous Melanoma], 18:STAD[Stomach adenocarcinoma], 19:THCA[Thyroid carcinoma], 20:UCEC[Uterine Corpus Endometrial Carcinoma]) |
| Top |
| * We represented just top 10 SNVs. When you move the cursor on each content, you can see more deailed mutation information on the Tooltip. Those are primary_site, primary_histology, mutation(aa), pubmedID. |
| Genomic Position | Mutation(aa) | Unique sampleID count |
| chr17:79686897 | p.G257R,SLC25A10 | 2 |
| chr17:79682763 | p.R209C | 1 |
| chr17:79687071 | p.A250S,SLC25A10 | 1 |
| chr17:79683076 | p.V251L,SLC25A10 | 1 |
| chr17:79683845 | p.R220G | 1 |
| chr17:79684472 | p.A260T,SLC25A10 | 1 |
| chr17:79686863 | p.R50W,SLC25A10 | 1 |
| chr17:79682037 | p.G264C,SLC25A10 | 1 |
| chr17:79686876 | p.T54T,SLC25A10 | 1 |
| chr17:79682051 | p.Q285H,SLC25A10 | 1 |
| * Copy number data were extracted from TCGA using R package TCGA-Assembler. The URLs of all public data files on TCGA DCC data server were gathered on Jan-05-2015. Function ProcessCNAData in TCGA-Assembler package was used to obtain gene-level copy number value which is calculated as the average copy number of the genomic region of a gene. |
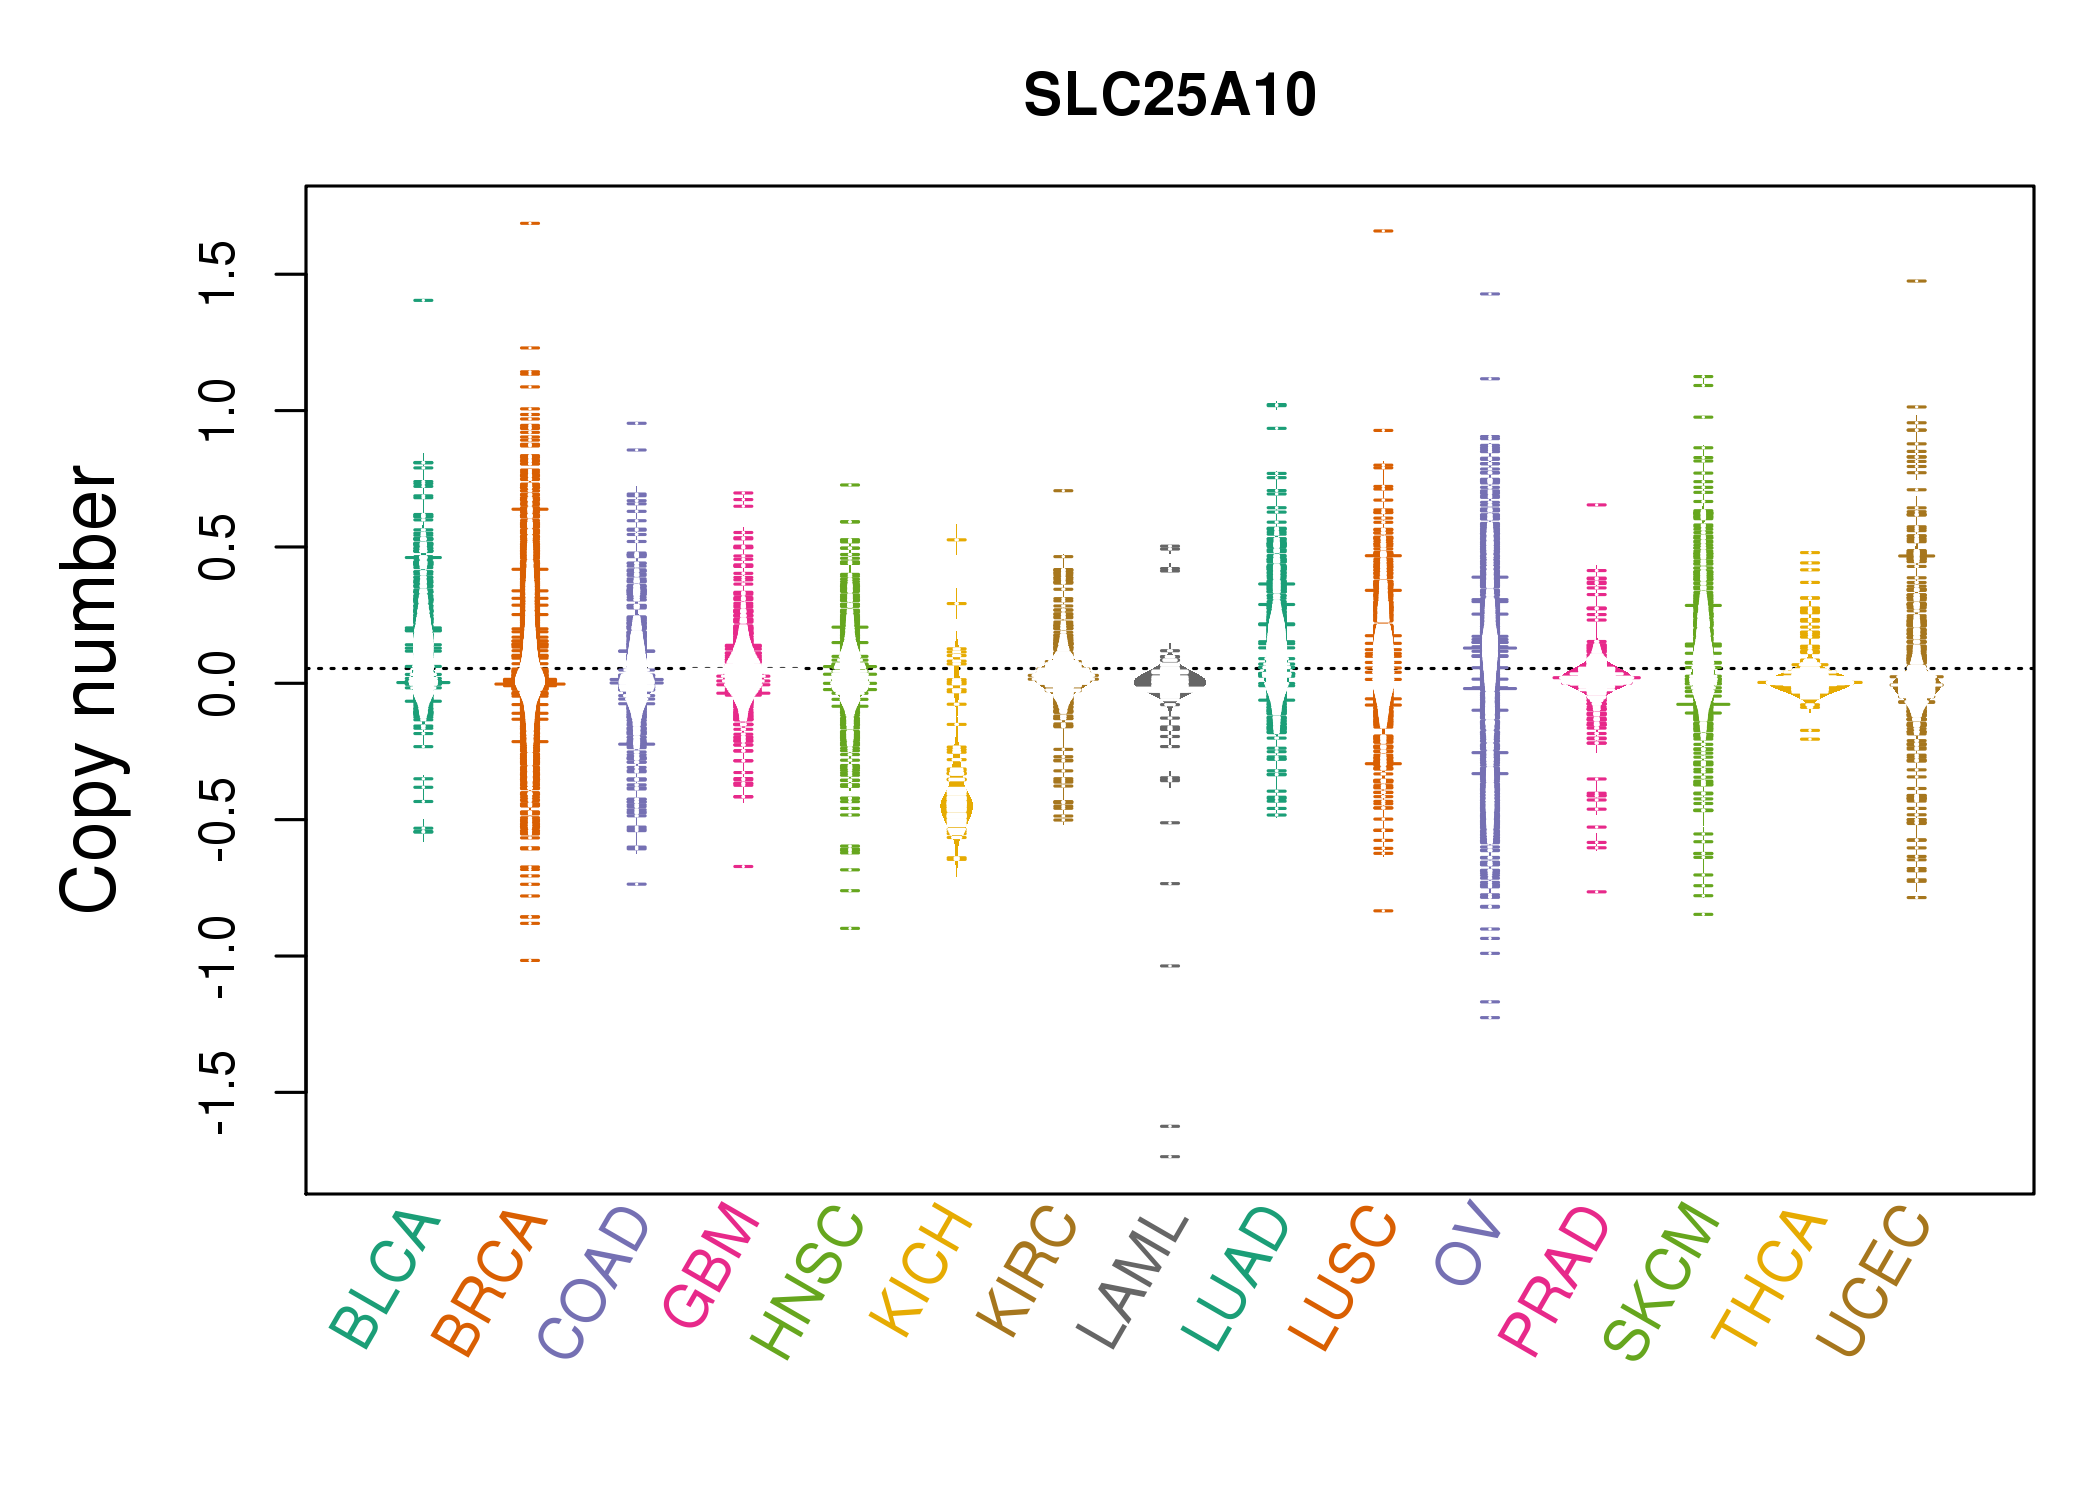 |
| cf) Tissue ID[Tissue type]: BLCA[Bladder Urothelial Carcinoma], BRCA[Breast invasive carcinoma], CESC[Cervical squamous cell carcinoma and endocervical adenocarcinoma], COAD[Colon adenocarcinoma], GBM[Glioblastoma multiforme], Glioma Low Grade, HNSC[Head and Neck squamous cell carcinoma], KICH[Kidney Chromophobe], KIRC[Kidney renal clear cell carcinoma], KIRP[Kidney renal papillary cell carcinoma], LAML[Acute Myeloid Leukemia], LUAD[Lung adenocarcinoma], LUSC[Lung squamous cell carcinoma], OV[Ovarian serous cystadenocarcinoma ], PAAD[Pancreatic adenocarcinoma], PRAD[Prostate adenocarcinoma], SKCM[Skin Cutaneous Melanoma], STAD[Stomach adenocarcinoma], THCA[Thyroid carcinoma], UCEC[Uterine Corpus Endometrial Carcinoma] |
| Top |
| Gene Expression for SLC25A10 |
| * CCLE gene expression data were extracted from CCLE_Expression_Entrez_2012-10-18.res: Gene-centric RMA-normalized mRNA expression data. |
 |
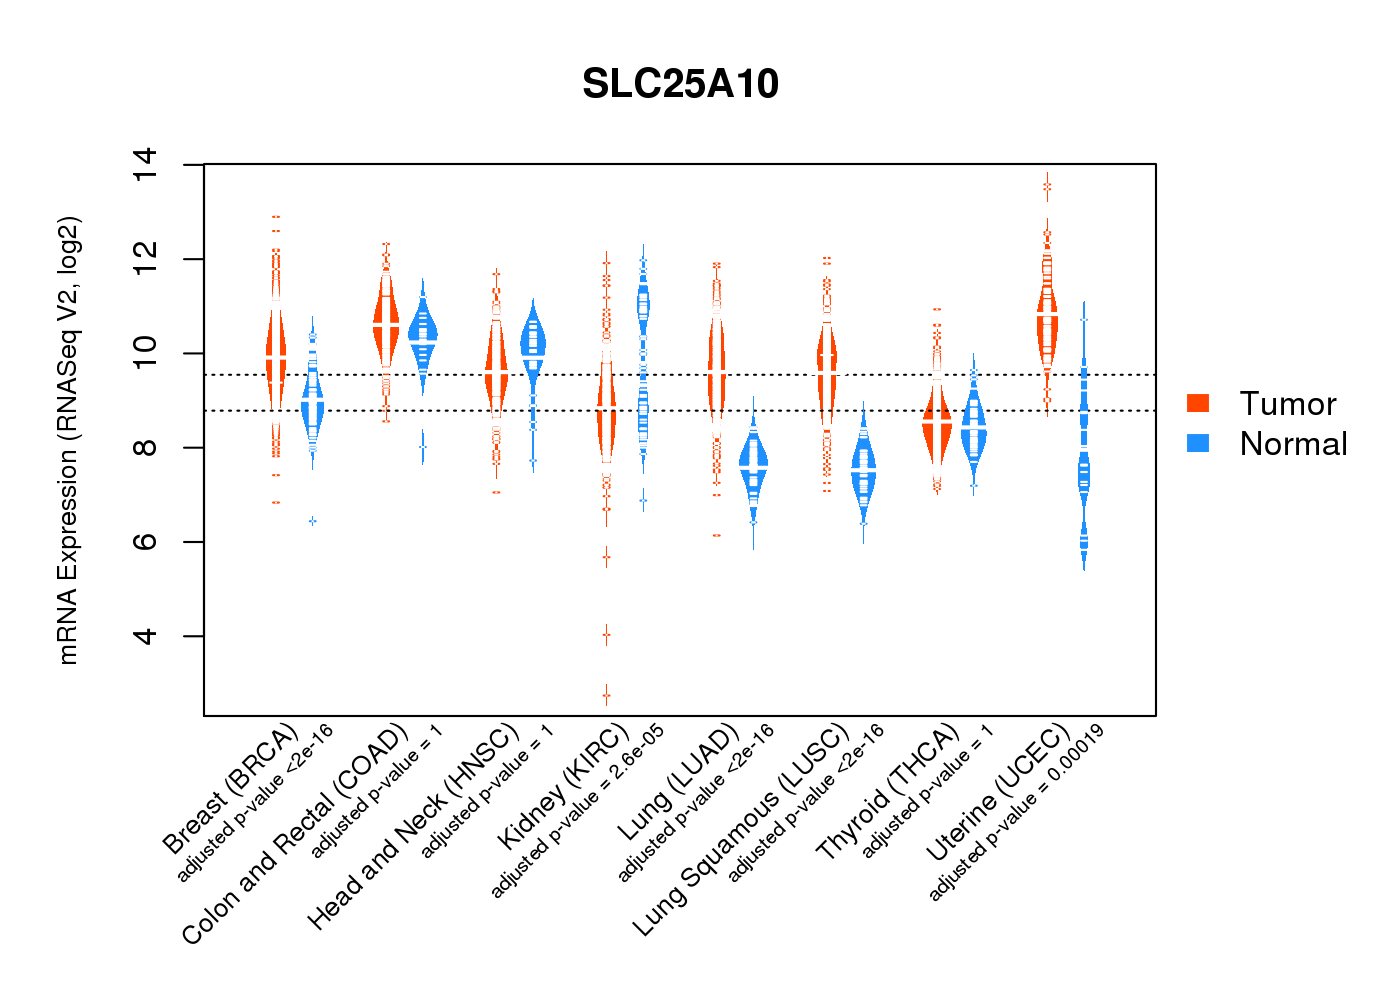
| * Normalized gene expression data of RNASeqV2 was extracted from TCGA using R package TCGA-Assembler. The URLs of all public data files on TCGA DCC data server were gathered at Jan-05-2015. Only eight cancer types have enough normal control samples for differential expression analysis. (t test, adjusted p<0.05 (using Benjamini-Hochberg FDR)) |
 |
| Top |
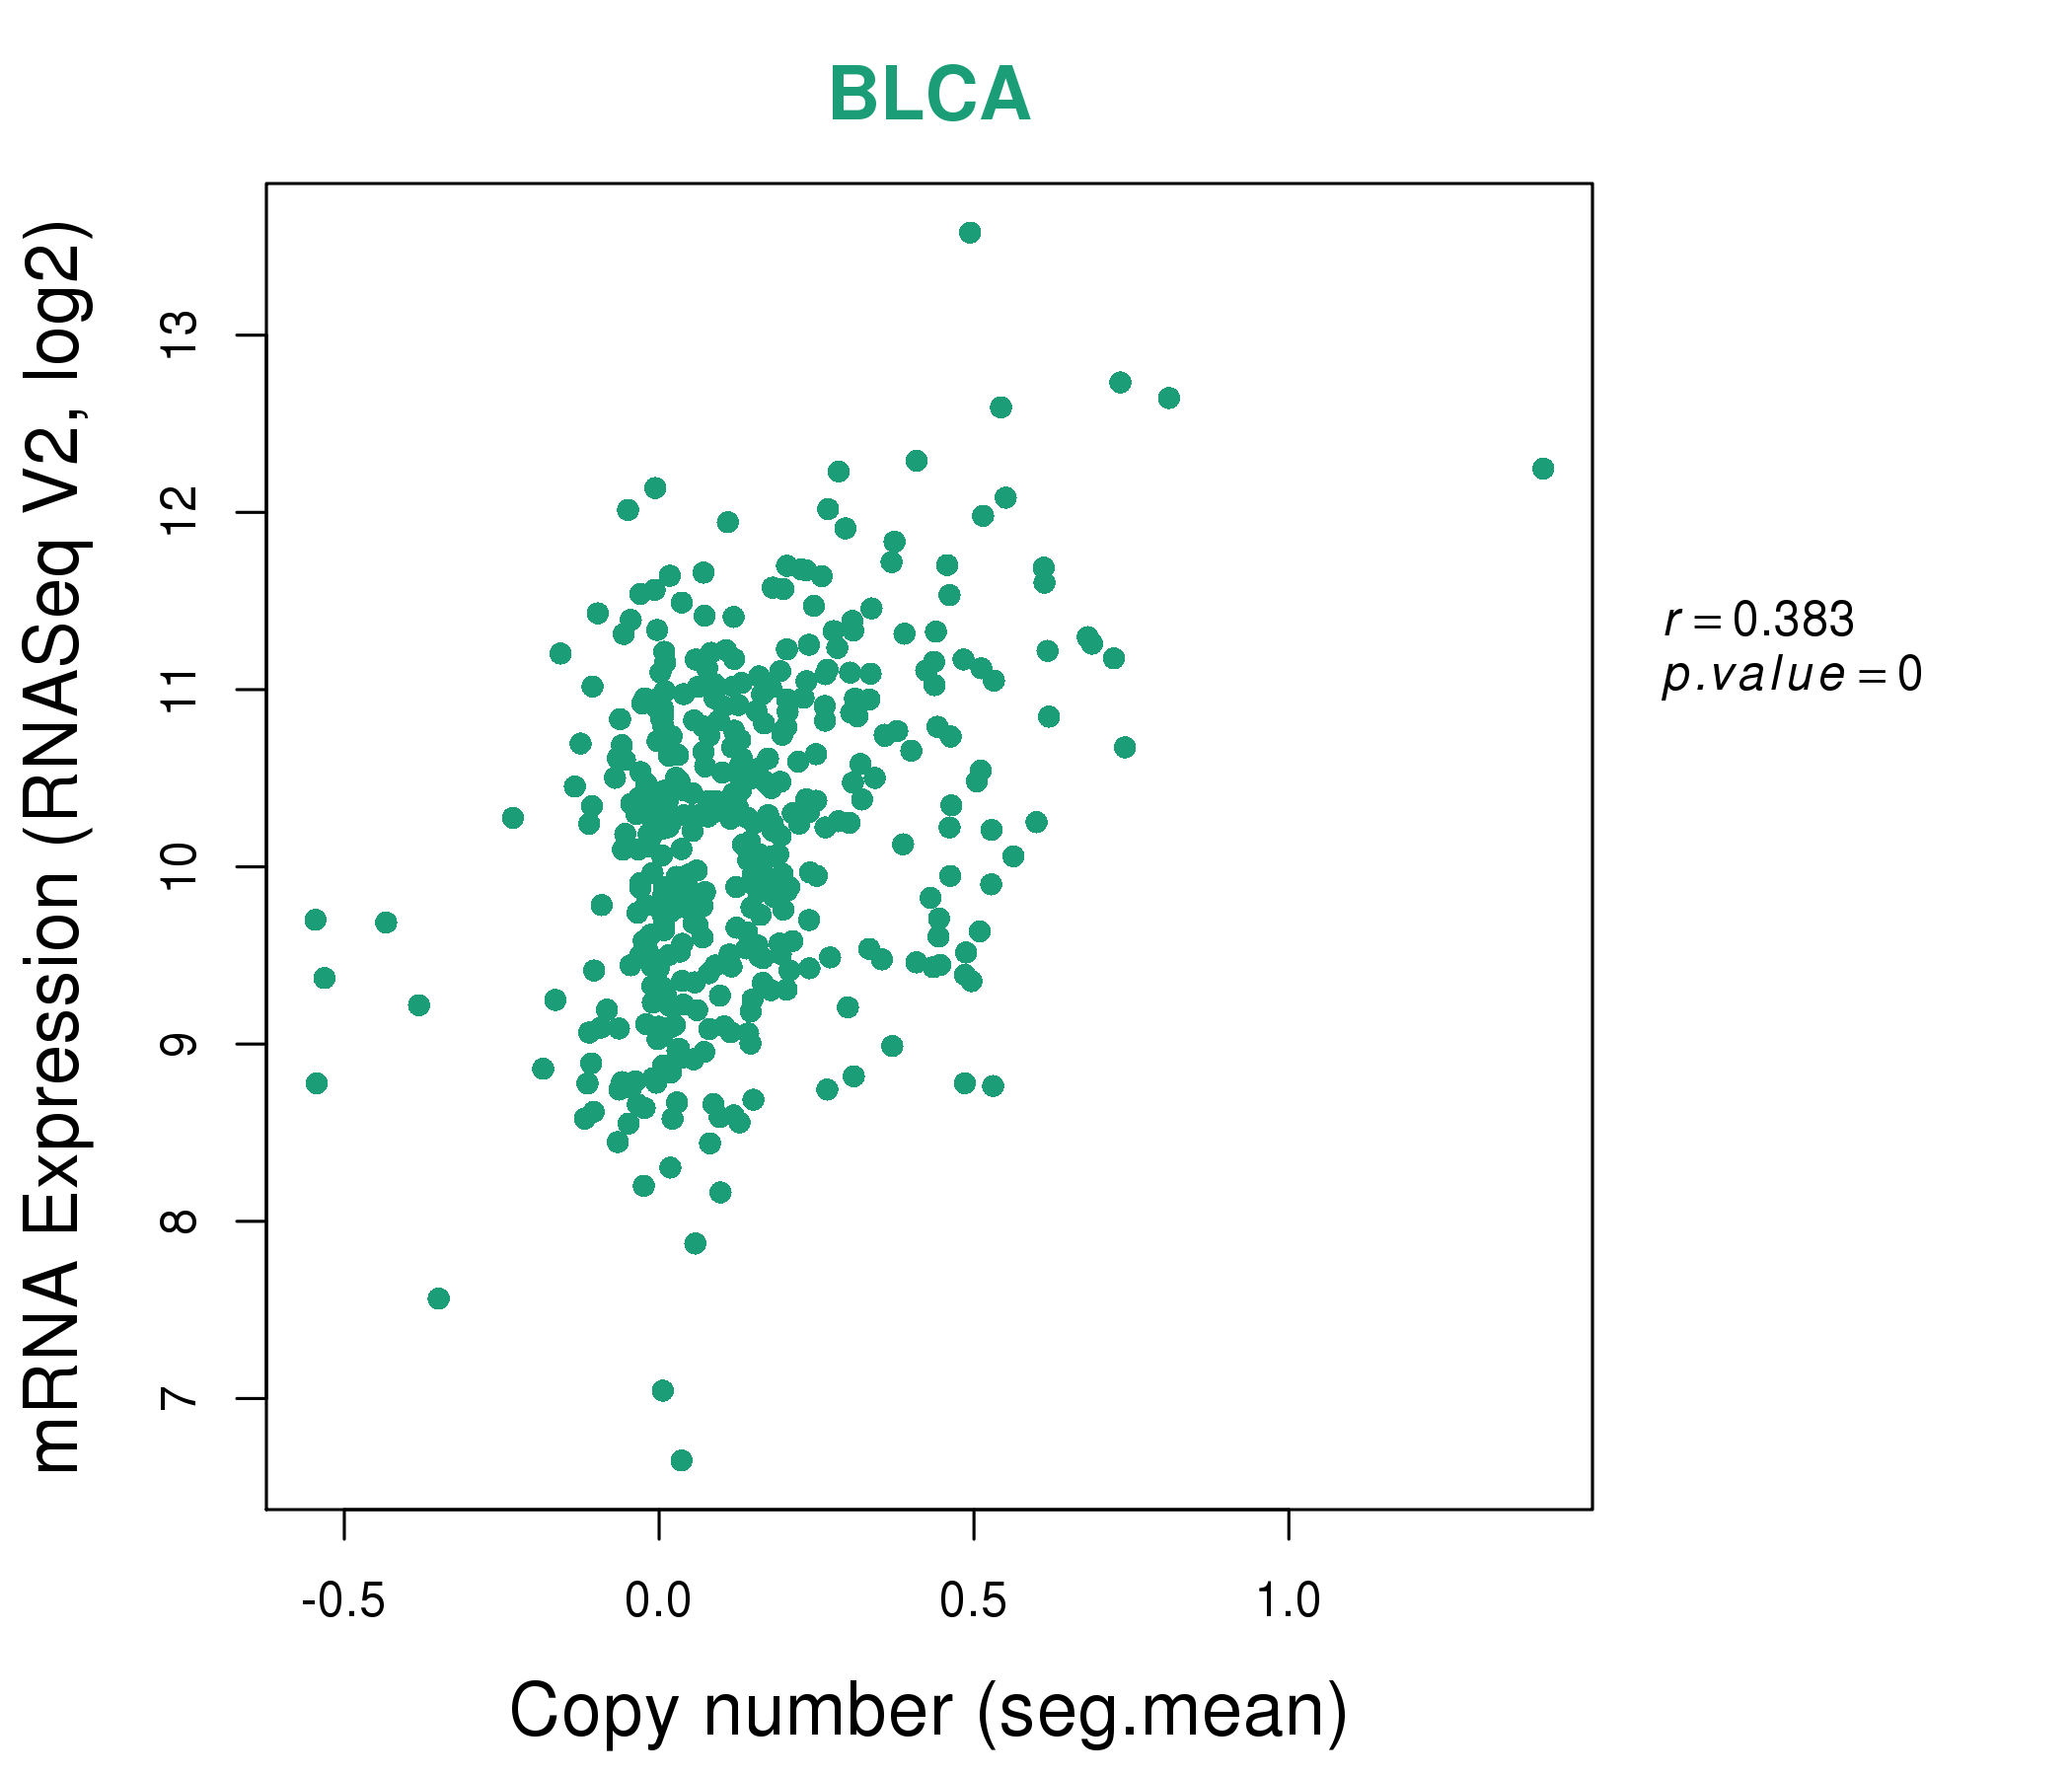
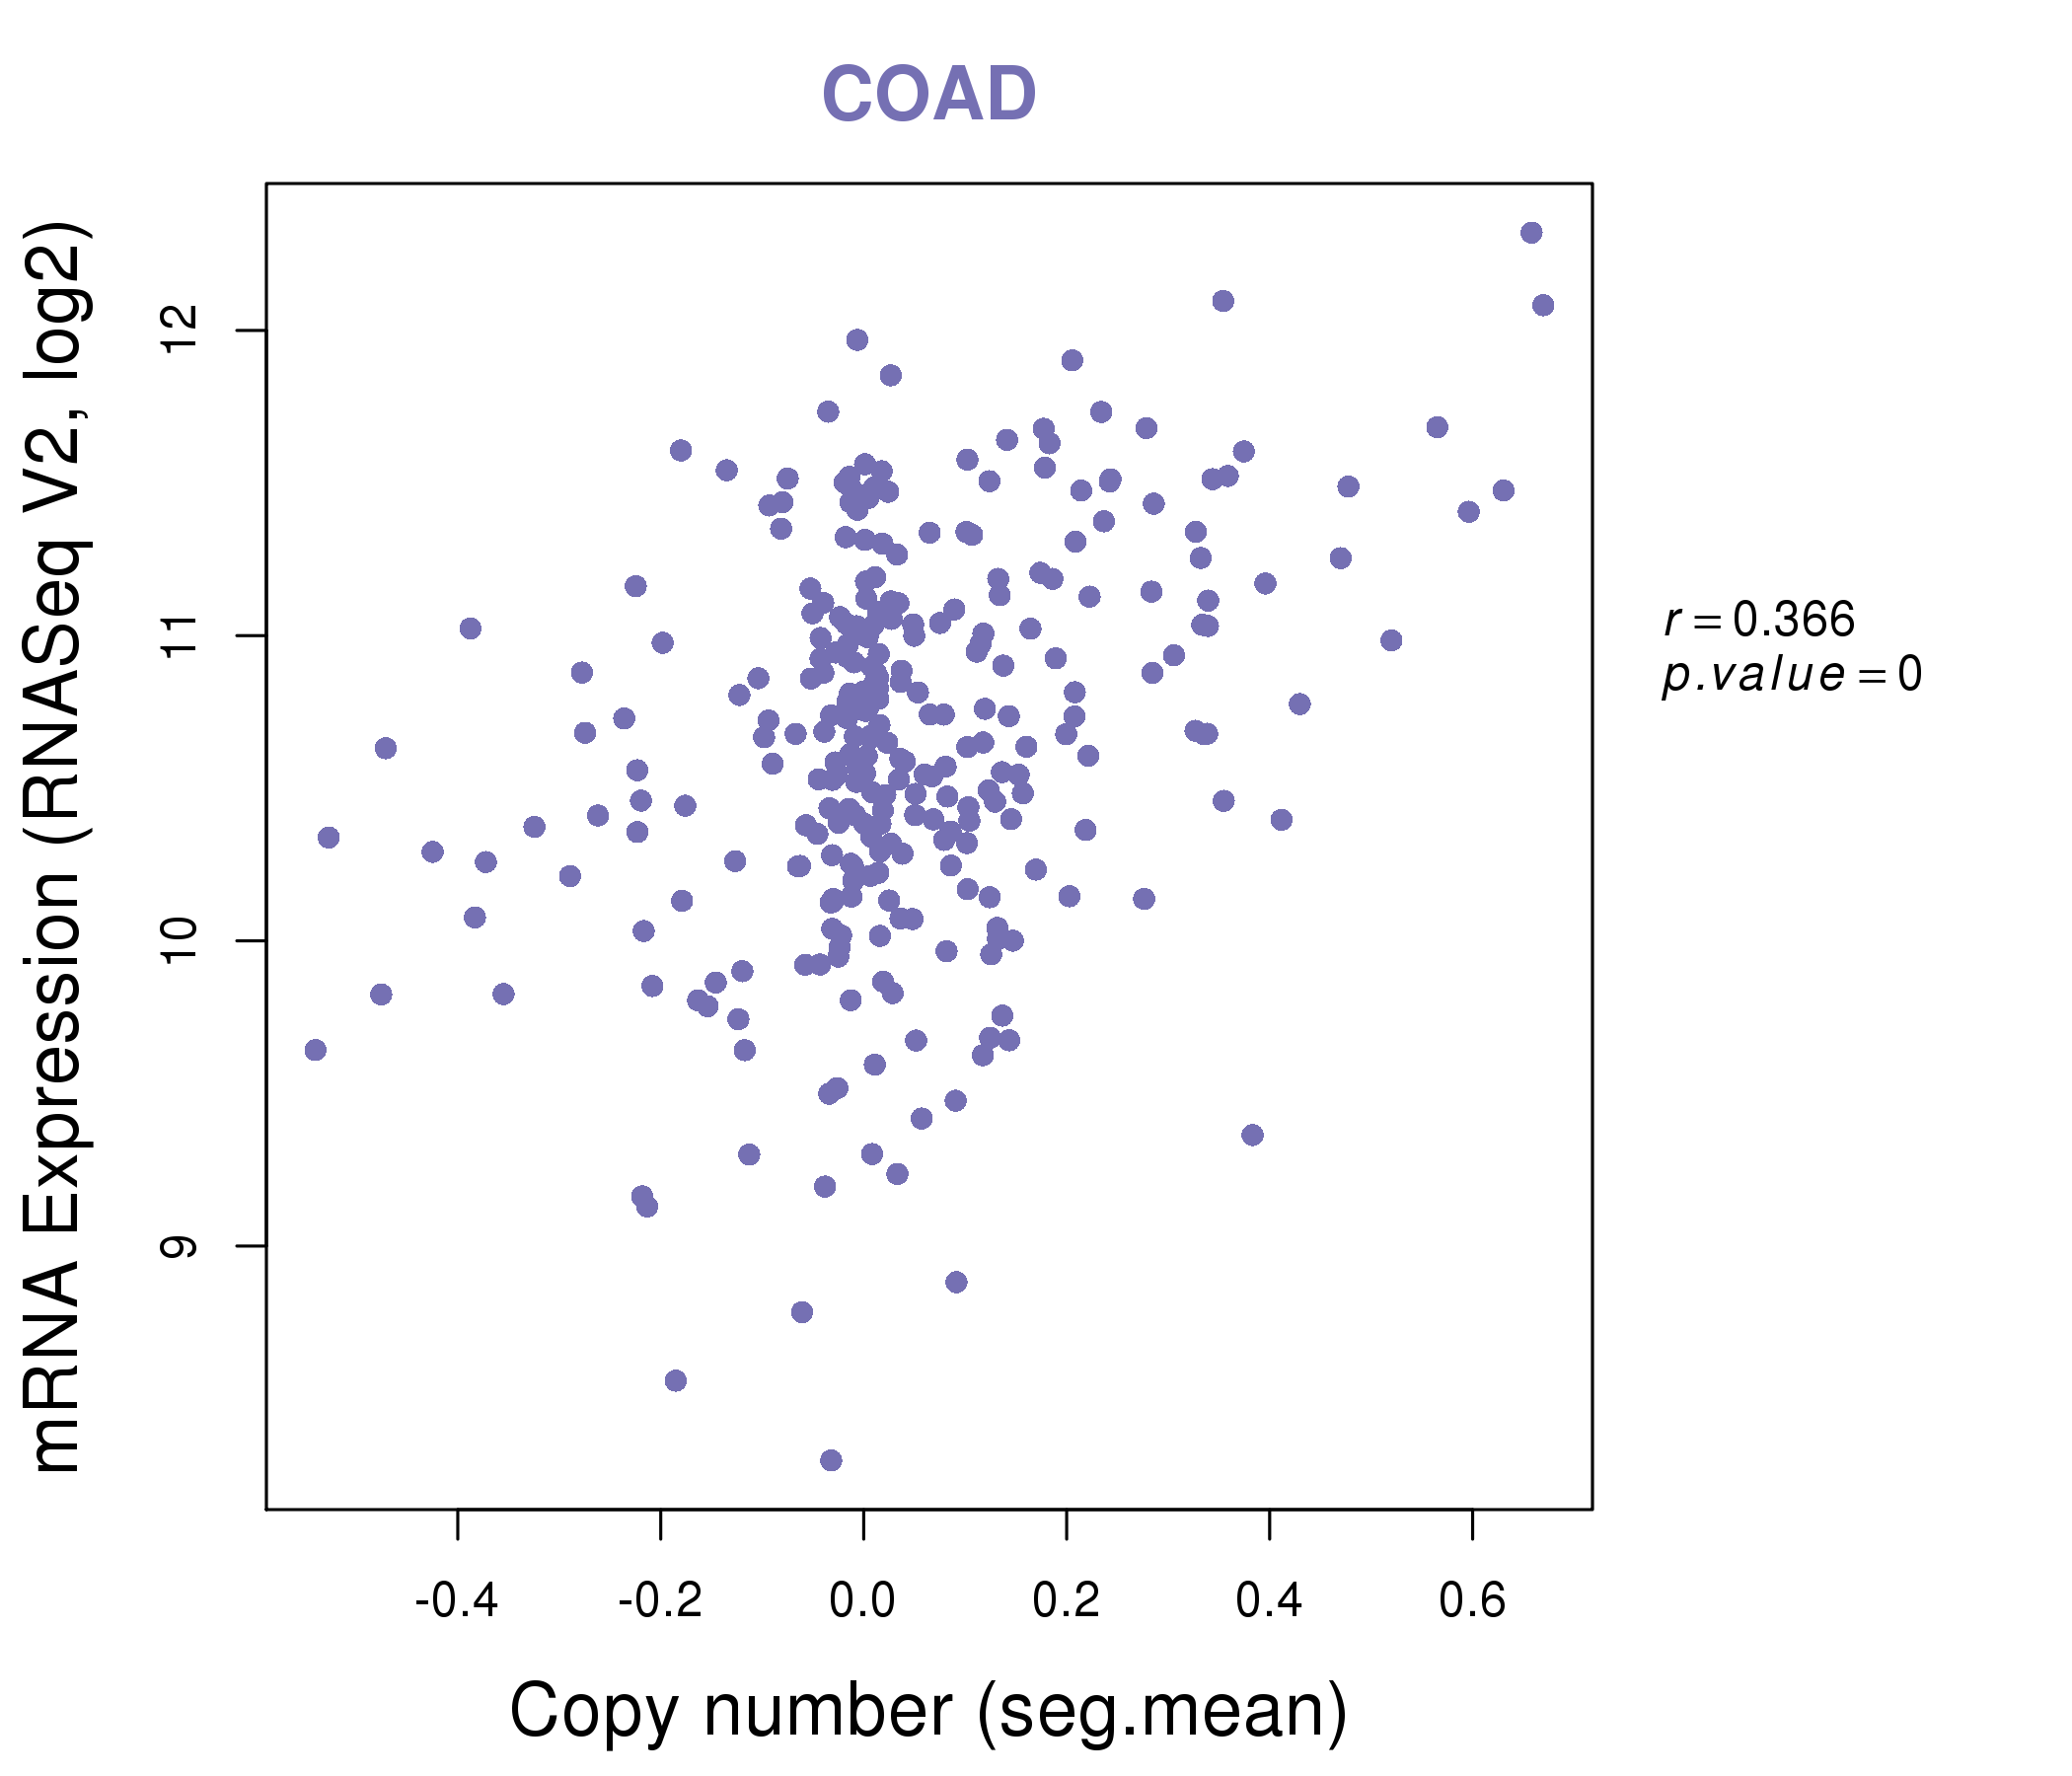
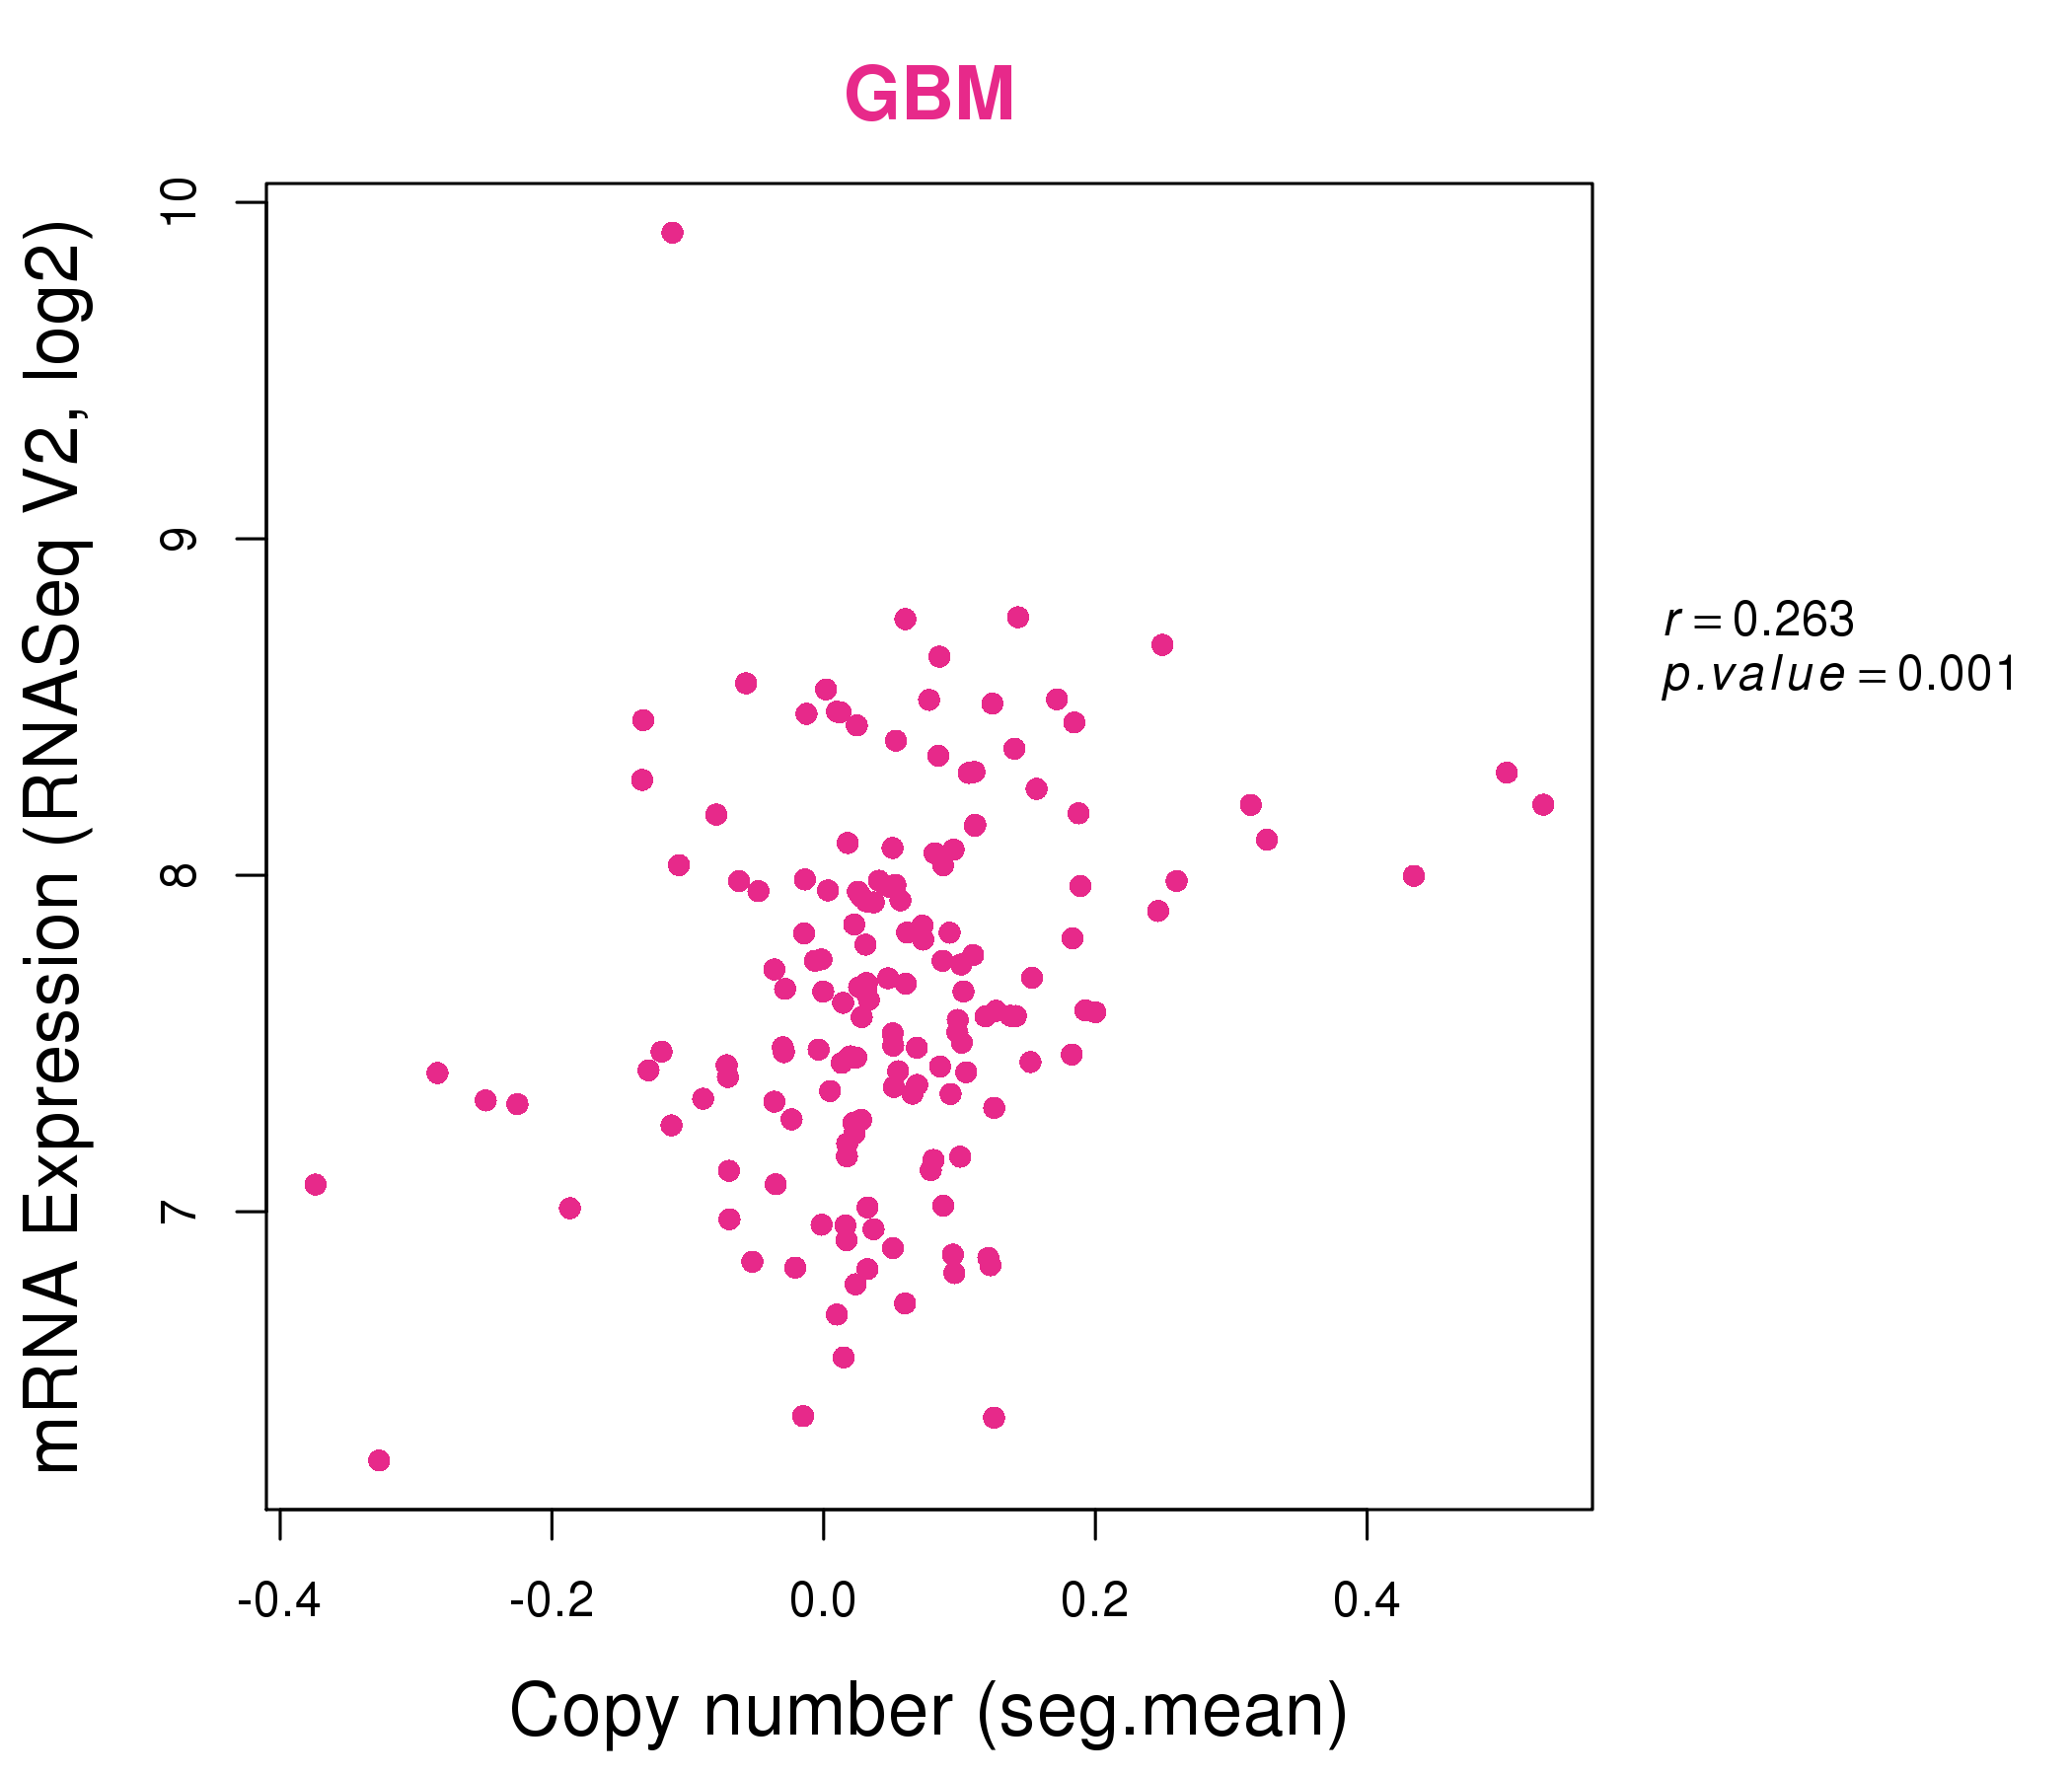
| * This plots show the correlation between CNV and gene expression. |
: Open all plots for all cancer types
 |
|
 |
|

| Top |
| Gene-Gene Network Information |
| * Co-Expression network figures were drawn using R package igraph. Only the top 20 genes with the highest correlations were shown. Red circle: input gene, orange circle: cell metabolism gene, sky circle: other gene |
: Open all plots for all cancer types
 |
| ||||
| ANAPC11,ARHGDIA,ARL16,ASPSCR1,C17orf89,OXLD1,CCDC137, CHMP6,DUS1L,GPS1,HGS,LRRC45,MRPL12,MRPL38, PCYT2,PYCR1,RFNG,SIRT7,SLC25A10,STRA13,ALYREF | ACY1,BSG,C20orf27,CKB,DDT,FPGS,GCDH, MESP1,MPST,PC,PCYT2,POLR2E,SCRN2,SHMT1, SLC25A10,SLC25A1,SLC2A4RG,STAT5A,TALDO1,TMEM120A,TST | ||||
 |
| ||||
| ATP5G1,BOLA3,UQCC3,C17orf89,CCDC137,DUS1L,GPS1, HMBS,LRRC45,MRPL12,MRPL38,PHB,PTGES2,PYCR1, SAC3D1,SLC25A10,SLC25A19,SLC25A39,THAP4,ALYREF,TOMM40 | ABHD11,AGMAT,APEH,CCNI2,DCXR,DHRS13,DUS1L, FGFR4,GOT1,GSS,MRPL12,MTFP1,PDSS1,SLC25A10, SLC25A39,SLC35A4,TBRG4,TIMM13,TTLL12,TUFM,UQCRC1 |


| * Co-Expression network figures were drawn using R package igraph. Only the top 20 genes with the highest correlations were shown. Red circle: input gene, orange circle: cell metabolism gene, sky circle: other gene |
: Open all plots for all cancer types
| Top |
: Open all interacting genes' information including KEGG pathway for all interacting genes from DAVID
| Top |
| Pharmacological Information for SLC25A10 |
| DB Category | DB Name | DB's ID and Url link |
| * Gene Centered Interaction Network. |
 |
| * Drug Centered Interaction Network. |
| DrugBank ID | Target Name | Drug Groups | Generic Name | Drug Centered Network | Drug Structure |
| DB00139 | solute carrier family 25 (mitochondrial carrier; dicarboxylate transporter), member 10 | approved; nutraceutical | Succinic acid | 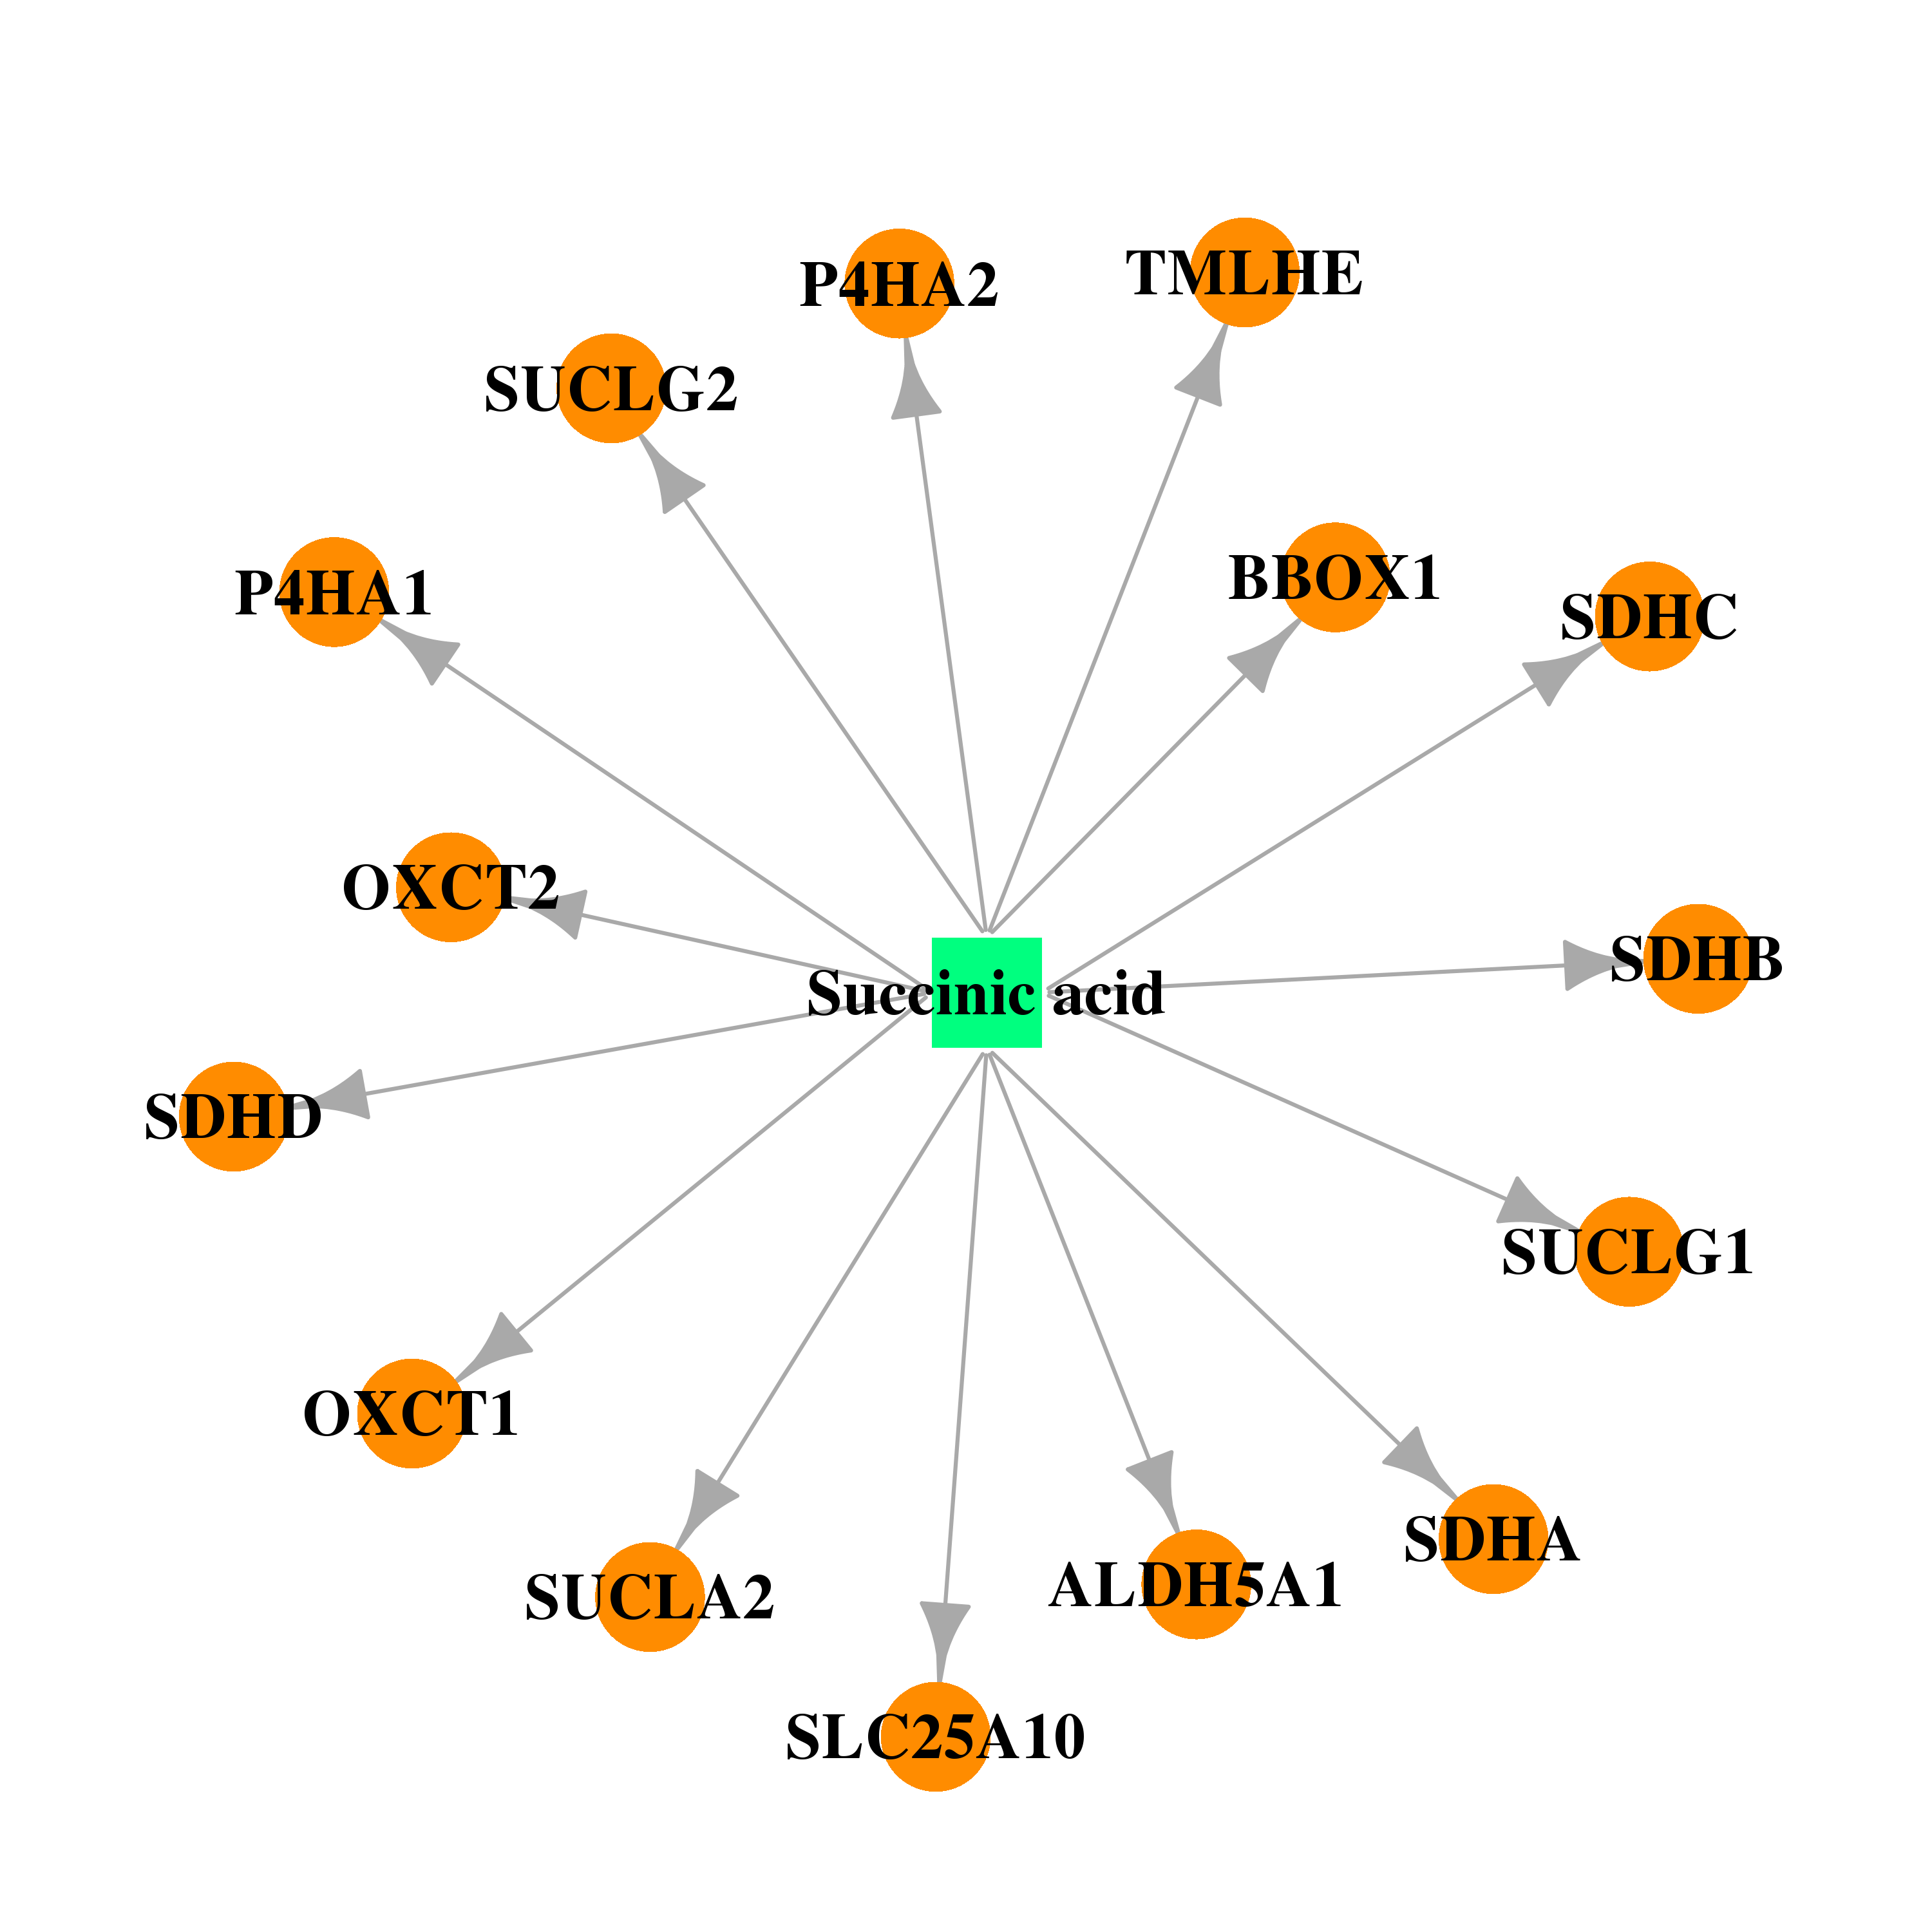 | 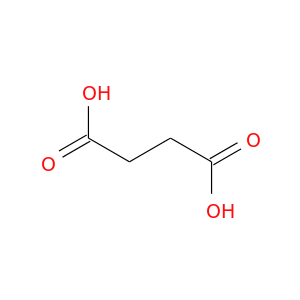 |
| DB00121 | solute carrier family 25 (mitochondrial carrier; dicarboxylate transporter), member 10 | approved; nutraceutical | Biotin | 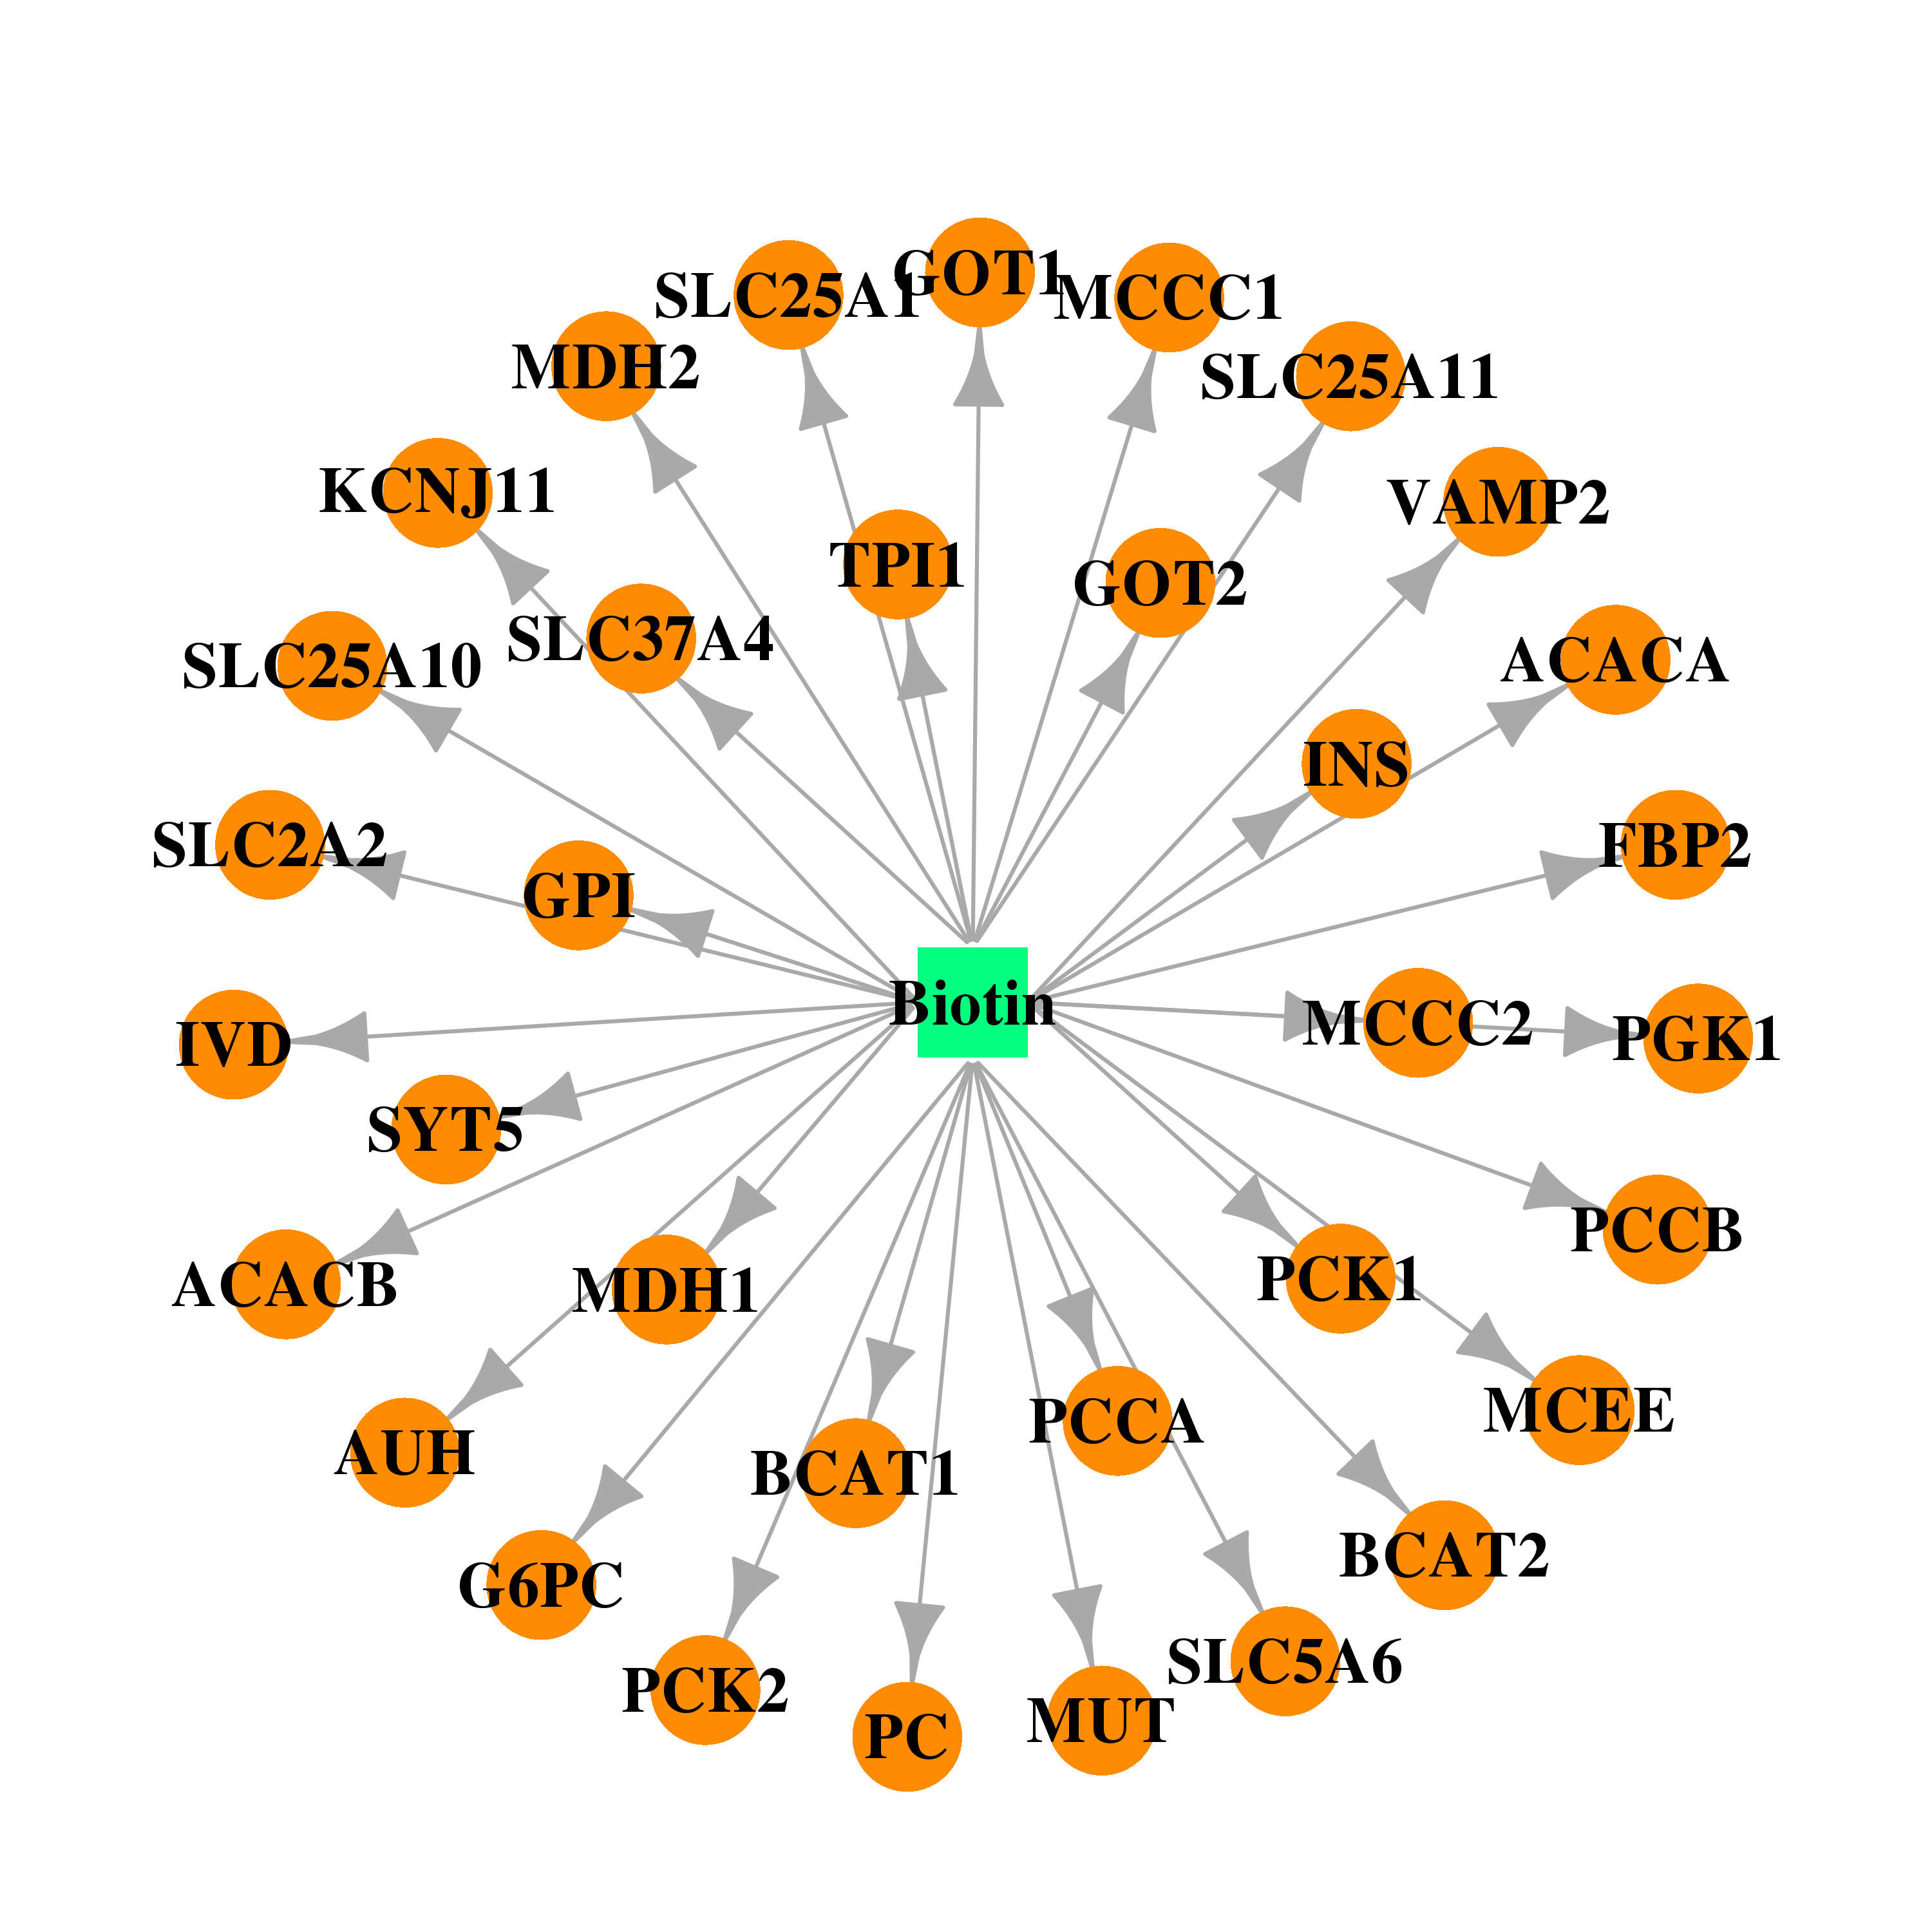 | 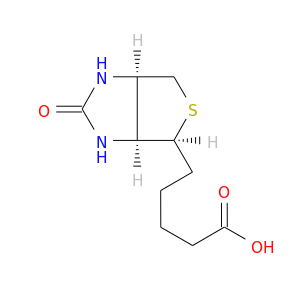 |
| Top |
| Cross referenced IDs for SLC25A10 |
| * We obtained these cross-references from Uniprot database. It covers 150 different DBs, 18 categories. http://www.uniprot.org/help/cross_references_section |
: Open all cross reference information
|
Copyright © 2016-Present - The Univsersity of Texas Health Science Center at Houston @ |