|
||||||||||||||||||||
| |
| Phenotypic Information (metabolism pathway, cancer, disease, phenome) |
| |
| |
| Gene-Gene Network Information: Co-Expression Network, Interacting Genes & KEGG |
| |
|


| Gene Summary for CTGF |
| Basic gene info. | Gene symbol | CTGF |
| Gene name | connective tissue growth factor | |
| Synonyms | CCN2|HCS24|IGFBP8|NOV2 | |
| Cytomap | UCSC genome browser: 6q23.1 | |
| Genomic location | chr6 :132269316-132272518 | |
| Type of gene | protein-coding | |
| RefGenes | NM_001901.2, | |
| Ensembl id | ENSG00000118523 | |
| Description | CCN family member 2IBP-8IGF-binding protein 8IGFBP-8hypertrophic chondrocyte-specific protein 24insulin-like growth factor-binding protein 8 | |
| Modification date | 20141207 | |
| dbXrefs | MIM : 121009 | |
| HGNC : HGNC | ||
| Ensembl : ENSG00000118523 | ||
| HPRD : 00412 | ||
| Vega : OTTHUMG00000015573 | ||
| Protein | UniProt: P29279 go to UniProt's Cross Reference DB Table | |
| Expression | CleanEX: HS_CTGF | |
| BioGPS: 1490 | ||
| Gene Expression Atlas: ENSG00000118523 | ||
| The Human Protein Atlas: ENSG00000118523 | ||
| Pathway | NCI Pathway Interaction Database: CTGF | |
| KEGG: CTGF | ||
| REACTOME: CTGF | ||
| ConsensusPathDB | ||
| Pathway Commons: CTGF | ||
| Metabolism | MetaCyc: CTGF | |
| HUMANCyc: CTGF | ||
| Regulation | Ensembl's Regulation: ENSG00000118523 | |
| miRBase: chr6 :132,269,316-132,272,518 | ||
| TargetScan: NM_001901 | ||
| cisRED: ENSG00000118523 | ||
| Context | iHOP: CTGF | |
| cancer metabolism search in PubMed: CTGF | ||
| UCL Cancer Institute: CTGF | ||
| Assigned class in ccmGDB | A - This gene has a literature evidence and it belongs to cancer gene. | |
| References showing role of CTGF in cancer cell metabolism | 1. Lu H, Kojima K, Battula VL, Korchin B, Shi Y, et al. (2014) Targeting connective tissue growth factor (CTGF) in acute lymphoblastic leukemia preclinical models: anti-CTGF monoclonal antibody attenuates leukemia growth. Ann Hematol 93: 485-492. doi: 10.1007/s00277-013-1939-2. pmid: 3948212. go to article 2. Gao YB, Xiang ZL, Zhou LY, Wu ZF, Fan J, et al. (2013) Enhanced production of CTGF and IL-11 from highly metastatic hepatoma cells under hypoxic conditions: an implication of hepatocellular carcinoma metastasis to bone. J Cancer Res Clin Oncol 139: 669-679. doi: 10.1007/s00432-012-1370-4. go to article 3. Uriarte I, Latasa MU, Carotti S, Fernandez-Barrena MG, Garcia-Irigoyen O, et al. (2015) Ileal FGF15 contributes to fibrosis-associated hepatocellular carcinoma development. Int J Cancer 136: 2469-2475. doi: 10.1002/ijc.29287. go to article | |
| Top |
| Phenotypic Information for CTGF(metabolism pathway, cancer, disease, phenome) |
| Cancer | CGAP: CTGF |
| Familial Cancer Database: CTGF | |
| * This gene is included in those cancer gene databases. |
|
|
|
|
|
| . | ||||||||||||||
Oncogene 1 | Significant driver gene in | |||||||||||||||||||
| cf) number; DB name 1 Oncogene; http://nar.oxfordjournals.org/content/35/suppl_1/D721.long, 2 Tumor Suppressor gene; https://bioinfo.uth.edu/TSGene/, 3 Cancer Gene Census; http://www.nature.com/nrc/journal/v4/n3/abs/nrc1299.html, 4 CancerGenes; http://nar.oxfordjournals.org/content/35/suppl_1/D721.long, 5 Network of Cancer Gene; http://ncg.kcl.ac.uk/index.php, 1Therapeutic Vulnerabilities in Cancer; http://cbio.mskcc.org/cancergenomics/statius/ |
| REACTOME_METABOLISM_OF_LIPIDS_AND_LIPOPROTEINS | |
| OMIM | 121009; gene. |
| Orphanet | 220393; Diffuse cutaneous systemic sclerosis. 220402; Limited cutaneous systemic sclerosis. |
| Disease | KEGG Disease: CTGF |
| MedGen: CTGF (Human Medical Genetics with Condition) | |
| ClinVar: CTGF | |
| Phenotype | MGI: CTGF (International Mouse Phenotyping Consortium) |
| PhenomicDB: CTGF | |
| Mutations for CTGF |
| * Under tables are showing count per each tissue to give us broad intuition about tissue specific mutation patterns.You can go to the detailed page for each mutation database's web site. |
| There's no structural variation information in COSMIC data for this gene. |
| * From mRNA Sanger sequences, Chitars2.0 arranged chimeric transcripts. This table shows CTGF related fusion information. |
| ID | Head Gene | Tail Gene | Accession | Gene_a | qStart_a | qEnd_a | Chromosome_a | tStart_a | tEnd_a | Gene_a | qStart_a | qEnd_a | Chromosome_a | tStart_a | tEnd_a |
| CV329033 | GPX7 | 1 | 289 | 1 | 53072428 | 53074032 | CTGF | 281 | 376 | 6 | 132270038 | 132270134 | |
| CN482962 | KLHDC4 | 1 | 255 | 16 | 87760459 | 87782368 | CTGF | 249 | 612 | 6 | 132271589 | 132272292 | |
| CV329008 | GPX7 | 1 | 289 | 1 | 53072428 | 53074032 | CTGF | 281 | 376 | 6 | 132270038 | 132270134 | |
| Top |
| There's no copy number variation information in COSMIC data for this gene. |
| Top |
|
 |
| Top |
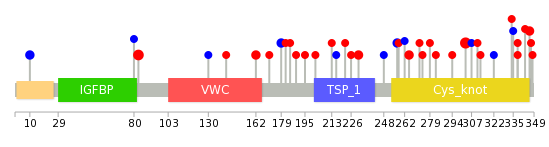
| Stat. for Non-Synonymous SNVs (# total SNVs=33) | (# total SNVs=9) |
 |  |
(# total SNVs=0) | (# total SNVs=0) |
| Top |
| * When you move the cursor on each content, you can see more deailed mutation information on the Tooltip. Those are primary_site,primary_histology,mutation(aa),pubmedID. |
| GRCh37 position | Mutation(aa) | Unique sampleID count |
| chr6:132270547-132270547 | p.V303L | 5 |
| chr6:132271952-132271952 | p.H83D | 4 |
| chr6:132271151-132271151 | p.E231Q | 3 |
| chr6:132270683-132270683 | p.I257I | 2 |
| chr6:132271436-132271436 | p.L179L | 2 |
| chr6:132270418-132270418 | p.G346R | 2 |
| chr6:132271489-132271489 | p.E162K | 2 |
| chr6:132270660-132270660 | p.P265L | 2 |
| chr6:132272283-132272283 | p.R10R | 2 |
| chr6:132270681-132270681 | p.R258H | 1 |
| Top |
|
 |
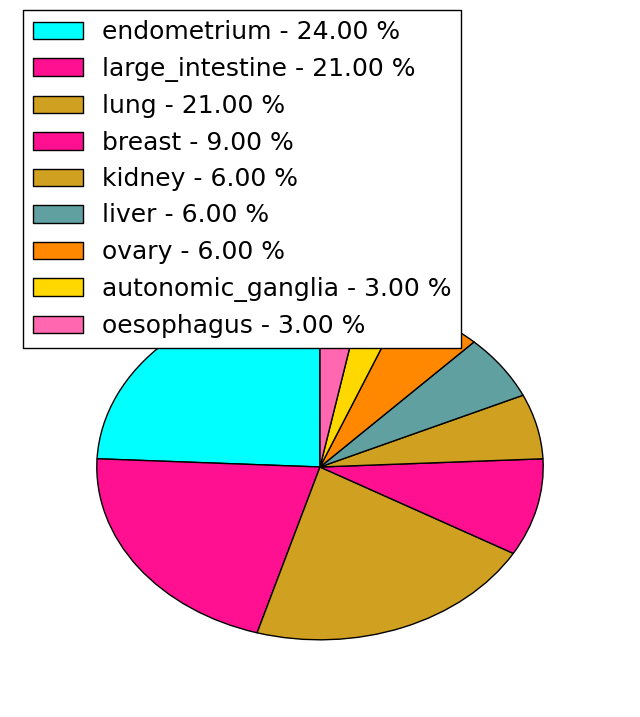
| Point Mutation/ Tissue ID | 1 | 2 | 3 | 4 | 5 | 6 | 7 | 8 | 9 | 10 | 11 | 12 | 13 | 14 | 15 | 16 | 17 | 18 | 19 | 20 |
| # sample | 3 | 2 | 5 | 2 | 1 | 1 | 2 | 1 | 1 | 1 | 1 | 8 | ||||||||
| # mutation | 3 | 2 | 5 | 2 | 1 | 1 | 3 | 1 | 1 | 1 | 1 | 8 | ||||||||
| nonsynonymous SNV | 3 | 2 | 4 | 1 | 1 | 3 | 1 | 1 | 1 | 1 | 5 | |||||||||
| synonymous SNV | 1 | 2 | 3 |
| cf) Tissue ID; Tissue type (1; BLCA[Bladder Urothelial Carcinoma], 2; BRCA[Breast invasive carcinoma], 3; CESC[Cervical squamous cell carcinoma and endocervical adenocarcinoma], 4; COAD[Colon adenocarcinoma], 5; GBM[Glioblastoma multiforme], 6; Glioma Low Grade, 7; HNSC[Head and Neck squamous cell carcinoma], 8; KICH[Kidney Chromophobe], 9; KIRC[Kidney renal clear cell carcinoma], 10; KIRP[Kidney renal papillary cell carcinoma], 11; LAML[Acute Myeloid Leukemia], 12; LUAD[Lung adenocarcinoma], 13; LUSC[Lung squamous cell carcinoma], 14; OV[Ovarian serous cystadenocarcinoma ], 15; PAAD[Pancreatic adenocarcinoma], 16; PRAD[Prostate adenocarcinoma], 17; SKCM[Skin Cutaneous Melanoma], 18:STAD[Stomach adenocarcinoma], 19:THCA[Thyroid carcinoma], 20:UCEC[Uterine Corpus Endometrial Carcinoma]) |
| Top |
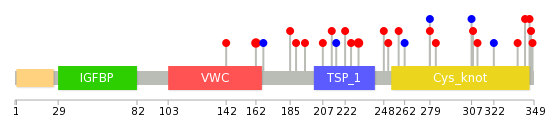
| * We represented just top 10 SNVs. When you move the cursor on each content, you can see more deailed mutation information on the Tooltip. Those are primary_site, primary_histology, mutation(aa), pubmedID. |
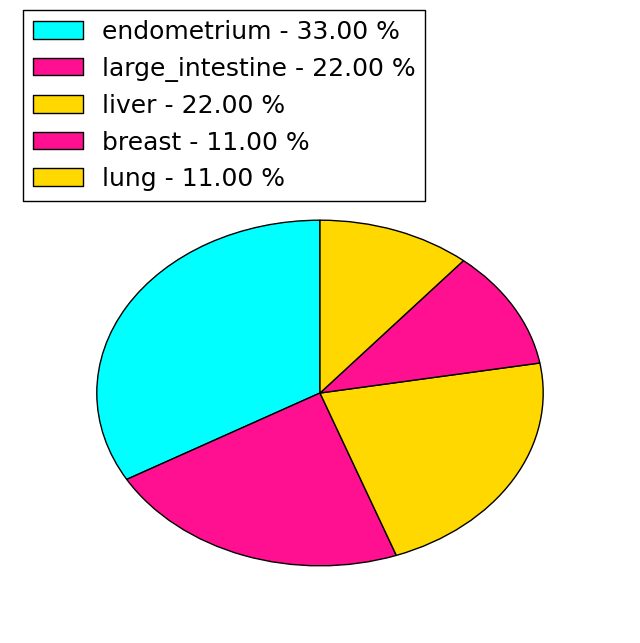
| Genomic Position | Mutation(aa) | Unique sampleID count |
| chr6:132271489 | p.E162K | 2 |
| chr6:132271151 | p.E231Q | 2 |
| chr6:132270442 | p.T322T | 1 |
| chr6:132271100 | p.S207I | 1 |
| chr6:132270488 | p.E311K | 1 |
| chr6:132271549 | p.I195V | 1 |
| chr6:132270523 | p.P308H | 1 |
| chr6:132271165 | p.G189D | 1 |
| chr6:132270531 | p.C307C | 1 |
| chr6:132271177 | p.E185Q | 1 |
| * Copy number data were extracted from TCGA using R package TCGA-Assembler. The URLs of all public data files on TCGA DCC data server were gathered on Jan-05-2015. Function ProcessCNAData in TCGA-Assembler package was used to obtain gene-level copy number value which is calculated as the average copy number of the genomic region of a gene. |
 |
| cf) Tissue ID[Tissue type]: BLCA[Bladder Urothelial Carcinoma], BRCA[Breast invasive carcinoma], CESC[Cervical squamous cell carcinoma and endocervical adenocarcinoma], COAD[Colon adenocarcinoma], GBM[Glioblastoma multiforme], Glioma Low Grade, HNSC[Head and Neck squamous cell carcinoma], KICH[Kidney Chromophobe], KIRC[Kidney renal clear cell carcinoma], KIRP[Kidney renal papillary cell carcinoma], LAML[Acute Myeloid Leukemia], LUAD[Lung adenocarcinoma], LUSC[Lung squamous cell carcinoma], OV[Ovarian serous cystadenocarcinoma ], PAAD[Pancreatic adenocarcinoma], PRAD[Prostate adenocarcinoma], SKCM[Skin Cutaneous Melanoma], STAD[Stomach adenocarcinoma], THCA[Thyroid carcinoma], UCEC[Uterine Corpus Endometrial Carcinoma] |
| Top |
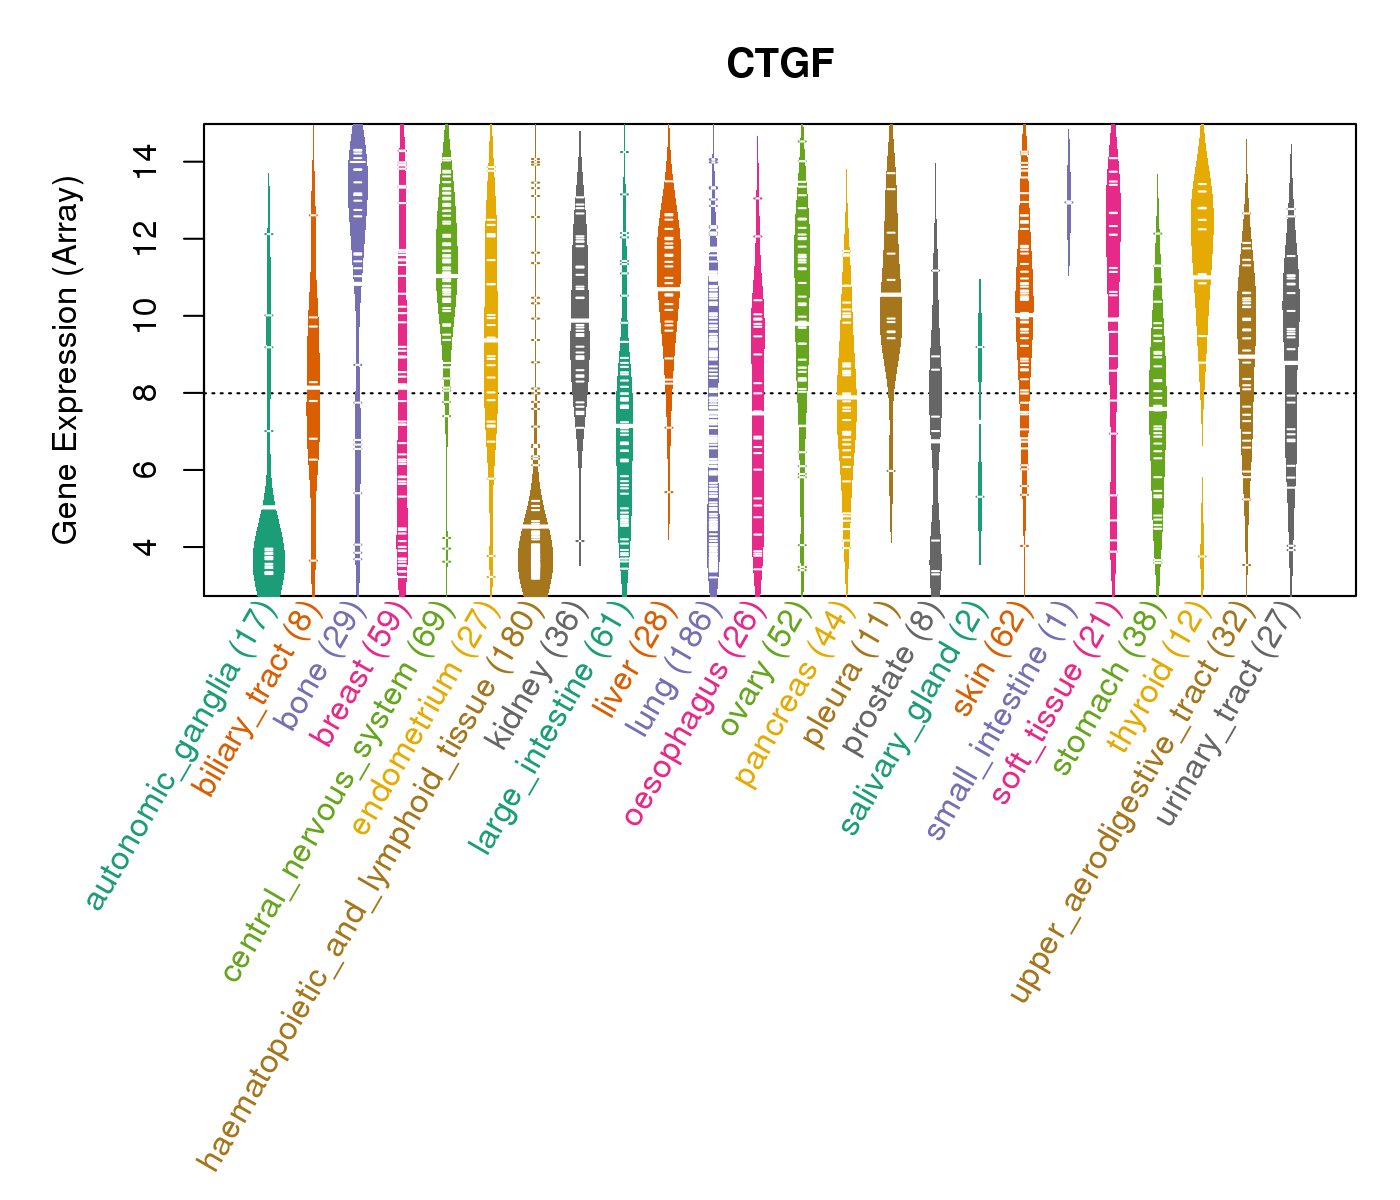
| Gene Expression for CTGF |
| * CCLE gene expression data were extracted from CCLE_Expression_Entrez_2012-10-18.res: Gene-centric RMA-normalized mRNA expression data. |
 |
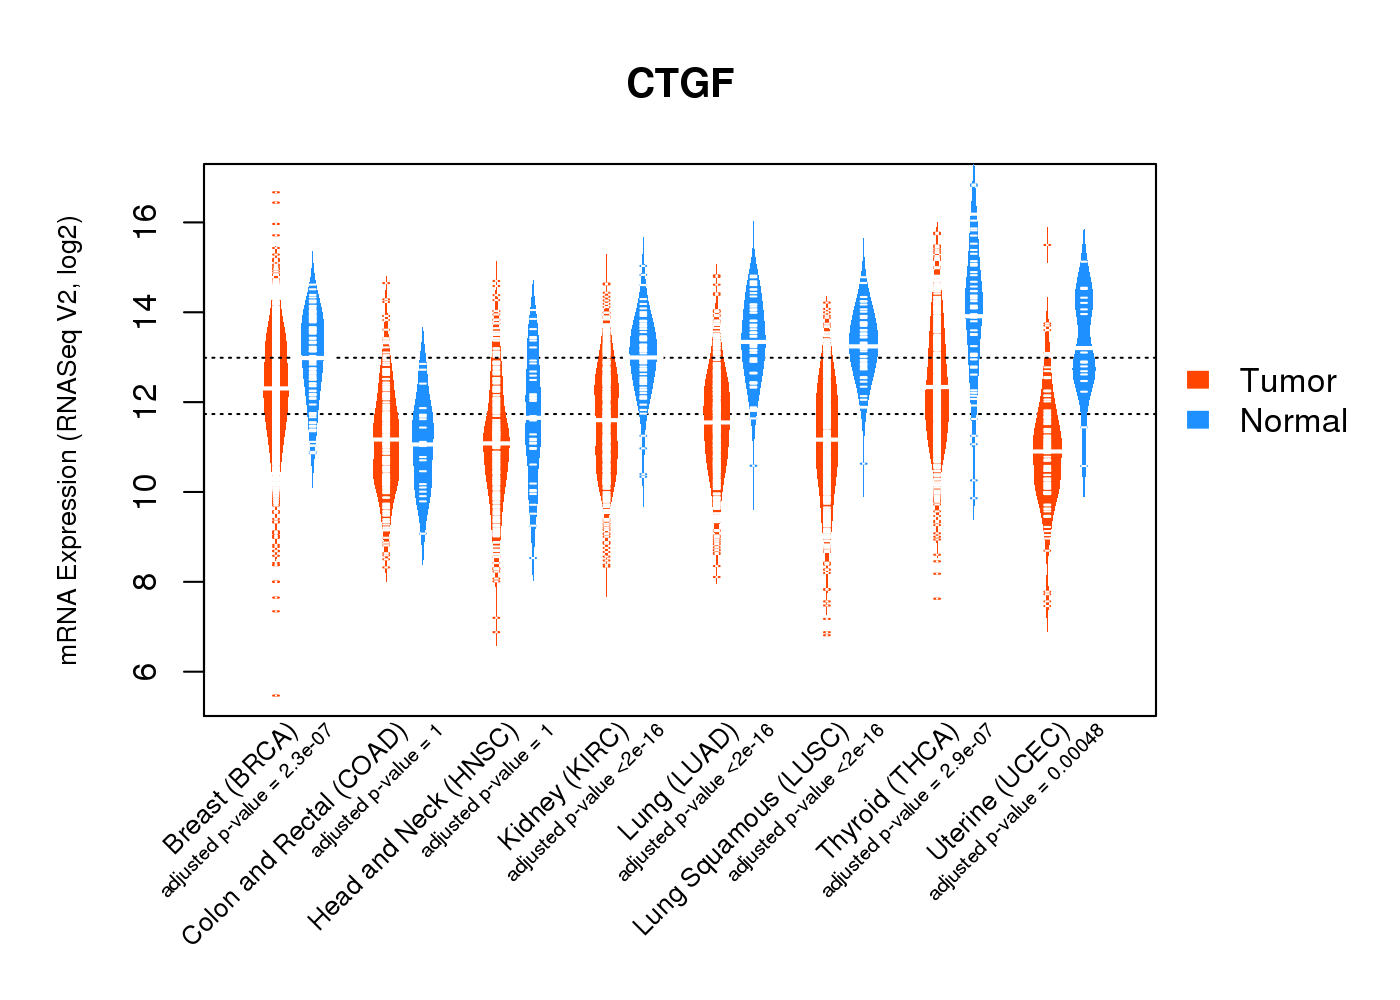
| * Normalized gene expression data of RNASeqV2 was extracted from TCGA using R package TCGA-Assembler. The URLs of all public data files on TCGA DCC data server were gathered at Jan-05-2015. Only eight cancer types have enough normal control samples for differential expression analysis. (t test, adjusted p<0.05 (using Benjamini-Hochberg FDR)) |
 |
| Top |
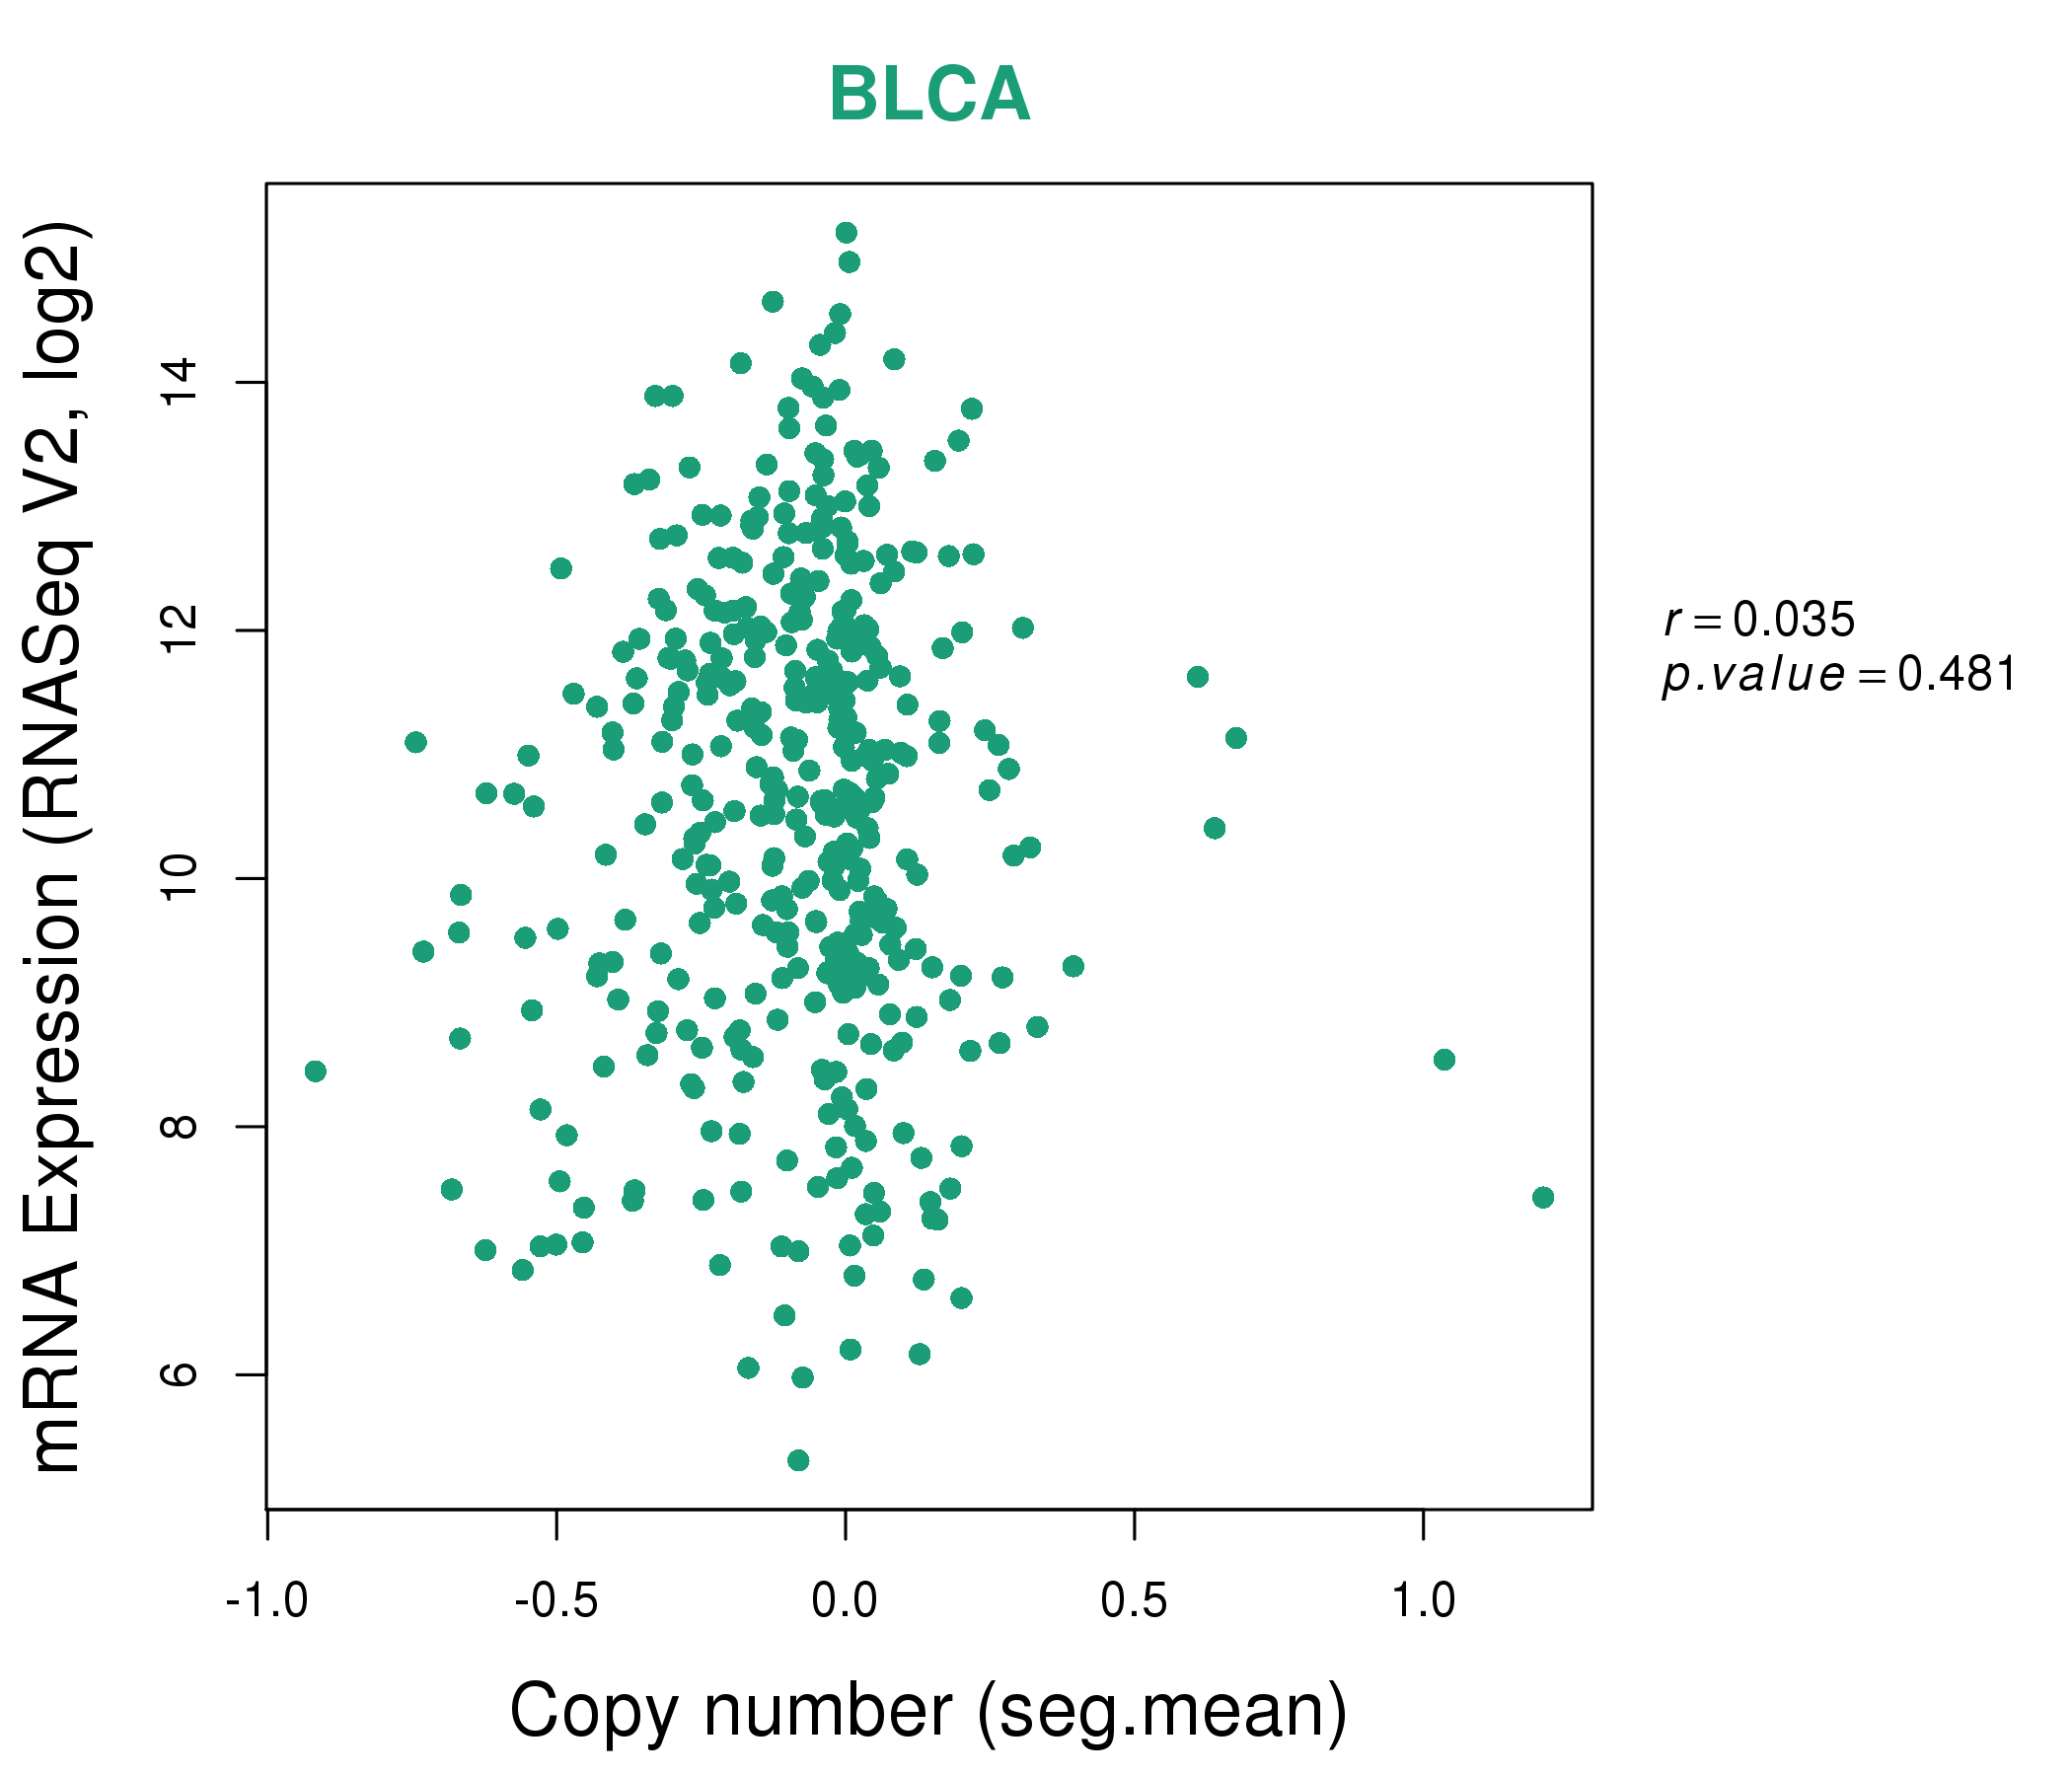
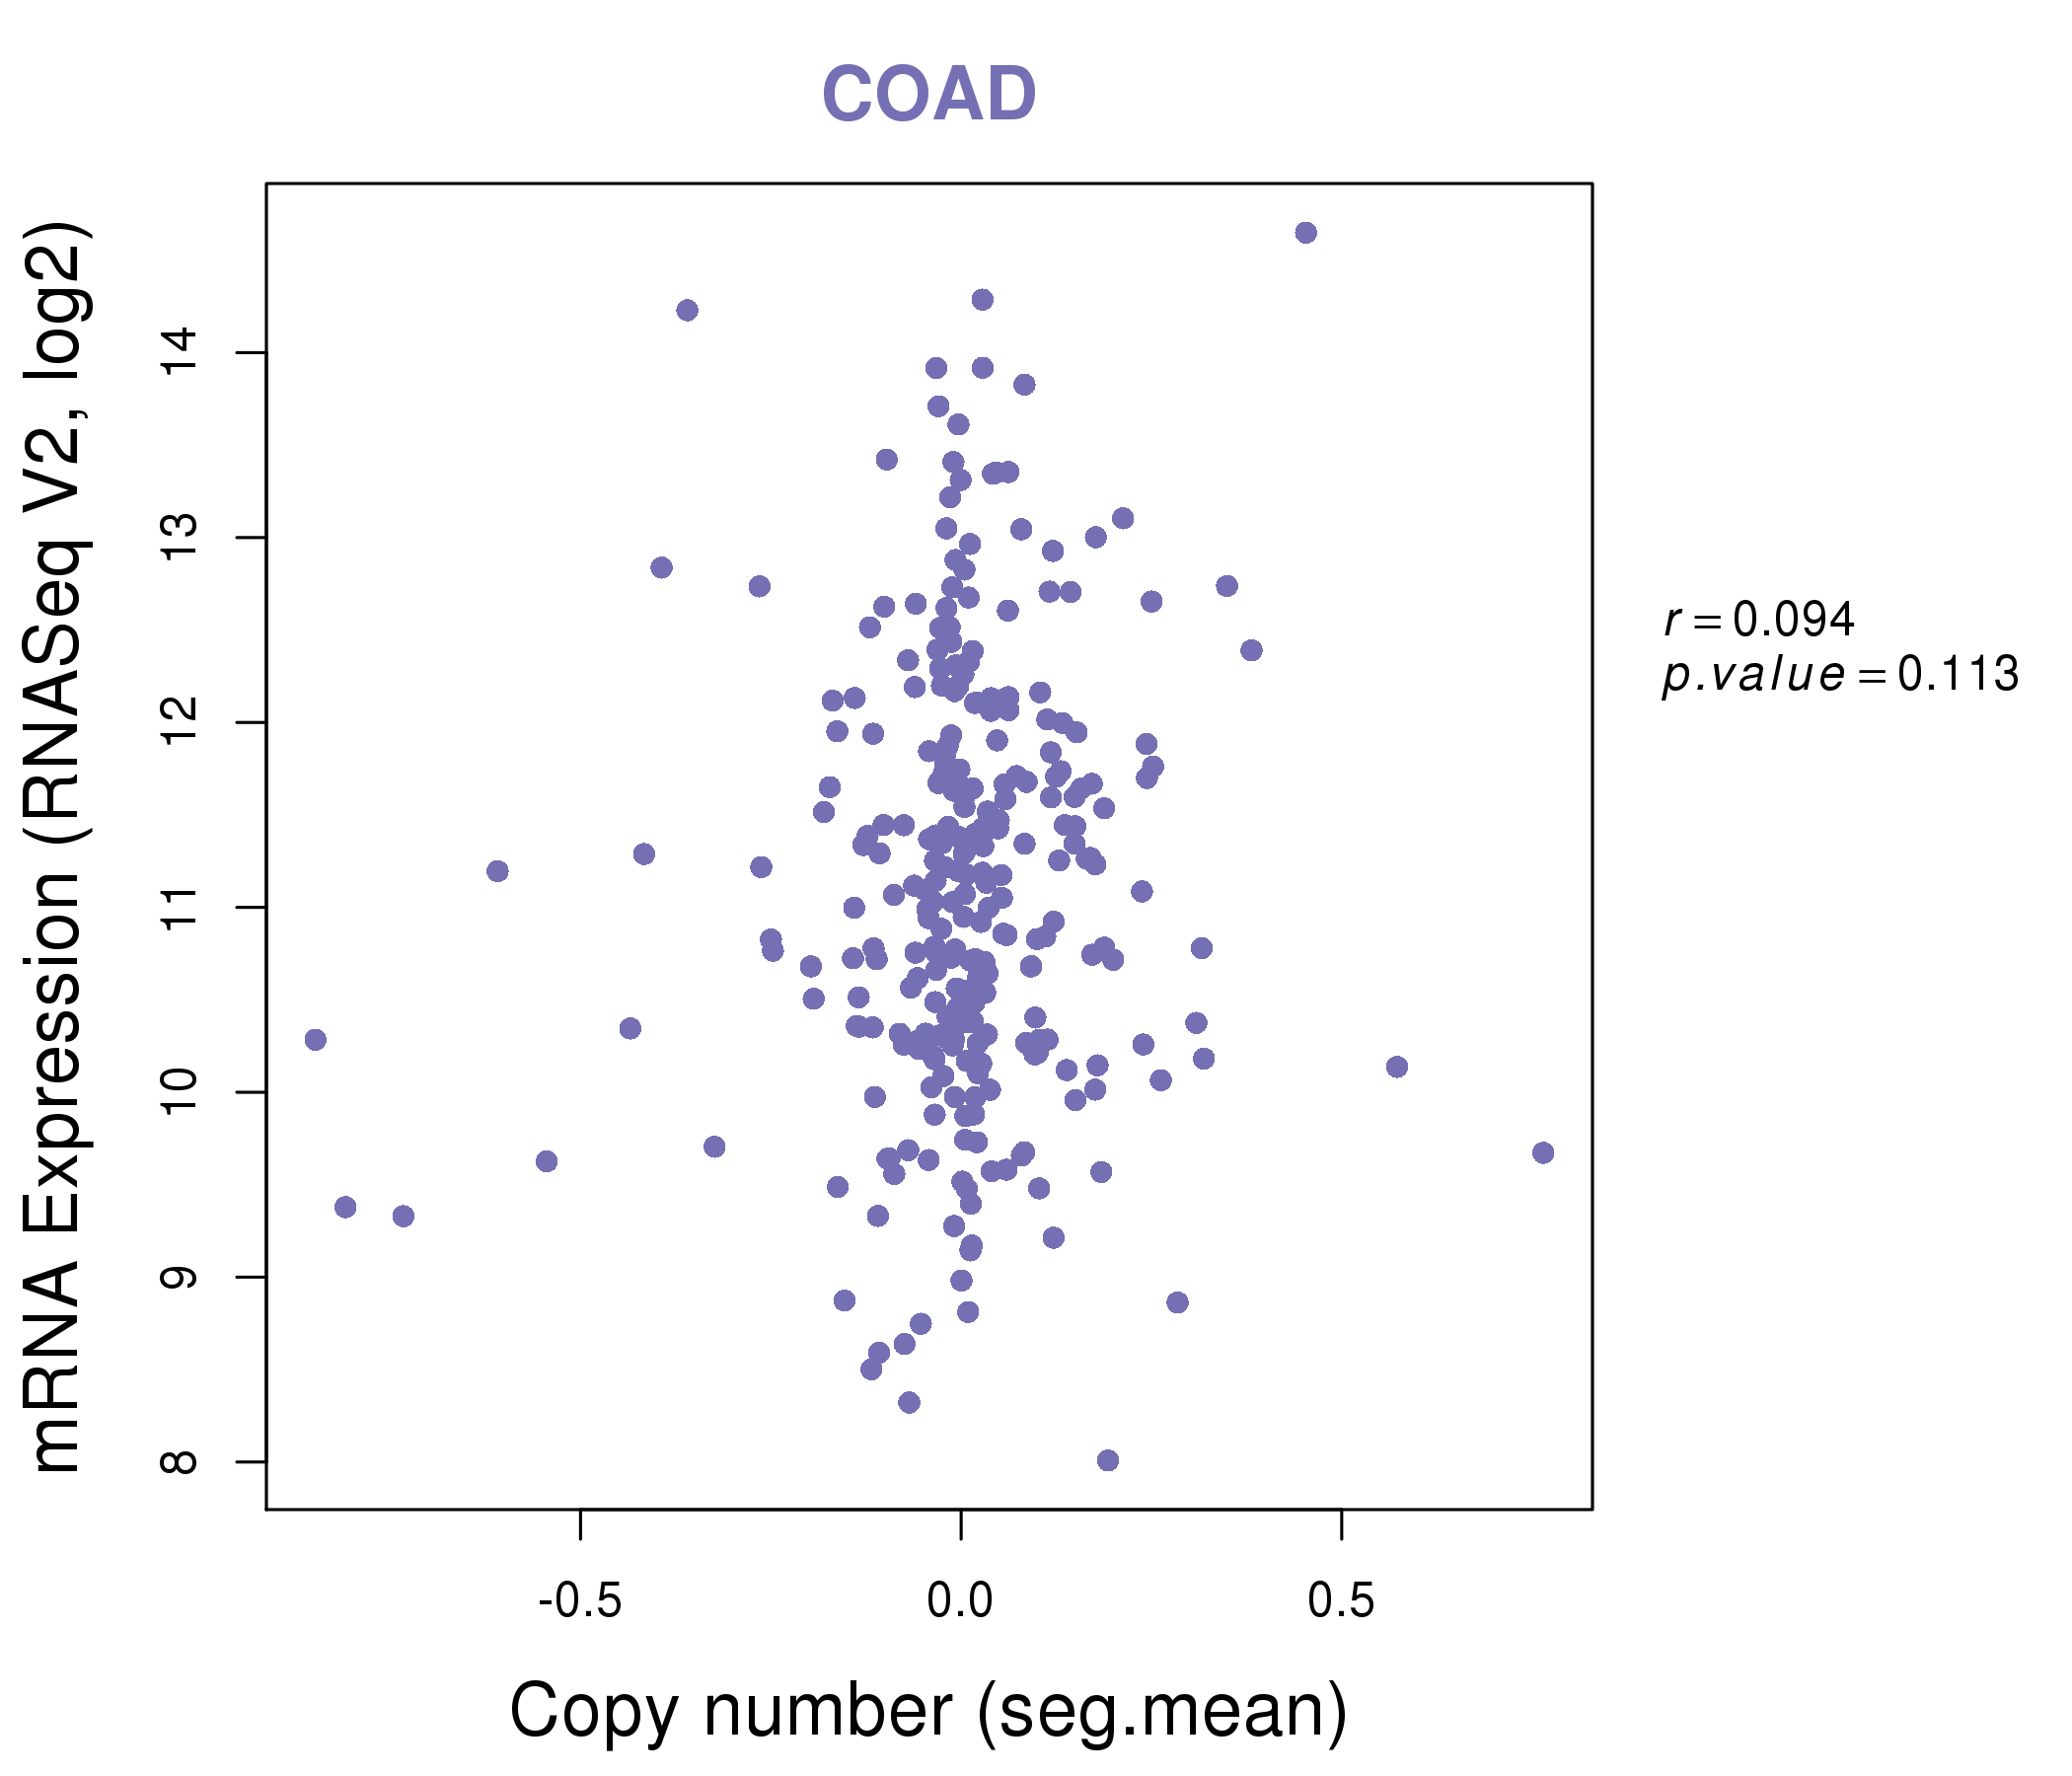
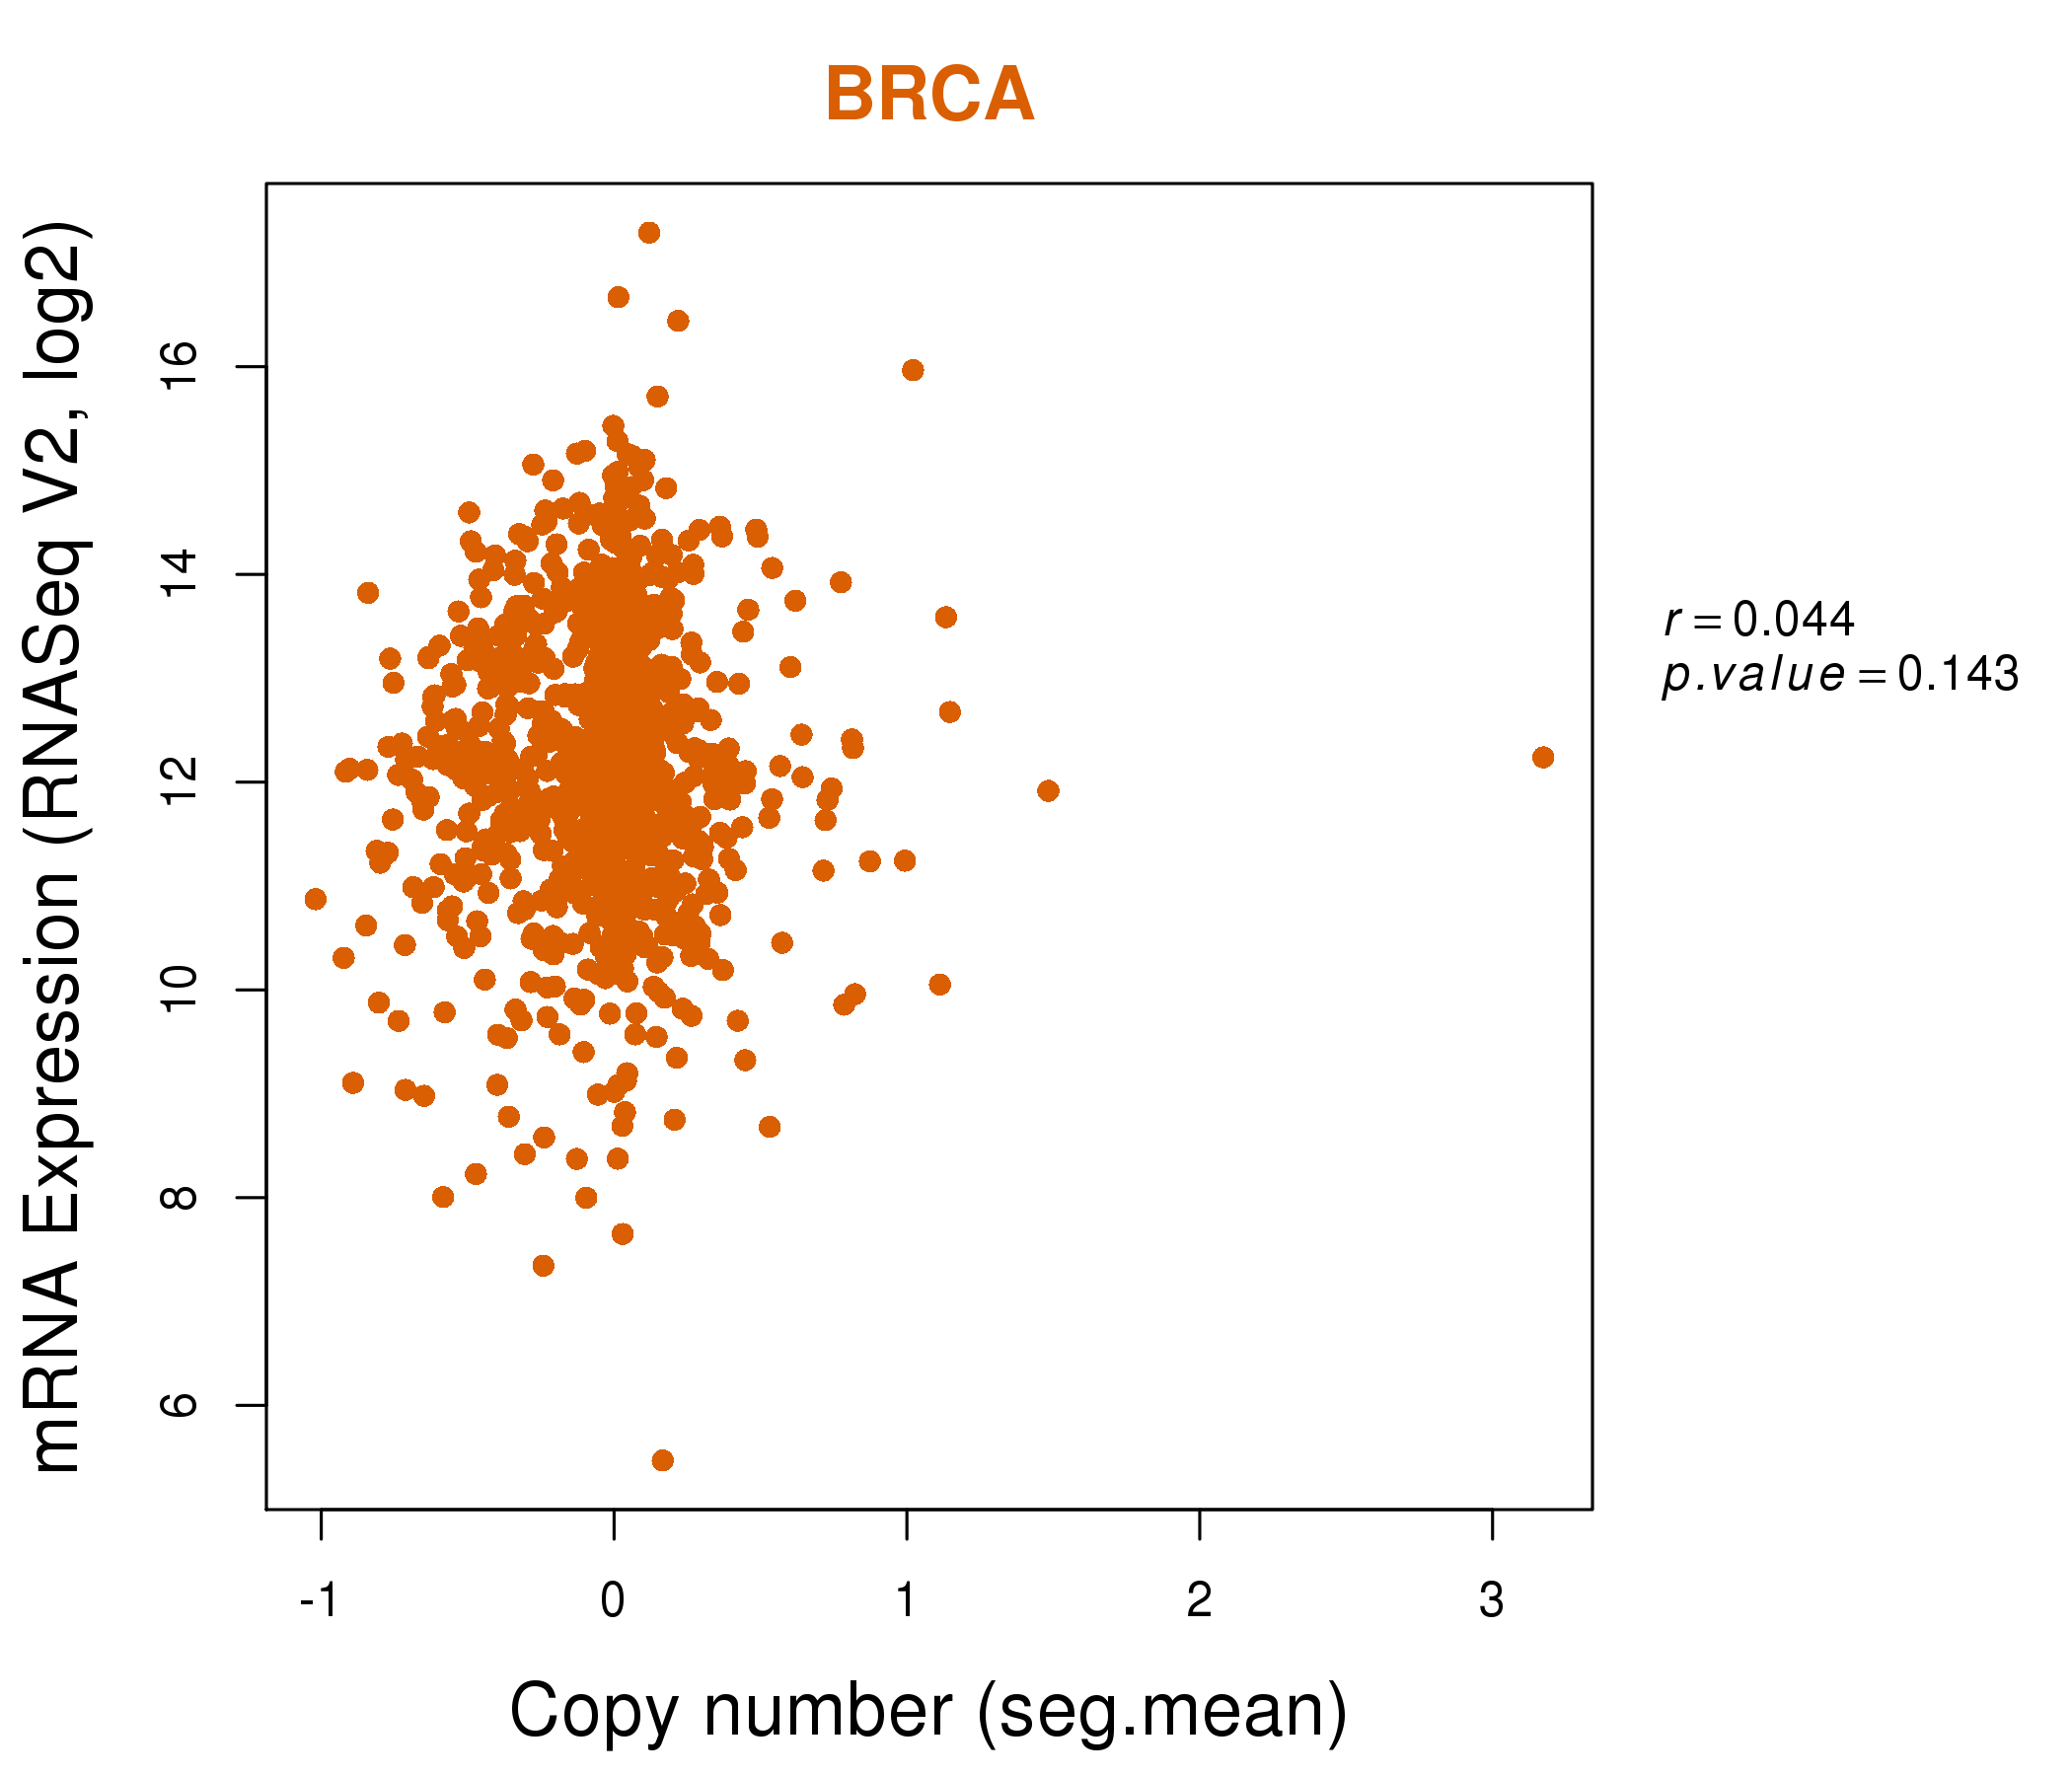
| * This plots show the correlation between CNV and gene expression. |
: Open all plots for all cancer types
 |
|
 |
|

| Top |
| Gene-Gene Network Information |
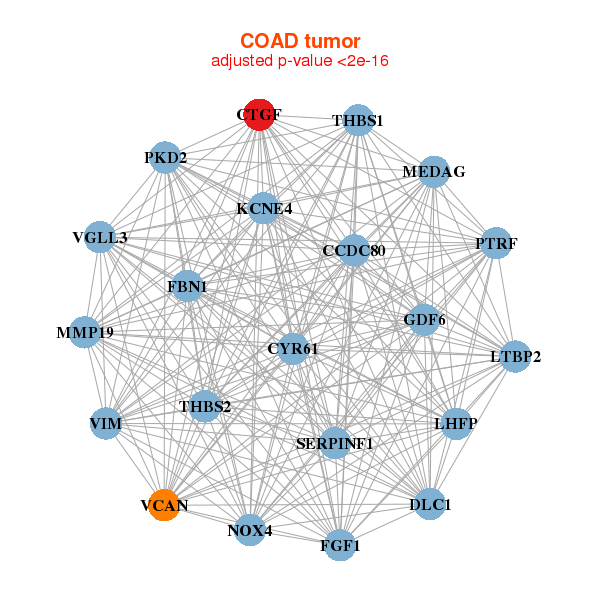
| * Co-Expression network figures were drawn using R package igraph. Only the top 20 genes with the highest correlations were shown. Red circle: input gene, orange circle: cell metabolism gene, sky circle: other gene |
: Open all plots for all cancer types
 |
| ||||
| C2orf40,COL11A2,CTGF,CYP26B1,CYR61,EGR1,FERMT2, FGF7,FNDC1,FSTL1,ISM1,LATS2,MAGEL2,MSRB3, NAP1L3,NPR2,PENK,PTRF,RECK,SEMA3D,ZNF469 | MB21D2,CHSY1,CSRNP1,CTGF,CYR61,DDX5,FOSL1, GADD45A,GPR3,ITPRIP,KLF6,LDLR,MAFF,MCL1, NEDD9,PER2,RHOU,SERPINE1,SIK1,TIPARP,WEE1 | ||||
 |
| ||||
| MEDAG,CCDC80,CTGF,CYR61,DLC1,FBN1,FGF1, GDF6,KCNE4,LHFP,LTBP2,MMP19,NOX4,PKD2, PTRF,SERPINF1,THBS1,THBS2,VCAN,VGLL3,VIM | ADAMTS1,ADAMTS4,AGR2___C11orf96,CEBPB,CHSY1,CSRNP1,CTGF, CYR61,EGR4,GPR4,HEYL,ITPRIP,JAG1,KLHL15, MMP19,PHLDA1,SCARNA9,SERPINE1,SF3B4,THBS1,ZFP36 |
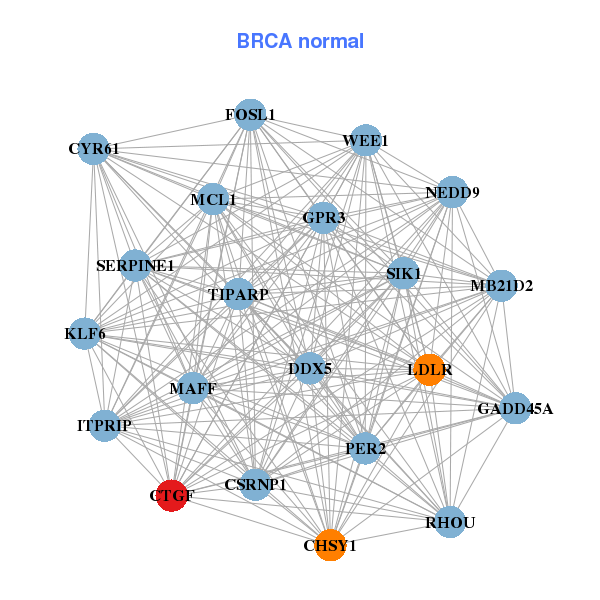
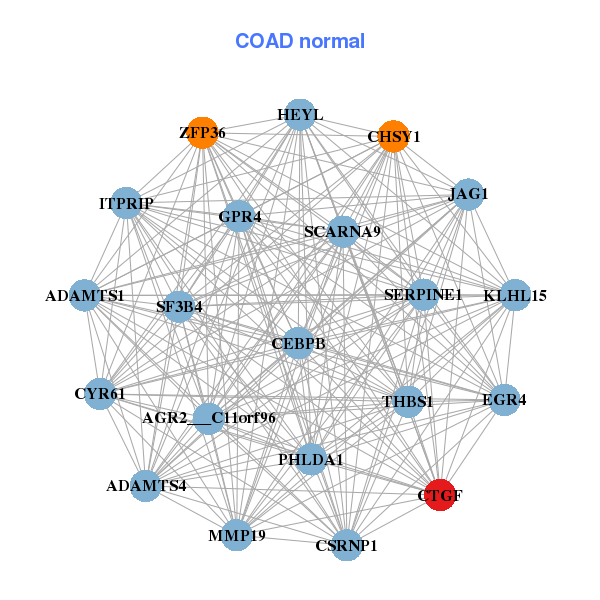
| * Co-Expression network figures were drawn using R package igraph. Only the top 20 genes with the highest correlations were shown. Red circle: input gene, orange circle: cell metabolism gene, sky circle: other gene |
: Open all plots for all cancer types
| Top |
: Open all interacting genes' information including KEGG pathway for all interacting genes from DAVID
| Top |
| Pharmacological Information for CTGF |
| DB Category | DB Name | DB's ID and Url link |
| Organism-specific databases | PharmGKB | PA27003; -. |
| Organism-specific databases | CTD | 1490; -. |
| * Gene Centered Interaction Network. |
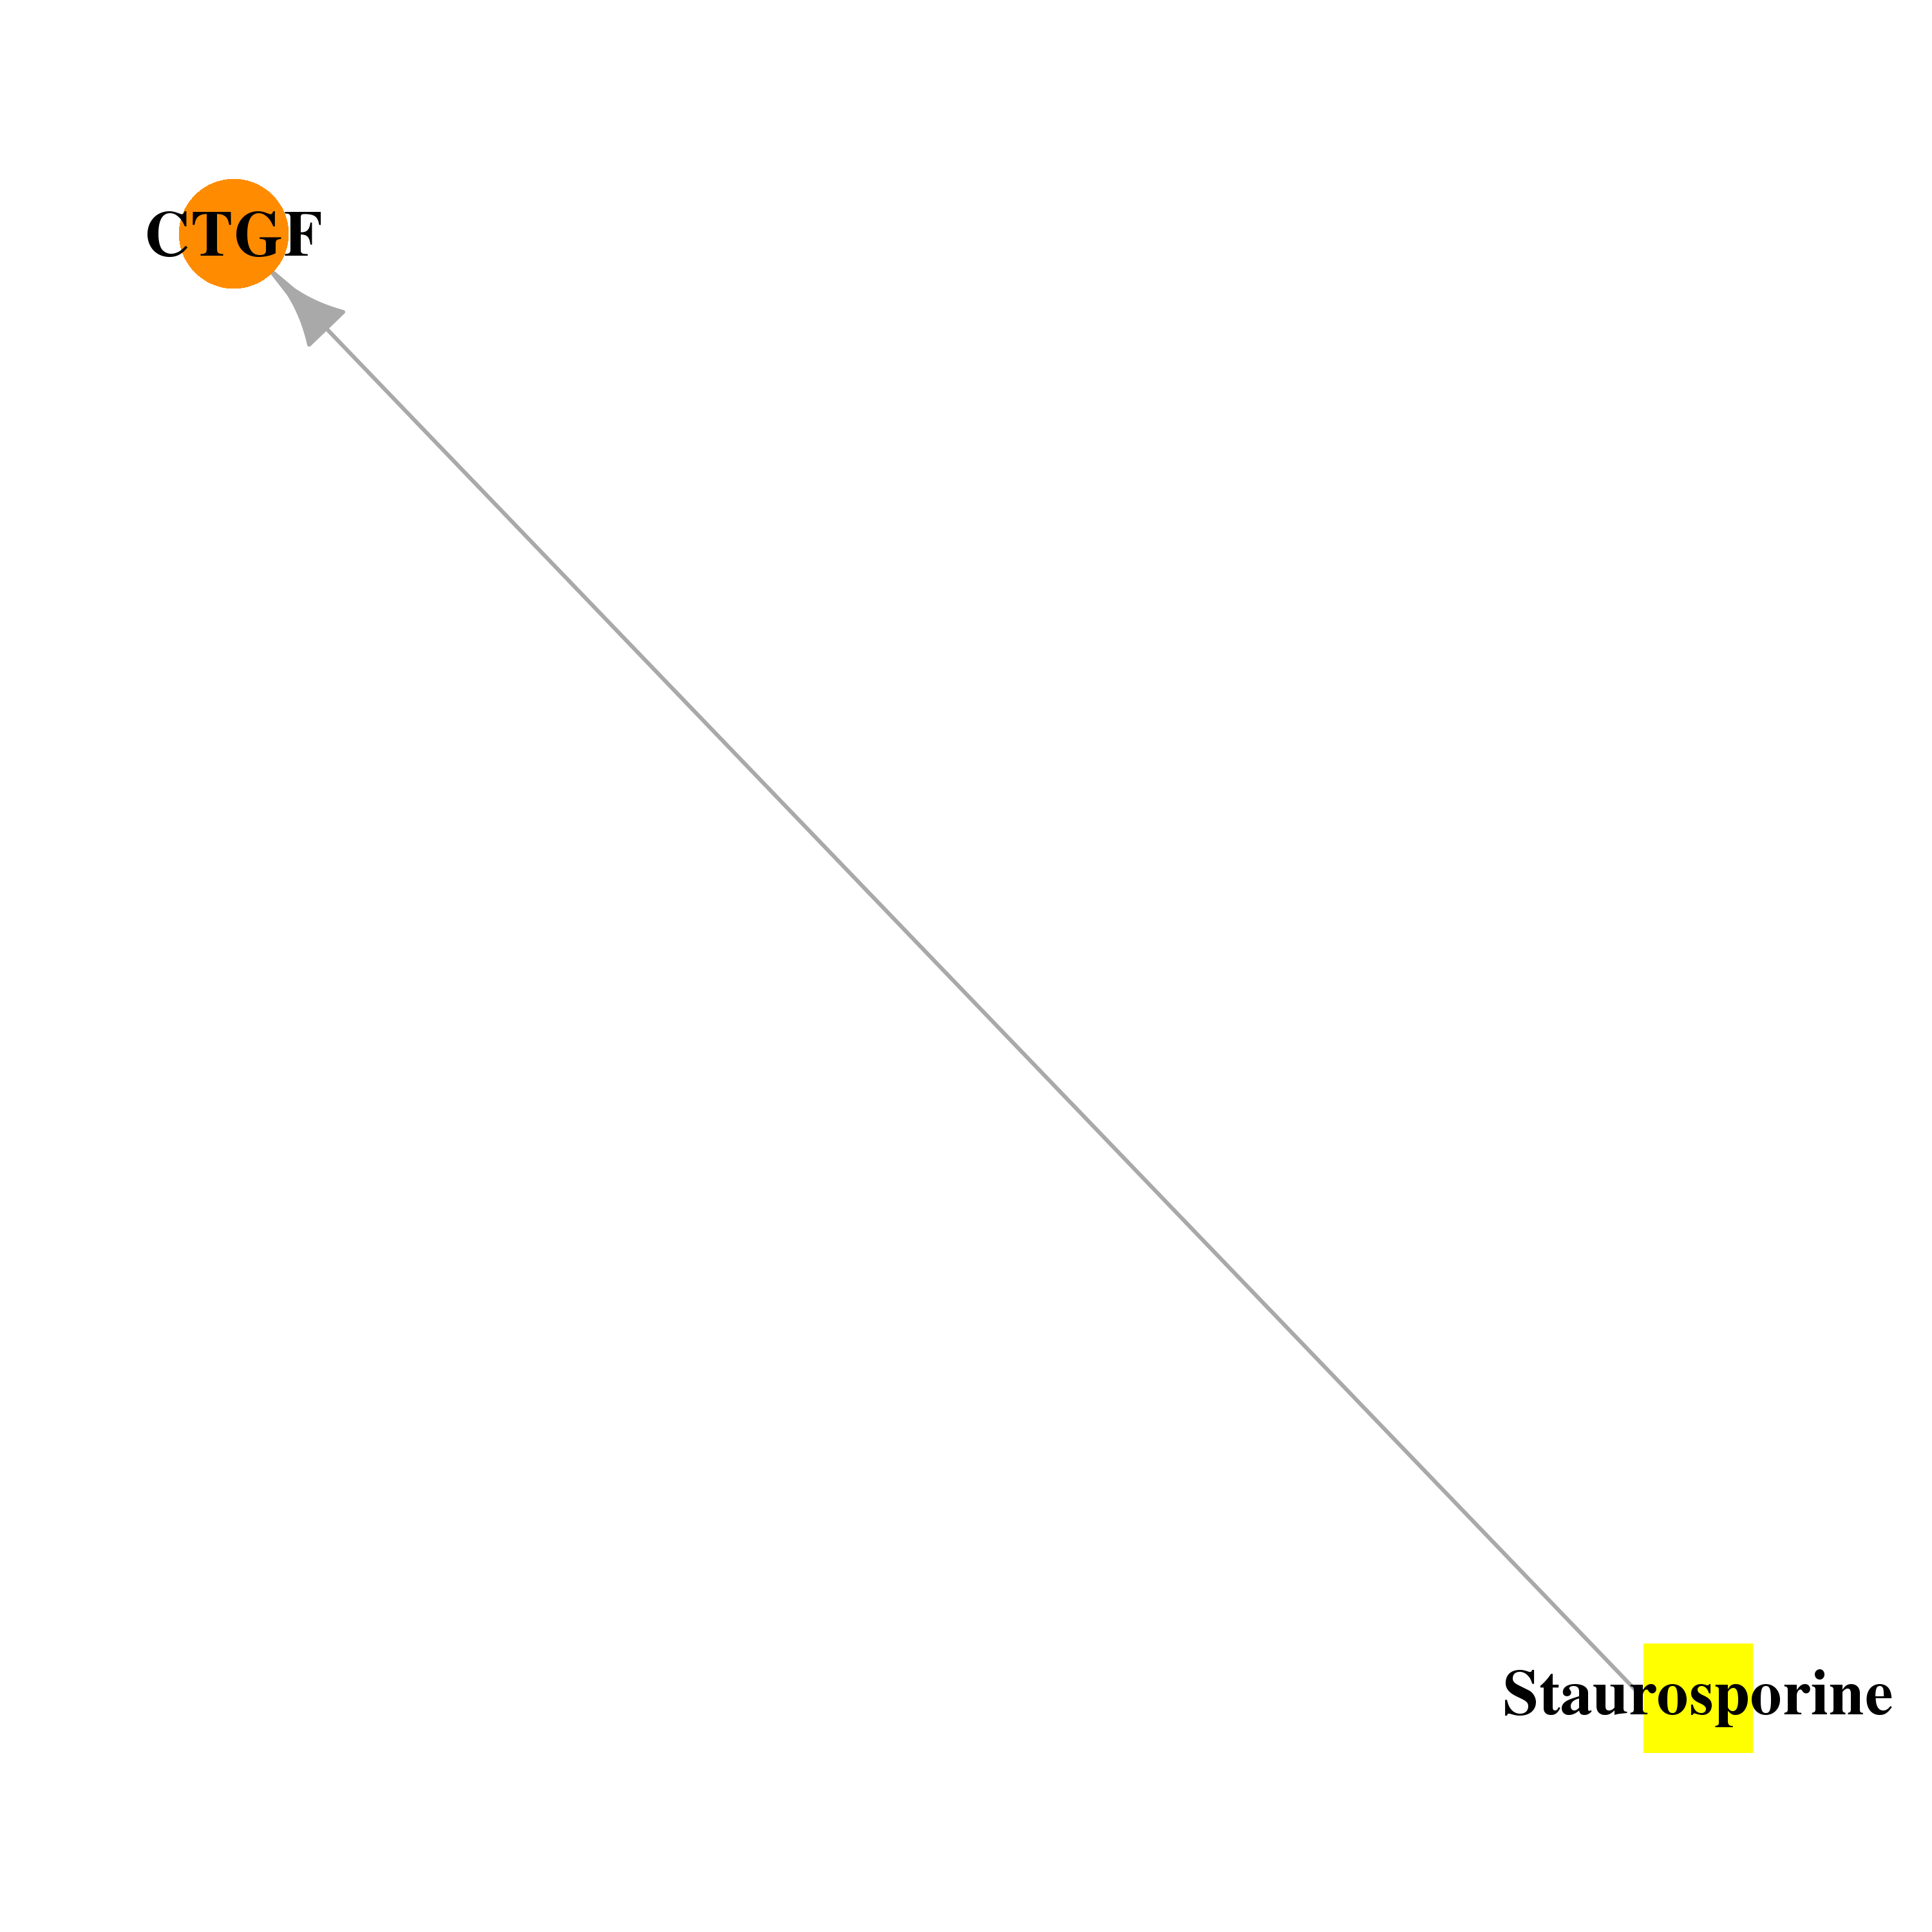 |
| * Drug Centered Interaction Network. |
| DrugBank ID | Target Name | Drug Groups | Generic Name | Drug Centered Network | Drug Structure |
| DB02010 | connective tissue growth factor | experimental | Staurosporine | 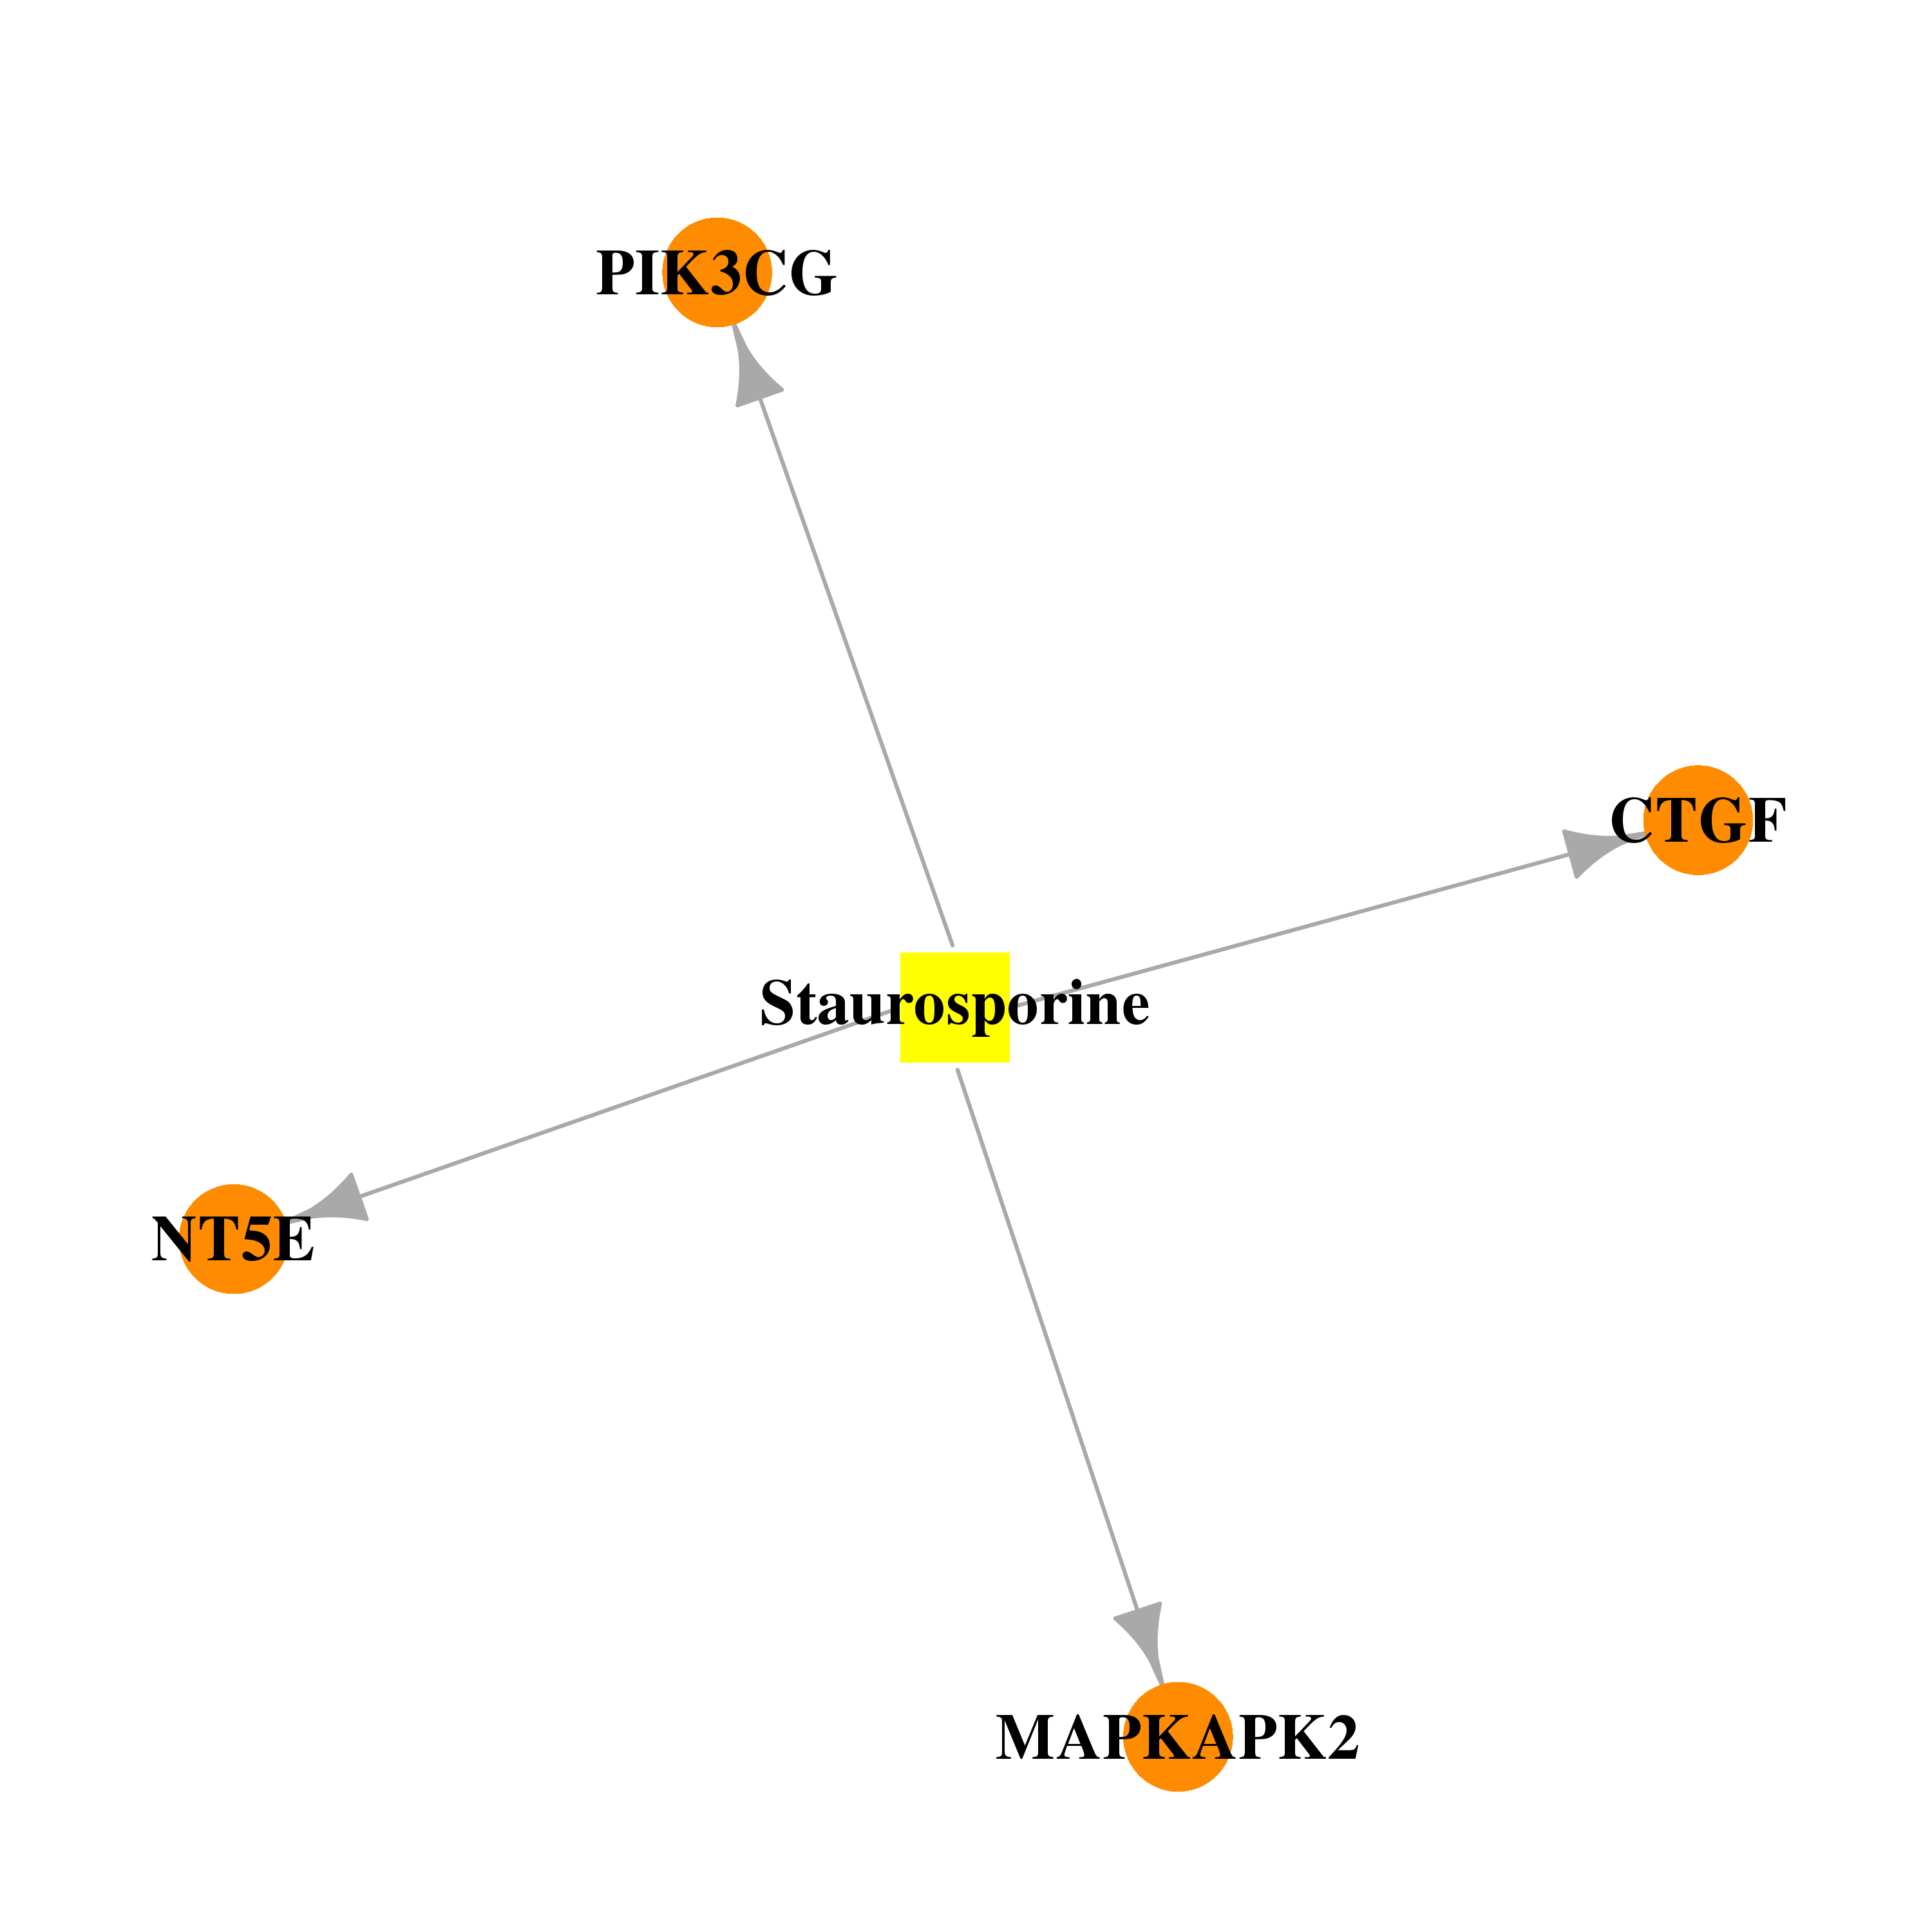 | 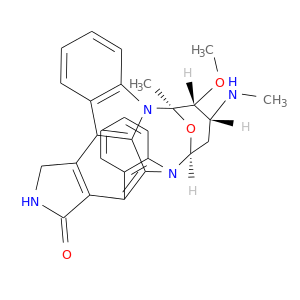 |
| Top |
| Cross referenced IDs for CTGF |
| * We obtained these cross-references from Uniprot database. It covers 150 different DBs, 18 categories. http://www.uniprot.org/help/cross_references_section |
: Open all cross reference information
|
Copyright © 2016-Present - The Univsersity of Texas Health Science Center at Houston @ |