|
||||||||||||||||||||||||||||||||||||||||||||||||||||||||||||||||||||||||||||||||||||||||||||||||||||||||||||||||||||||||||||||||||||||||||||||||||||||||||||||||||||||||||||||||||||||||||||||||||||||||||||||||||||||||||||||||||||||||||||||||||||||||||||||||||||||||||||||||||||||||||||||||||||||||||||||||||||||||||
| |
| Phenotypic Information (metabolism pathway, cancer, disease, phenome) |
| |
| |
| Gene-Gene Network Information: Co-Expression Network, Interacting Genes & KEGG |
| |
|


| Gene Summary for HSCB |
| Basic gene info. | Gene symbol | HSCB |
| Gene name | HscB mitochondrial iron-sulfur cluster co-chaperone | |
| Synonyms | DNAJC20|HSC20|JAC1|dJ366L4.2 | |
| Cytomap | UCSC genome browser: 22q12.1 | |
| Genomic location | chr22 :29138042-29153496 | |
| Type of gene | protein-coding | |
| RefGenes | NM_172002.3, | |
| Ensembl id | ENSG00000100209 | |
| Description | DnaJ (Hsp40) homolog, subfamily C, member 20HscB iron-sulfur cluster co-chaperone homologJ-type co-chaperone HSC20dnaJ homolog subfamily C member 20iron-sulfur cluster co-chaperone protein HscB, mitochondrial | |
| Modification date | 20141207 | |
| dbXrefs | MIM : 608142 | |
| HGNC : HGNC | ||
| Ensembl : ENSG00000100209 | ||
| HPRD : 16289 | ||
| Vega : OTTHUMG00000151092 | ||
| Protein | UniProt: go to UniProt's Cross Reference DB Table | |
| Expression | CleanEX: HS_HSCB | |
| BioGPS: 150274 | ||
| Gene Expression Atlas: ENSG00000100209 | ||
| The Human Protein Atlas: ENSG00000100209 | ||
| Pathway | NCI Pathway Interaction Database: HSCB | |
| KEGG: HSCB | ||
| REACTOME: HSCB | ||
| ConsensusPathDB | ||
| Pathway Commons: HSCB | ||
| Metabolism | MetaCyc: HSCB | |
| HUMANCyc: HSCB | ||
| Regulation | Ensembl's Regulation: ENSG00000100209 | |
| miRBase: chr22 :29,138,042-29,153,496 | ||
| TargetScan: NM_172002 | ||
| cisRED: ENSG00000100209 | ||
| Context | iHOP: HSCB | |
| cancer metabolism search in PubMed: HSCB | ||
| UCL Cancer Institute: HSCB | ||
| Assigned class in ccmGDB | C | |
| Top |
| Phenotypic Information for HSCB(metabolism pathway, cancer, disease, phenome) |
| Cancer | CGAP: HSCB |
| Familial Cancer Database: HSCB | |
| * This gene is included in those cancer gene databases. |
|
|
|
|
|
| . | ||||||||||||||||||||||||||||||||||||||||||||||||||||||||||||||||||||||||||||||||||||||||||||||||||||||||||||||||||||||||||||||||||||||||||||||||||||||||||||||||||||||||||||||||||||||||||||||||||||||||||||||||||||||||||||||||||||||||||||||||||||||||||||||||||||||||||||||||||||||||||||||||||||||||||||||||||||
Oncogene 1 | Significant driver gene in | |||||||||||||||||||||||||||||||||||||||||||||||||||||||||||||||||||||||||||||||||||||||||||||||||||||||||||||||||||||||||||||||||||||||||||||||||||||||||||||||||||||||||||||||||||||||||||||||||||||||||||||||||||||||||||||||||||||||||||||||||||||||||||||||||||||||||||||||||||||||||||||||||||||||||||||||||||||||||
| cf) number; DB name 1 Oncogene; http://nar.oxfordjournals.org/content/35/suppl_1/D721.long, 2 Tumor Suppressor gene; https://bioinfo.uth.edu/TSGene/, 3 Cancer Gene Census; http://www.nature.com/nrc/journal/v4/n3/abs/nrc1299.html, 4 CancerGenes; http://nar.oxfordjournals.org/content/35/suppl_1/D721.long, 5 Network of Cancer Gene; http://ncg.kcl.ac.uk/index.php, 1Therapeutic Vulnerabilities in Cancer; http://cbio.mskcc.org/cancergenomics/statius/ |
| REACTOME_METABOLISM_OF_PROTEINS | |
| OMIM | |
| Orphanet | |
| Disease | KEGG Disease: HSCB |
| MedGen: HSCB (Human Medical Genetics with Condition) | |
| ClinVar: HSCB | |
| Phenotype | MGI: HSCB (International Mouse Phenotyping Consortium) |
| PhenomicDB: HSCB | |
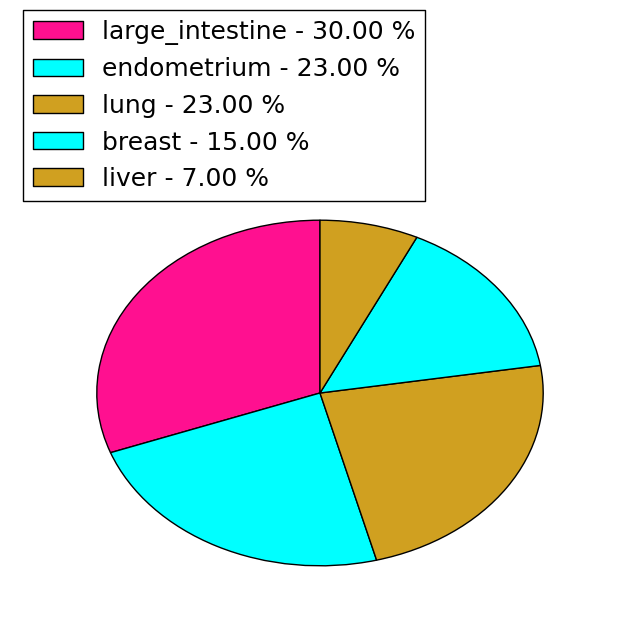
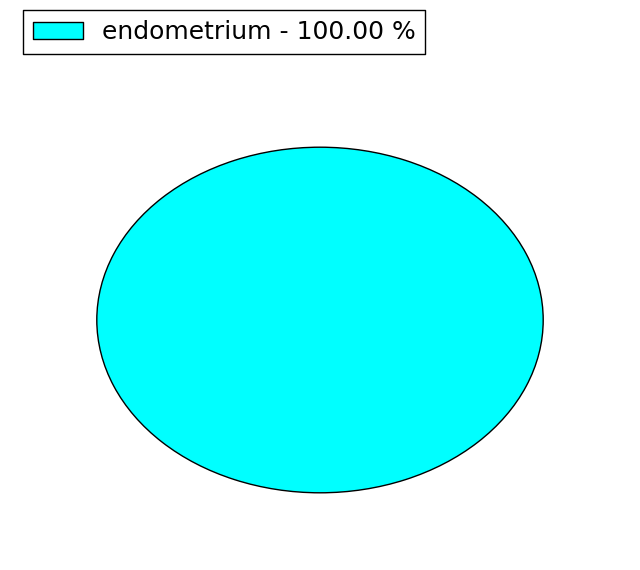
| Mutations for HSCB |
| * Under tables are showing count per each tissue to give us broad intuition about tissue specific mutation patterns.You can go to the detailed page for each mutation database's web site. |
| There's no structural variation information in COSMIC data for this gene. |
| * From mRNA Sanger sequences, Chitars2.0 arranged chimeric transcripts. This table shows HSCB related fusion information. |
| ID | Head Gene | Tail Gene | Accession | Gene_a | qStart_a | qEnd_a | Chromosome_a | tStart_a | tEnd_a | Gene_a | qStart_a | qEnd_a | Chromosome_a | tStart_a | tEnd_a |
| CR993366 | ARHGEF18 | 1 | 406 | 19 | 7509179 | 7516152 | HSCB | 405 | 730 | 22 | 29153064 | 29153391 | |
| BX096842 | HSCB | 1 | 369 | 22 | 29139870 | 29153199 | C6orf165 | 363 | 469 | 6 | 88175463 | 88175569 | |
| Top |
| Mutation type/ Tissue ID | brca | cns | cerv | endome | haematopo | kidn | Lintest | liver | lung | ns | ovary | pancre | prost | skin | stoma | thyro | urina | |||
| Total # sample | 2 | 1 | ||||||||||||||||||
| GAIN (# sample) | 2 | |||||||||||||||||||
| LOSS (# sample) | 1 |
| cf) Tissue ID; Tissue type (1; Breast, 2; Central_nervous_system, 3; Cervix, 4; Endometrium, 5; Haematopoietic_and_lymphoid_tissue, 6; Kidney, 7; Large_intestine, 8; Liver, 9; Lung, 10; NS, 11; Ovary, 12; Pancreas, 13; Prostate, 14; Skin, 15; Stomach, 16; Thyroid, 17; Urinary_tract) |
| Top |
|
 |
| Top |
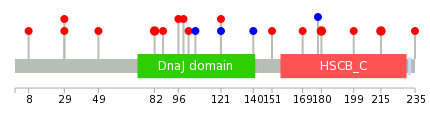
| Stat. for Non-Synonymous SNVs (# total SNVs=13) | (# total SNVs=1) |
 |  |
(# total SNVs=0) | (# total SNVs=0) |
| Top |
| * When you move the cursor on each content, you can see more deailed mutation information on the Tooltip. Those are primary_site,primary_histology,mutation(aa),pubmedID. |
| GRCh37 position | Mutation(aa) | Unique sampleID count |
| chr22:29141967-29141967 | p.A180V | 2 |
| chr22:29153094-29153094 | p.L215F | 2 |
| chr22:29138168-29138168 | p.D29Y | 2 |
| chr22:29139878-29139878 | p.S82F | 2 |
| chr22:29141935-29141935 | p.N169K | 1 |
| chr22:29139929-29139929 | p.R99H | 1 |
| chr22:29141962-29141962 | p.E178E | 1 |
| chr22:29139937-29139937 | p.H102D | 1 |
| chr22:29139951-29139951 | p.F106F | 1 |
| chr22:29147228-29147228 | p.? | 1 |
| Top |
|
 |
| Point Mutation/ Tissue ID | 1 | 2 | 3 | 4 | 5 | 6 | 7 | 8 | 9 | 10 | 11 | 12 | 13 | 14 | 15 | 16 | 17 | 18 | 19 | 20 |
| # sample | 2 | 1 | 2 | 2 | 2 | 3 | 3 | 4 | ||||||||||||
| # mutation | 2 | 1 | 2 | 2 | 2 | 3 | 3 | 4 | ||||||||||||
| nonsynonymous SNV | 2 | 1 | 2 | 1 | 2 | 2 | 2 | 3 | ||||||||||||
| synonymous SNV | 1 | 1 | 1 | 1 |
| cf) Tissue ID; Tissue type (1; BLCA[Bladder Urothelial Carcinoma], 2; BRCA[Breast invasive carcinoma], 3; CESC[Cervical squamous cell carcinoma and endocervical adenocarcinoma], 4; COAD[Colon adenocarcinoma], 5; GBM[Glioblastoma multiforme], 6; Glioma Low Grade, 7; HNSC[Head and Neck squamous cell carcinoma], 8; KICH[Kidney Chromophobe], 9; KIRC[Kidney renal clear cell carcinoma], 10; KIRP[Kidney renal papillary cell carcinoma], 11; LAML[Acute Myeloid Leukemia], 12; LUAD[Lung adenocarcinoma], 13; LUSC[Lung squamous cell carcinoma], 14; OV[Ovarian serous cystadenocarcinoma ], 15; PAAD[Pancreatic adenocarcinoma], 16; PRAD[Prostate adenocarcinoma], 17; SKCM[Skin Cutaneous Melanoma], 18:STAD[Stomach adenocarcinoma], 19:THCA[Thyroid carcinoma], 20:UCEC[Uterine Corpus Endometrial Carcinoma]) |
| Top |
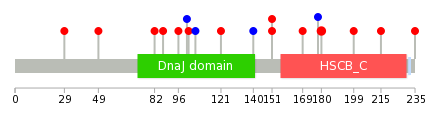
| * We represented just top 10 SNVs. When you move the cursor on each content, you can see more deailed mutation information on the Tooltip. Those are primary_site, primary_histology, mutation(aa), pubmedID. |
| Genomic Position | Mutation(aa) | Unique sampleID count |
| chr22:29141967 | p.A180V | 2 |
| chr22:29153094 | p.N169K | 1 |
| chr22:29139937 | p.E178E | 1 |
| chr22:29153152 | p.V199A | 1 |
| chr22:29139951 | p.D29Y | 1 |
| chr22:29140631 | p.L215F | 1 |
| chr22:29140689 | p.G49R | 1 |
| chr22:29141879 | p.L235I | 1 |
| chr22:29138168 | p.S82F | 1 |
| chr22:29141880 | p.T87I | 1 |
| * Copy number data were extracted from TCGA using R package TCGA-Assembler. The URLs of all public data files on TCGA DCC data server were gathered on Jan-05-2015. Function ProcessCNAData in TCGA-Assembler package was used to obtain gene-level copy number value which is calculated as the average copy number of the genomic region of a gene. |
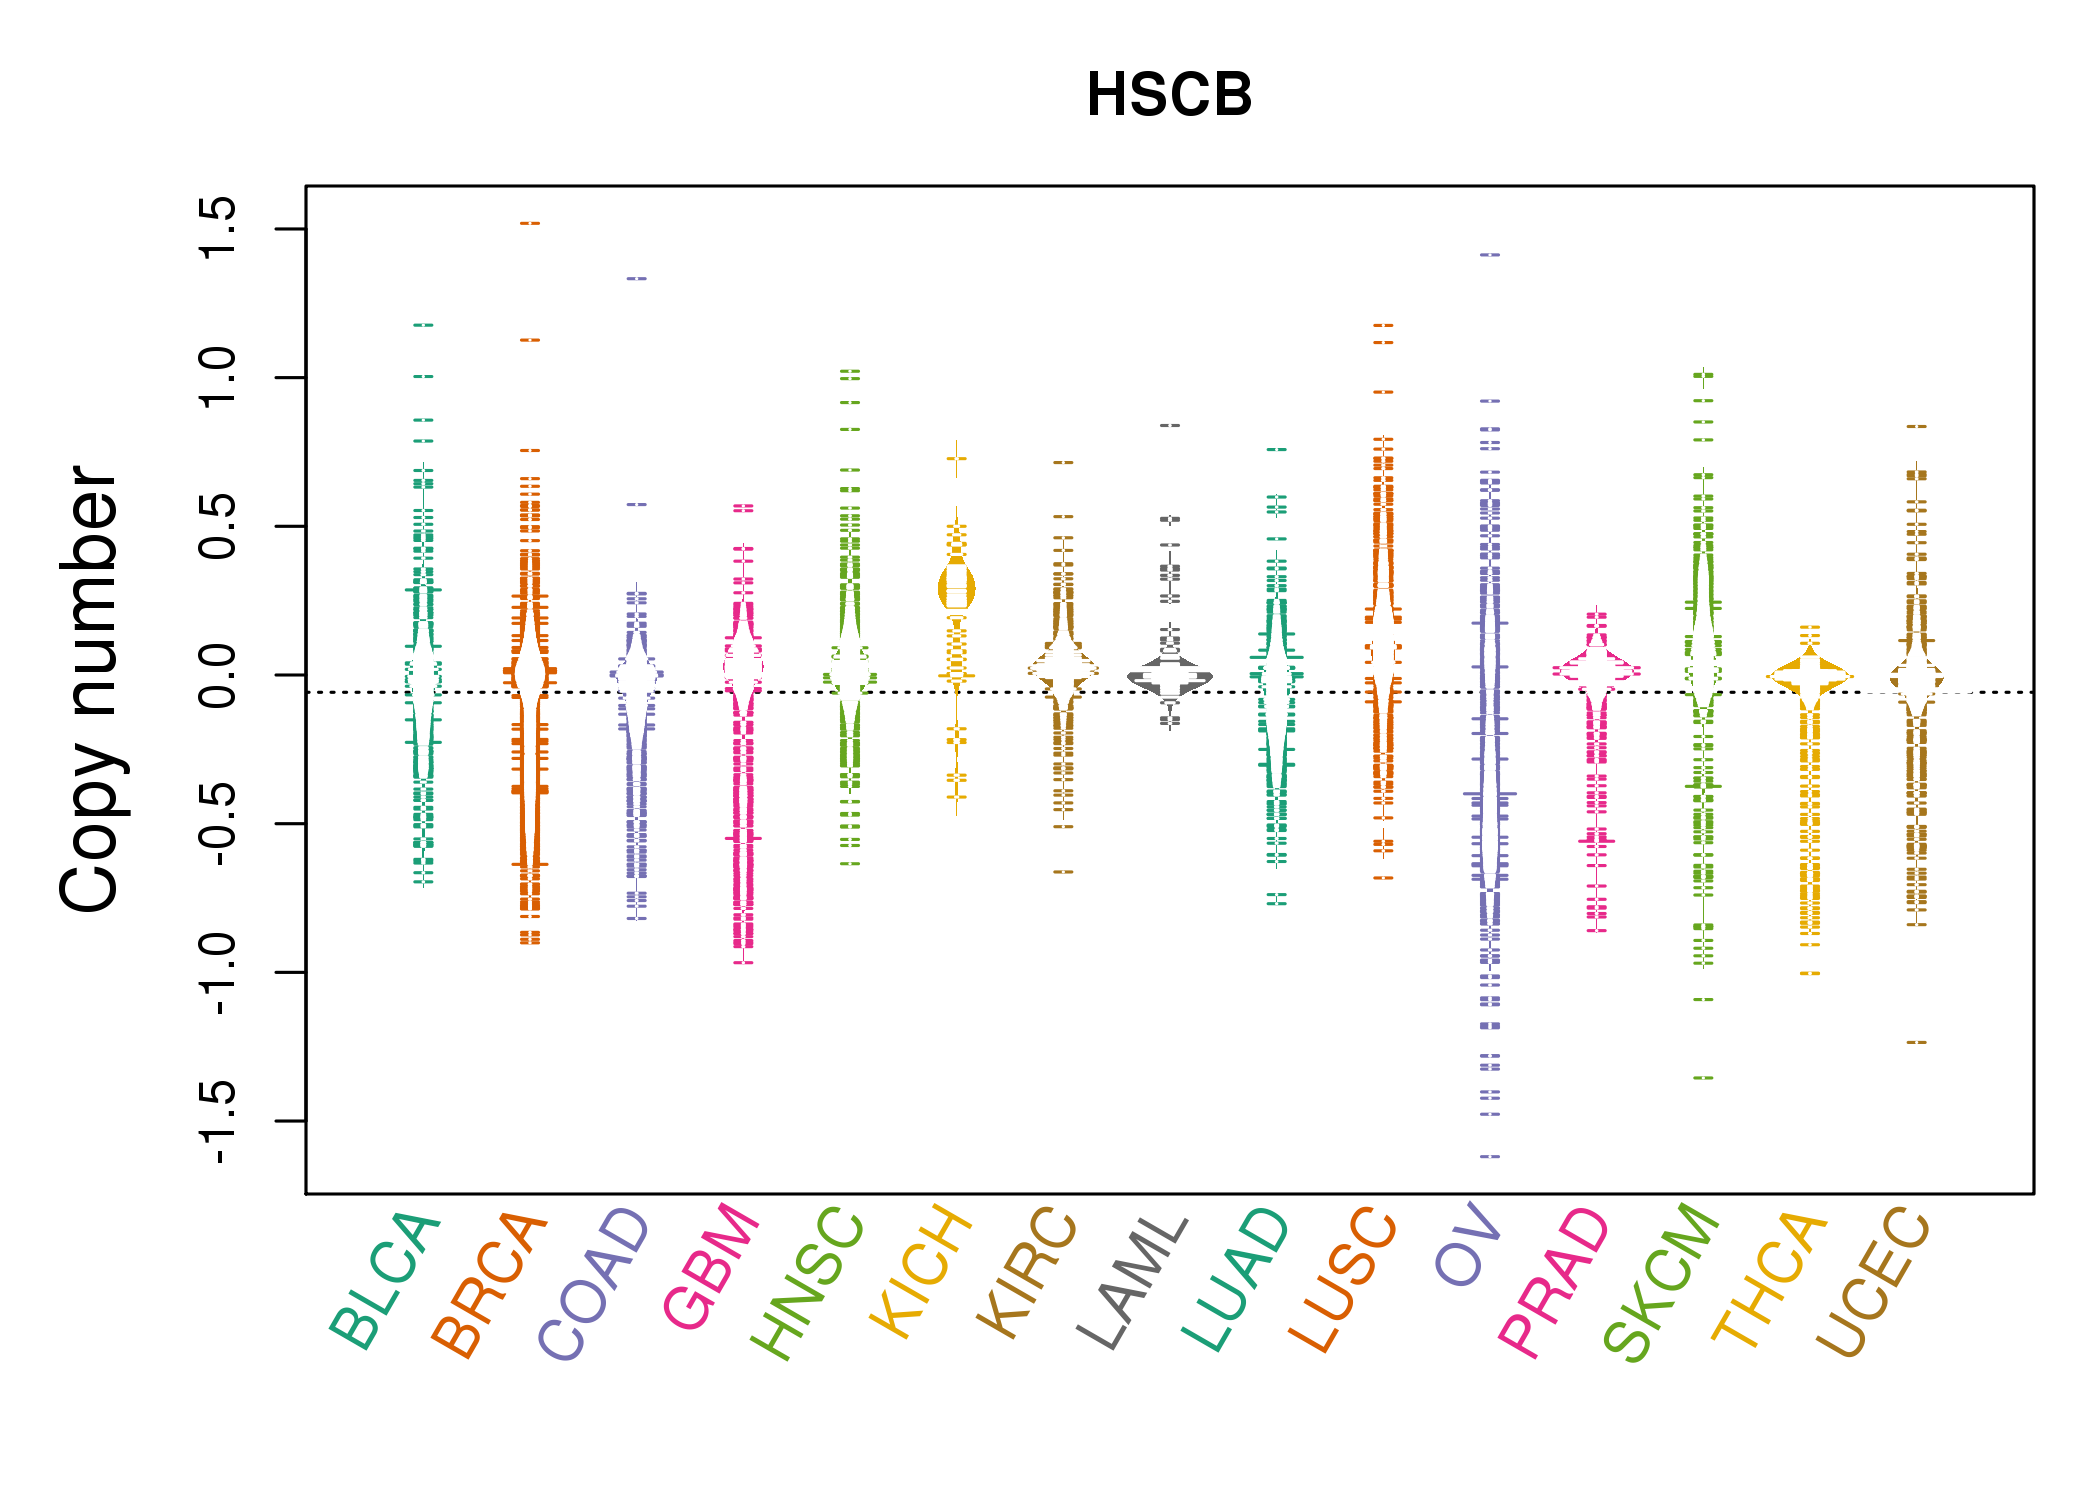 |
| cf) Tissue ID[Tissue type]: BLCA[Bladder Urothelial Carcinoma], BRCA[Breast invasive carcinoma], CESC[Cervical squamous cell carcinoma and endocervical adenocarcinoma], COAD[Colon adenocarcinoma], GBM[Glioblastoma multiforme], Glioma Low Grade, HNSC[Head and Neck squamous cell carcinoma], KICH[Kidney Chromophobe], KIRC[Kidney renal clear cell carcinoma], KIRP[Kidney renal papillary cell carcinoma], LAML[Acute Myeloid Leukemia], LUAD[Lung adenocarcinoma], LUSC[Lung squamous cell carcinoma], OV[Ovarian serous cystadenocarcinoma ], PAAD[Pancreatic adenocarcinoma], PRAD[Prostate adenocarcinoma], SKCM[Skin Cutaneous Melanoma], STAD[Stomach adenocarcinoma], THCA[Thyroid carcinoma], UCEC[Uterine Corpus Endometrial Carcinoma] |
| Top |
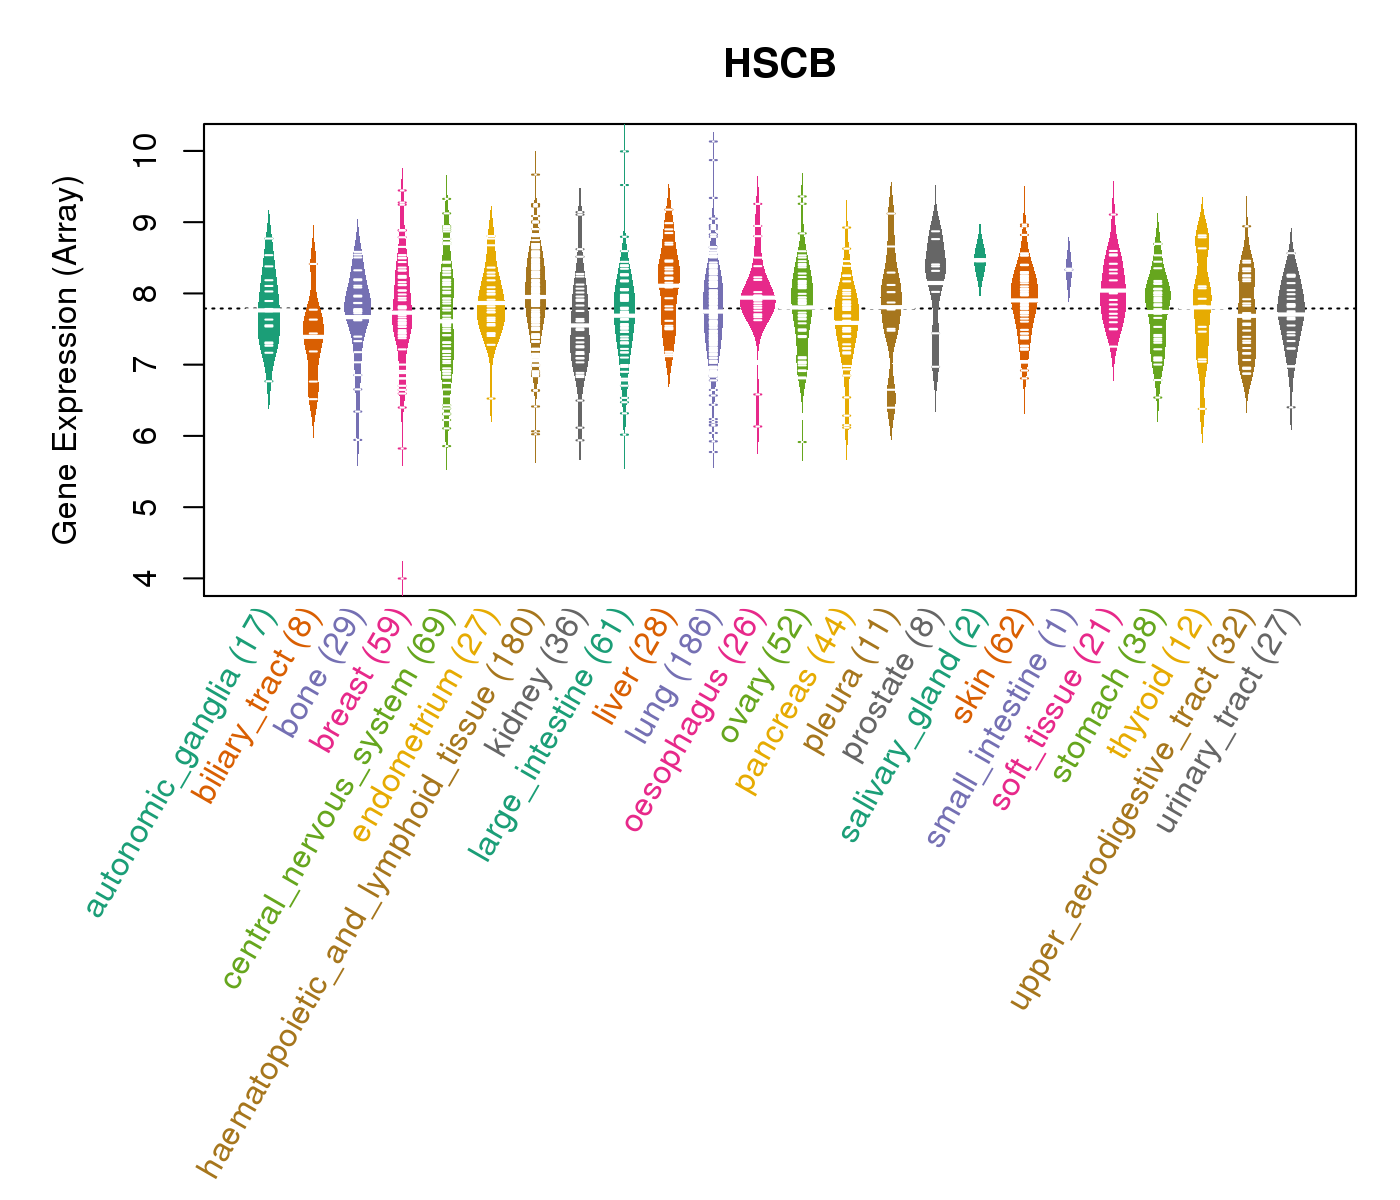
| Gene Expression for HSCB |
| * CCLE gene expression data were extracted from CCLE_Expression_Entrez_2012-10-18.res: Gene-centric RMA-normalized mRNA expression data. |
 |
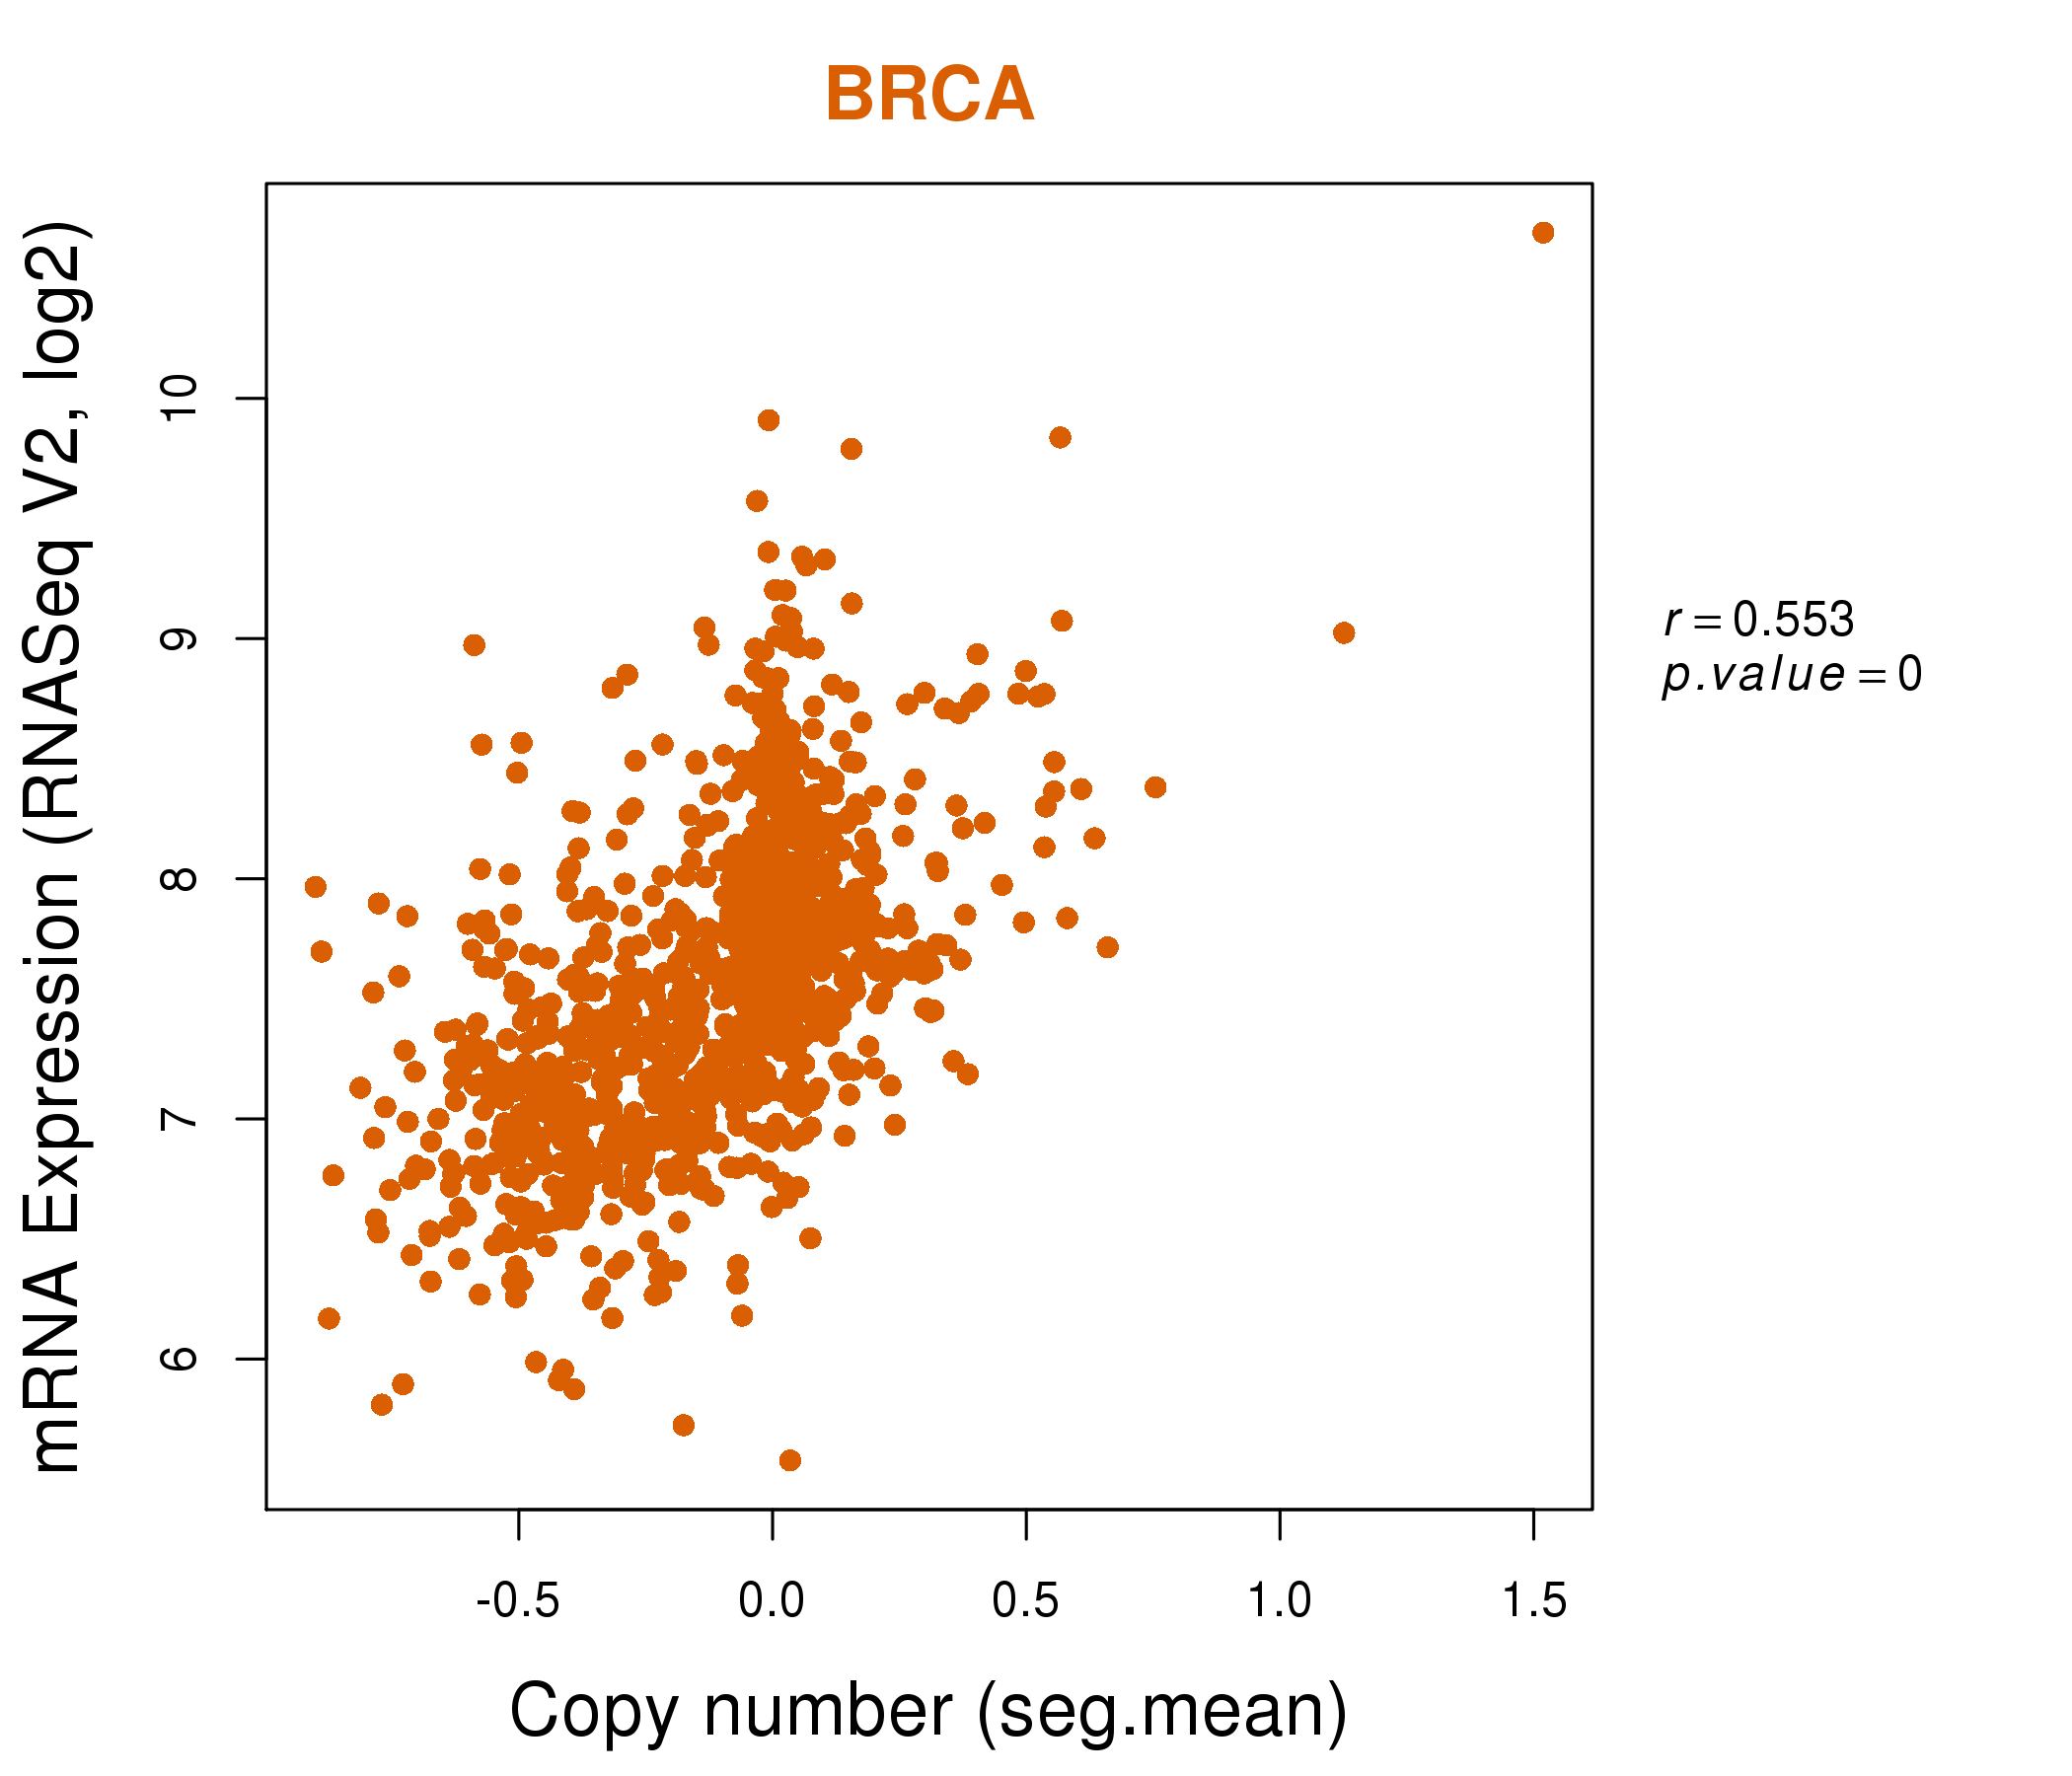
| * Normalized gene expression data of RNASeqV2 was extracted from TCGA using R package TCGA-Assembler. The URLs of all public data files on TCGA DCC data server were gathered at Jan-05-2015. Only eight cancer types have enough normal control samples for differential expression analysis. (t test, adjusted p<0.05 (using Benjamini-Hochberg FDR)) |
 |
| Top |
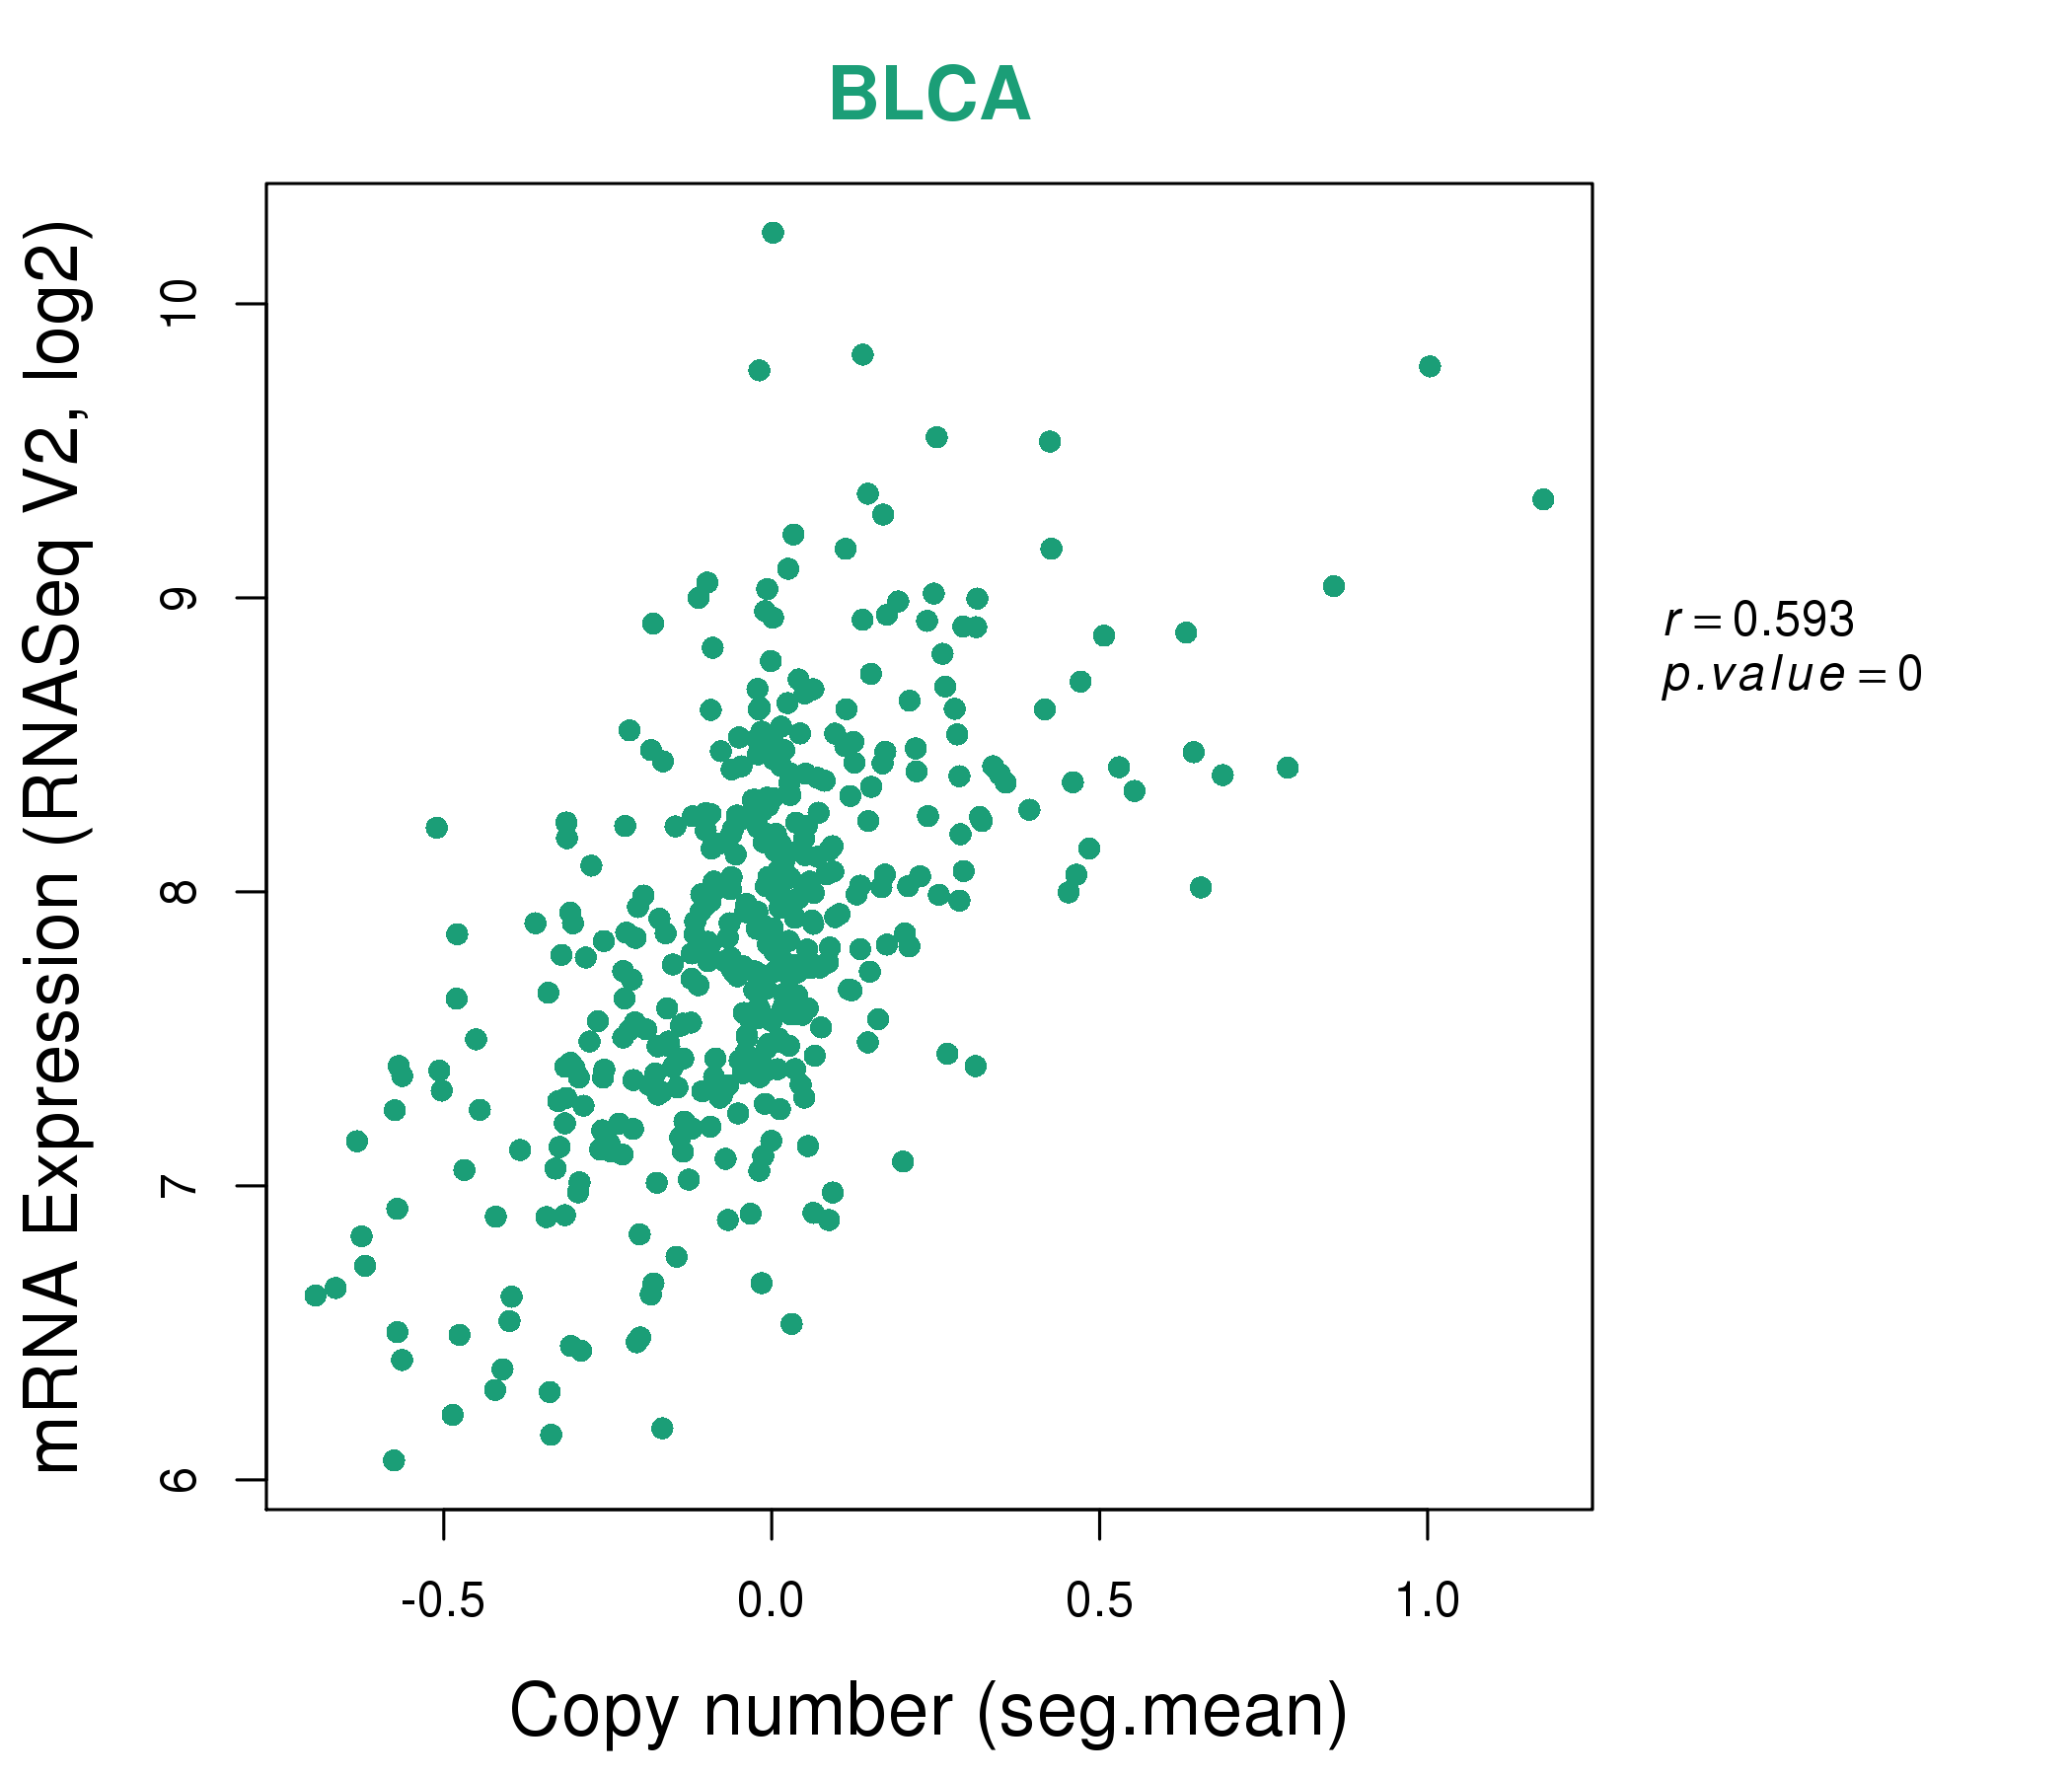
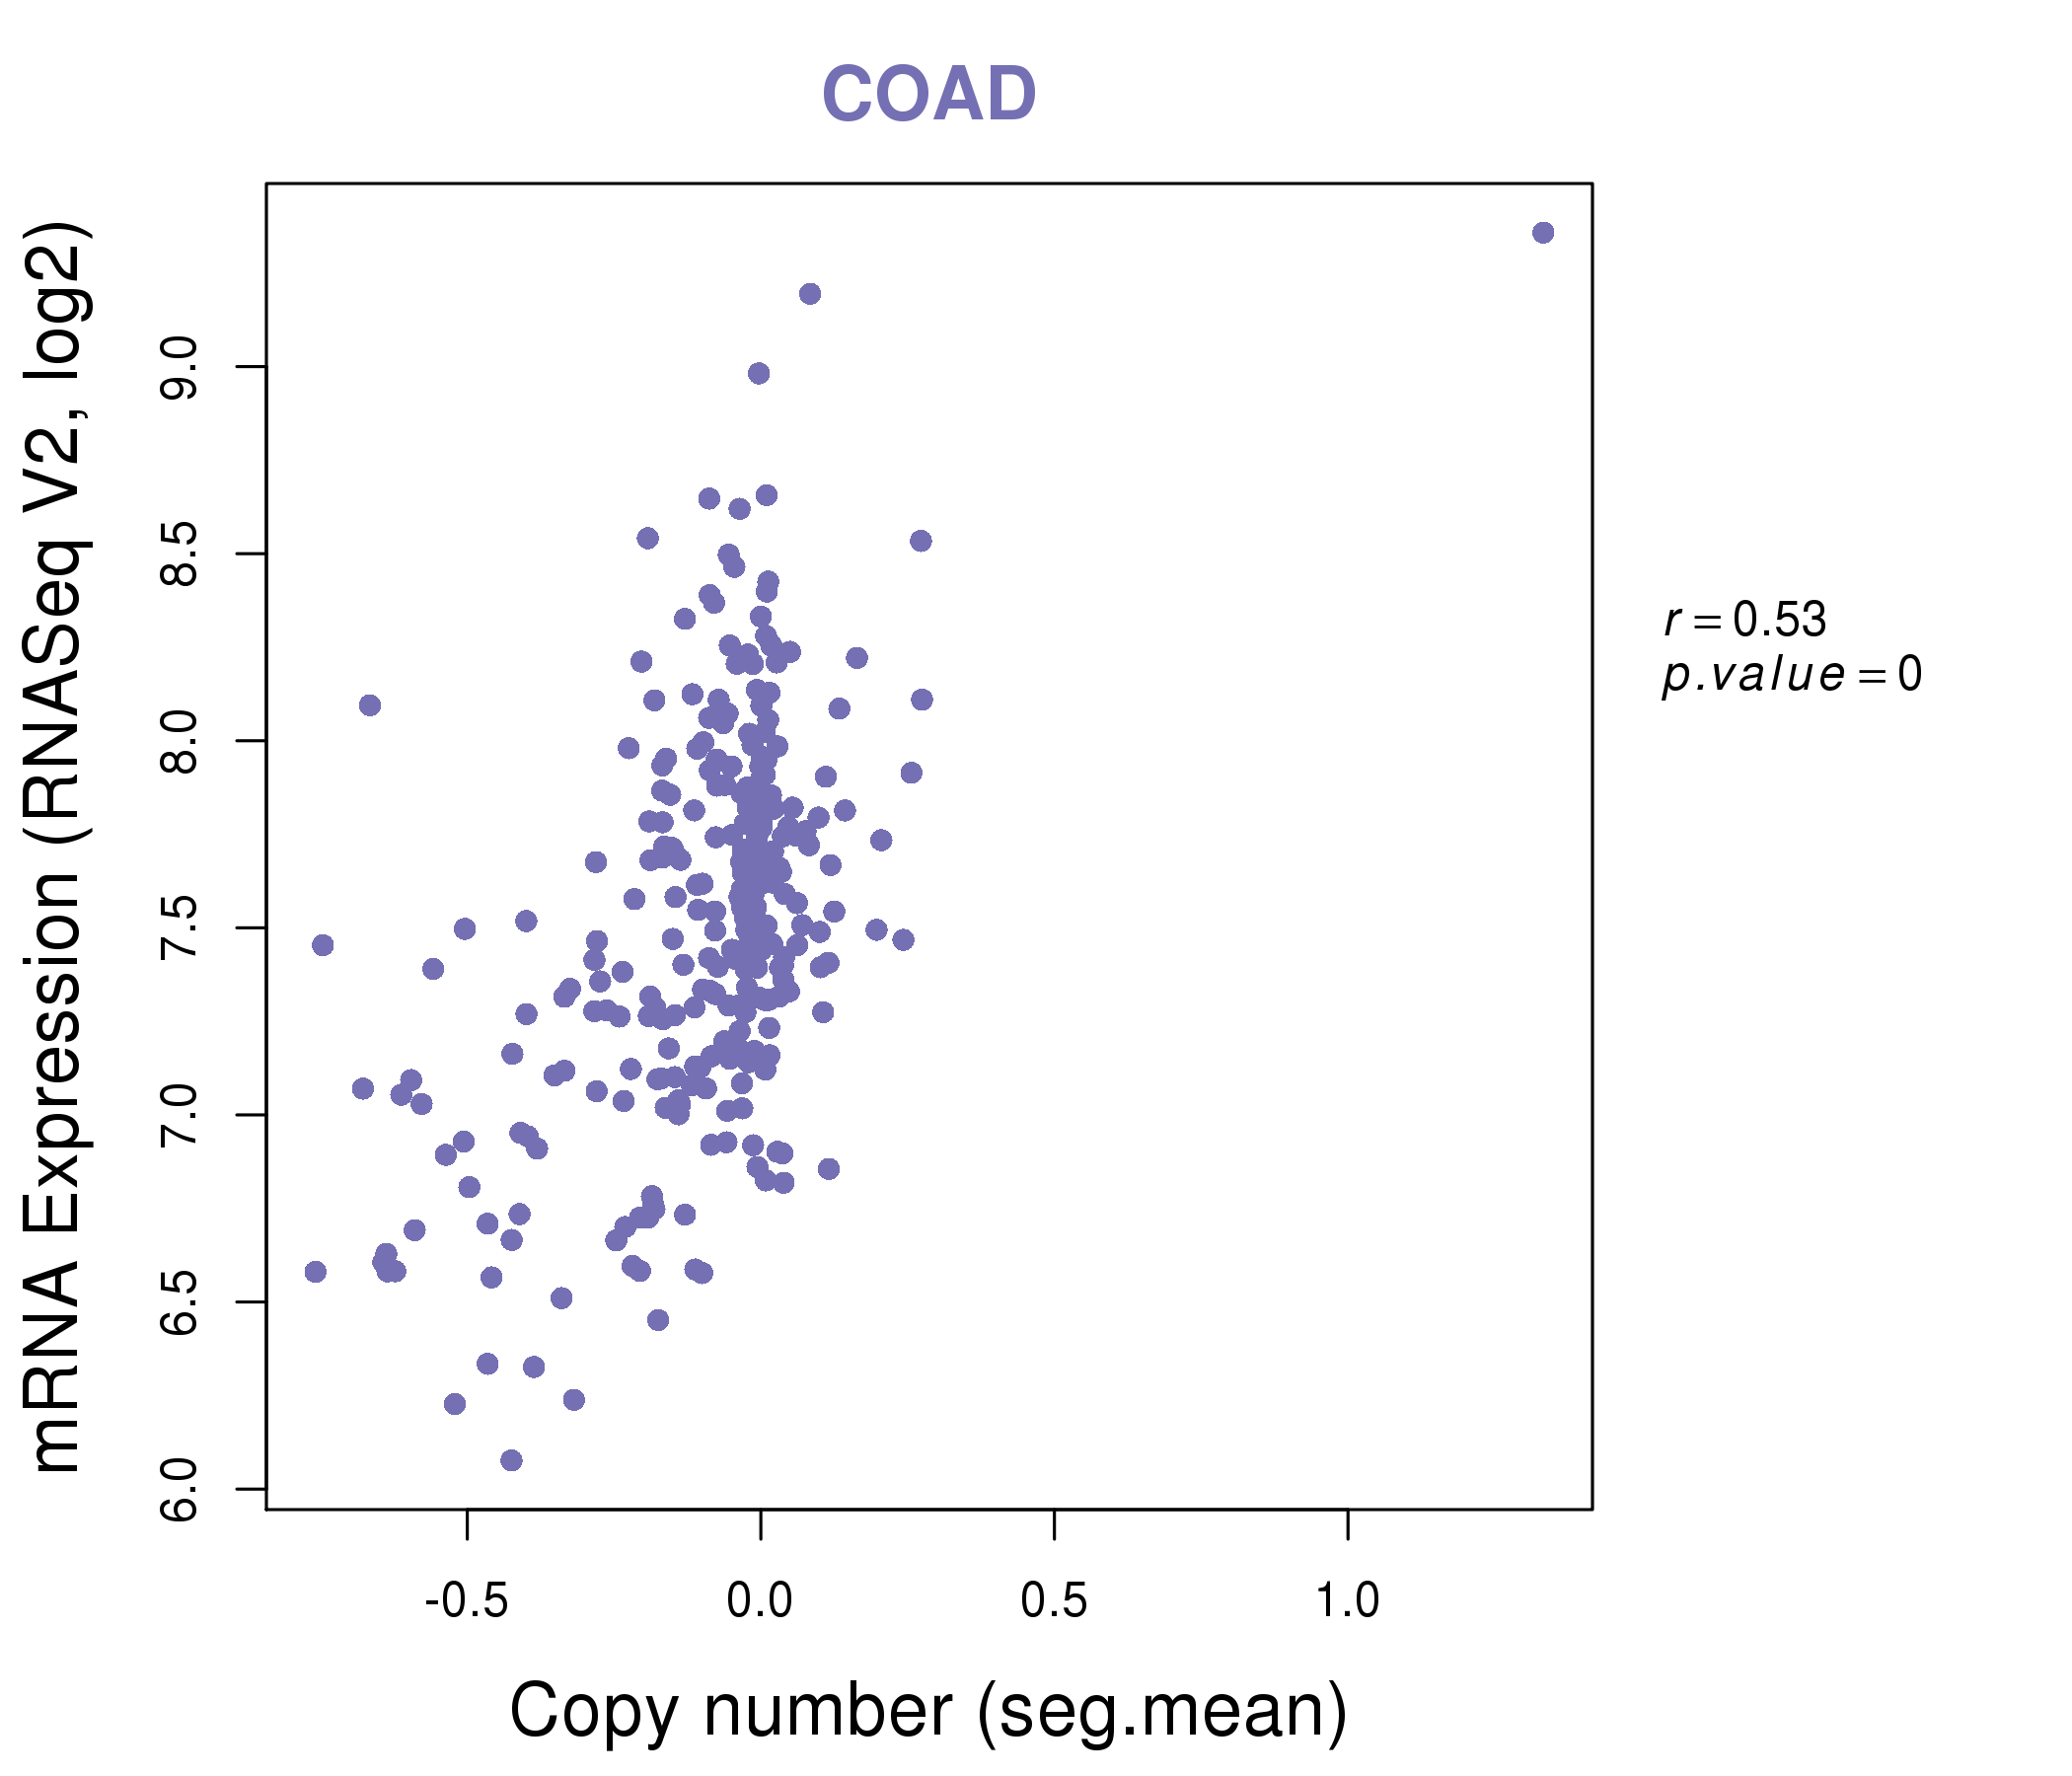
| * This plots show the correlation between CNV and gene expression. |
: Open all plots for all cancer types
 |
|
 |
|

| Top |
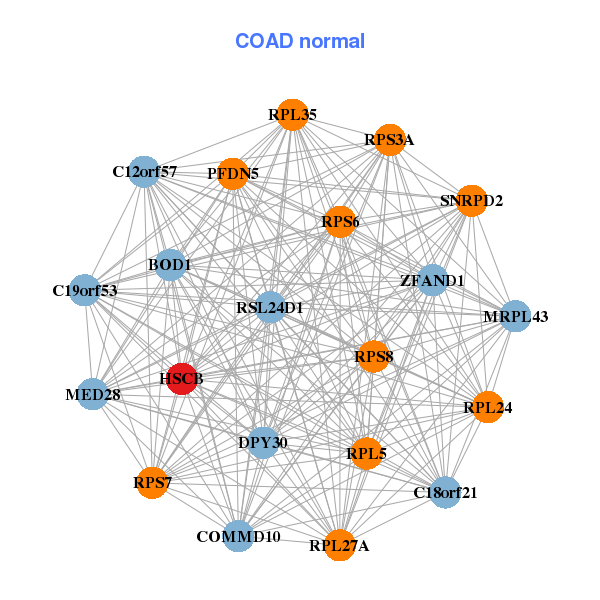
| Gene-Gene Network Information |
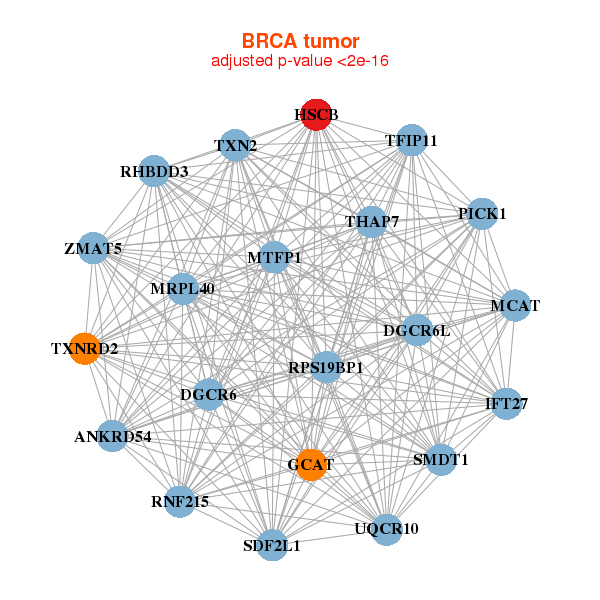
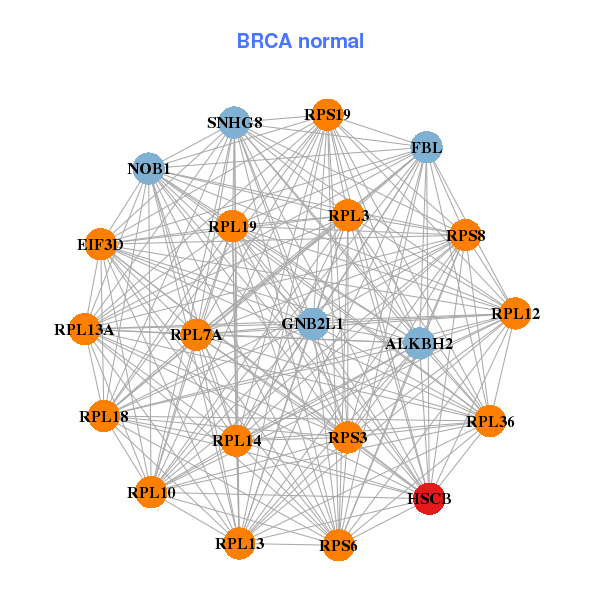
| * Co-Expression network figures were drawn using R package igraph. Only the top 20 genes with the highest correlations were shown. Red circle: input gene, orange circle: cell metabolism gene, sky circle: other gene |
: Open all plots for all cancer types
 |
|
| ANKRD54,SMDT1,DGCR6,DGCR6L,GCAT,HSCB,IFT27, MCAT,MRPL40,MTFP1,PICK1,RHBDD3,RNF215,RPS19BP1, SDF2L1,TFIP11,THAP7,TXN2,TXNRD2,UQCR10,ZMAT5 | ALKBH2,EIF3D,FBL,GNB2L1,HSCB,NOB1,RPL10, RPL12,RPL13,RPL13A,RPL14,RPL18,RPL19,RPL3, RPL36,RPL7A,RPS19,RPS3,RPS6,RPS8,SNHG8 |
 |
|
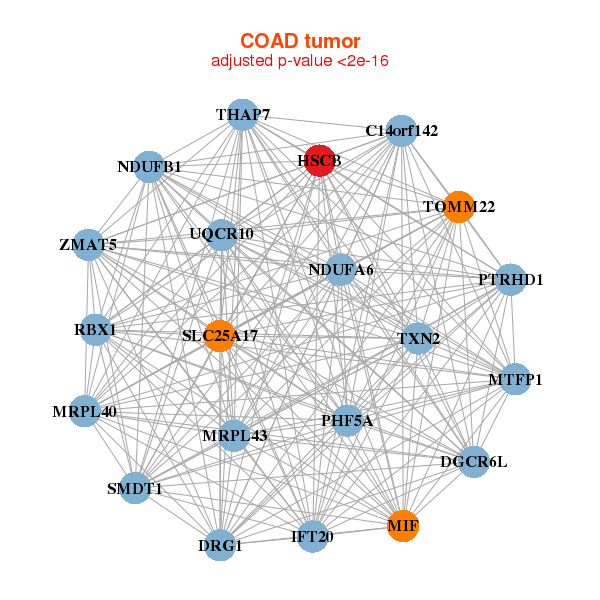
| C14orf142,SMDT1,PTRHD1,DGCR6L,DRG1,HSCB,IFT20, MIF,MRPL40,MRPL43,MTFP1,NDUFA6,NDUFB1,PHF5A, RBX1,SLC25A17,THAP7,TOMM22,TXN2,UQCR10,ZMAT5 | BOD1,C12orf57,C18orf21,C19orf53,COMMD10,DPY30,HSCB, MED28,MRPL43,PFDN5,RPL24,RPL27A,RPL35,RPL5, RPS3A,RPS6,RPS7,RPS8,RSL24D1,SNRPD2,ZFAND1 |
| * Co-Expression network figures were drawn using R package igraph. Only the top 20 genes with the highest correlations were shown. Red circle: input gene, orange circle: cell metabolism gene, sky circle: other gene |
: Open all plots for all cancer types
| Top |
: Open all interacting genes' information including KEGG pathway for all interacting genes from DAVID
| Top |
| Pharmacological Information for HSCB |
| There's no related Drug. |
| Top |
| Cross referenced IDs for HSCB |
| * We obtained these cross-references from Uniprot database. It covers 150 different DBs, 18 categories. http://www.uniprot.org/help/cross_references_section |
: Open all cross reference information
|
Copyright © 2016-Present - The Univsersity of Texas Health Science Center at Houston @ |