|
||||||||||||||||||||
| |
| Phenotypic Information (metabolism pathway, cancer, disease, phenome) |
| |
| |
| Gene-Gene Network Information: Co-Expression Network, Interacting Genes & KEGG |
| |
|


| Gene Summary for GPAT2 |
| Basic gene info. | Gene symbol | GPAT2 |
| Gene name | glycerol-3-phosphate acyltransferase 2, mitochondrial | |
| Synonyms | CT123 | |
| Cytomap | UCSC genome browser: 2q11.1 | |
| Genomic location | chr2 :96687693-96700727 | |
| Type of gene | protein-coding | |
| RefGenes | NM_207328.2, | |
| Ensembl id | ENSG00000186281 | |
| Description | GPAT-2cancer/testis antigen 123xGPAT1 | |
| Modification date | 20141207 | |
| dbXrefs | HGNC : HGNC | |
| Ensembl : ENSG00000186281 | ||
| HPRD : 14089 | ||
| Vega : OTTHUMG00000155208 | ||
| Protein | UniProt: go to UniProt's Cross Reference DB Table | |
| Expression | CleanEX: HS_GPAT2 | |
| BioGPS: 150763 | ||
| Gene Expression Atlas: ENSG00000186281 | ||
| The Human Protein Atlas: ENSG00000186281 | ||
| Pathway | NCI Pathway Interaction Database: GPAT2 | |
| KEGG: GPAT2 | ||
| REACTOME: GPAT2 | ||
| ConsensusPathDB | ||
| Pathway Commons: GPAT2 | ||
| Metabolism | MetaCyc: GPAT2 | |
| HUMANCyc: GPAT2 | ||
| Regulation | Ensembl's Regulation: ENSG00000186281 | |
| miRBase: chr2 :96,687,693-96,700,727 | ||
| TargetScan: NM_207328 | ||
| cisRED: ENSG00000186281 | ||
| Context | iHOP: GPAT2 | |
| cancer metabolism search in PubMed: GPAT2 | ||
| UCL Cancer Institute: GPAT2 | ||
| Assigned class in ccmGDB | C | |
| Top |
| Phenotypic Information for GPAT2(metabolism pathway, cancer, disease, phenome) |
| Cancer | CGAP: GPAT2 |
| Familial Cancer Database: GPAT2 | |
| * This gene is included in those cancer gene databases. |
|
|
|
|
|
|
| ||||||||||||||
Oncogene 1 | Significant driver gene in | |||||||||||||||||||
| cf) number; DB name 1 Oncogene; http://nar.oxfordjournals.org/content/35/suppl_1/D721.long, 2 Tumor Suppressor gene; https://bioinfo.uth.edu/TSGene/, 3 Cancer Gene Census; http://www.nature.com/nrc/journal/v4/n3/abs/nrc1299.html, 4 CancerGenes; http://nar.oxfordjournals.org/content/35/suppl_1/D721.long, 5 Network of Cancer Gene; http://ncg.kcl.ac.uk/index.php, 1Therapeutic Vulnerabilities in Cancer; http://cbio.mskcc.org/cancergenomics/statius/ |
| KEGG_GLYCEROLIPID_METABOLISM KEGG_GLYCEROPHOSPHOLIPID_METABOLISM REACTOME_PHOSPHOLIPID_METABOLISM REACTOME_METABOLISM_OF_LIPIDS_AND_LIPOPROTEINS | |
| OMIM | |
| Orphanet | |
| Disease | KEGG Disease: GPAT2 |
| MedGen: GPAT2 (Human Medical Genetics with Condition) | |
| ClinVar: GPAT2 | |
| Phenotype | MGI: GPAT2 (International Mouse Phenotyping Consortium) |
| PhenomicDB: GPAT2 | |
| Mutations for GPAT2 |
| * Under tables are showing count per each tissue to give us broad intuition about tissue specific mutation patterns.You can go to the detailed page for each mutation database's web site. |
| There's no structural variation information in COSMIC data for this gene. |
| * From mRNA Sanger sequences, Chitars2.0 arranged chimeric transcripts. This table shows GPAT2 related fusion information. |
| ID | Head Gene | Tail Gene | Accession | Gene_a | qStart_a | qEnd_a | Chromosome_a | tStart_a | tEnd_a | Gene_a | qStart_a | qEnd_a | Chromosome_a | tStart_a | tEnd_a |
| Top |
| There's no copy number variation information in COSMIC data for this gene. |
| Top |
|
 |
| Top |
| Stat. for Non-Synonymous SNVs (# total SNVs=38) | (# total SNVs=15) |
 |  |
(# total SNVs=2) | (# total SNVs=0) |
 |
| Top |
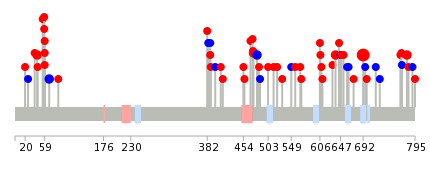
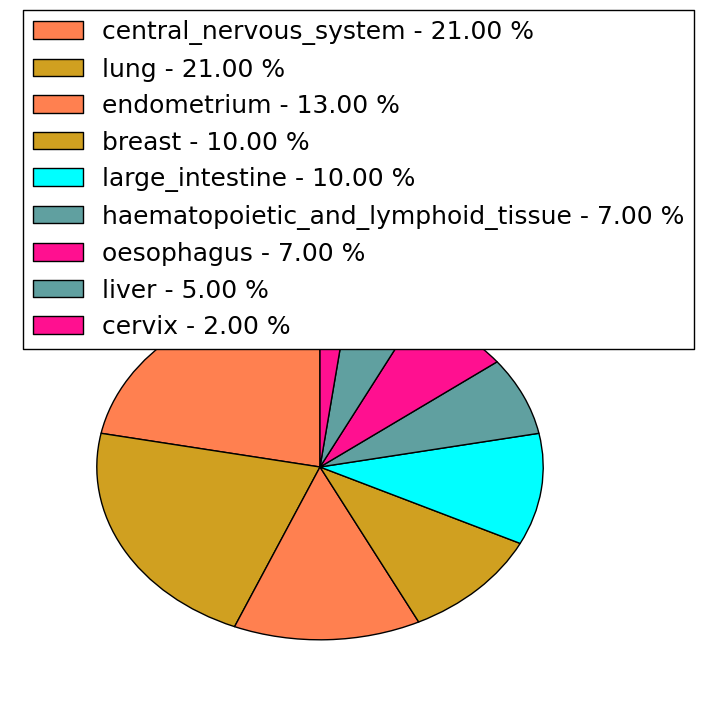
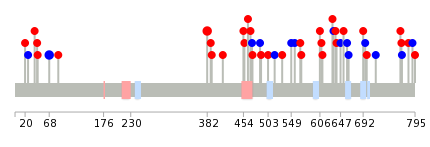
| * When you move the cursor on each content, you can see more deailed mutation information on the Tooltip. Those are primary_site,primary_histology,mutation(aa),pubmedID. |
| GRCh37 position | Mutation(aa) | Unique sampleID count |
| chr2:96688929-96688929 | p.R692C | 11 |
| chr2:96687959-96687959 | p.L779Q | 2 |
| chr2:96690401-96690401 | p.F481F | 2 |
| chr2:96690528-96690528 | p.H474R | 2 |
| chr2:96697827-96697827 | p.R44H | 2 |
| chr2:96696530-96696530 | p.C107fs*35 | 2 |
| chr2:96689176-96689176 | p.R637W | 2 |
| chr2:96697056-96697056 | p.T68T | 2 |
| chr2:96697782-96697782 | p.W59L | 1 |
| chr2:96689742-96689742 | p.Q609K | 1 |
| Top |
|
 |
| Point Mutation/ Tissue ID | 1 | 2 | 3 | 4 | 5 | 6 | 7 | 8 | 9 | 10 | 11 | 12 | 13 | 14 | 15 | 16 | 17 | 18 | 19 | 20 |
| # sample | 4 | 2 | 1 | 4 | 1 | 4 | 2 | 4 | 2 | 6 | 3 | 1 | 10 | |||||||
| # mutation | 4 | 2 | 1 | 4 | 1 | 5 | 1 | 5 | 2 | 6 | 3 | 1 | 12 | |||||||
| nonsynonymous SNV | 4 | 1 | 4 | 1 | 2 | 4 | 2 | 6 | 2 | 1 | 5 | |||||||||
| synonymous SNV | 2 | 3 | 1 | 1 | 1 | 7 |
| cf) Tissue ID; Tissue type (1; BLCA[Bladder Urothelial Carcinoma], 2; BRCA[Breast invasive carcinoma], 3; CESC[Cervical squamous cell carcinoma and endocervical adenocarcinoma], 4; COAD[Colon adenocarcinoma], 5; GBM[Glioblastoma multiforme], 6; Glioma Low Grade, 7; HNSC[Head and Neck squamous cell carcinoma], 8; KICH[Kidney Chromophobe], 9; KIRC[Kidney renal clear cell carcinoma], 10; KIRP[Kidney renal papillary cell carcinoma], 11; LAML[Acute Myeloid Leukemia], 12; LUAD[Lung adenocarcinoma], 13; LUSC[Lung squamous cell carcinoma], 14; OV[Ovarian serous cystadenocarcinoma ], 15; PAAD[Pancreatic adenocarcinoma], 16; PRAD[Prostate adenocarcinoma], 17; SKCM[Skin Cutaneous Melanoma], 18:STAD[Stomach adenocarcinoma], 19:THCA[Thyroid carcinoma], 20:UCEC[Uterine Corpus Endometrial Carcinoma]) |
| Top |
| * We represented just top 10 SNVs. When you move the cursor on each content, you can see more deailed mutation information on the Tooltip. Those are primary_site, primary_histology, mutation(aa), pubmedID. |
| Genomic Position | Mutation(aa) | Unique sampleID count |
| chr2:96691942 | p.F382L | 2 |
| chr2:96697056 | p.T68T | 2 |
| chr2:96690055 | p.L471L | 1 |
| chr2:96687925 | p.R637W | 1 |
| chr2:96690561 | p.T468M | 1 |
| chr2:96697841 | p.S795I | 1 |
| chr2:96689126 | p.T633T | 1 |
| chr2:96690176 | p.T463K | 1 |
| chr2:96687951 | p.R790R | 1 |
| chr2:96690582 | p.E631Q | 1 |
| * Copy number data were extracted from TCGA using R package TCGA-Assembler. The URLs of all public data files on TCGA DCC data server were gathered on Jan-05-2015. Function ProcessCNAData in TCGA-Assembler package was used to obtain gene-level copy number value which is calculated as the average copy number of the genomic region of a gene. |
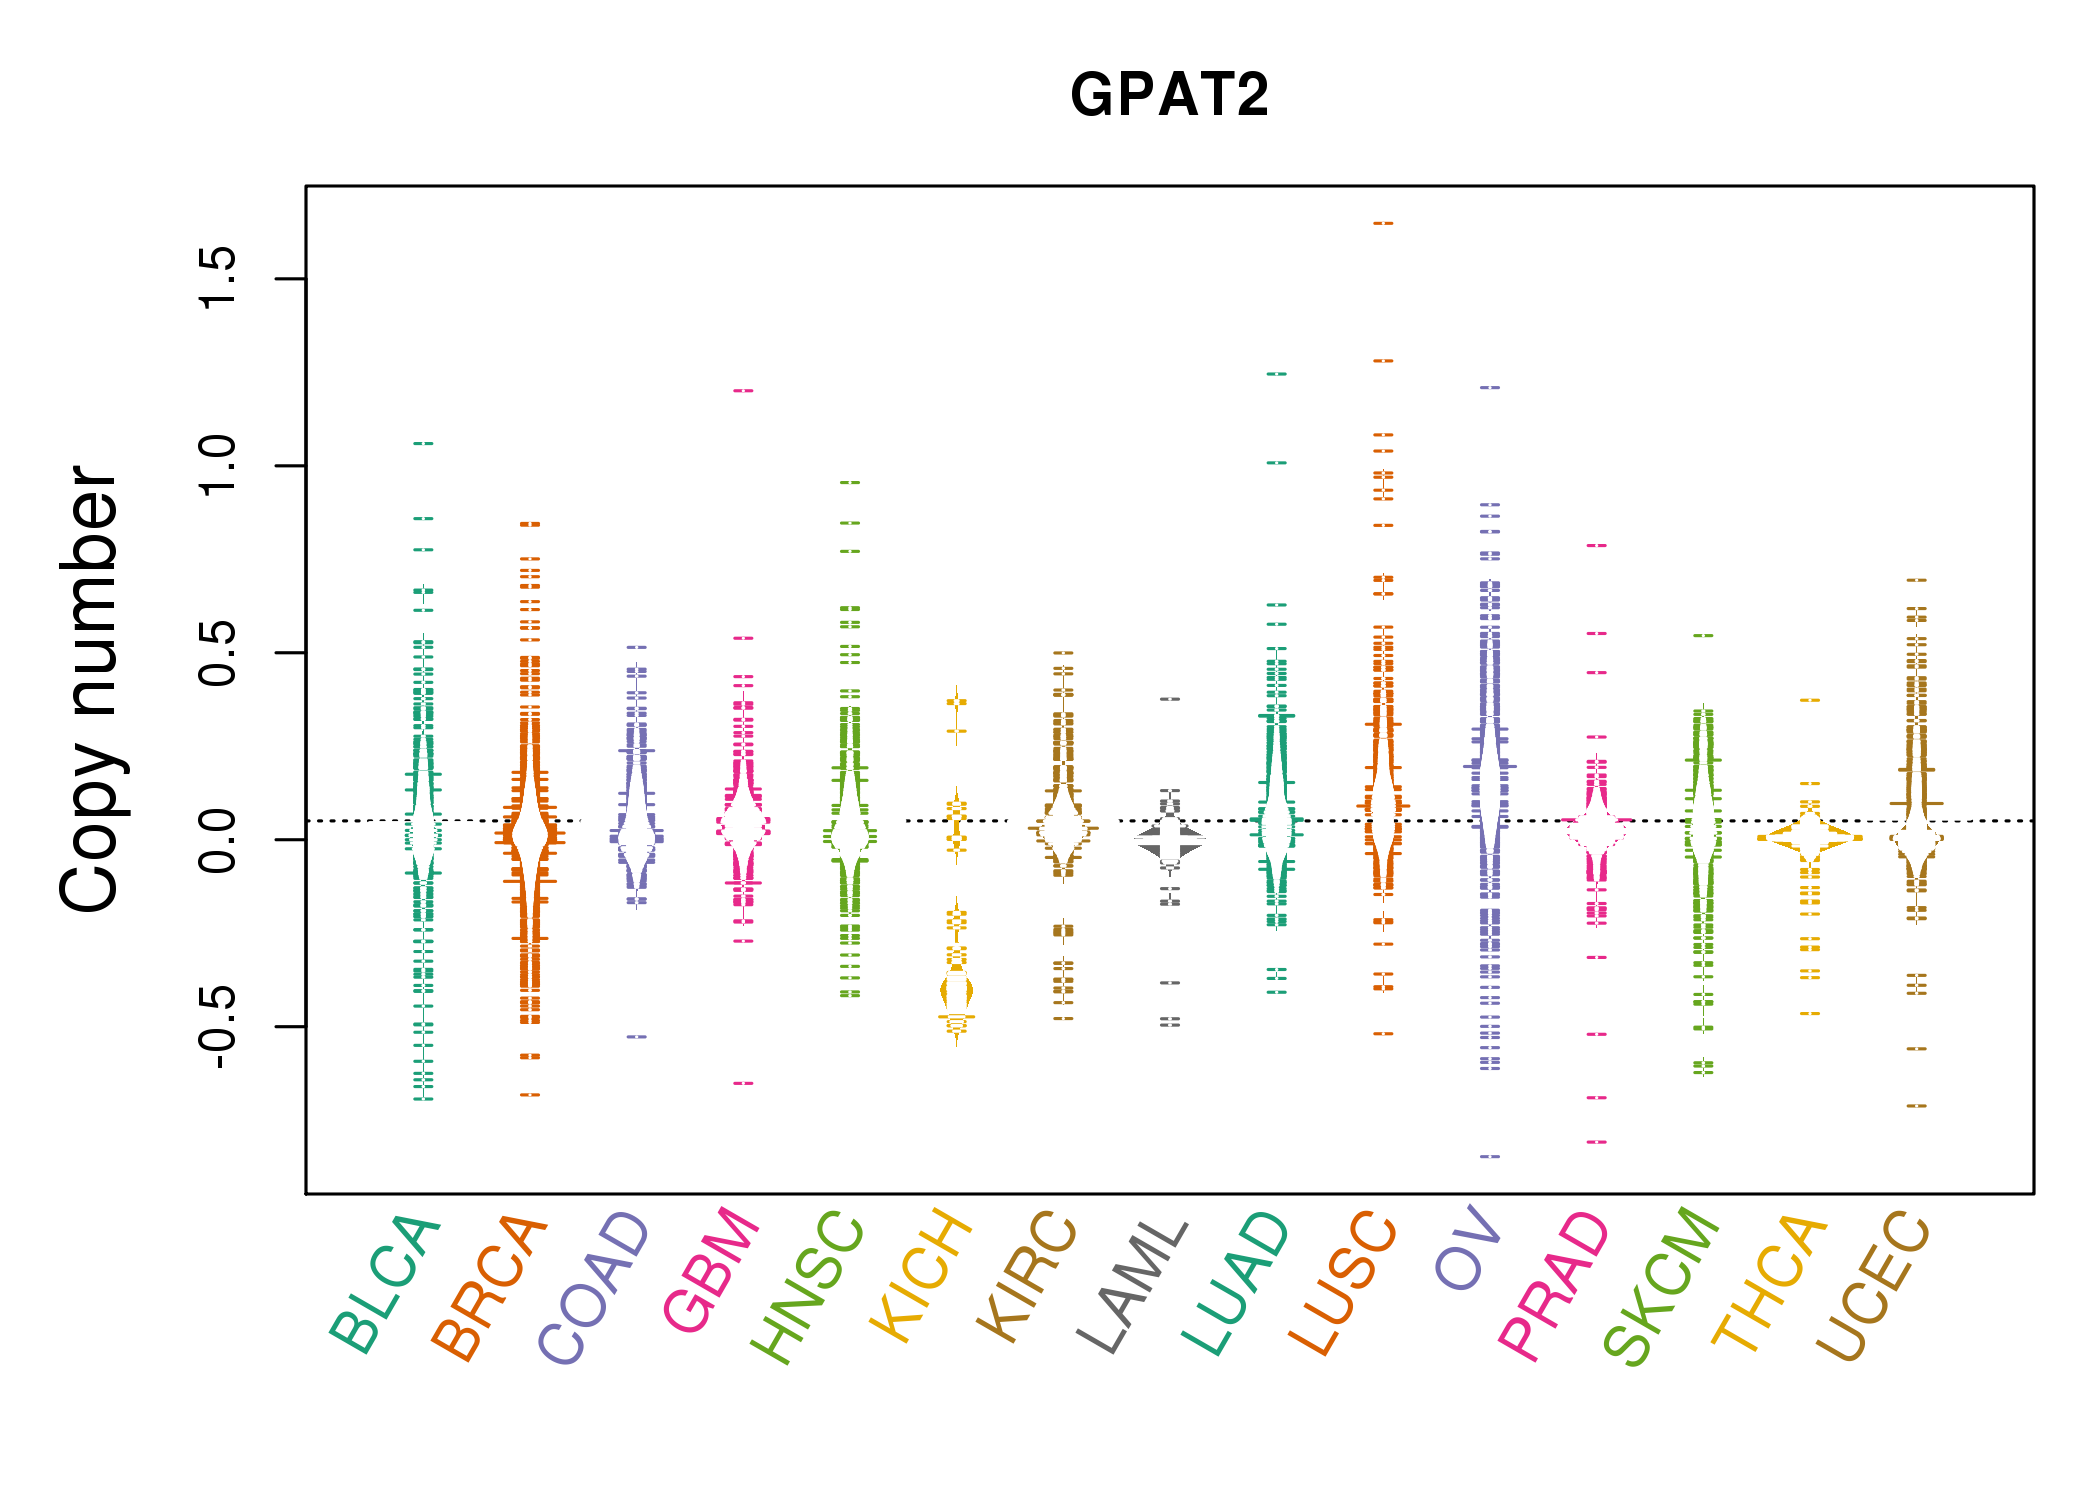 |
| cf) Tissue ID[Tissue type]: BLCA[Bladder Urothelial Carcinoma], BRCA[Breast invasive carcinoma], CESC[Cervical squamous cell carcinoma and endocervical adenocarcinoma], COAD[Colon adenocarcinoma], GBM[Glioblastoma multiforme], Glioma Low Grade, HNSC[Head and Neck squamous cell carcinoma], KICH[Kidney Chromophobe], KIRC[Kidney renal clear cell carcinoma], KIRP[Kidney renal papillary cell carcinoma], LAML[Acute Myeloid Leukemia], LUAD[Lung adenocarcinoma], LUSC[Lung squamous cell carcinoma], OV[Ovarian serous cystadenocarcinoma ], PAAD[Pancreatic adenocarcinoma], PRAD[Prostate adenocarcinoma], SKCM[Skin Cutaneous Melanoma], STAD[Stomach adenocarcinoma], THCA[Thyroid carcinoma], UCEC[Uterine Corpus Endometrial Carcinoma] |
| Top |
| Gene Expression for GPAT2 |
| * CCLE gene expression data were extracted from CCLE_Expression_Entrez_2012-10-18.res: Gene-centric RMA-normalized mRNA expression data. |
 |
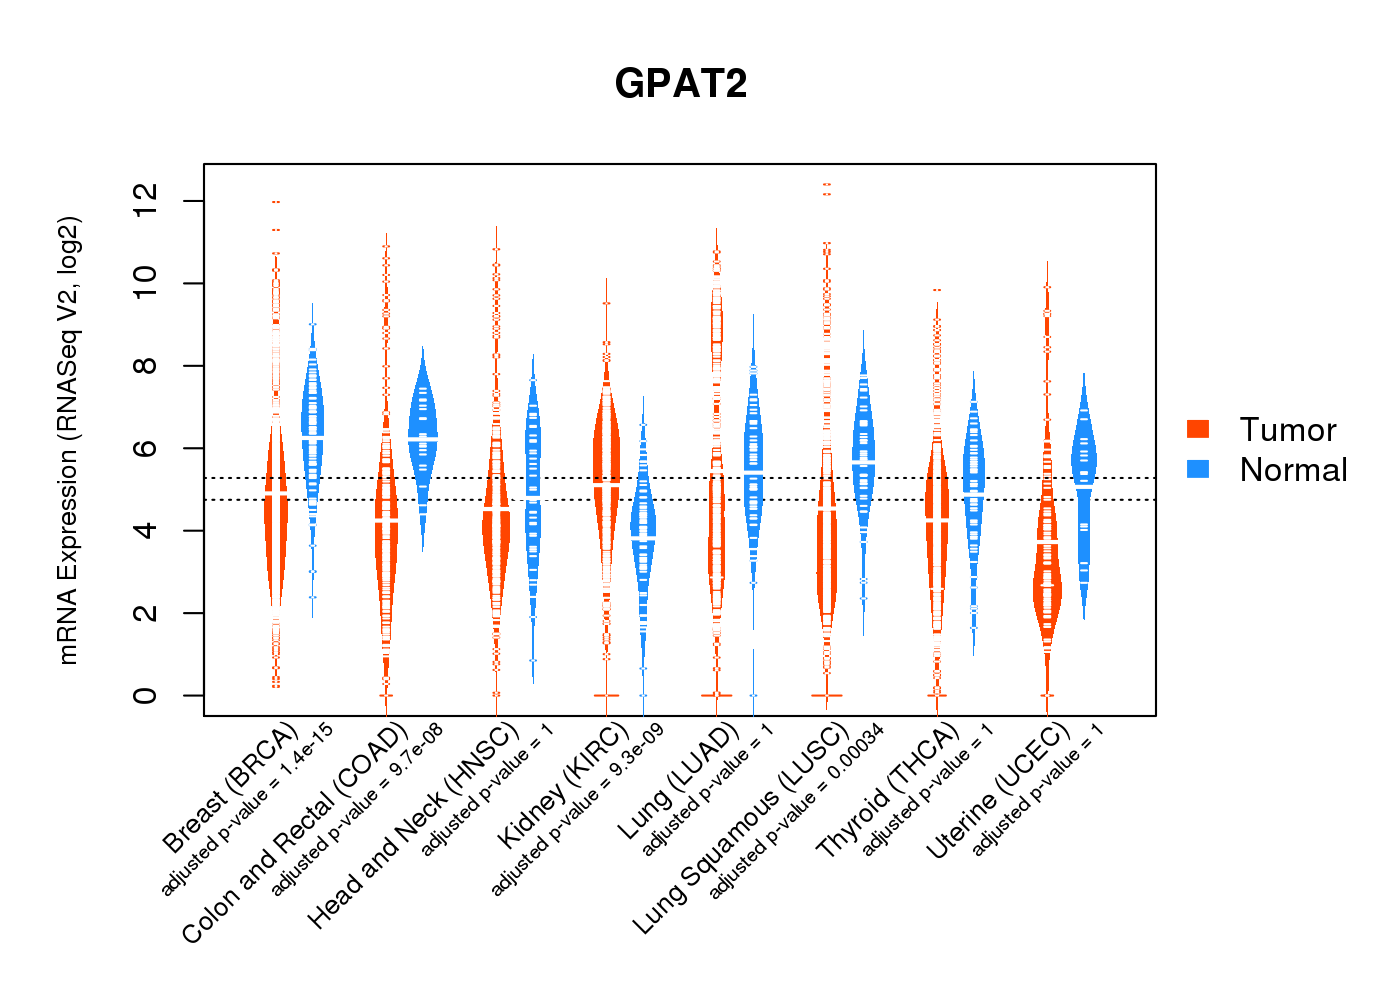
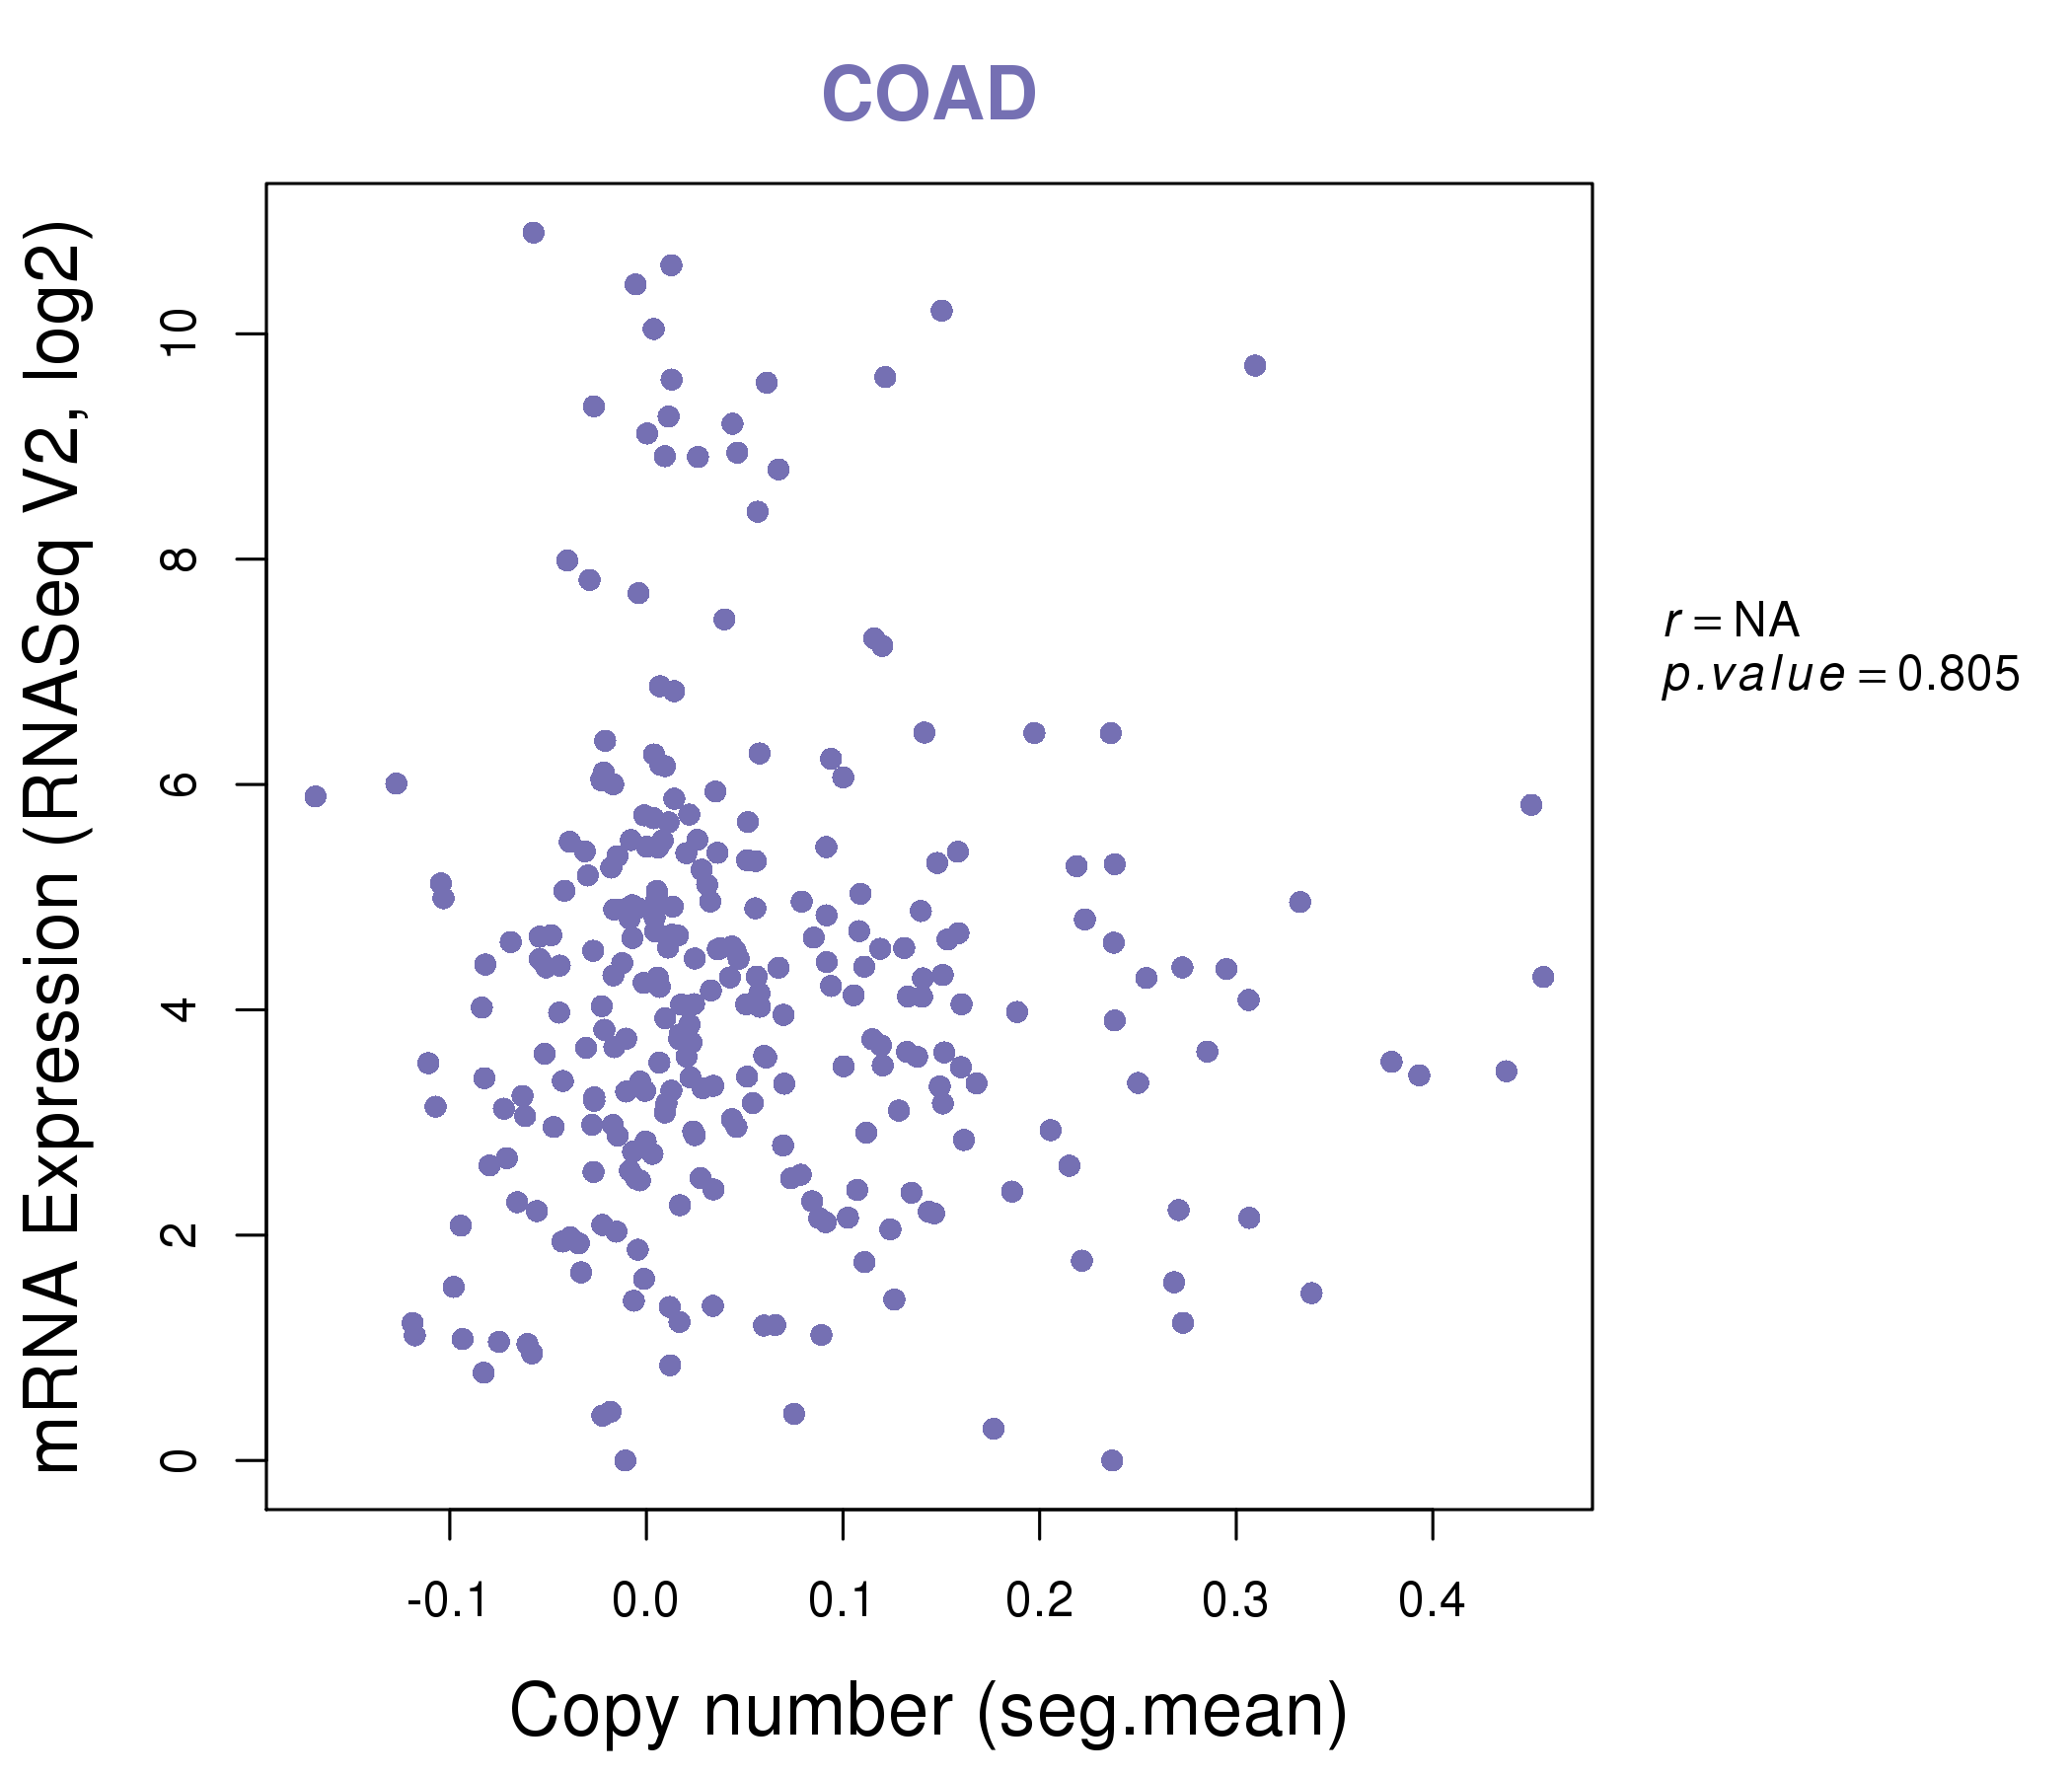
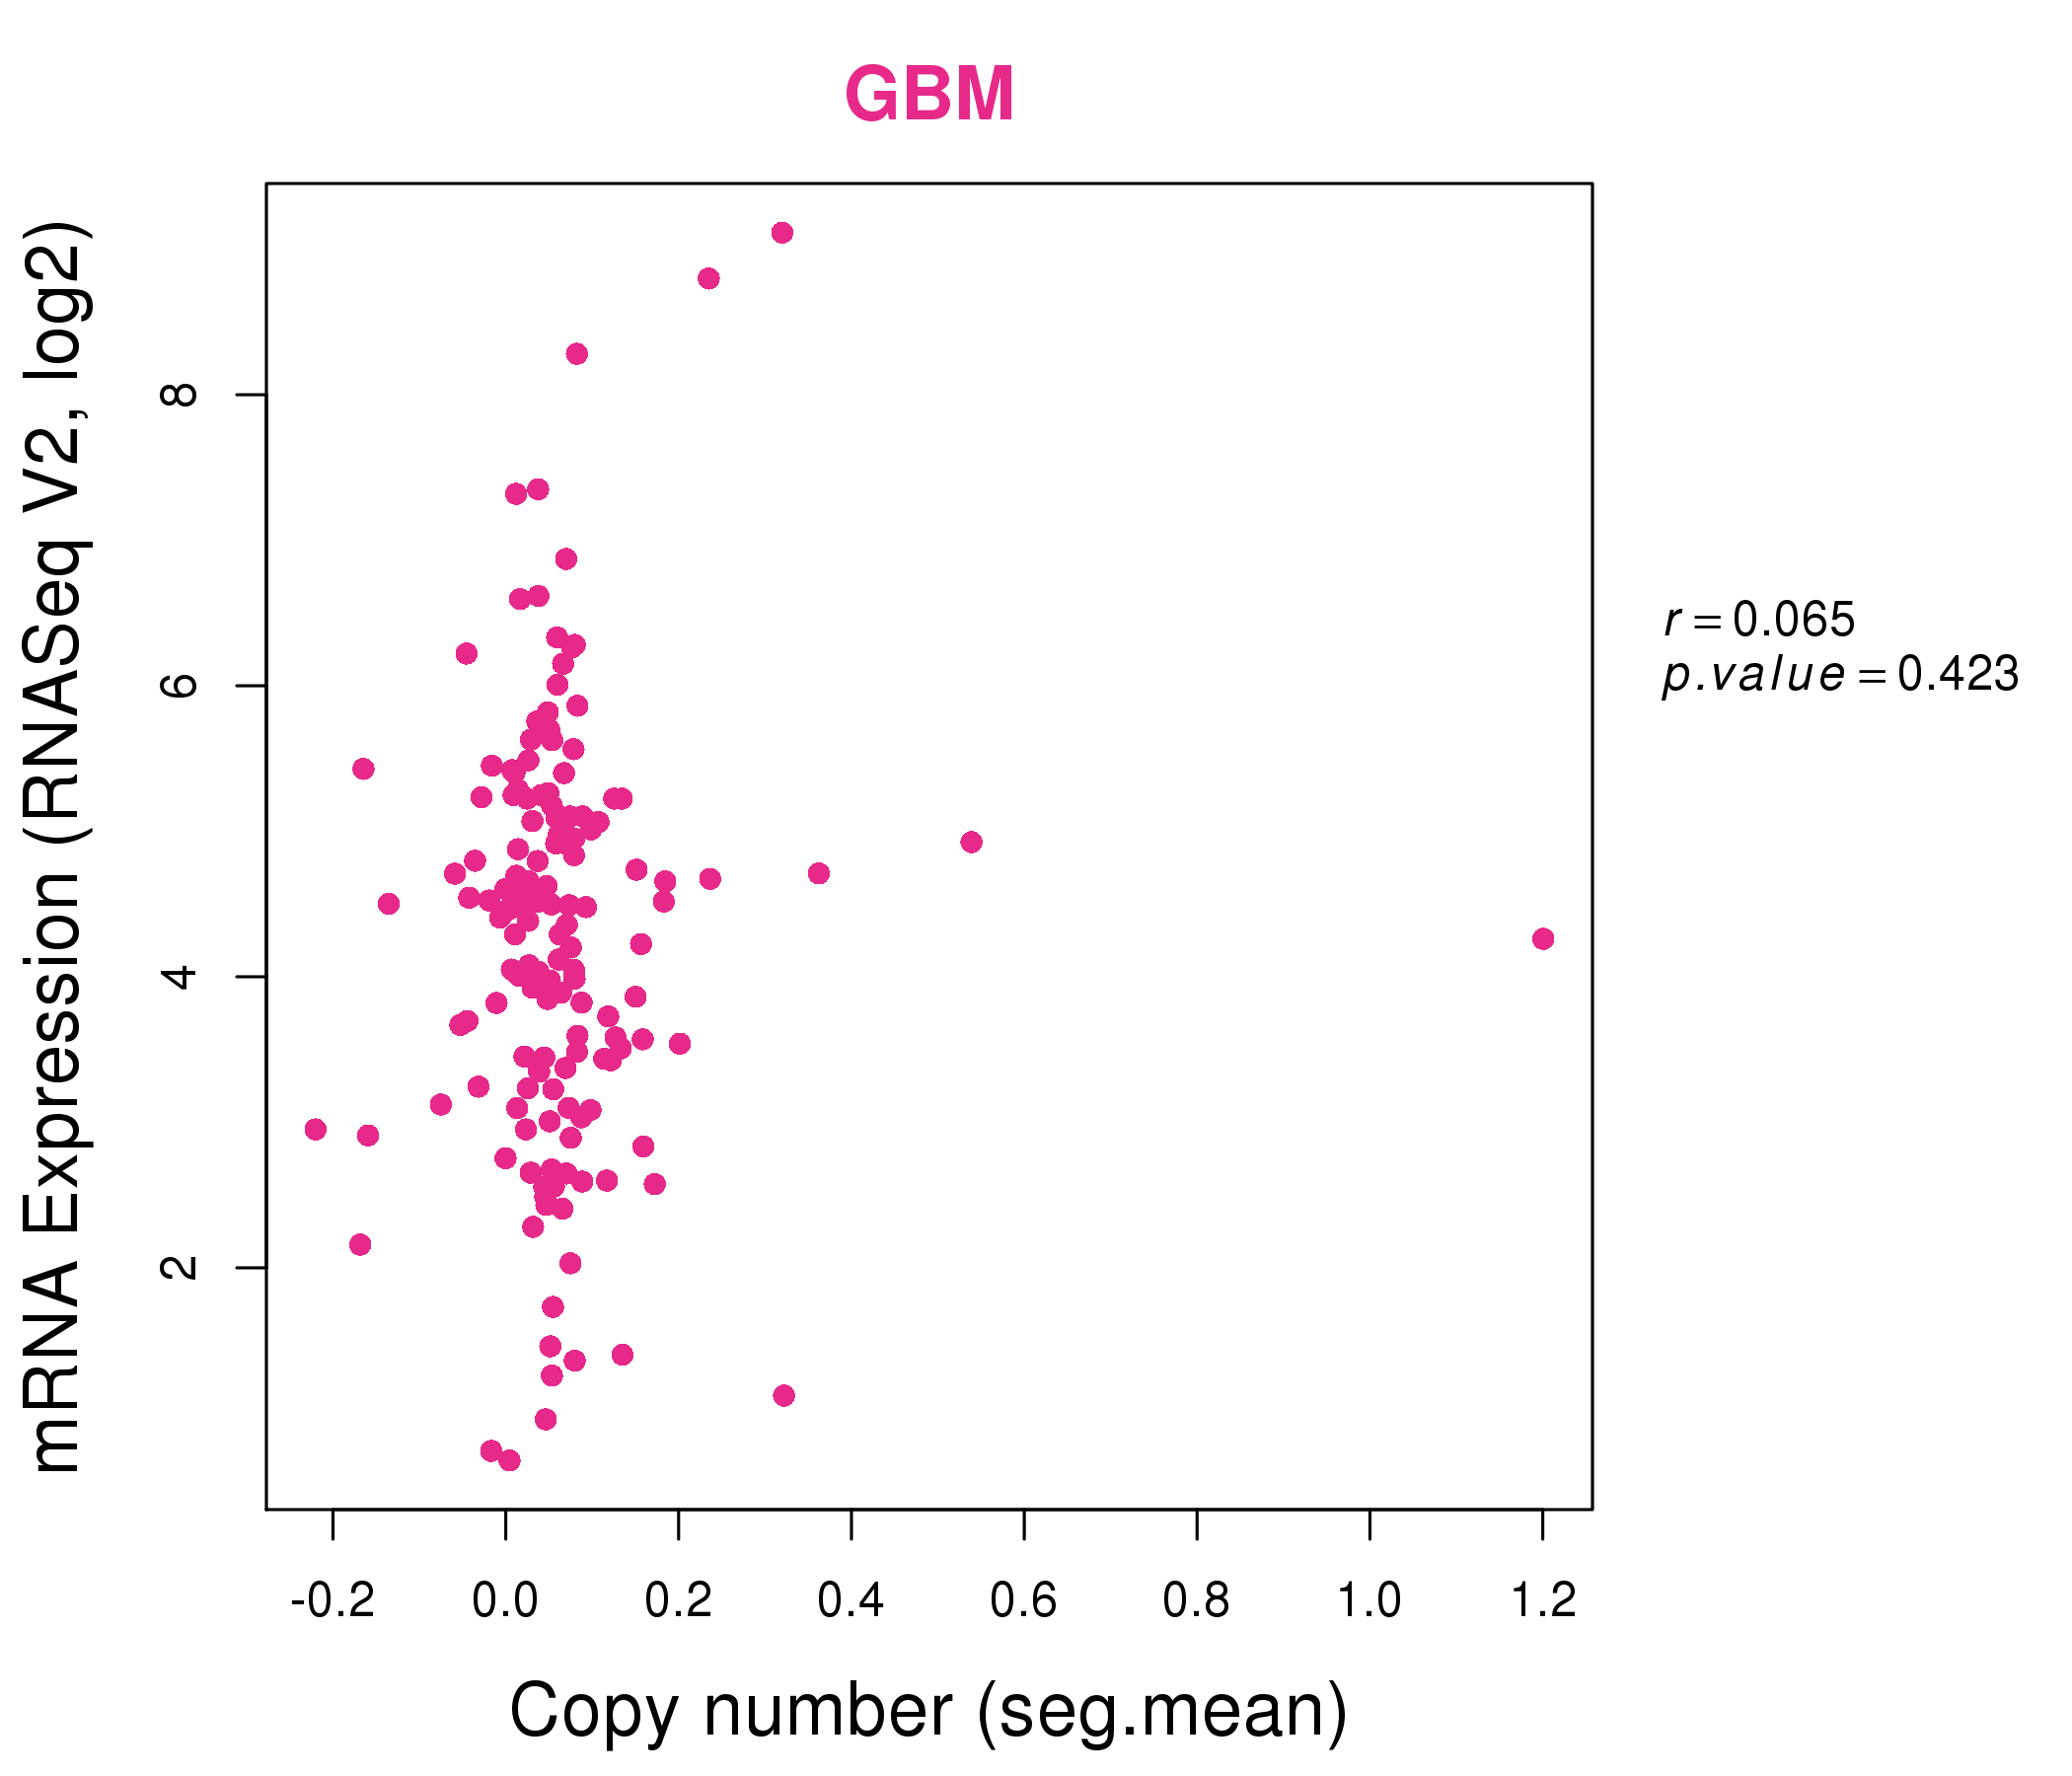
| * Normalized gene expression data of RNASeqV2 was extracted from TCGA using R package TCGA-Assembler. The URLs of all public data files on TCGA DCC data server were gathered at Jan-05-2015. Only eight cancer types have enough normal control samples for differential expression analysis. (t test, adjusted p<0.05 (using Benjamini-Hochberg FDR)) |
 |
| Top |
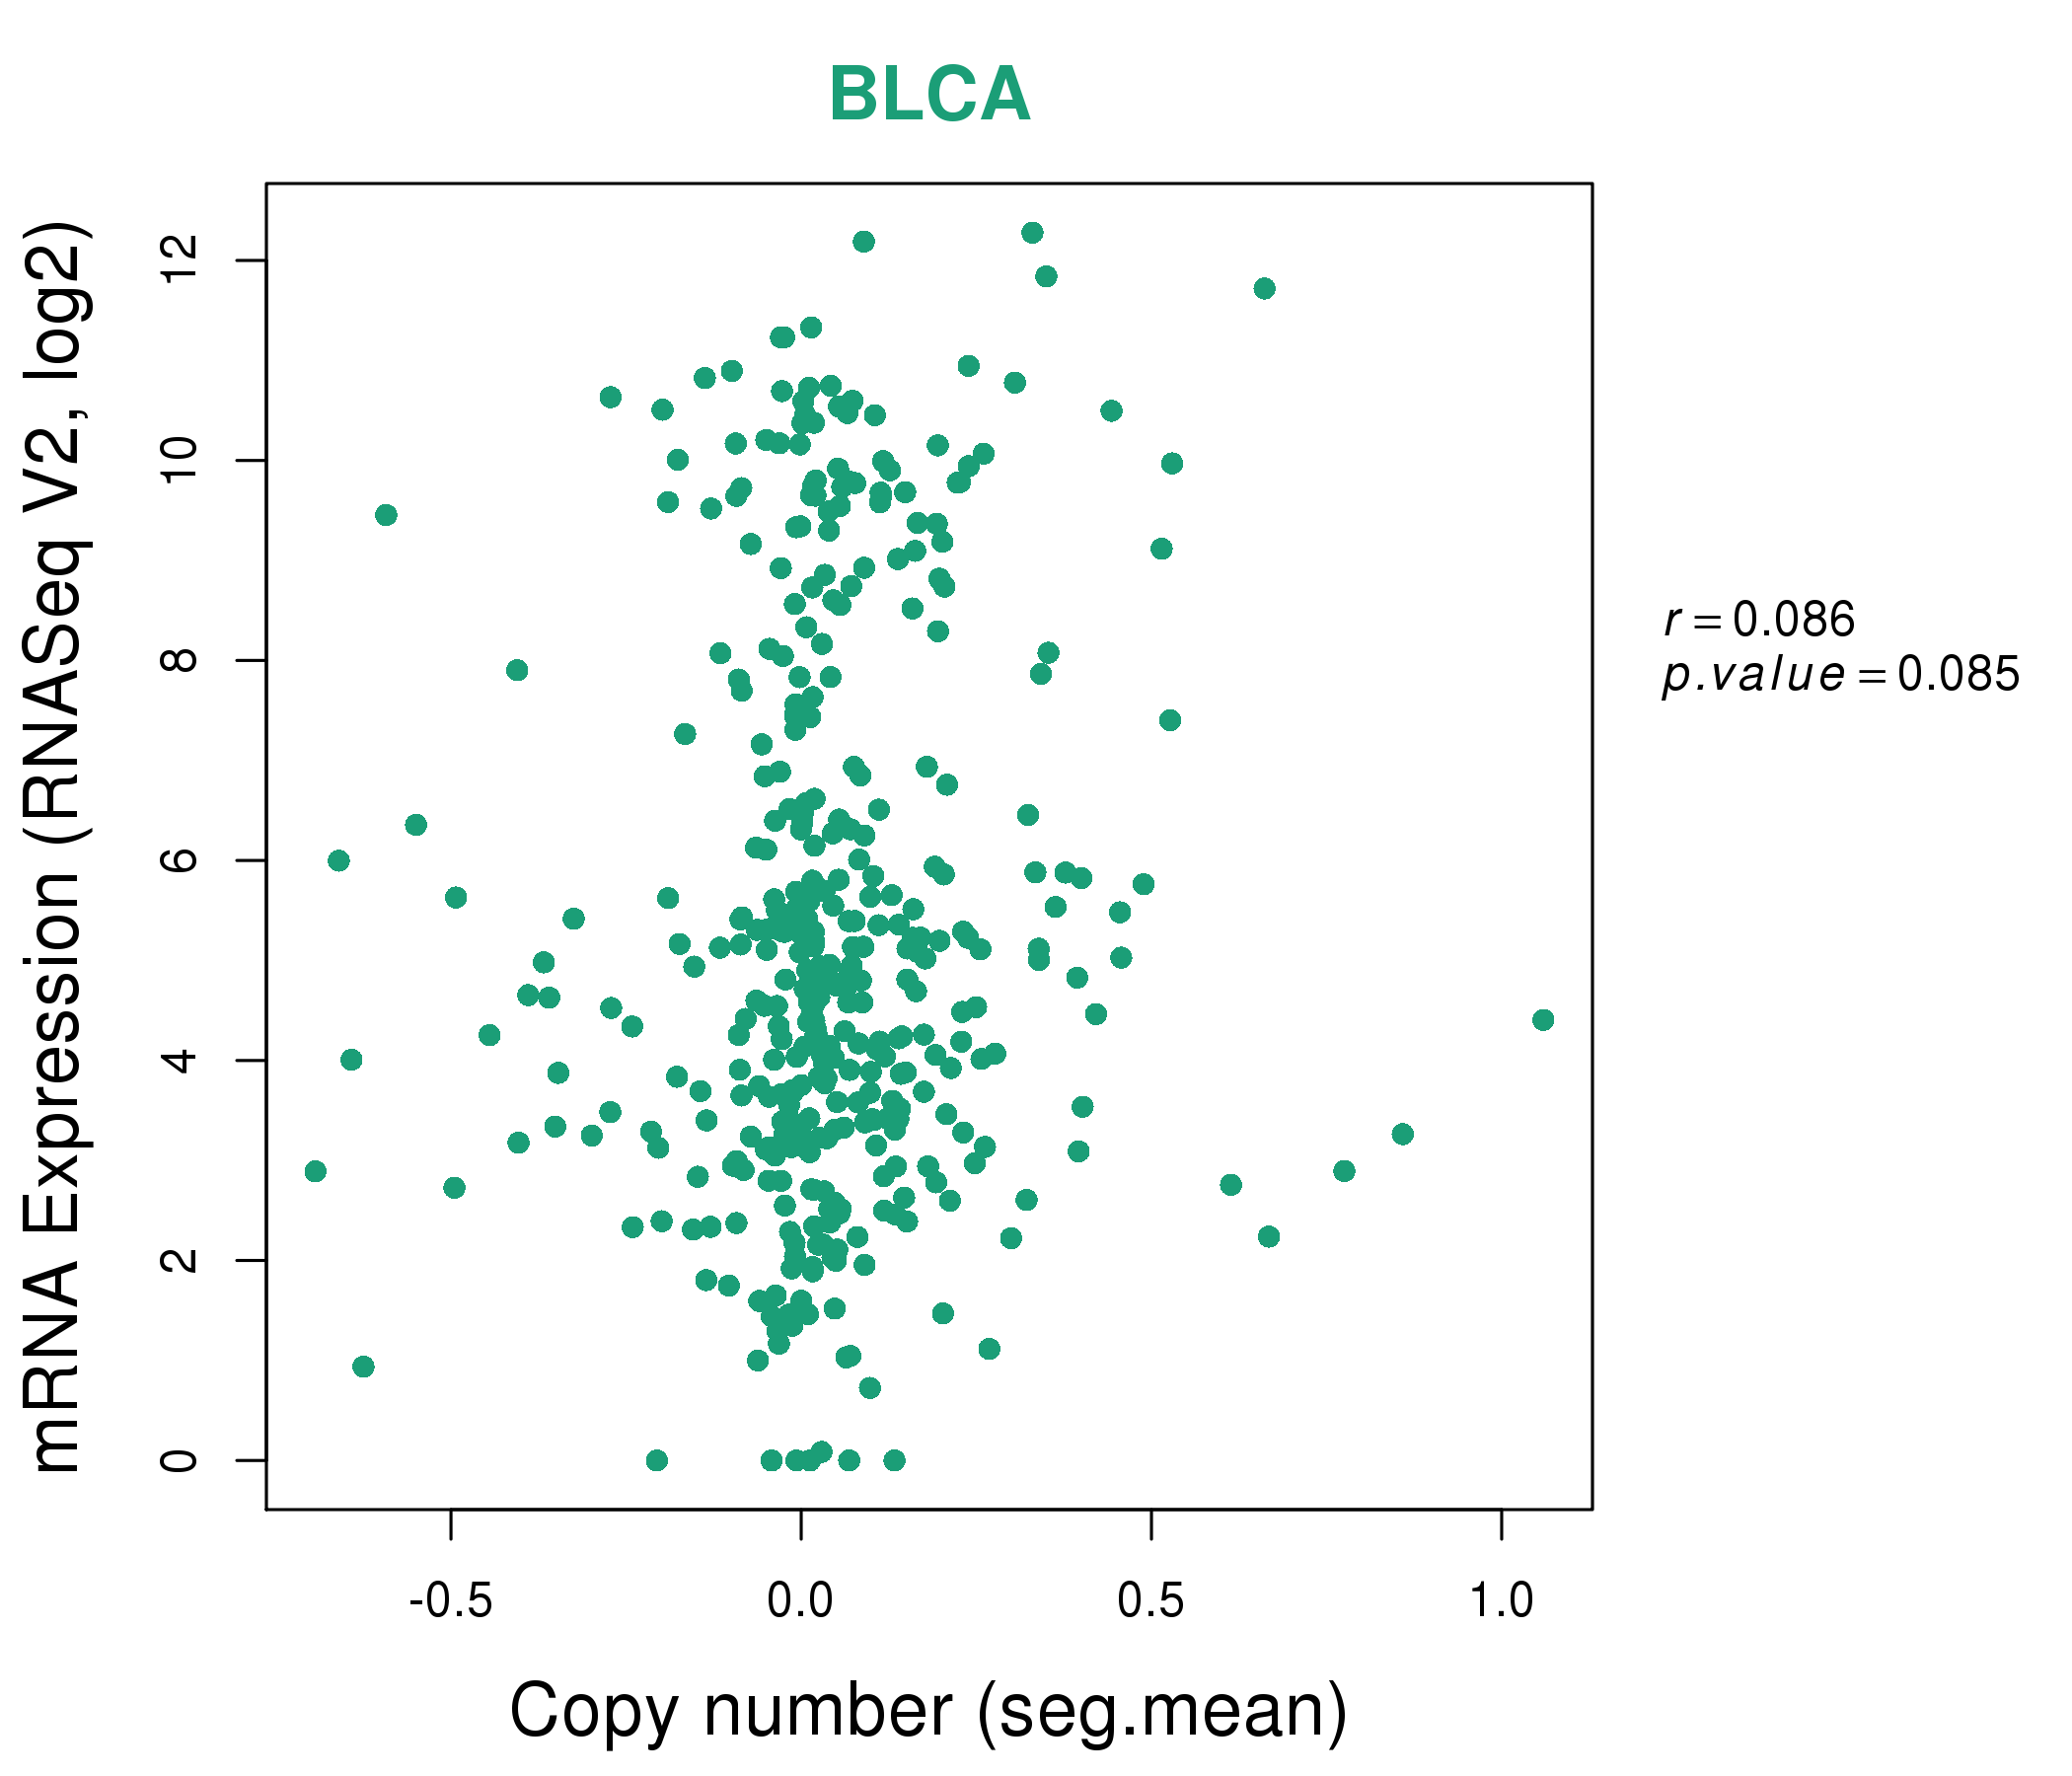
| * This plots show the correlation between CNV and gene expression. |
: Open all plots for all cancer types
 |
|
 |
|

| Top |
| Gene-Gene Network Information |
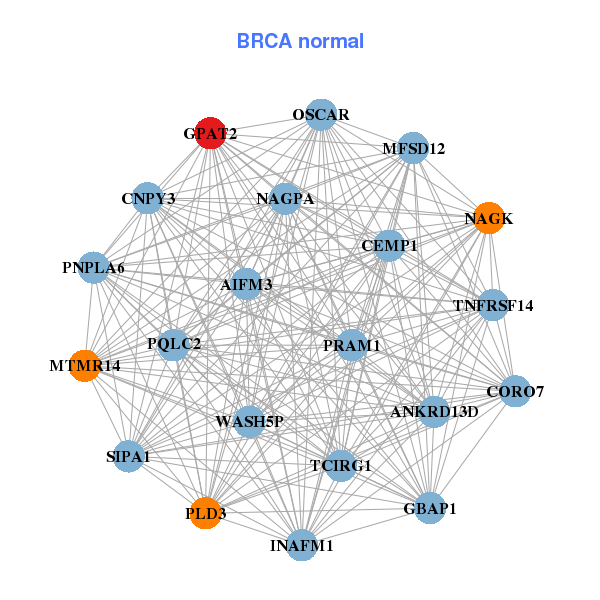
| * Co-Expression network figures were drawn using R package igraph. Only the top 20 genes with the highest correlations were shown. Red circle: input gene, orange circle: cell metabolism gene, sky circle: other gene |
: Open all plots for all cancer types
 |
|
| BTN1A1,CD14,CD180,EDN3,GNLY,GPAT2,IGFL4, KIR3DX1,LIPG,MRGPRX3,NOS1,OLAH,PDE11A,PGA5, PTN,SST,TGFBR2,TMEM100,TMEM233,VNN1,XDH | AIFM3,ANKRD13D,MFSD12,CEMP1,CNPY3,CORO7,GBAP1, GPAT2,MTMR14,NAGK,NAGPA,OSCAR,PLD3,PNPLA6, PQLC2,PRAM1,INAFM1,SIPA1,TCIRG1,TNFRSF14,WASH5P |
 |
|
| ARSF,TOPAZ1,CST9,F7,FATE1,SPATA31D4,GPAT2, HLA-DQA2,HLA-DRB6,KRTAP10-8,LDHAL6A,LOC162632,MMP27,MMP8, OPCML,OR13C5,OR3A4P,OR51M1,PER4,SDK2,TYMP | ABHD12B,ASIC4,ALG12,ATP2A3,CLN3,GAS6,GPAT2, SLC52A2,HS3ST2,HSD11B2,ILDR1,KRT37,MMP9,MTNR1A, PRSS21,PYGL,RDH13,RIN1,SLC35A4,TMEM44,ZBTB42 |
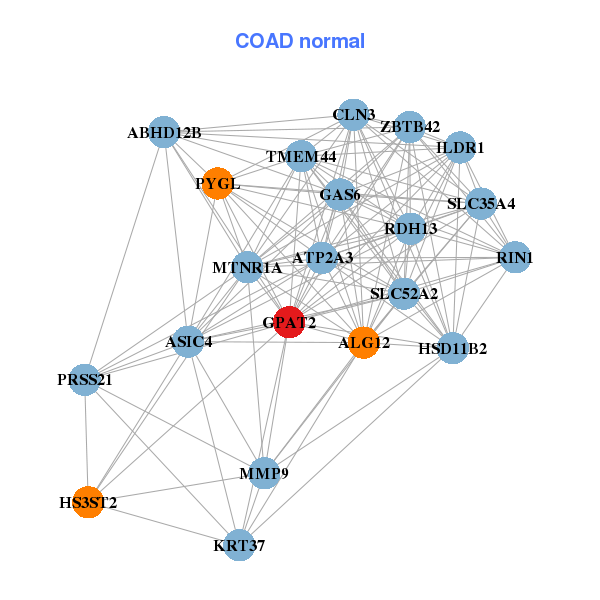
| * Co-Expression network figures were drawn using R package igraph. Only the top 20 genes with the highest correlations were shown. Red circle: input gene, orange circle: cell metabolism gene, sky circle: other gene |
: Open all plots for all cancer types
| Top |
: Open all interacting genes' information including KEGG pathway for all interacting genes from DAVID
| Top |
| Pharmacological Information for GPAT2 |
| There's no related Drug. |
| Top |
| Cross referenced IDs for GPAT2 |
| * We obtained these cross-references from Uniprot database. It covers 150 different DBs, 18 categories. http://www.uniprot.org/help/cross_references_section |
: Open all cross reference information
|
Copyright © 2016-Present - The Univsersity of Texas Health Science Center at Houston @ |