|
|||||||||||||||||||||||||||||||||||||||||||||||||||||||||||||||||||||||||||||||||||||||||||||||||||||||||||||||||||||||||||||||||||||||||||||||||||||||||||||||||||||||||||||||||||||||||||||||||||||||||||||||||||||||||||||||||||||||||||||||||||||||||||||||||||||||||||||||||||||||||||||||||||||||||||||||||||||||||||||||||||||||||||||||||||||||||||||||||||||||||||||||||||||||||||||
| |
| Phenotypic Information (metabolism pathway, cancer, disease, phenome) |
| |
| |
| Gene-Gene Network Information: Co-Expression Network, Interacting Genes & KEGG |
| |
|


| Gene Summary for CYC1 |
| Basic gene info. | Gene symbol | CYC1 |
| Gene name | cytochrome c-1 | |
| Synonyms | MC3DN6|UQCR4 | |
| Cytomap | UCSC genome browser: 8q24.3 | |
| Genomic location | chr8 :145149959-145152428 | |
| Type of gene | protein-coding | |
| RefGenes | NM_001916.4, | |
| Ensembl id | ENSG00000179091 | |
| Description | complex III subunit 4complex III subunit IVcytochrome b-c1 complex subunit 4cytochrome c1, heme protein, mitochondrialubiquinol-cytochrome-c reductase complex cytochrome c1 subunit | |
| Modification date | 20141207 | |
| dbXrefs | MIM : 123980 | |
| HGNC : HGNC | ||
| Ensembl : ENSG00000179091 | ||
| HPRD : 00480 | ||
| Vega : OTTHUMG00000165242 | ||
| Protein | UniProt: go to UniProt's Cross Reference DB Table | |
| Expression | CleanEX: HS_CYC1 | |
| BioGPS: 1537 | ||
| Gene Expression Atlas: ENSG00000179091 | ||
| The Human Protein Atlas: ENSG00000179091 | ||
| Pathway | NCI Pathway Interaction Database: CYC1 | |
| KEGG: CYC1 | ||
| REACTOME: CYC1 | ||
| ConsensusPathDB | ||
| Pathway Commons: CYC1 | ||
| Metabolism | MetaCyc: CYC1 | |
| HUMANCyc: CYC1 | ||
| Regulation | Ensembl's Regulation: ENSG00000179091 | |
| miRBase: chr8 :145,149,959-145,152,428 | ||
| TargetScan: NM_001916 | ||
| cisRED: ENSG00000179091 | ||
| Context | iHOP: CYC1 | |
| cancer metabolism search in PubMed: CYC1 | ||
| UCL Cancer Institute: CYC1 | ||
| Assigned class in ccmGDB | C | |
| Top |
| Phenotypic Information for CYC1(metabolism pathway, cancer, disease, phenome) |
| Cancer | CGAP: CYC1 |
| Familial Cancer Database: CYC1 | |
| * This gene is included in those cancer gene databases. |
|
|
|
|
|
| . | |||||||||||||||||||||||||||||||||||||||||||||||||||||||||||||||||||||||||||||||||||||||||||||||||||||||||||||||||||||||||||||||||||||||||||||||||||||||||||||||||||||||||||||||||||||||||||||||||||||||||||||||||||||||||||||||||||||||||||||||||||||||||||||||||||||||||||||||||||||||||||||||||||||||||||||||||||||||||||||||||||||||||||||||||||||||||||||||||||||||||||||||||||||||
Oncogene 1 | Significant driver gene in | ||||||||||||||||||||||||||||||||||||||||||||||||||||||||||||||||||||||||||||||||||||||||||||||||||||||||||||||||||||||||||||||||||||||||||||||||||||||||||||||||||||||||||||||||||||||||||||||||||||||||||||||||||||||||||||||||||||||||||||||||||||||||||||||||||||||||||||||||||||||||||||||||||||||||||||||||||||||||||||||||||||||||||||||||||||||||||||||||||||||||||||||||||||||||||||
| cf) number; DB name 1 Oncogene; http://nar.oxfordjournals.org/content/35/suppl_1/D721.long, 2 Tumor Suppressor gene; https://bioinfo.uth.edu/TSGene/, 3 Cancer Gene Census; http://www.nature.com/nrc/journal/v4/n3/abs/nrc1299.html, 4 CancerGenes; http://nar.oxfordjournals.org/content/35/suppl_1/D721.long, 5 Network of Cancer Gene; http://ncg.kcl.ac.uk/index.php, 1Therapeutic Vulnerabilities in Cancer; http://cbio.mskcc.org/cancergenomics/statius/ |
| REACTOME_METABOLISM_OF_PROTEINS | |
| OMIM | |
| Orphanet | |
| Disease | KEGG Disease: CYC1 |
| MedGen: CYC1 (Human Medical Genetics with Condition) | |
| ClinVar: CYC1 | |
| Phenotype | MGI: CYC1 (International Mouse Phenotyping Consortium) |
| PhenomicDB: CYC1 | |
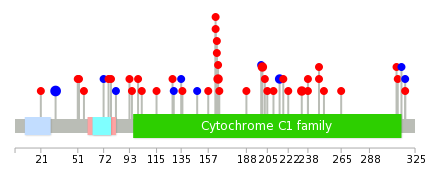
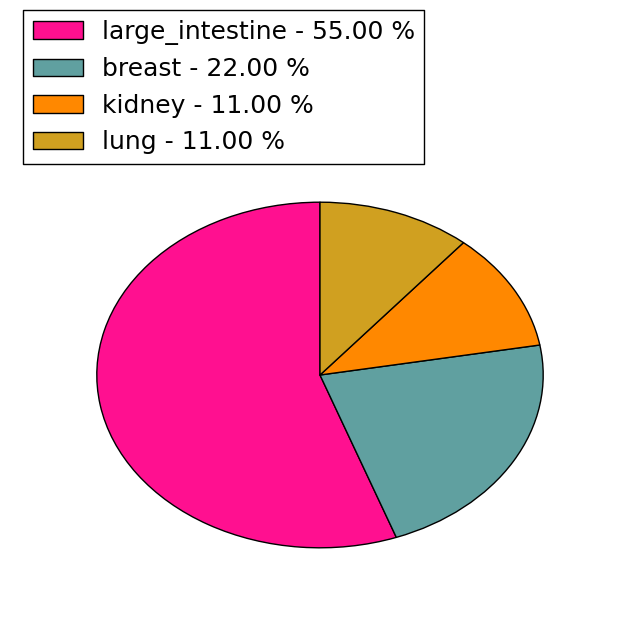
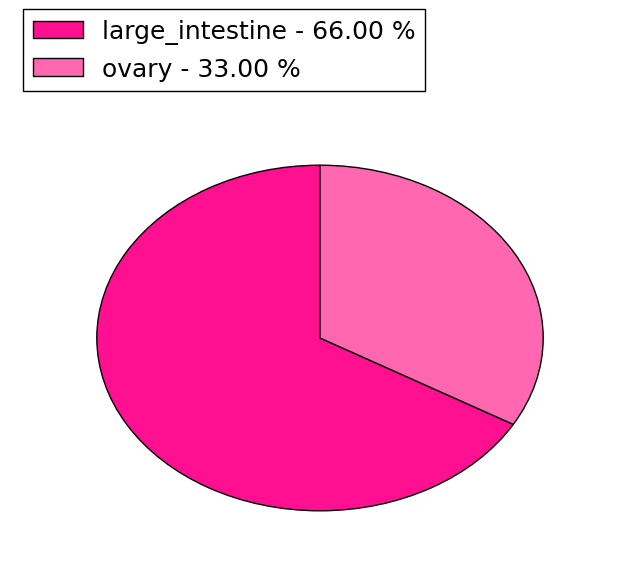
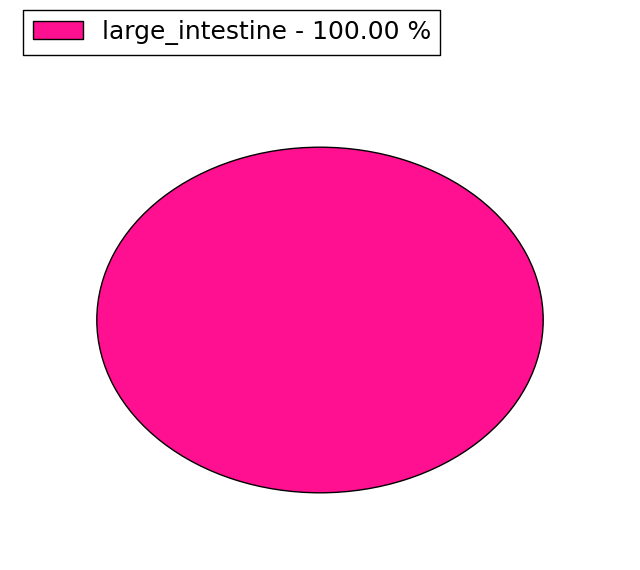
| Mutations for CYC1 |
| * Under tables are showing count per each tissue to give us broad intuition about tissue specific mutation patterns.You can go to the detailed page for each mutation database's web site. |
| There's no structural variation information in COSMIC data for this gene. |
| * From mRNA Sanger sequences, Chitars2.0 arranged chimeric transcripts. This table shows CYC1 related fusion information. |
| ID | Head Gene | Tail Gene | Accession | Gene_a | qStart_a | qEnd_a | Chromosome_a | tStart_a | tEnd_a | Gene_a | qStart_a | qEnd_a | Chromosome_a | tStart_a | tEnd_a |
| BI006405 | CYC1 | 22 | 135 | 8 | 145151165 | 145151280 | C1QB | 132 | 213 | 1 | 22987434 | 22987515 | |
| BM562582 | MIS18A | 1 | 624 | 21 | 33642030 | 33651341 | CYC1 | 625 | 906 | 8 | 145151031 | 145151395 | |
| BM423739 | MIS18A | 26 | 649 | 21 | 33642030 | 33651341 | CYC1 | 650 | 866 | 8 | 145151031 | 145151331 | |
| BC033076 | MIS18A | 1 | 624 | 21 | 33642030 | 33651341 | CYC1 | 625 | 1461 | 8 | 145151031 | 145152428 | |
| BC011661 | CYC1 | 50 | 819 | 8 | 145151098 | 145152428 | TRBV20-1 | 819 | 1748 | 16 | 2012062 | 2014815 | |
| Top |
| Mutation type/ Tissue ID | brca | cns | cerv | endome | haematopo | kidn | Lintest | liver | lung | ns | ovary | pancre | prost | skin | stoma | thyro | urina | |||
| Total # sample | 1 | |||||||||||||||||||
| GAIN (# sample) | 1 | |||||||||||||||||||
| LOSS (# sample) |
| cf) Tissue ID; Tissue type (1; Breast, 2; Central_nervous_system, 3; Cervix, 4; Endometrium, 5; Haematopoietic_and_lymphoid_tissue, 6; Kidney, 7; Large_intestine, 8; Liver, 9; Lung, 10; NS, 11; Ovary, 12; Pancreas, 13; Prostate, 14; Skin, 15; Stomach, 16; Thyroid, 17; Urinary_tract) |
| Top |
|
 |
| Top |
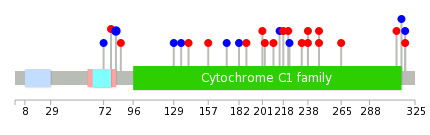
| Stat. for Non-Synonymous SNVs (# total SNVs=33) | (# total SNVs=9) |
 |  |
(# total SNVs=3) | (# total SNVs=1) |
 |  |
| Top |
| * When you move the cursor on each content, you can see more deailed mutation information on the Tooltip. Those are primary_site,primary_histology,mutation(aa),pubmedID. |
| GRCh37 position | Mutation(aa) | Unique sampleID count |
| chr8:145150101-145150101 | p.R33R | 4 |
| chr8:145151520-145151520 | p.L215L | 2 |
| chr8:145152017-145152017 | p.R285* | 2 |
| chr8:145151572-145151572 | p.F233I | 2 |
| chr8:145151587-145151587 | p.P238S | 2 |
| chr8:145150876-145150876 | p.S93fs*161 | 2 |
| chr8:145151387-145151387 | p.V201M | 2 |
| chr8:145151274-145151274 | p.E163V | 1 |
| chr8:145151394-145151394 | p.A203V | 1 |
| chr8:145150760-145150760 | p.G52S | 1 |
| Top |
|
 |
| Point Mutation/ Tissue ID | 1 | 2 | 3 | 4 | 5 | 6 | 7 | 8 | 9 | 10 | 11 | 12 | 13 | 14 | 15 | 16 | 17 | 18 | 19 | 20 |
| # sample | 2 | 3 | 1 | 2 | 1 | 3 | 4 | 1 | 1 | 3 | 3 | 1 | 3 | |||||||
| # mutation | 2 | 3 | 1 | 2 | 1 | 3 | 5 | 1 | 1 | 3 | 3 | 1 | 3 | |||||||
| nonsynonymous SNV | 1 | 1 | 1 | 2 | 4 | 1 | 3 | 1 | 1 | 3 | ||||||||||
| synonymous SNV | 1 | 2 | 2 | 1 | 1 | 1 | 1 | 2 |
| cf) Tissue ID; Tissue type (1; BLCA[Bladder Urothelial Carcinoma], 2; BRCA[Breast invasive carcinoma], 3; CESC[Cervical squamous cell carcinoma and endocervical adenocarcinoma], 4; COAD[Colon adenocarcinoma], 5; GBM[Glioblastoma multiforme], 6; Glioma Low Grade, 7; HNSC[Head and Neck squamous cell carcinoma], 8; KICH[Kidney Chromophobe], 9; KIRC[Kidney renal clear cell carcinoma], 10; KIRP[Kidney renal papillary cell carcinoma], 11; LAML[Acute Myeloid Leukemia], 12; LUAD[Lung adenocarcinoma], 13; LUSC[Lung squamous cell carcinoma], 14; OV[Ovarian serous cystadenocarcinoma ], 15; PAAD[Pancreatic adenocarcinoma], 16; PRAD[Prostate adenocarcinoma], 17; SKCM[Skin Cutaneous Melanoma], 18:STAD[Stomach adenocarcinoma], 19:THCA[Thyroid carcinoma], 20:UCEC[Uterine Corpus Endometrial Carcinoma]) |
| Top |
| * We represented just top 10 SNVs. When you move the cursor on each content, you can see more deailed mutation information on the Tooltip. Those are primary_site, primary_histology, mutation(aa), pubmedID. |
| Genomic Position | Mutation(aa) | Unique sampleID count |
| chr8:145150852 | p.V82V | 2 |
| chr8:145151587 | p.P238S | 2 |
| chr8:145151394 | p.R317P | 1 |
| chr8:145152190 | p.S182S | 1 |
| chr8:145151504 | p.R317R | 1 |
| chr8:145152203 | p.A188T | 1 |
| chr8:145150862 | p.V201M | 1 |
| chr8:145151520 | p.A203V | 1 |
| chr8:145152211 | p.Y210F | 1 |
| chr8:145151087 | p.L215L | 1 |
| * Copy number data were extracted from TCGA using R package TCGA-Assembler. The URLs of all public data files on TCGA DCC data server were gathered on Jan-05-2015. Function ProcessCNAData in TCGA-Assembler package was used to obtain gene-level copy number value which is calculated as the average copy number of the genomic region of a gene. |
 |
| cf) Tissue ID[Tissue type]: BLCA[Bladder Urothelial Carcinoma], BRCA[Breast invasive carcinoma], CESC[Cervical squamous cell carcinoma and endocervical adenocarcinoma], COAD[Colon adenocarcinoma], GBM[Glioblastoma multiforme], Glioma Low Grade, HNSC[Head and Neck squamous cell carcinoma], KICH[Kidney Chromophobe], KIRC[Kidney renal clear cell carcinoma], KIRP[Kidney renal papillary cell carcinoma], LAML[Acute Myeloid Leukemia], LUAD[Lung adenocarcinoma], LUSC[Lung squamous cell carcinoma], OV[Ovarian serous cystadenocarcinoma ], PAAD[Pancreatic adenocarcinoma], PRAD[Prostate adenocarcinoma], SKCM[Skin Cutaneous Melanoma], STAD[Stomach adenocarcinoma], THCA[Thyroid carcinoma], UCEC[Uterine Corpus Endometrial Carcinoma] |
| Top |
| Gene Expression for CYC1 |
| * CCLE gene expression data were extracted from CCLE_Expression_Entrez_2012-10-18.res: Gene-centric RMA-normalized mRNA expression data. |
 |
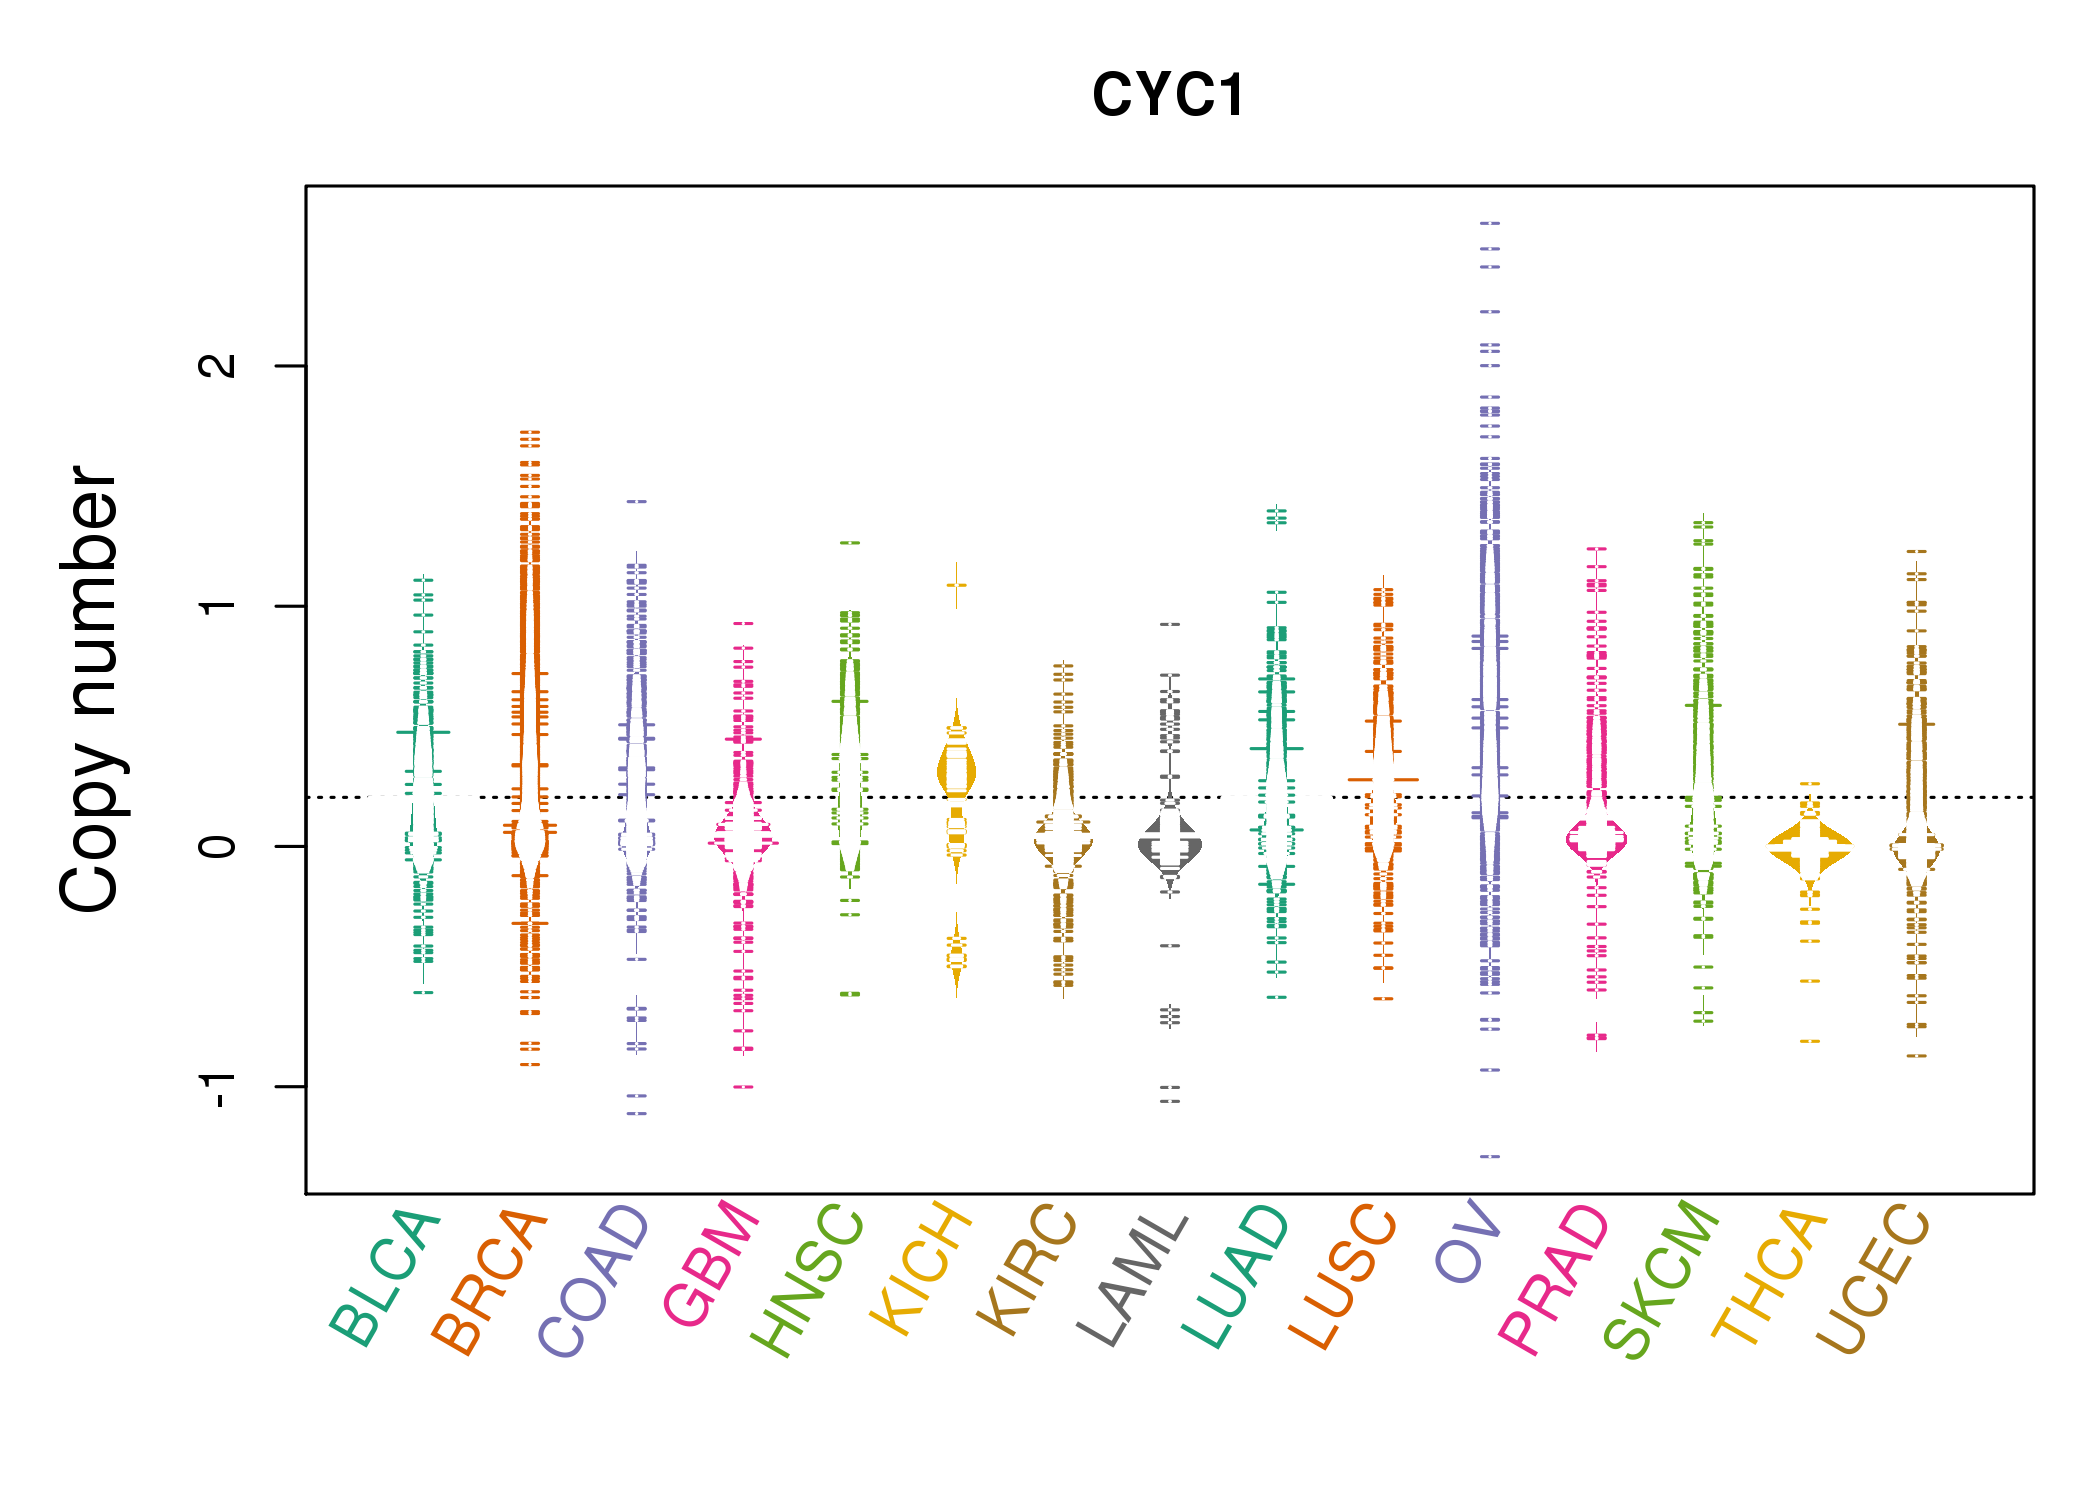
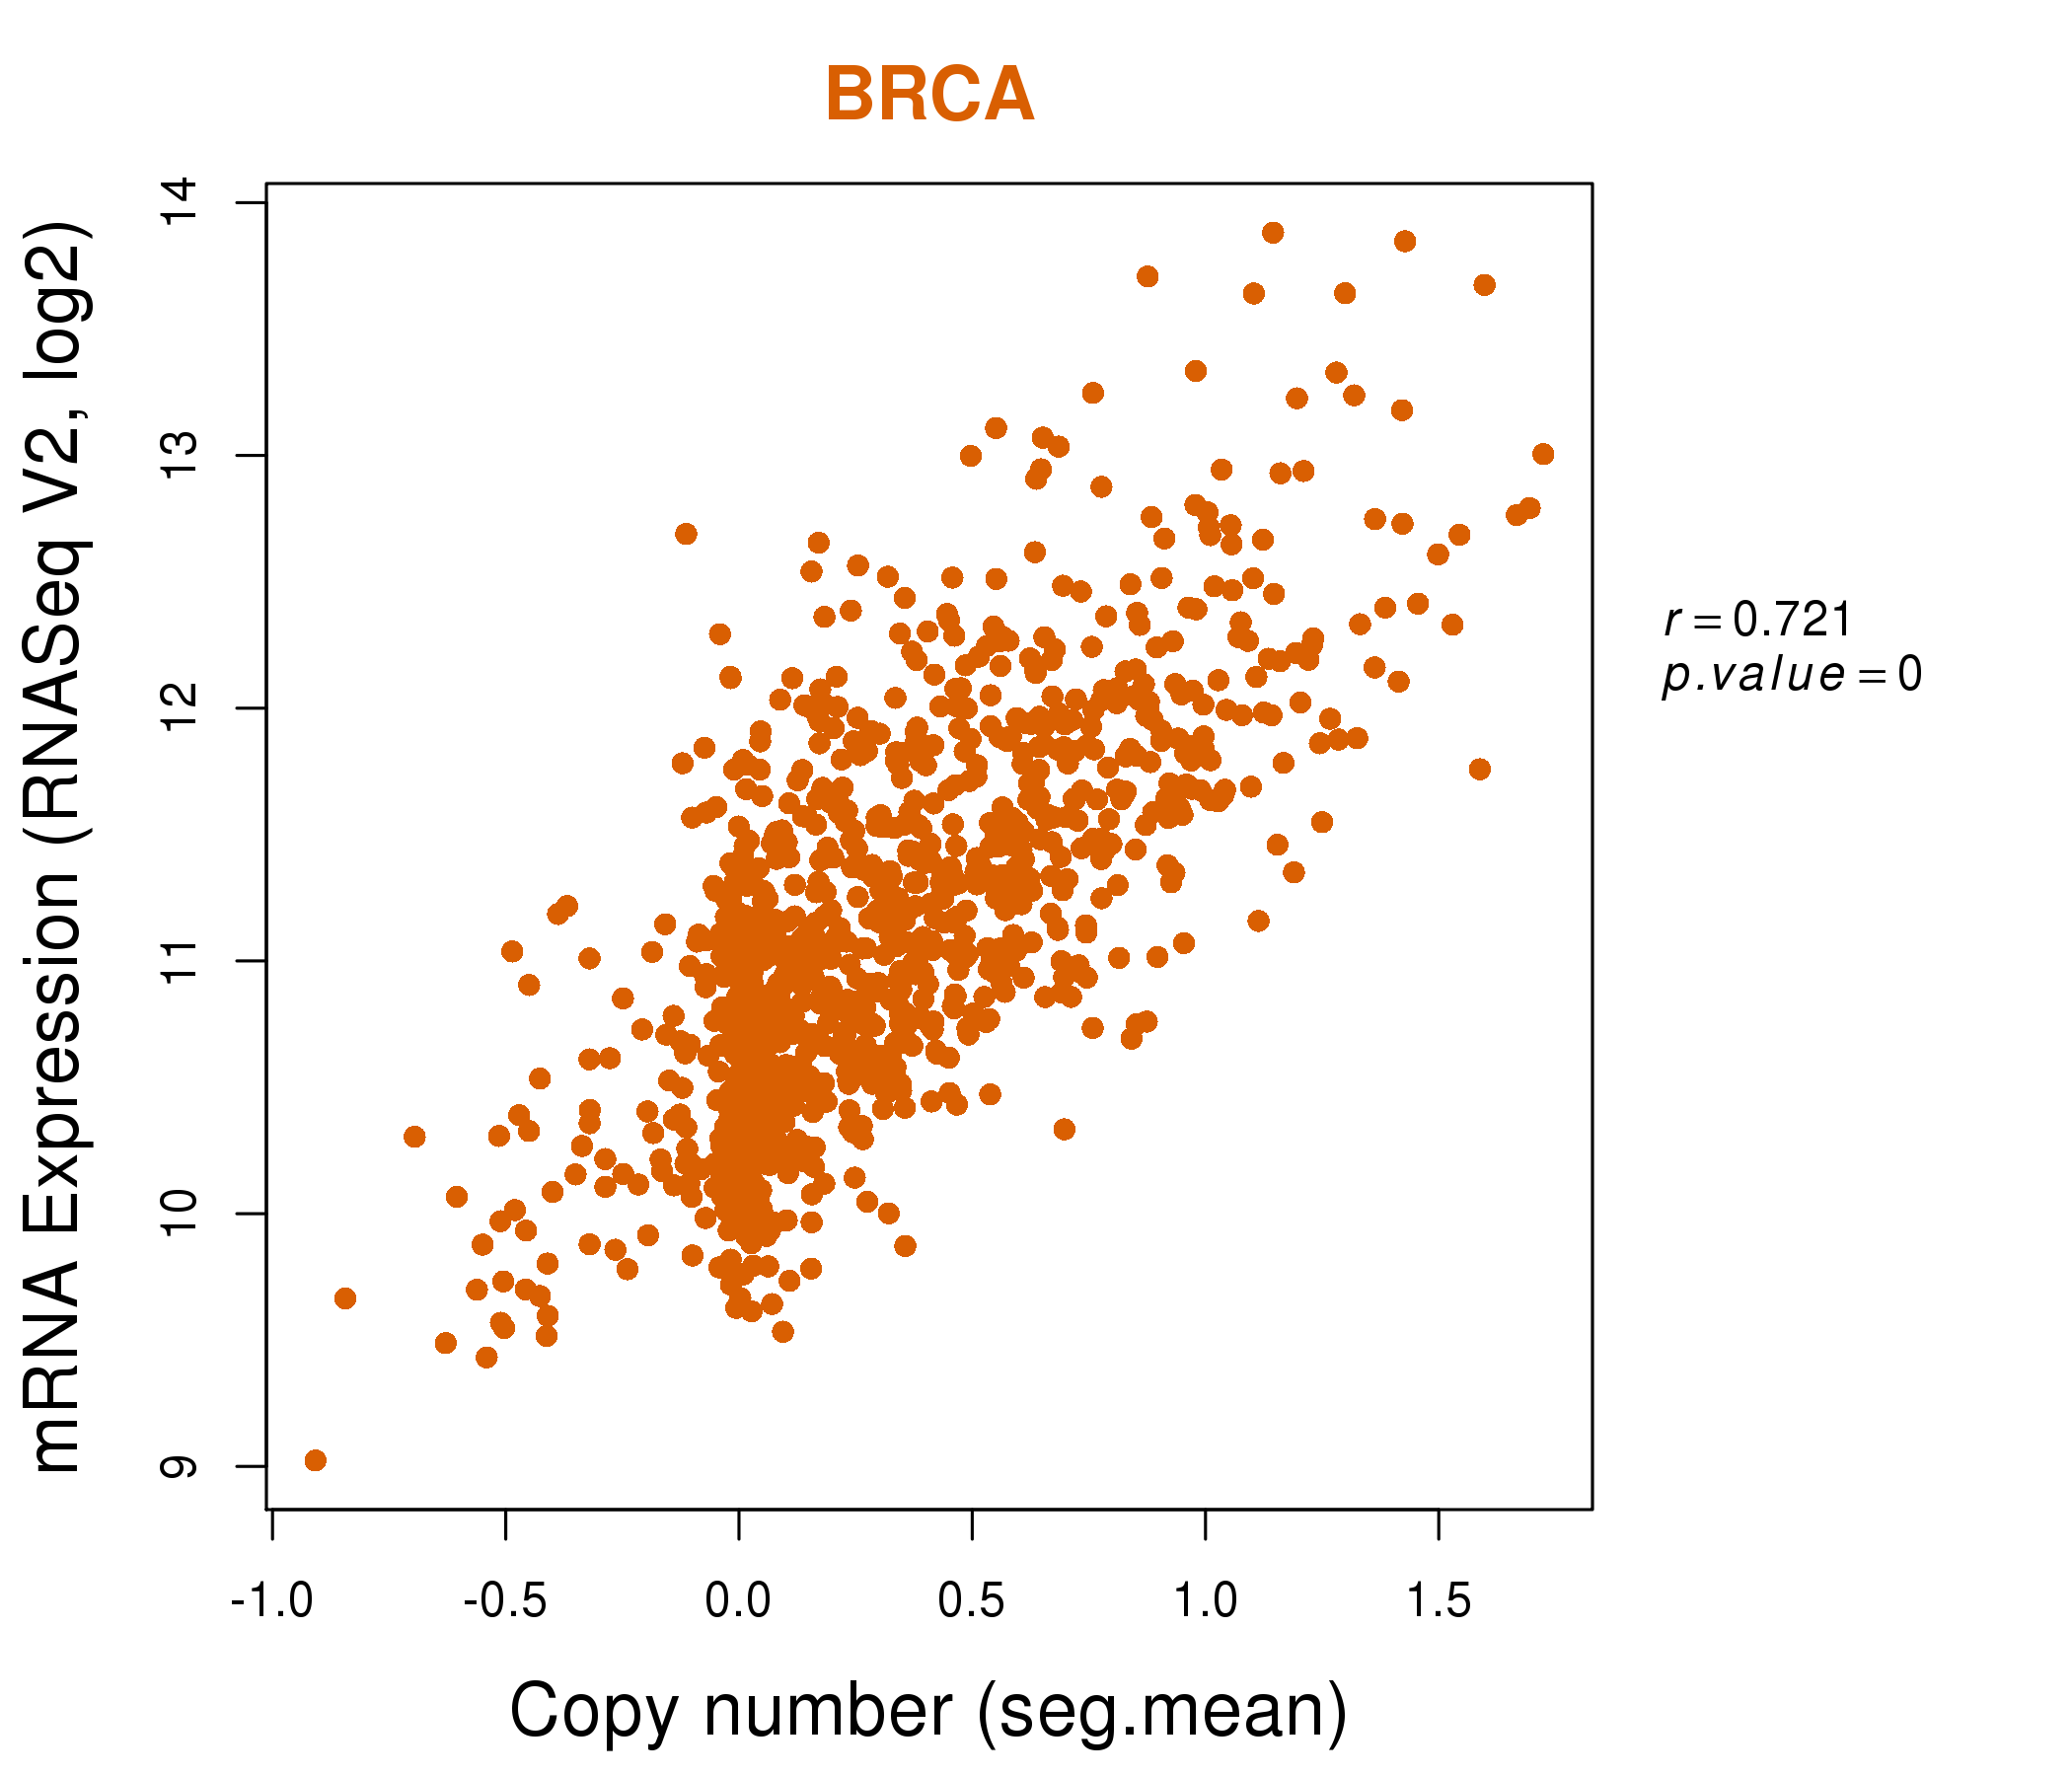
| * Normalized gene expression data of RNASeqV2 was extracted from TCGA using R package TCGA-Assembler. The URLs of all public data files on TCGA DCC data server were gathered at Jan-05-2015. Only eight cancer types have enough normal control samples for differential expression analysis. (t test, adjusted p<0.05 (using Benjamini-Hochberg FDR)) |
 |
| Top |
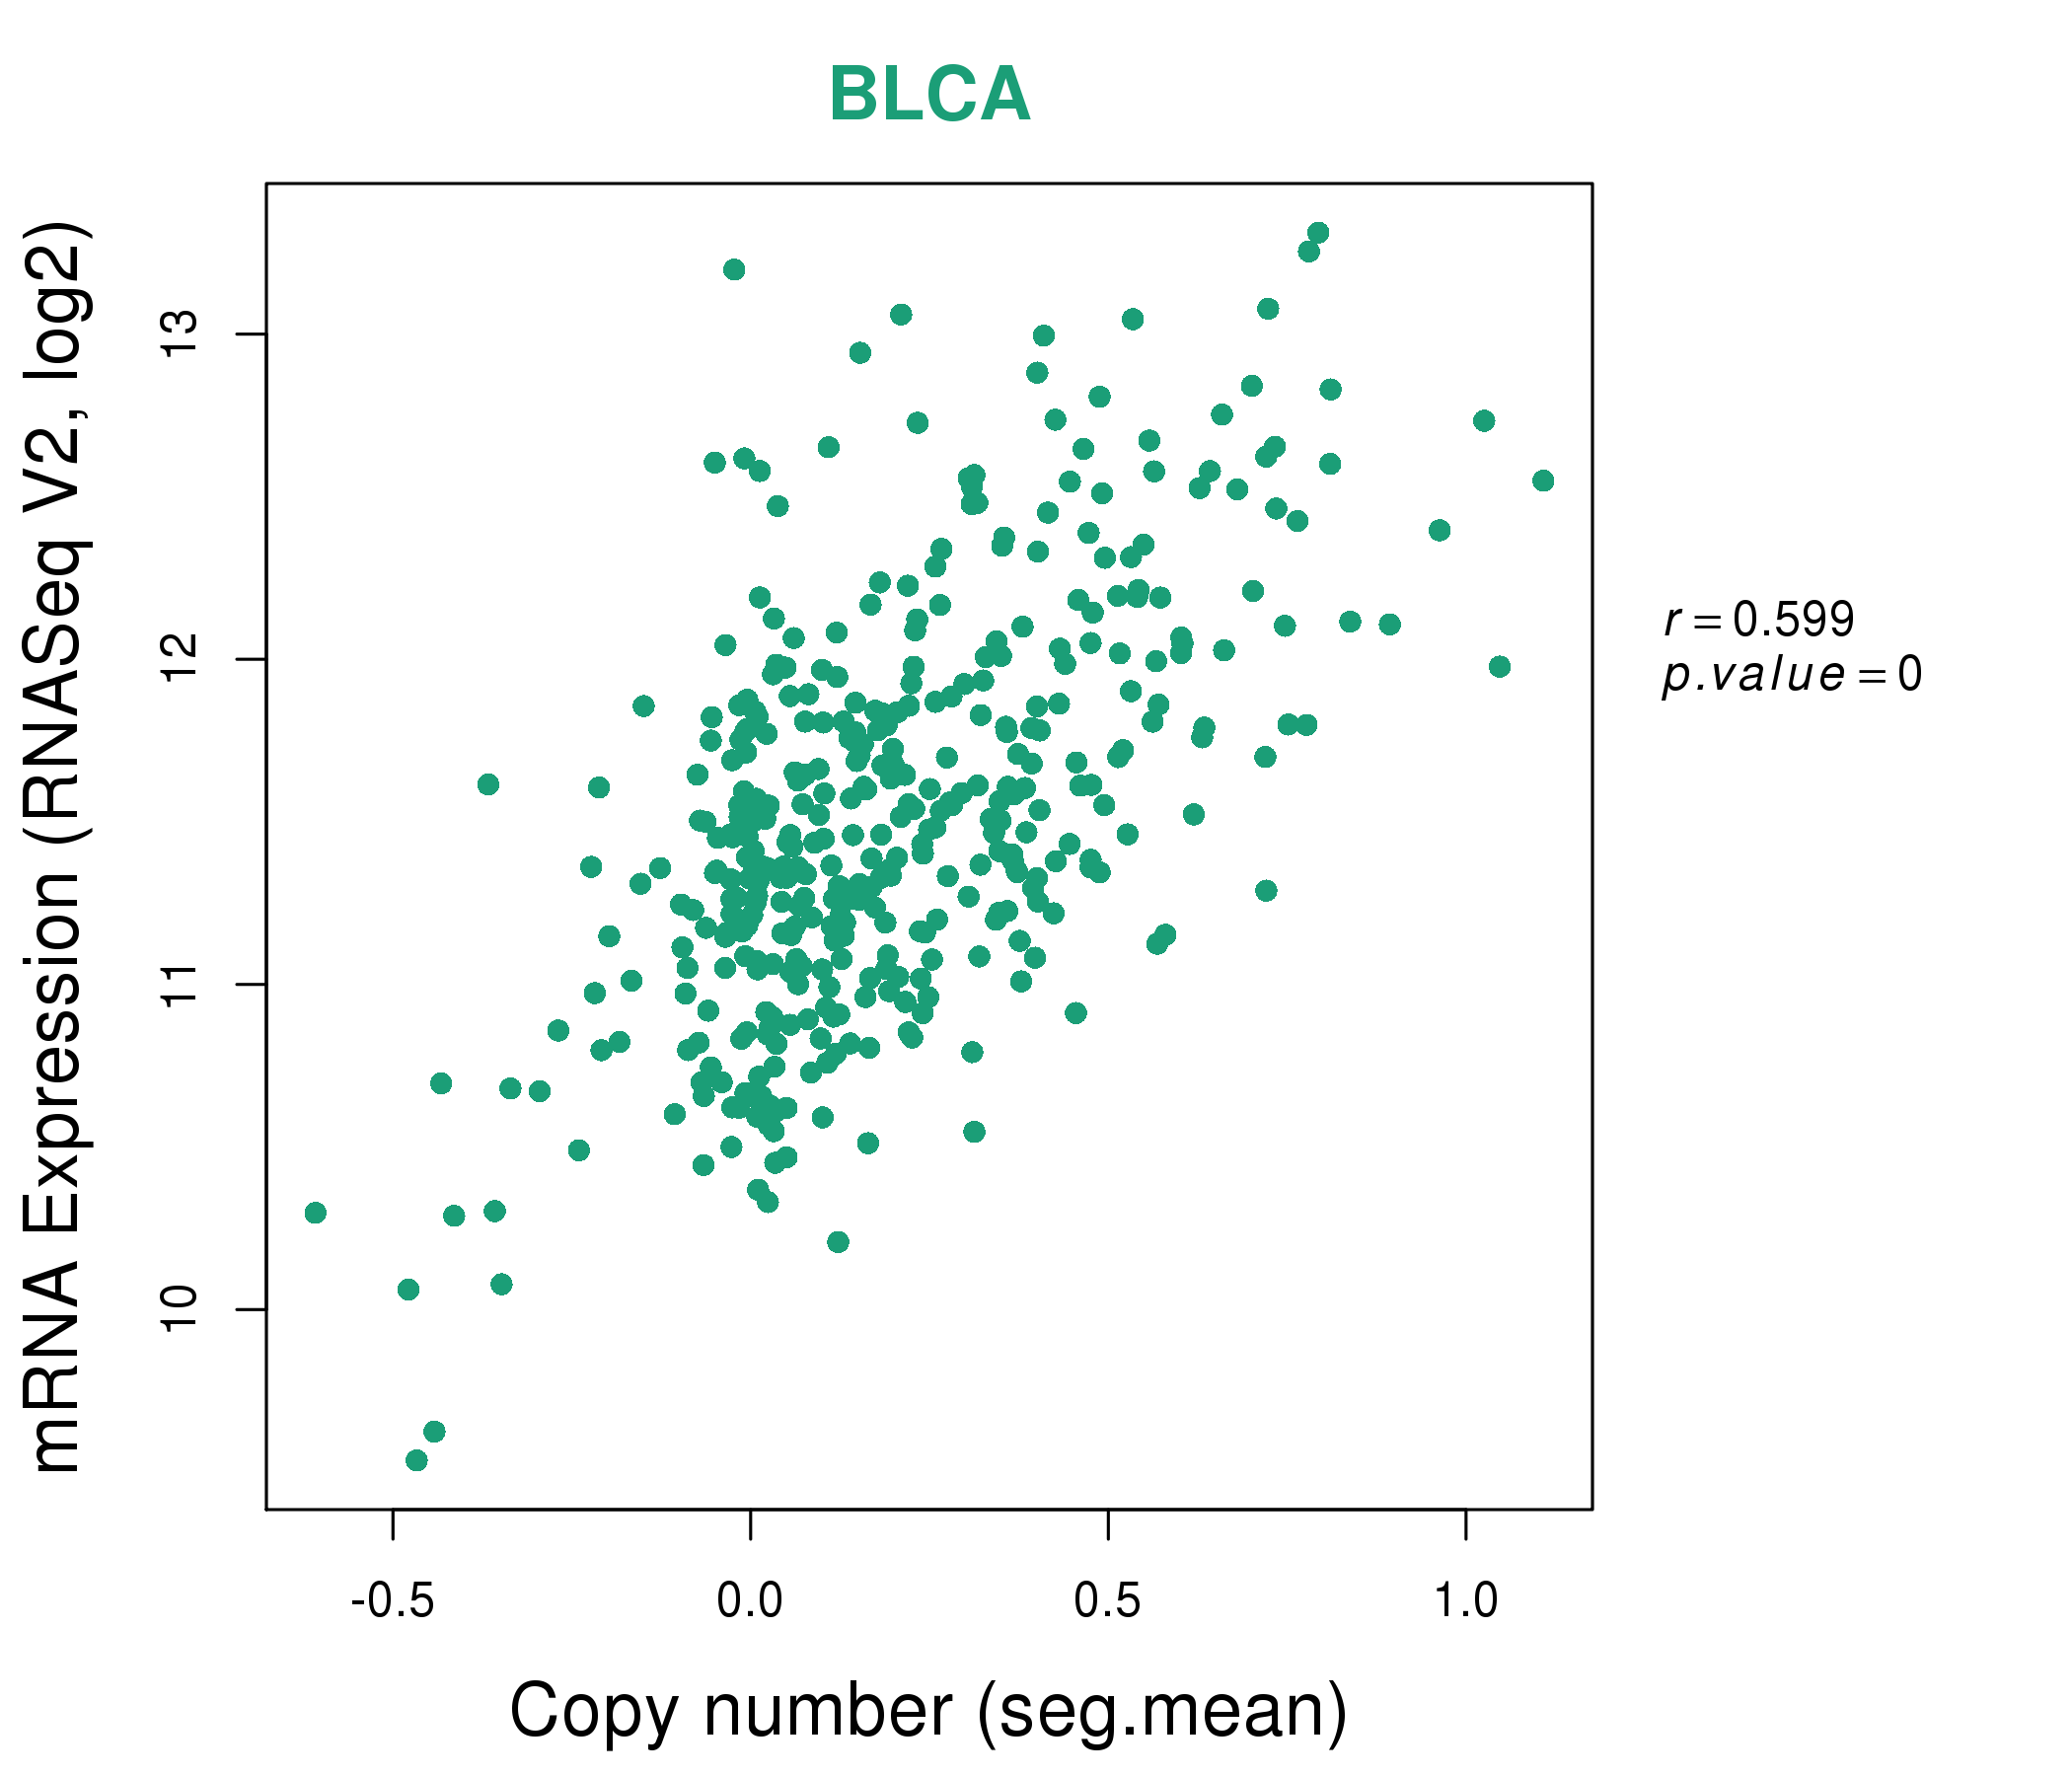
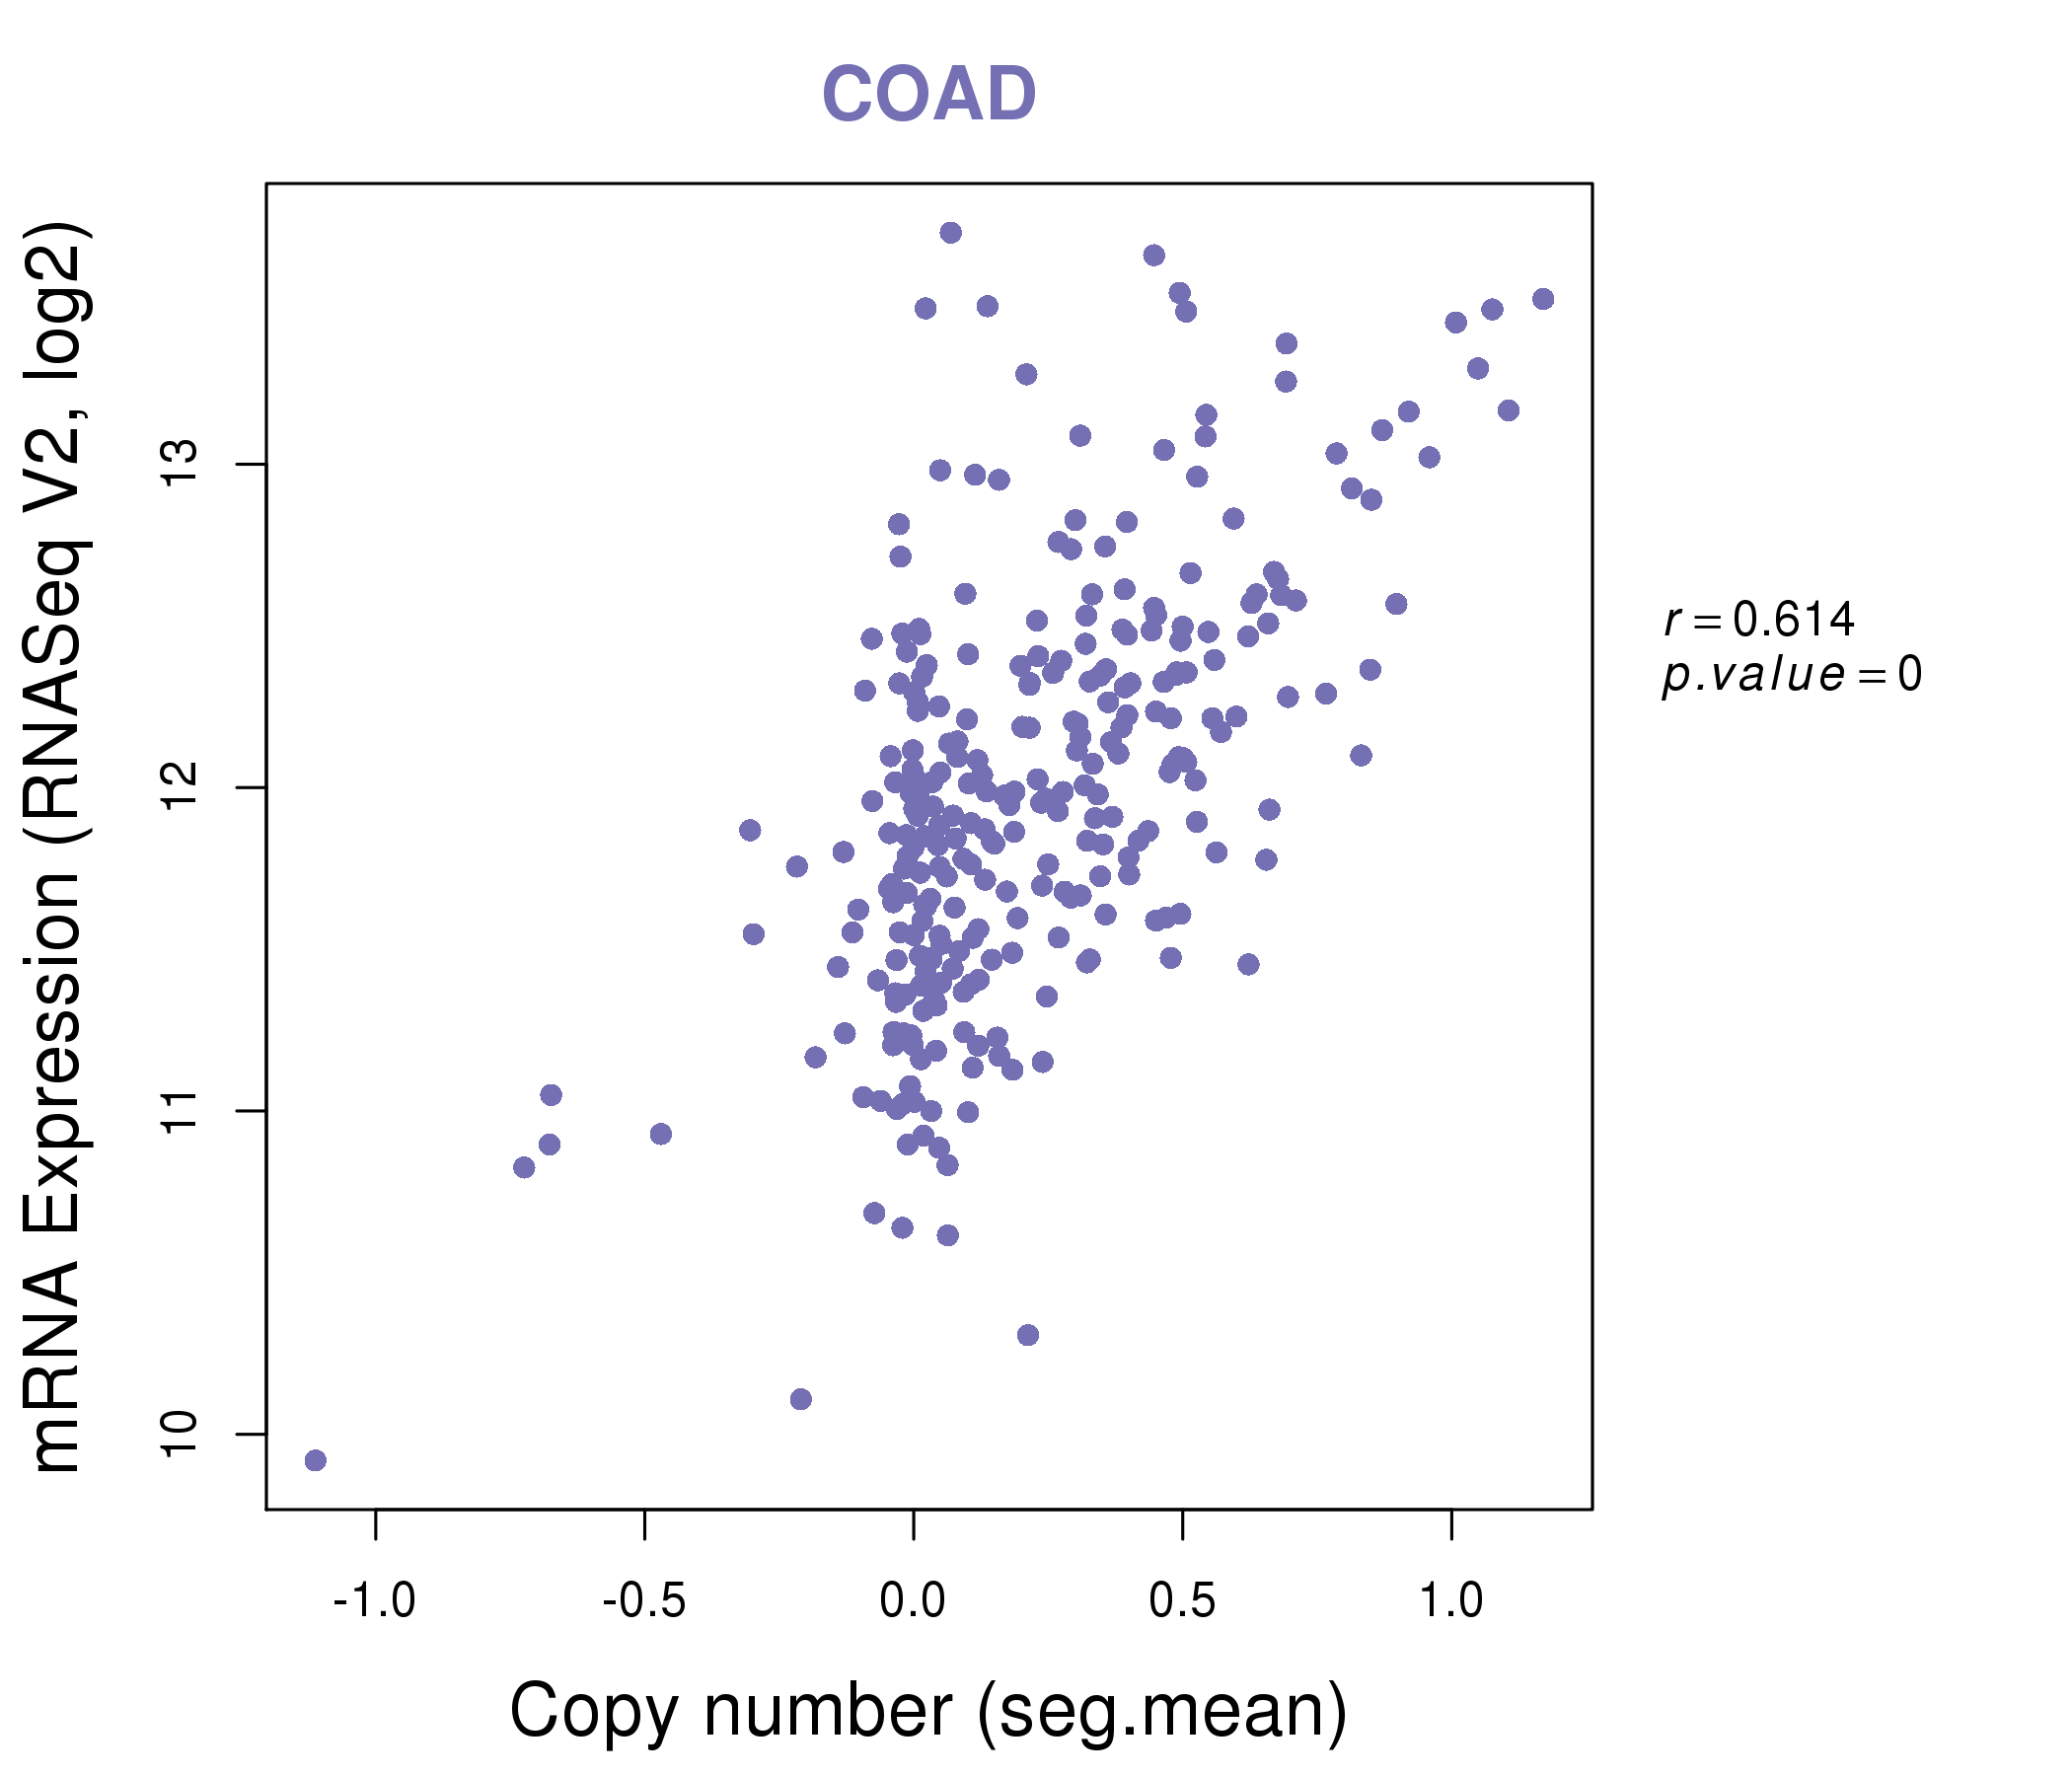
| * This plots show the correlation between CNV and gene expression. |
: Open all plots for all cancer types
 |
|
 |
|

| Top |
| Gene-Gene Network Information |
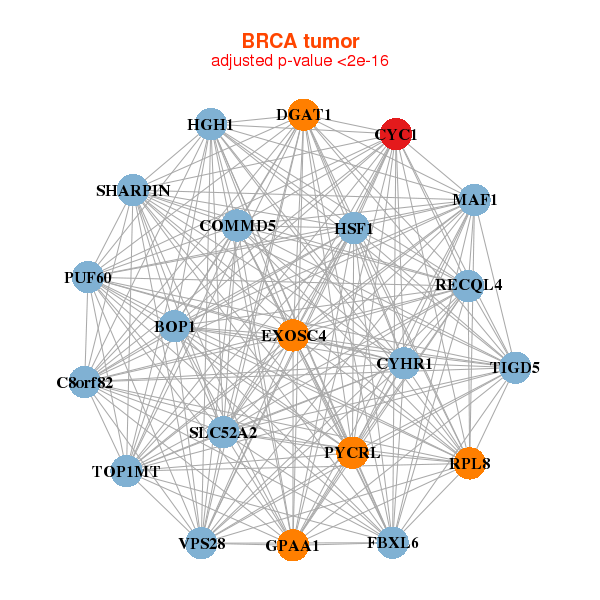
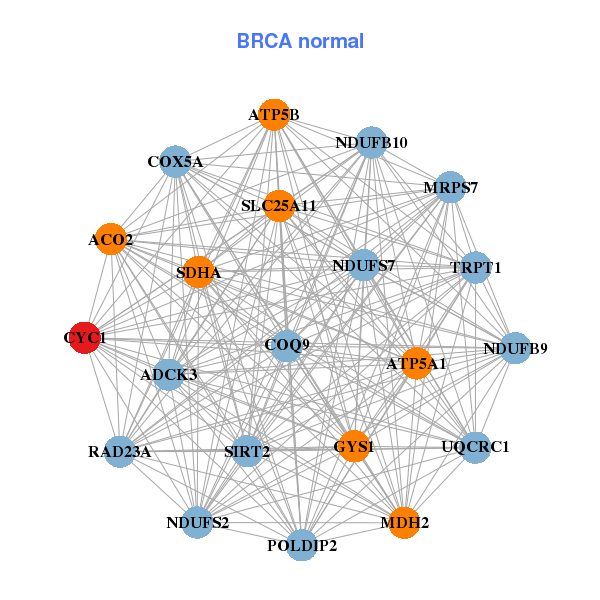
| * Co-Expression network figures were drawn using R package igraph. Only the top 20 genes with the highest correlations were shown. Red circle: input gene, orange circle: cell metabolism gene, sky circle: other gene |
: Open all plots for all cancer types
 |
| ||||
| BOP1,HGH1,COMMD5,CYC1,CYHR1,DGAT1,EXOSC4, FBXL6,GPAA1,SLC52A2,HSF1,MAF1,C8orf82,PUF60, PYCRL,RECQL4,RPL8,SHARPIN,TIGD5,TOP1MT,VPS28 | ACO2,ATP5A1,ATP5B,ADCK3,COQ9,COX5A,CYC1, GYS1,MDH2,MRPS7,NDUFB10,NDUFB9,NDUFS2,NDUFS7, POLDIP2,RAD23A,SDHA,SIRT2,SLC25A11,TRPT1,UQCRC1 | ||||
 |
| ||||
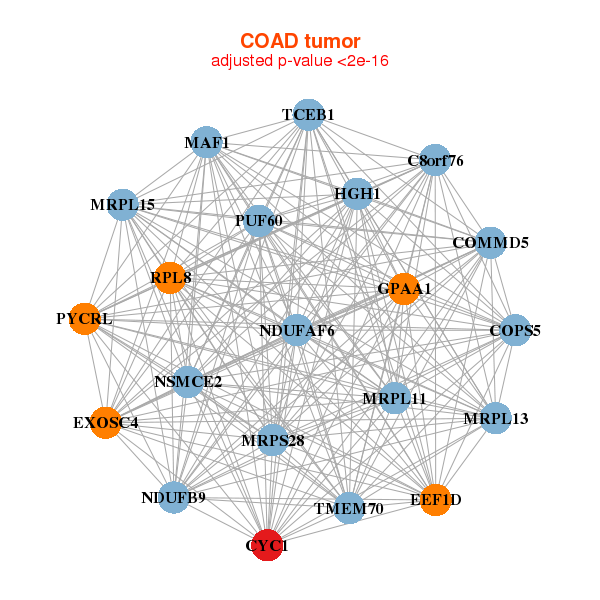
| HGH1,NDUFAF6,C8orf76,COMMD5,COPS5,CYC1,EEF1D, EXOSC4,GPAA1,MAF1,MRPL11,MRPL13,MRPL15,MRPS28, NDUFB9,NSMCE2,PUF60,PYCRL,RPL8,TCEB1,TMEM70 | ABT1,ATP5O,C19orf70,PRADC1,CYC1,DCTPP1,MRPL11, MRPL15,MRPL27,MRPS12,MRPS7,NDUFS3,SF3B5,SLC25A11, STOML2,PAM16,TMEM183A,TMEM223,TOMM22,TRUB2,TXN2 |
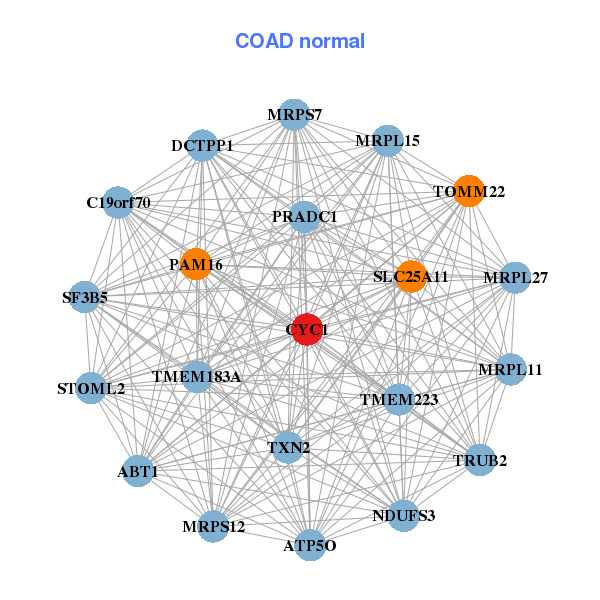
| * Co-Expression network figures were drawn using R package igraph. Only the top 20 genes with the highest correlations were shown. Red circle: input gene, orange circle: cell metabolism gene, sky circle: other gene |
: Open all plots for all cancer types
| Top |
: Open all interacting genes' information including KEGG pathway for all interacting genes from DAVID
| Top |
| Pharmacological Information for CYC1 |
| DB Category | DB Name | DB's ID and Url link |
| * Gene Centered Interaction Network. |
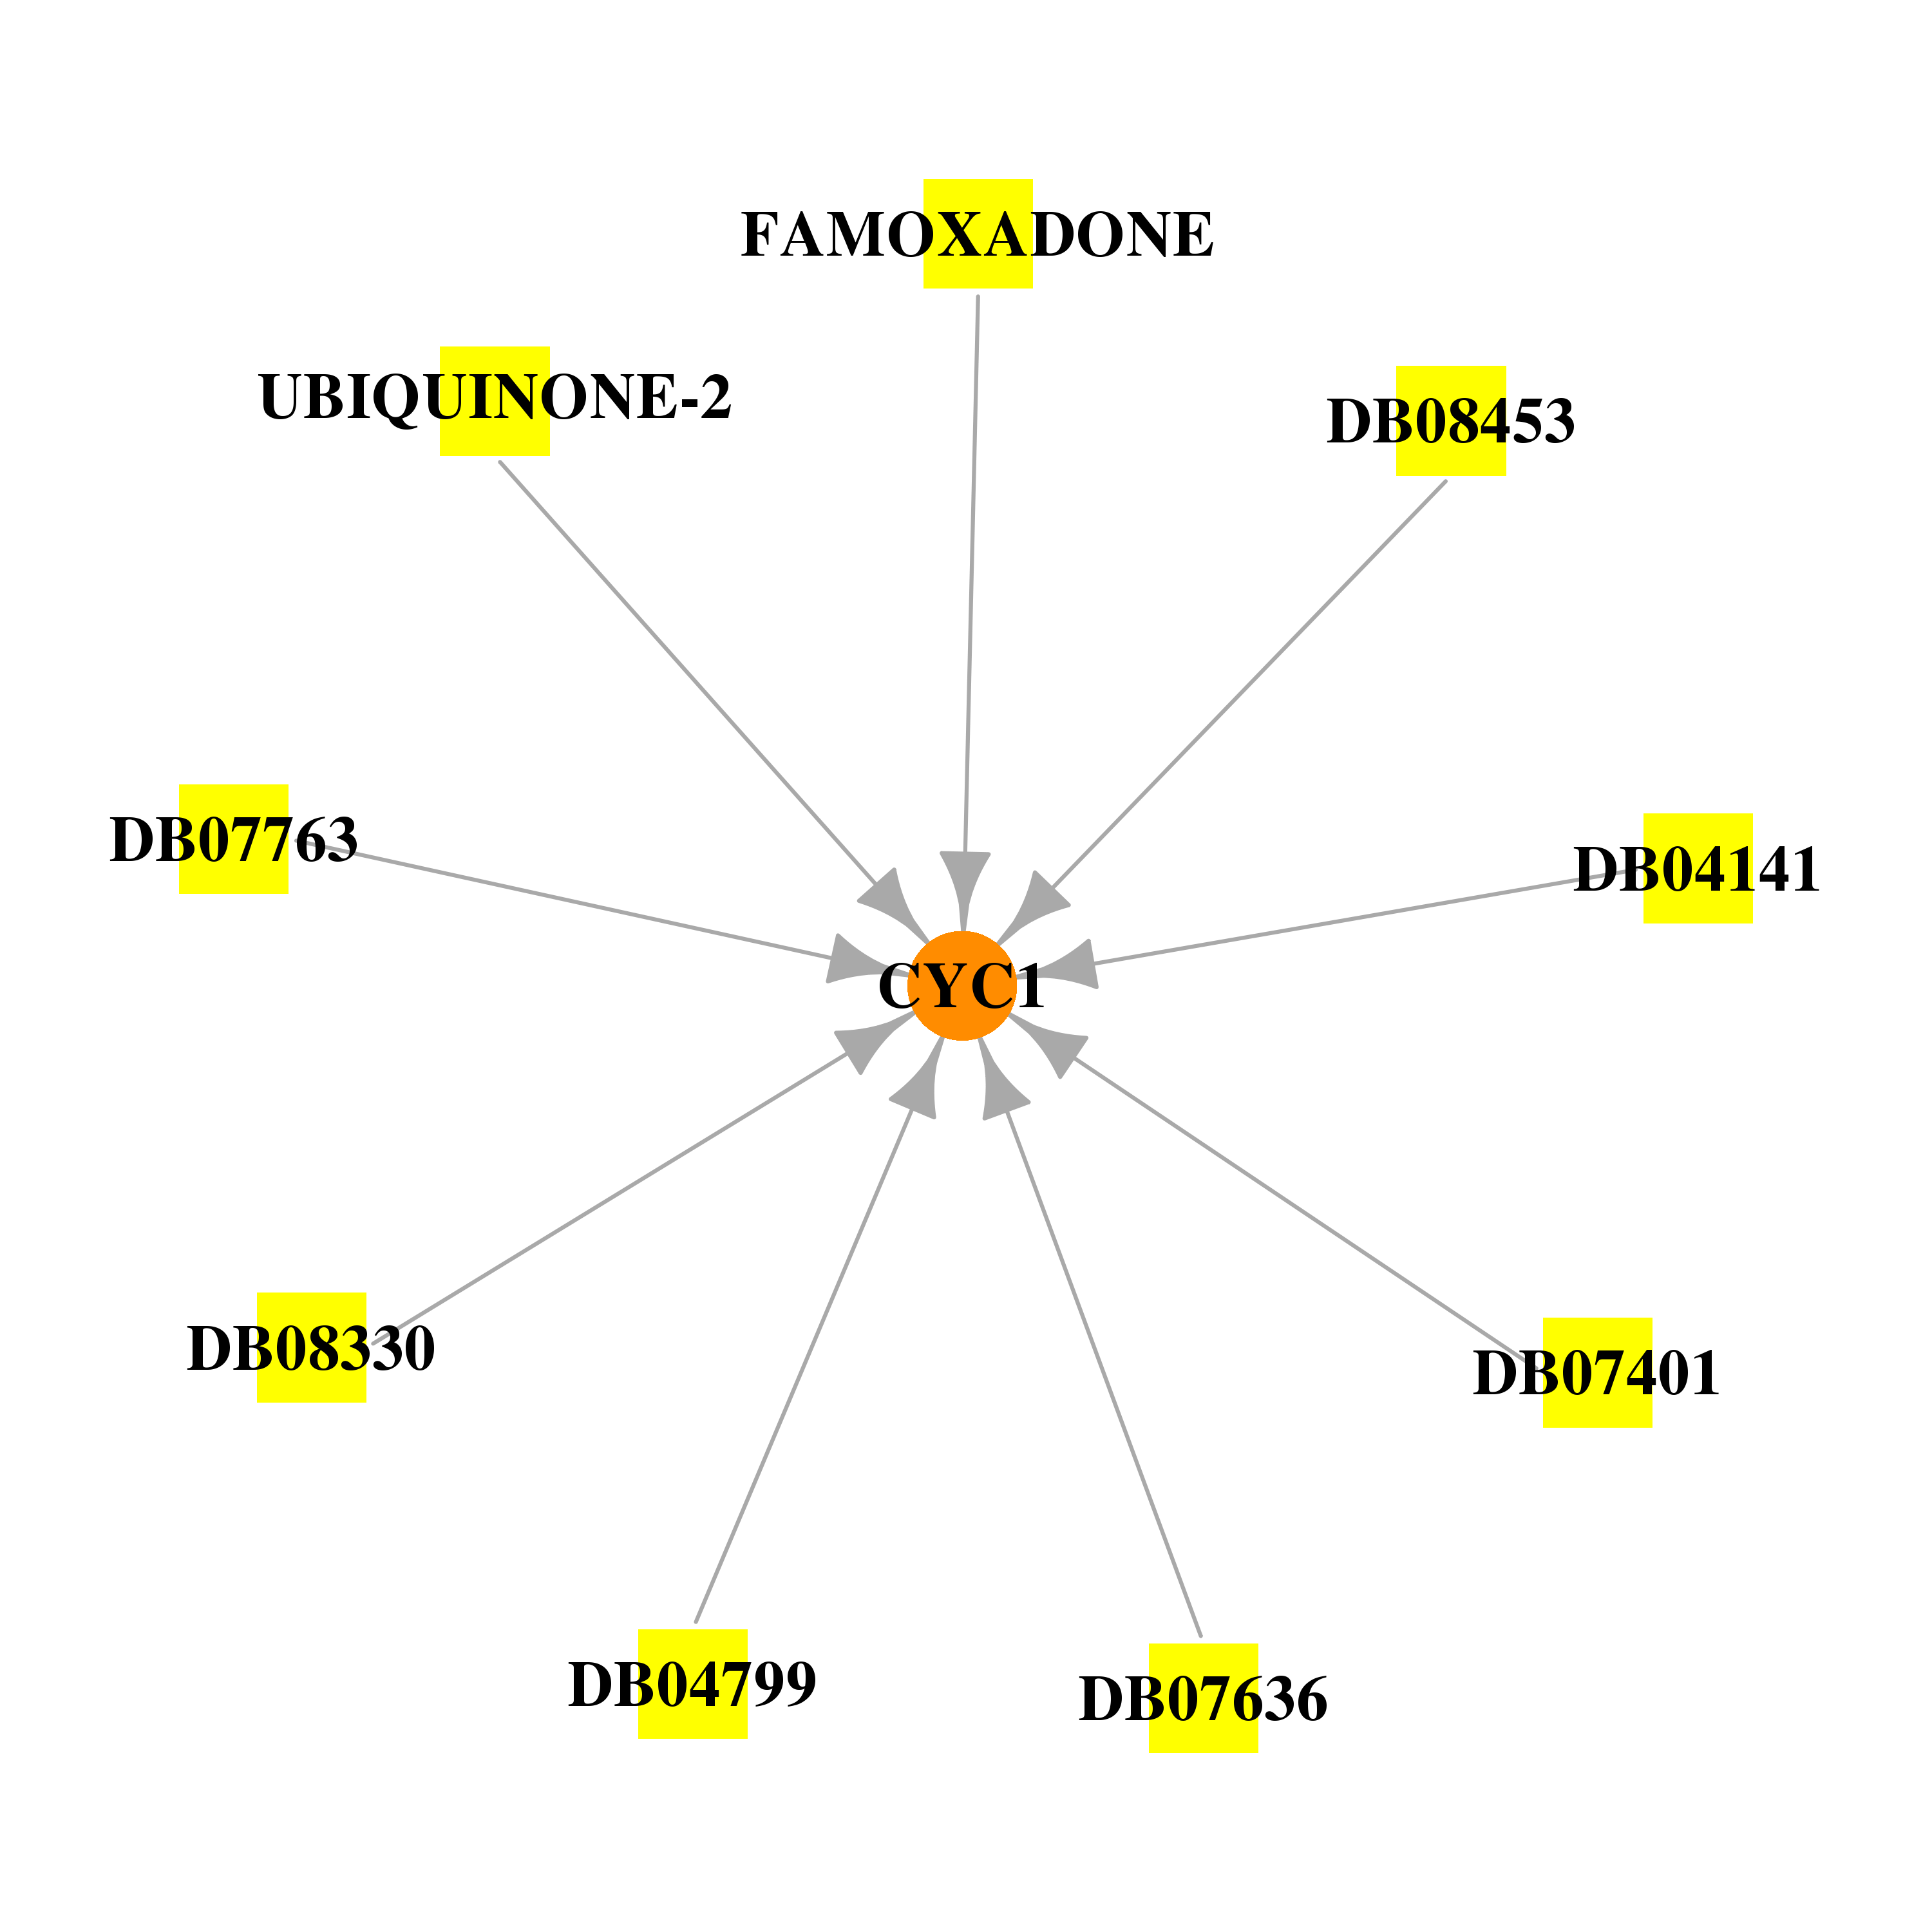 |
| * Drug Centered Interaction Network. |
| DrugBank ID | Target Name | Drug Groups | Generic Name | Drug Centered Network | Drug Structure |
| DB04141 | cytochrome c-1 | experimental | 2-Hexyloxy-6-Hydroxymethyl-Tetrahydro-Pyran-3,4,5-Triol | 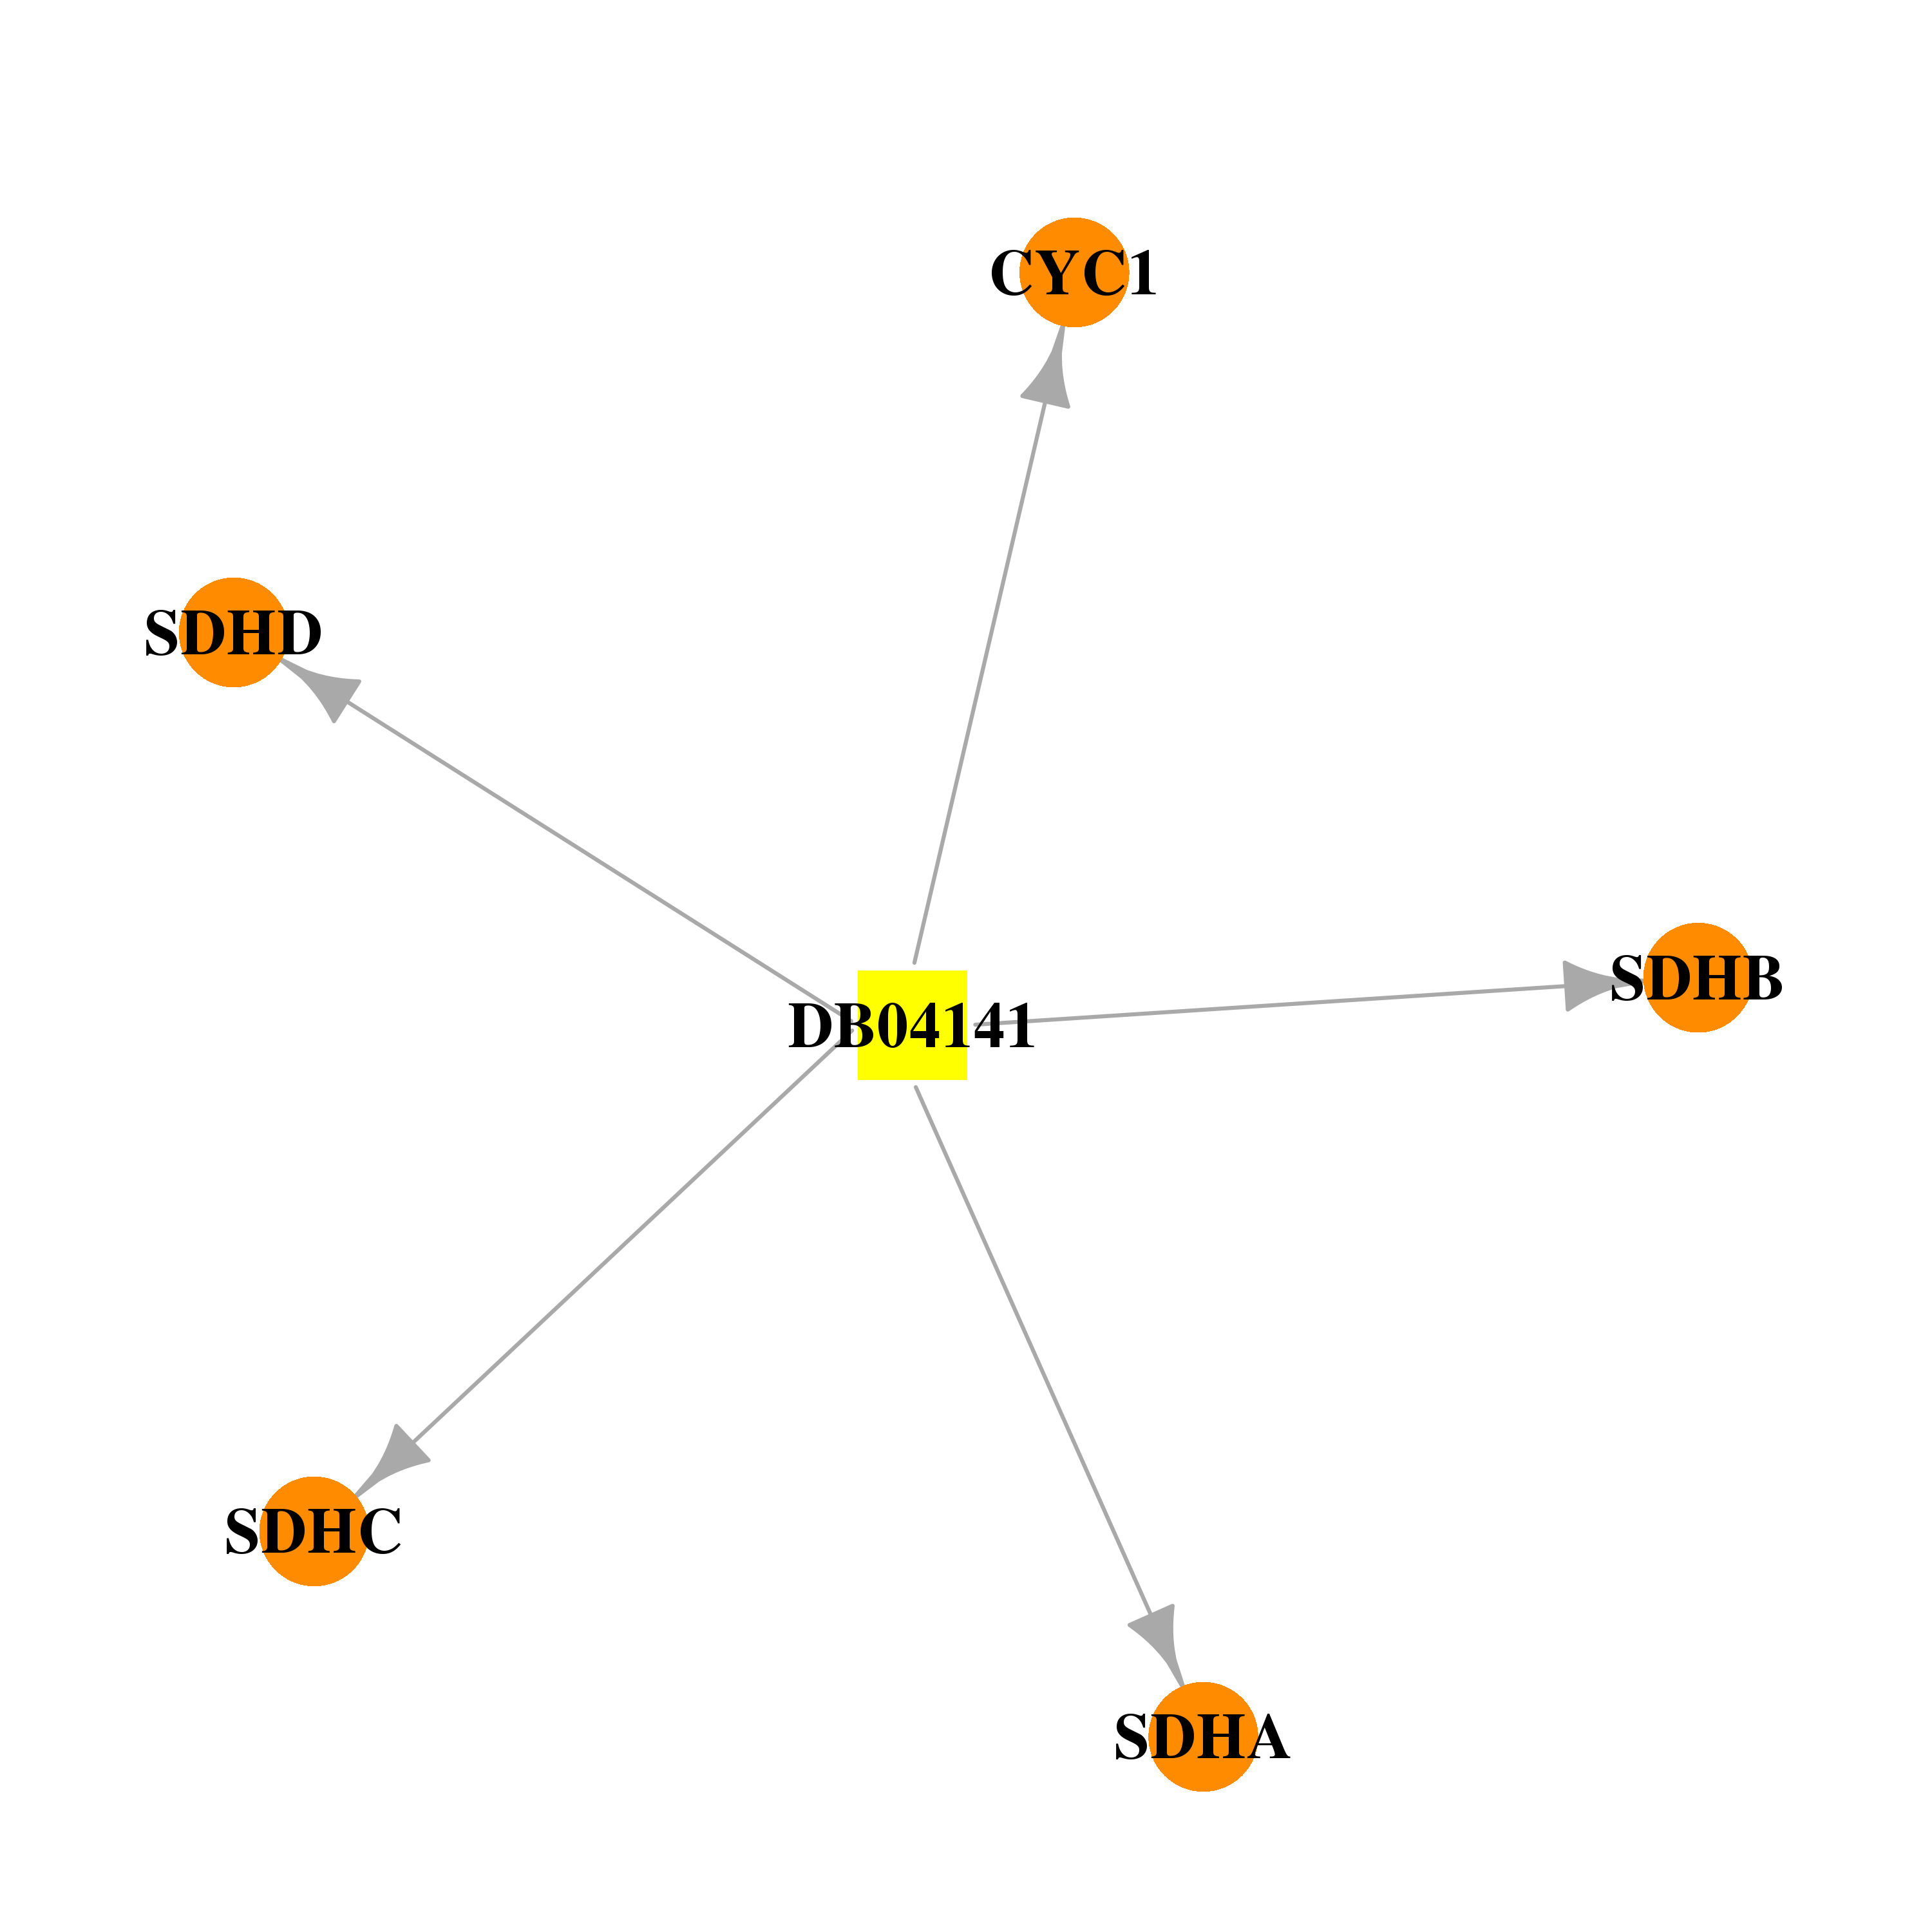 | 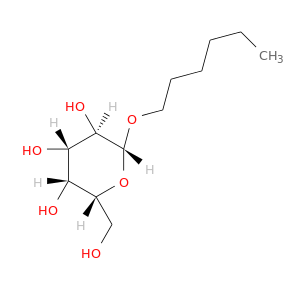 |
| DB04799 | cytochrome c-1 | experimental | 5-n-undecyl-6-hydroxy-4,7-dioxobenzothiazole |  | 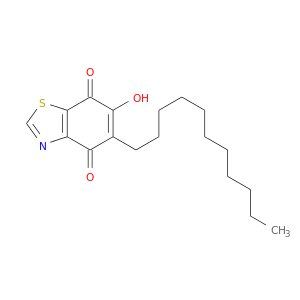 |
| DB07401 | cytochrome c-1 | experimental | METHYL (2Z)-2-(2-{[6-(2-CYANOPHENOXY)PYRIMIDIN-4-YL]OXY}PHENYL)-3-METHOXYACRYLATE |  | 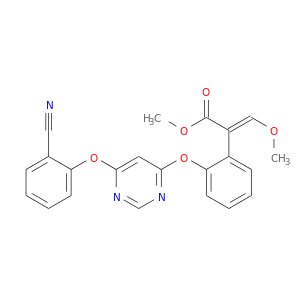 |
| DB07636 | cytochrome c-1 | experimental | 5-HEPTYL-6-HYDROXY-1,3-BENZOTHIAZOLE-4,7-DIONE |  | 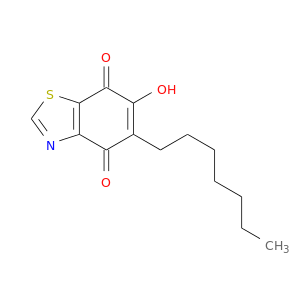 |
| DB07763 | cytochrome c-1 | experimental | (5S)-3-ANILINO-5-(2,4-DIFLUOROPHENYL)-5-METHYL-1,3-OXAZOLIDINE-2,4-DIONE | 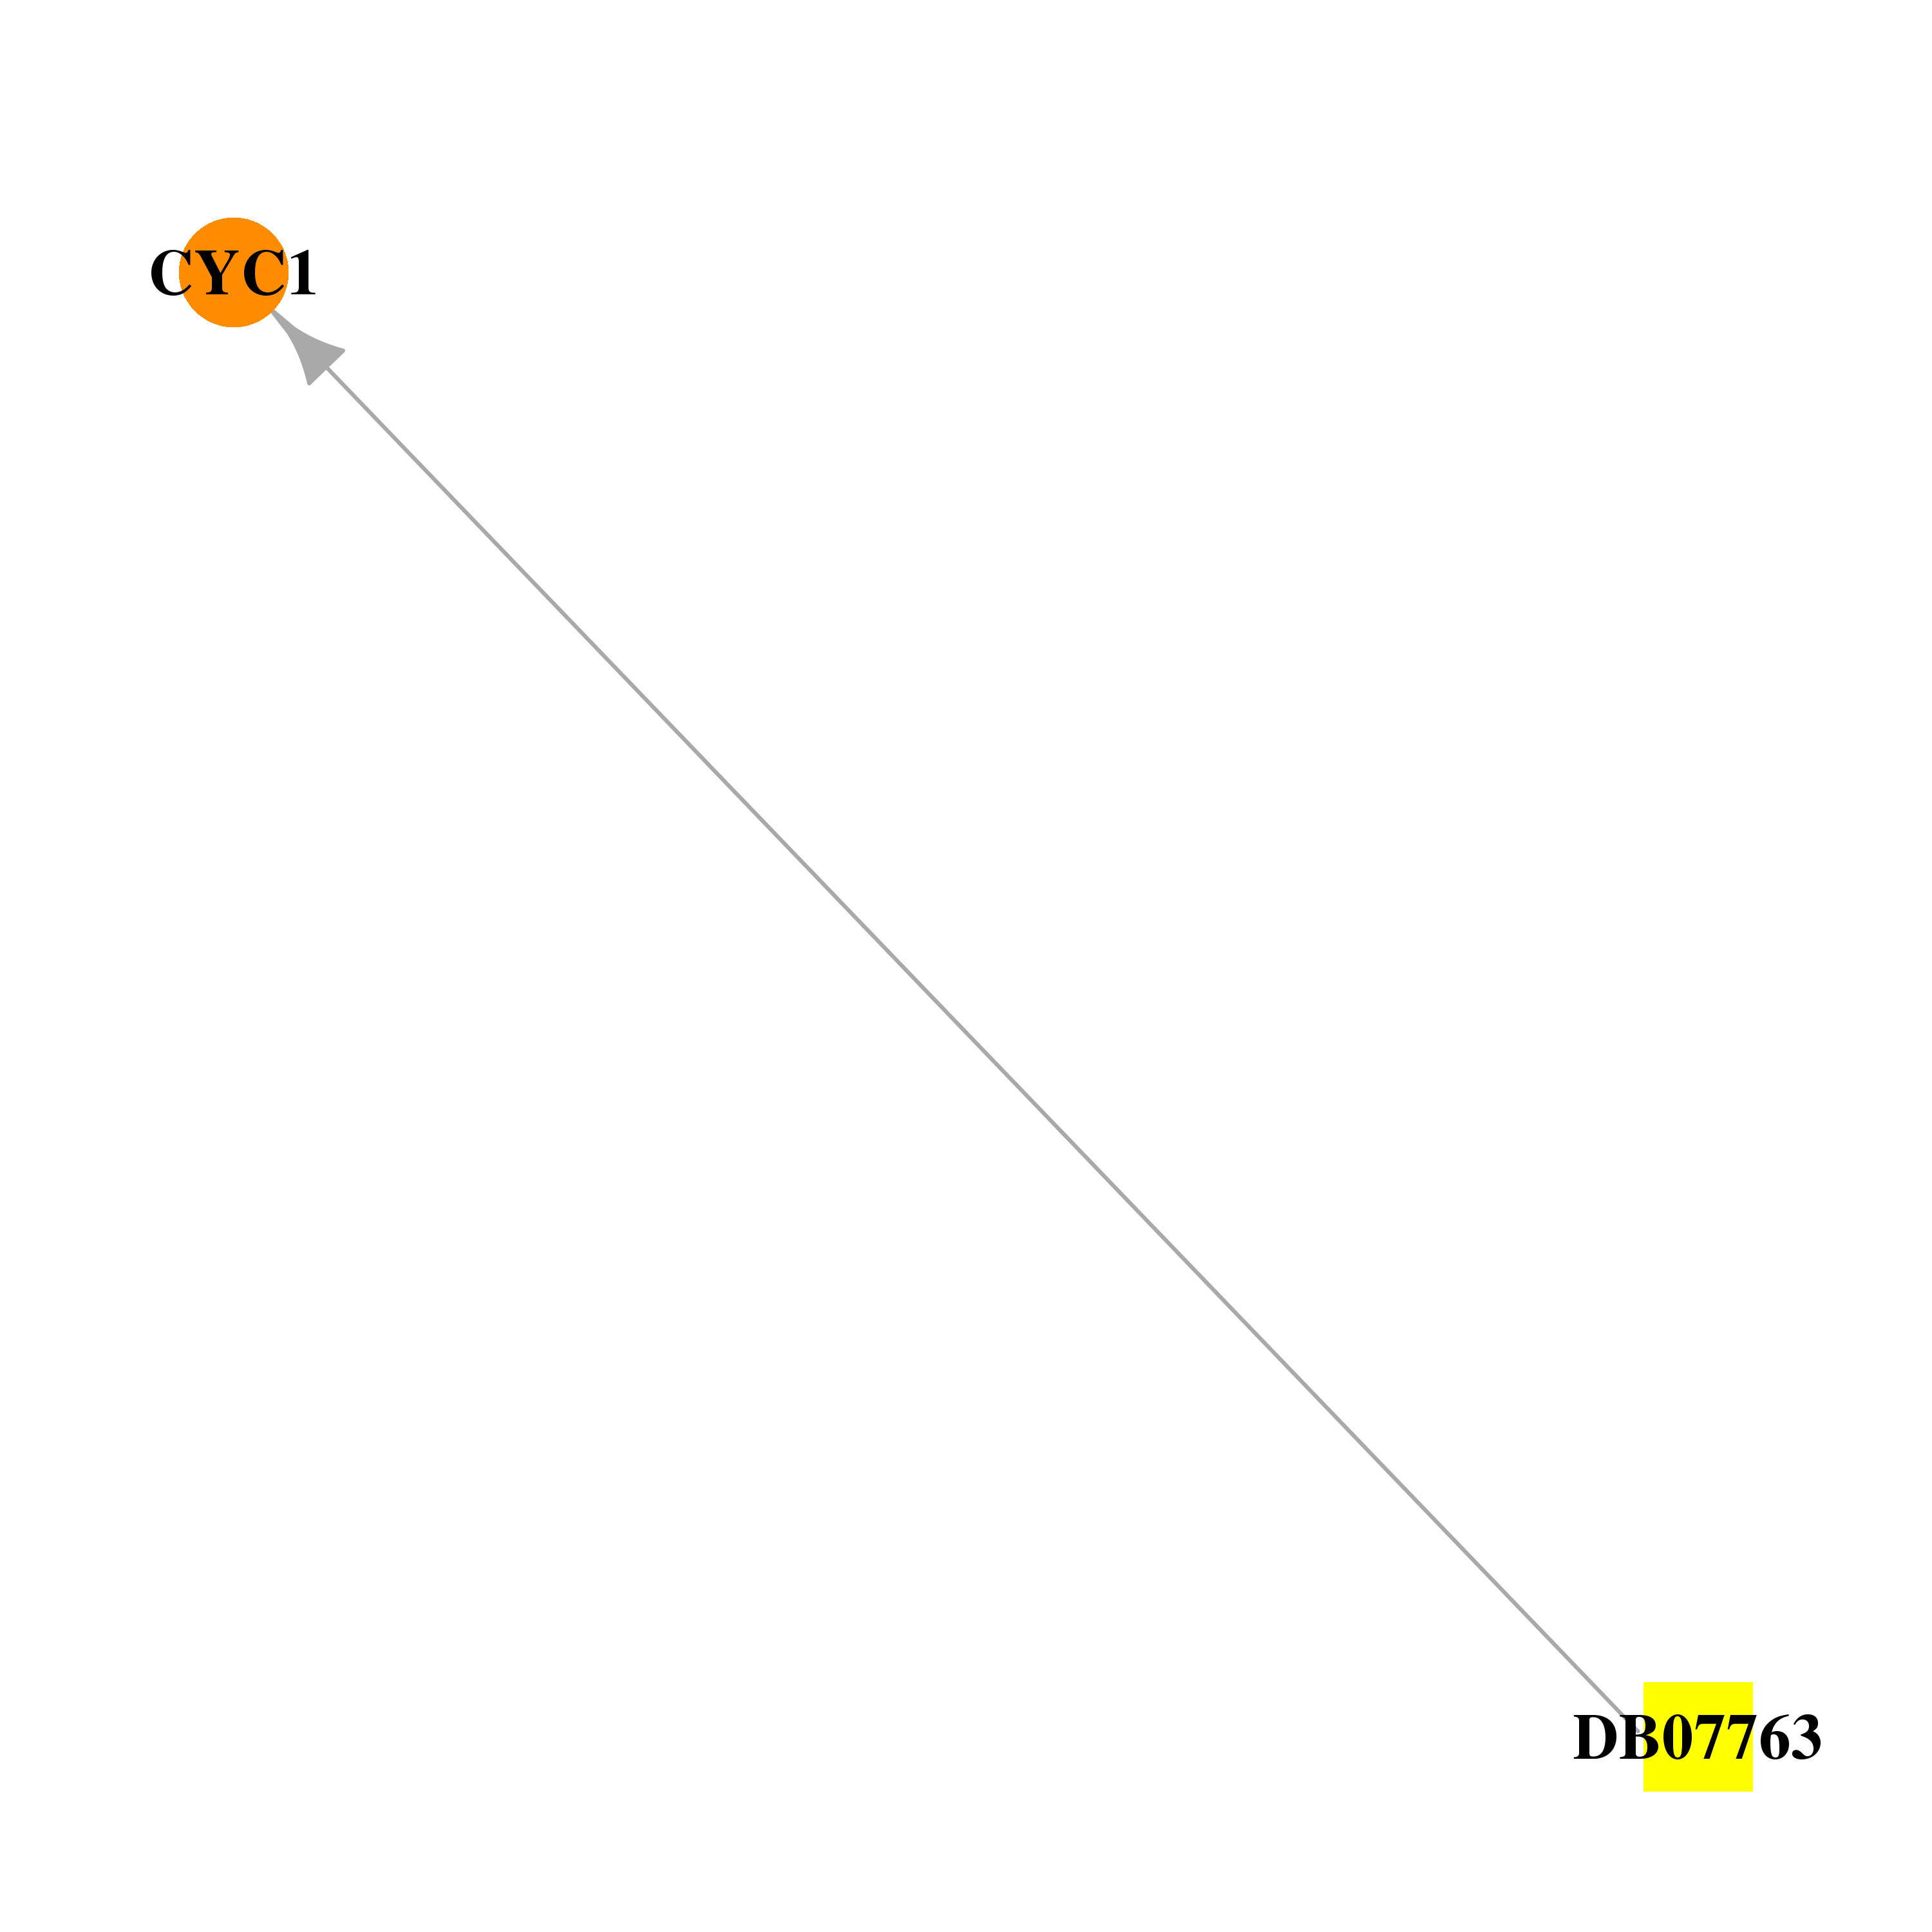 | 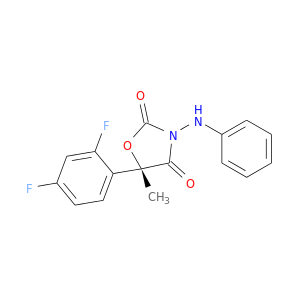 |
| DB07778 | cytochrome c-1 | experimental | FAMOXADONE | 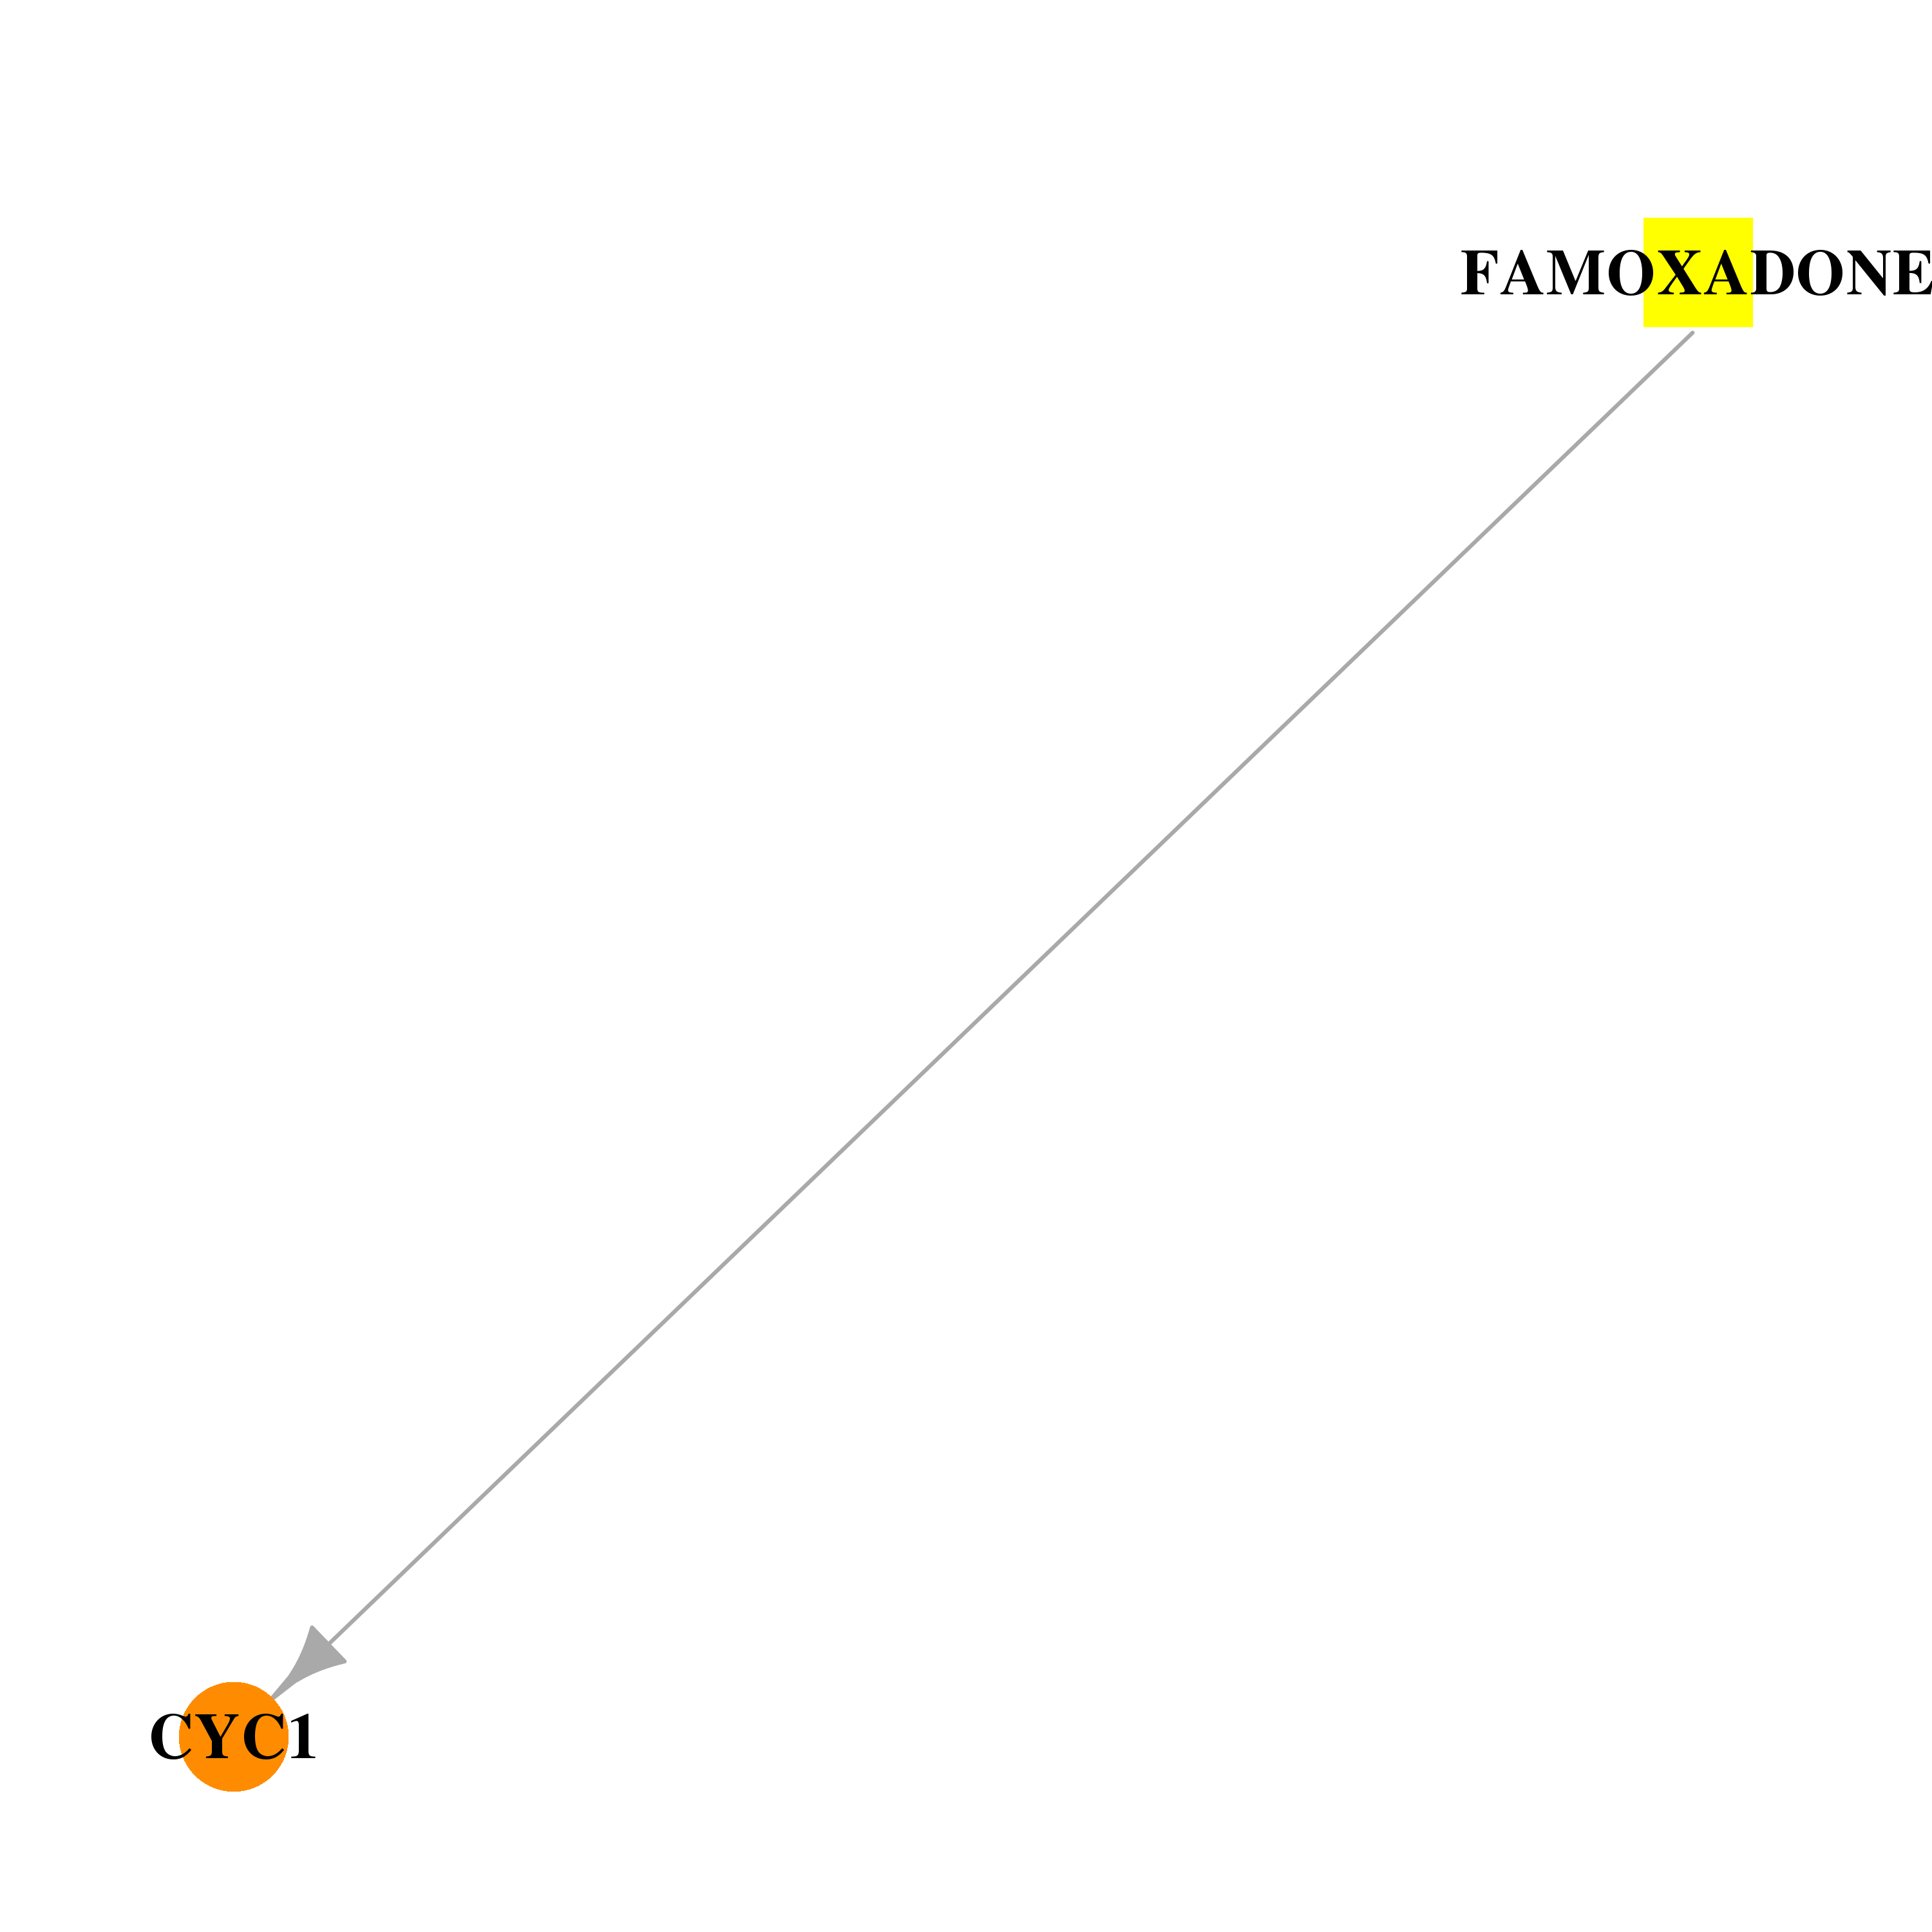 | 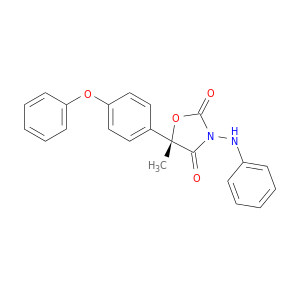 |
| DB08330 | cytochrome c-1 | experimental | METHYL (2Z)-3-METHOXY-2-{2-[(E)-2-PHENYLVINYL]PHENYL}ACRYLATE |  | 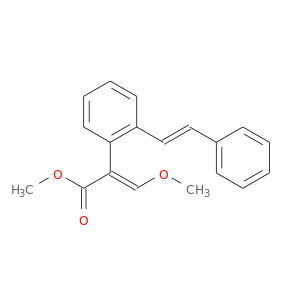 |
| DB08453 | cytochrome c-1 | experimental | 2-NONYL-4-HYDROXYQUINOLINE N-OXIDE |  | 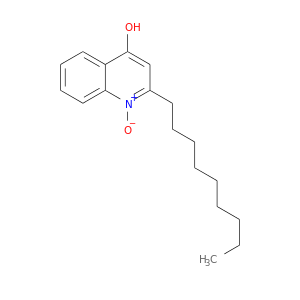 |
| DB08690 | cytochrome c-1 | experimental | UBIQUINONE-2 |  | 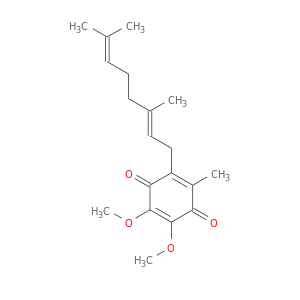 |
| Top |
| Cross referenced IDs for CYC1 |
| * We obtained these cross-references from Uniprot database. It covers 150 different DBs, 18 categories. http://www.uniprot.org/help/cross_references_section |
: Open all cross reference information
|
Copyright © 2016-Present - The Univsersity of Texas Health Science Center at Houston @ |