|
||||||||||||||||||||||||||||||||||||||||||||||||||||||||||||||||||||||||||||||||||||||||||||||||||||||||||||||||||||||||||||||||||||||||||||||||||||||||||||||||||||||||||||||||||||||||||||||||||||||||||||||||||||||||||||||||||||||||||||||||||||||||||||||||||||||||||||||||||||||||||||||||||||||||||||||||||||||||||
| |
| Phenotypic Information (metabolism pathway, cancer, disease, phenome) |
| |
| |
| Gene-Gene Network Information: Co-Expression Network, Interacting Genes & KEGG |
| |
|


| Gene Summary for MBOAT1 |
| Basic gene info. | Gene symbol | MBOAT1 |
| Gene name | membrane bound O-acyltransferase domain containing 1 | |
| Synonyms | 1|LPEAT1|LPLAT|LPLAT 1|LPSAT|OACT1|dJ434O11.1 | |
| Cytomap | UCSC genome browser: 6p22.3 | |
| Genomic location | chr6 :20100934-20212670 | |
| Type of gene | protein-coding | |
| RefGenes | NM_001080480.2, NR_073465.1, | |
| Ensembl id | ENSG00000172197 | |
| Description | 1-acylglycerophosphoserine O-acyltransferaseO-acyltransferase (membrane bound) domain containing 1O-acyltransferase domain-containing protein 1lyso-PS acyltransferaselysophosphatidylethanolamine acyltransferase 1lysophosphatidylserine acyltransferase | |
| Modification date | 20141207 | |
| dbXrefs | MIM : 611732 | |
| HGNC : HGNC | ||
| Protein | UniProt: go to UniProt's Cross Reference DB Table | |
| Expression | CleanEX: HS_MBOAT1 | |
| BioGPS: 154141 | ||
| Gene Expression Atlas: ENSG00000172197 | ||
| The Human Protein Atlas: ENSG00000172197 | ||
| Pathway | NCI Pathway Interaction Database: MBOAT1 | |
| KEGG: MBOAT1 | ||
| REACTOME: MBOAT1 | ||
| ConsensusPathDB | ||
| Pathway Commons: MBOAT1 | ||
| Metabolism | MetaCyc: MBOAT1 | |
| HUMANCyc: MBOAT1 | ||
| Regulation | Ensembl's Regulation: ENSG00000172197 | |
| miRBase: chr6 :20,100,934-20,212,670 | ||
| TargetScan: NM_001080480 | ||
| cisRED: ENSG00000172197 | ||
| Context | iHOP: MBOAT1 | |
| cancer metabolism search in PubMed: MBOAT1 | ||
| UCL Cancer Institute: MBOAT1 | ||
| Assigned class in ccmGDB | C | |
| Top |
| Phenotypic Information for MBOAT1(metabolism pathway, cancer, disease, phenome) |
| Cancer | CGAP: MBOAT1 |
| Familial Cancer Database: MBOAT1 | |
| * This gene is included in those cancer gene databases. |
|
|
|
|
|
|
| ||||||||||||||||||||||||||||||||||||||||||||||||||||||||||||||||||||||||||||||||||||||||||||||||||||||||||||||||||||||||||||||||||||||||||||||||||||||||||||||||||||||||||||||||||||||||||||||||||||||||||||||||||||||||||||||||||||||||||||||||||||||||||||||||||||||||||||||||||||||||||||||||||||||||||||||||||||
Oncogene 1 | Significant driver gene in | |||||||||||||||||||||||||||||||||||||||||||||||||||||||||||||||||||||||||||||||||||||||||||||||||||||||||||||||||||||||||||||||||||||||||||||||||||||||||||||||||||||||||||||||||||||||||||||||||||||||||||||||||||||||||||||||||||||||||||||||||||||||||||||||||||||||||||||||||||||||||||||||||||||||||||||||||||||||||
| cf) number; DB name 1 Oncogene; http://nar.oxfordjournals.org/content/35/suppl_1/D721.long, 2 Tumor Suppressor gene; https://bioinfo.uth.edu/TSGene/, 3 Cancer Gene Census; http://www.nature.com/nrc/journal/v4/n3/abs/nrc1299.html, 4 CancerGenes; http://nar.oxfordjournals.org/content/35/suppl_1/D721.long, 5 Network of Cancer Gene; http://ncg.kcl.ac.uk/index.php, 1Therapeutic Vulnerabilities in Cancer; http://cbio.mskcc.org/cancergenomics/statius/ |
| KEGG_GLYCEROLIPID_METABOLISM KEGG_GLYCEROPHOSPHOLIPID_METABOLISM REACTOME_PHOSPHOLIPID_METABOLISM REACTOME_METABOLISM_OF_LIPIDS_AND_LIPOPROTEINS | |
| OMIM | |
| Orphanet | |
| Disease | KEGG Disease: MBOAT1 |
| MedGen: MBOAT1 (Human Medical Genetics with Condition) | |
| ClinVar: MBOAT1 | |
| Phenotype | MGI: MBOAT1 (International Mouse Phenotyping Consortium) |
| PhenomicDB: MBOAT1 | |
| Mutations for MBOAT1 |
| * Under tables are showing count per each tissue to give us broad intuition about tissue specific mutation patterns.You can go to the detailed page for each mutation database's web site. |
| - Statistics for Tissue and Mutation type | Top |
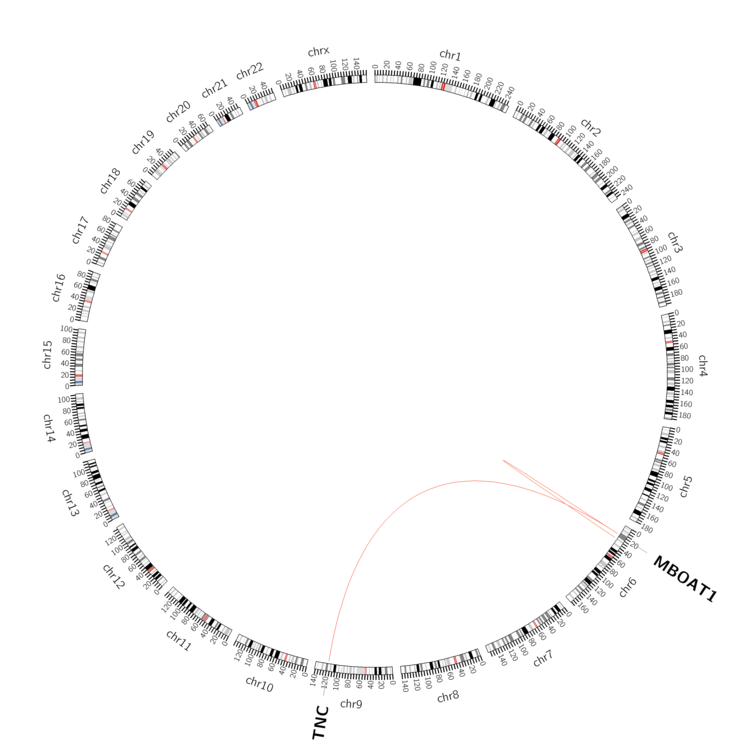 |
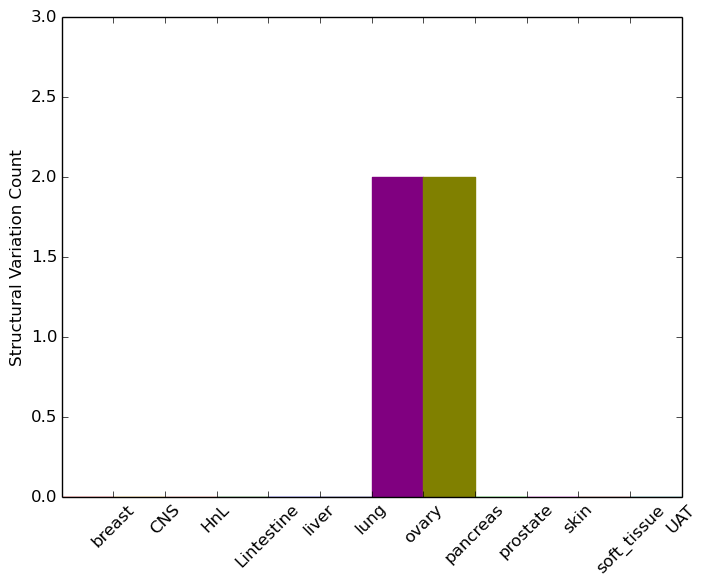
| - For Inter-chromosomal Variations |
| * Inter-chromosomal variantions includes 'interchromosomal amplicon to amplicon', 'interchromosomal amplicon to non-amplified dna', 'interchromosomal insertion', 'Interchromosomal unknown type'. |
 |
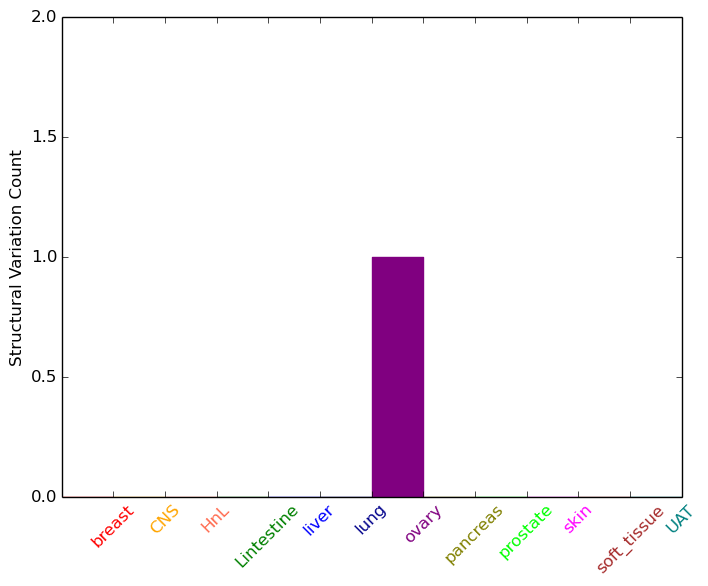
| - For Intra-chromosomal Variations |
| * Intra-chromosomal variantions includes 'intrachromosomal amplicon to amplicon', 'intrachromosomal amplicon to non-amplified dna', 'intrachromosomal deletion', 'intrachromosomal fold-back inversion', 'intrachromosomal inversion', 'intrachromosomal tandem duplication', 'Intrachromosomal unknown type', 'intrachromosomal with inverted orientation', 'intrachromosomal with non-inverted orientation'. |
 |
| Sample | Symbol_a | Chr_a | Start_a | End_a | Symbol_b | Chr_b | Start_b | End_b |
| ovary | MBOAT1 | chr6 | 20111928 | 20112128 | TNC | chr9 | 117857870 | 117858070 |
| ovary | MBOAT1 | chr6 | 20111948 | 20112148 | TNC | chr9 | 117857868 | 117858068 |
| ovary | MBOAT1 | chr6 | 20162246 | 20162266 | chr6 | 28918212 | 28918232 | |
| pancreas | MBOAT1 | chr6 | 20111972 | 20112172 | TNC | chr9 | 117857825 | 117858025 |
| pancreas | MBOAT1 | chr6 | 20112026 | 20112226 | TNC | chr9 | 117857662 | 117857862 |
| cf) Tissue number; Tissue name (1;Breast, 2;Central_nervous_system, 3;Haematopoietic_and_lymphoid_tissue, 4;Large_intestine, 5;Liver, 6;Lung, 7;Ovary, 8;Pancreas, 9;Prostate, 10;Skin, 11;Soft_tissue, 12;Upper_aerodigestive_tract) |
| * From mRNA Sanger sequences, Chitars2.0 arranged chimeric transcripts. This table shows MBOAT1 related fusion information. |
| ID | Head Gene | Tail Gene | Accession | Gene_a | qStart_a | qEnd_a | Chromosome_a | tStart_a | tEnd_a | Gene_a | qStart_a | qEnd_a | Chromosome_a | tStart_a | tEnd_a |
| AJ705329 | MBOAT1 | 1 | 186 | 6 | 20124933 | 20125119 | RPL37 | 180 | 374 | 5 | 40832556 | 40834357 | |
| Top |
| Mutation type/ Tissue ID | brca | cns | cerv | endome | haematopo | kidn | Lintest | liver | lung | ns | ovary | pancre | prost | skin | stoma | thyro | urina | |||
| Total # sample | 5 | 1 | 1 | 5 | ||||||||||||||||
| GAIN (# sample) | 5 | 1 | 5 | |||||||||||||||||
| LOSS (# sample) | 1 |
| cf) Tissue ID; Tissue type (1; Breast, 2; Central_nervous_system, 3; Cervix, 4; Endometrium, 5; Haematopoietic_and_lymphoid_tissue, 6; Kidney, 7; Large_intestine, 8; Liver, 9; Lung, 10; NS, 11; Ovary, 12; Pancreas, 13; Prostate, 14; Skin, 15; Stomach, 16; Thyroid, 17; Urinary_tract) |
| Top |
|
 |
| Top |
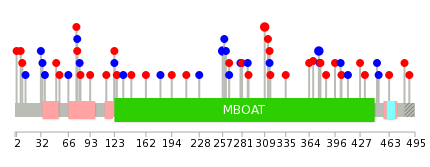
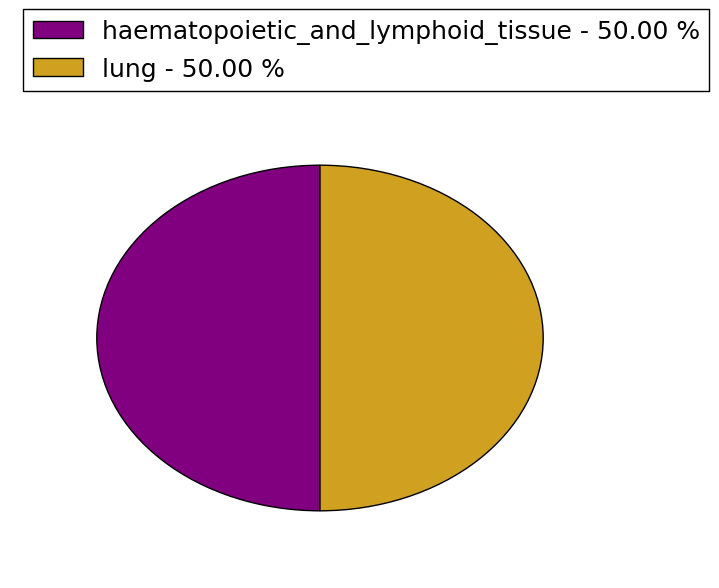
| Stat. for Non-Synonymous SNVs (# total SNVs=34) | (# total SNVs=20) |
 | 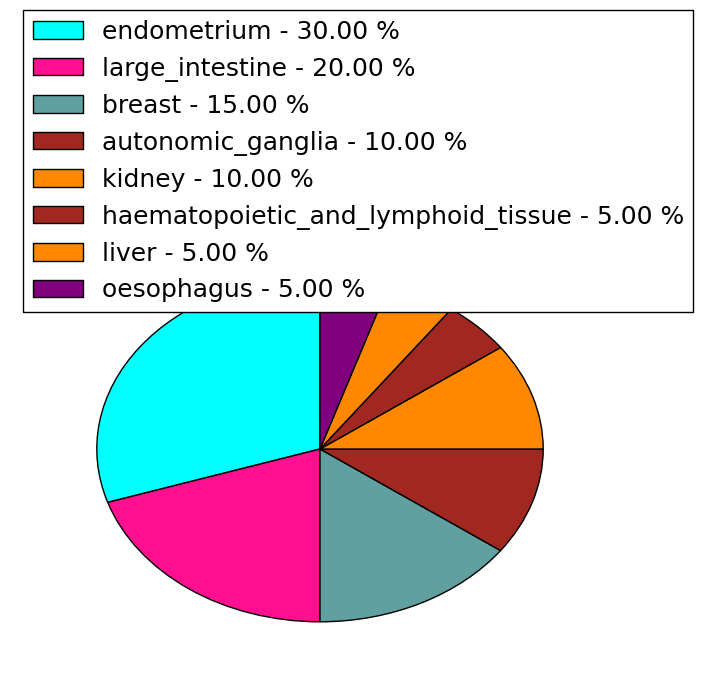 |
(# total SNVs=2) | (# total SNVs=1) |
 | 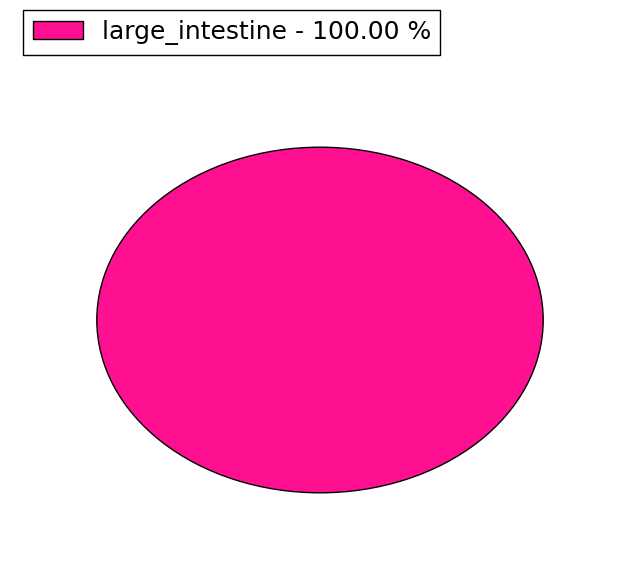 |
| Top |
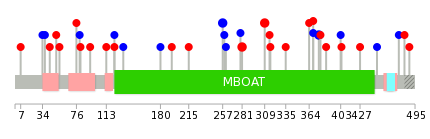
| * When you move the cursor on each content, you can see more deailed mutation information on the Tooltip. Those are primary_site,primary_histology,mutation(aa),pubmedID. |
| GRCh37 position | Mutation(aa) | Unique sampleID count |
| chr6:20152869-20152869 | p.I77I | 2 |
| chr6:20124775-20124775 | p.T257T | 2 |
| chr6:20118754-20118754 | p.A309T | 2 |
| chr6:20113188-20113188 | p.L376L | 2 |
| chr6:20128943-20128943 | p.R173* | 2 |
| chr6:20152860-20152860 | p.F80F | 1 |
| chr6:20113225-20113225 | p.R364Q | 1 |
| chr6:20124709-20124709 | p.P279P | 1 |
| chr6:20212427-20212427 | p.R13R | 1 |
| chr6:20128975-20128975 | p.R162Q | 1 |
| Top |
|
 |
| Point Mutation/ Tissue ID | 1 | 2 | 3 | 4 | 5 | 6 | 7 | 8 | 9 | 10 | 11 | 12 | 13 | 14 | 15 | 16 | 17 | 18 | 19 | 20 |
| # sample | 1 | 3 | 9 | 1 | 3 | 2 | 4 | 1 | 1 | 7 | 9 | |||||||||
| # mutation | 1 | 3 | 8 | 1 | 3 | 2 | 4 | 1 | 1 | 7 | 11 | |||||||||
| nonsynonymous SNV | 1 | 7 | 1 | 2 | 3 | 1 | 5 | 5 | ||||||||||||
| synonymous SNV | 1 | 2 | 1 | 1 | 2 | 1 | 1 | 2 | 6 |
| cf) Tissue ID; Tissue type (1; BLCA[Bladder Urothelial Carcinoma], 2; BRCA[Breast invasive carcinoma], 3; CESC[Cervical squamous cell carcinoma and endocervical adenocarcinoma], 4; COAD[Colon adenocarcinoma], 5; GBM[Glioblastoma multiforme], 6; Glioma Low Grade, 7; HNSC[Head and Neck squamous cell carcinoma], 8; KICH[Kidney Chromophobe], 9; KIRC[Kidney renal clear cell carcinoma], 10; KIRP[Kidney renal papillary cell carcinoma], 11; LAML[Acute Myeloid Leukemia], 12; LUAD[Lung adenocarcinoma], 13; LUSC[Lung squamous cell carcinoma], 14; OV[Ovarian serous cystadenocarcinoma ], 15; PAAD[Pancreatic adenocarcinoma], 16; PRAD[Prostate adenocarcinoma], 17; SKCM[Skin Cutaneous Melanoma], 18:STAD[Stomach adenocarcinoma], 19:THCA[Thyroid carcinoma], 20:UCEC[Uterine Corpus Endometrial Carcinoma]) |
| Top |
| * We represented just top 10 SNVs. When you move the cursor on each content, you can see more deailed mutation information on the Tooltip. Those are primary_site, primary_histology, mutation(aa), pubmedID. |
| Genomic Position | Mutation(aa) | Unique sampleID count |
| chr6:20113188 | p.A309T | 2 |
| chr6:20124775 | p.R281Q | 2 |
| chr6:20118754 | p.T257T | 2 |
| chr6:20124704 | p.L376L | 2 |
| chr6:20124709 | p.V113A | 1 |
| chr6:20151460 | p.R364Q | 1 |
| chr6:20113183 | p.M93I | 1 |
| chr6:20124763 | p.K335R | 1 |
| chr6:20152858 | p.G81D | 1 |
| chr6:20124769 | p.G316R | 1 |
| * Copy number data were extracted from TCGA using R package TCGA-Assembler. The URLs of all public data files on TCGA DCC data server were gathered on Jan-05-2015. Function ProcessCNAData in TCGA-Assembler package was used to obtain gene-level copy number value which is calculated as the average copy number of the genomic region of a gene. |
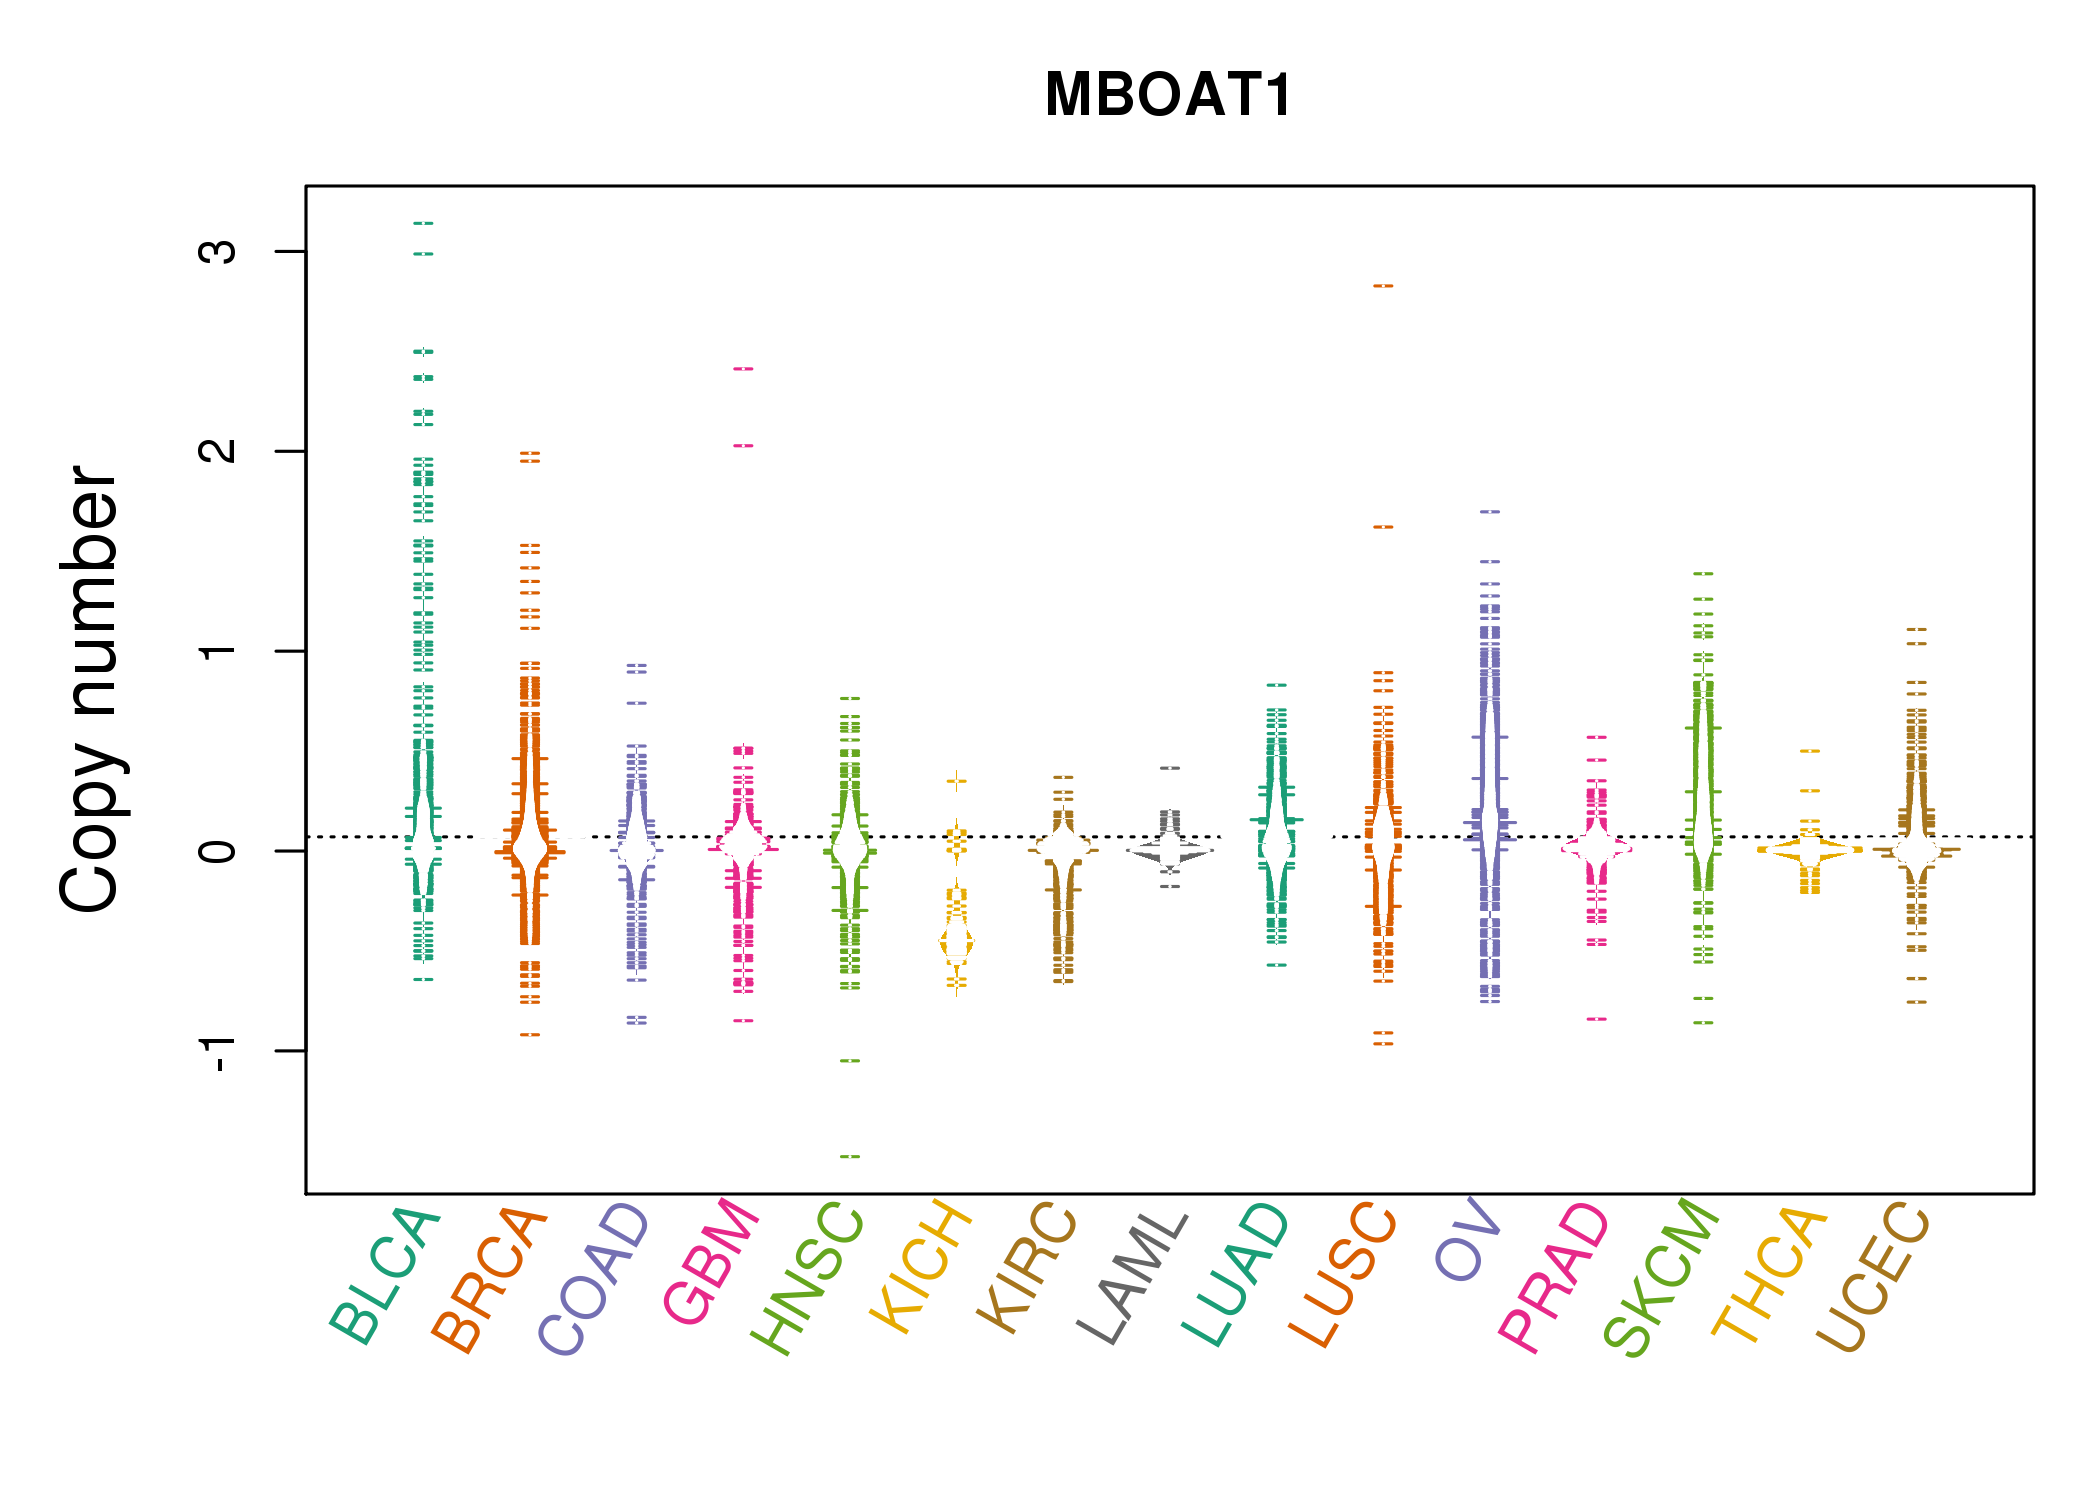 |
| cf) Tissue ID[Tissue type]: BLCA[Bladder Urothelial Carcinoma], BRCA[Breast invasive carcinoma], CESC[Cervical squamous cell carcinoma and endocervical adenocarcinoma], COAD[Colon adenocarcinoma], GBM[Glioblastoma multiforme], Glioma Low Grade, HNSC[Head and Neck squamous cell carcinoma], KICH[Kidney Chromophobe], KIRC[Kidney renal clear cell carcinoma], KIRP[Kidney renal papillary cell carcinoma], LAML[Acute Myeloid Leukemia], LUAD[Lung adenocarcinoma], LUSC[Lung squamous cell carcinoma], OV[Ovarian serous cystadenocarcinoma ], PAAD[Pancreatic adenocarcinoma], PRAD[Prostate adenocarcinoma], SKCM[Skin Cutaneous Melanoma], STAD[Stomach adenocarcinoma], THCA[Thyroid carcinoma], UCEC[Uterine Corpus Endometrial Carcinoma] |
| Top |
| Gene Expression for MBOAT1 |
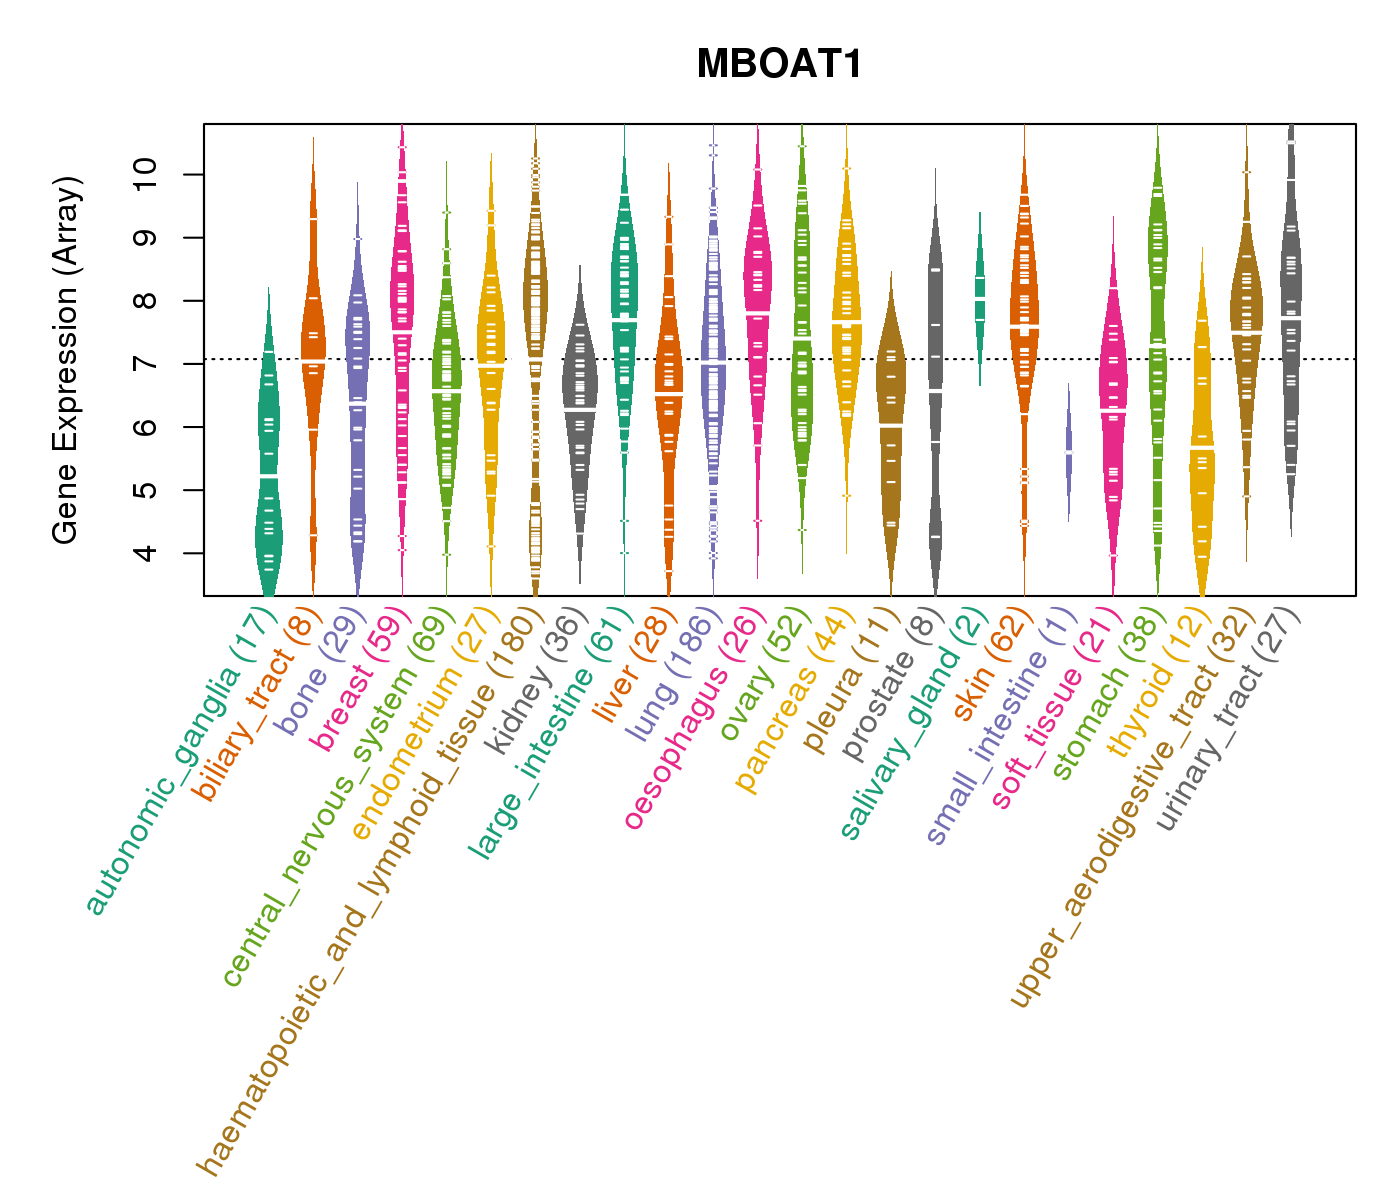
| * CCLE gene expression data were extracted from CCLE_Expression_Entrez_2012-10-18.res: Gene-centric RMA-normalized mRNA expression data. |
 |
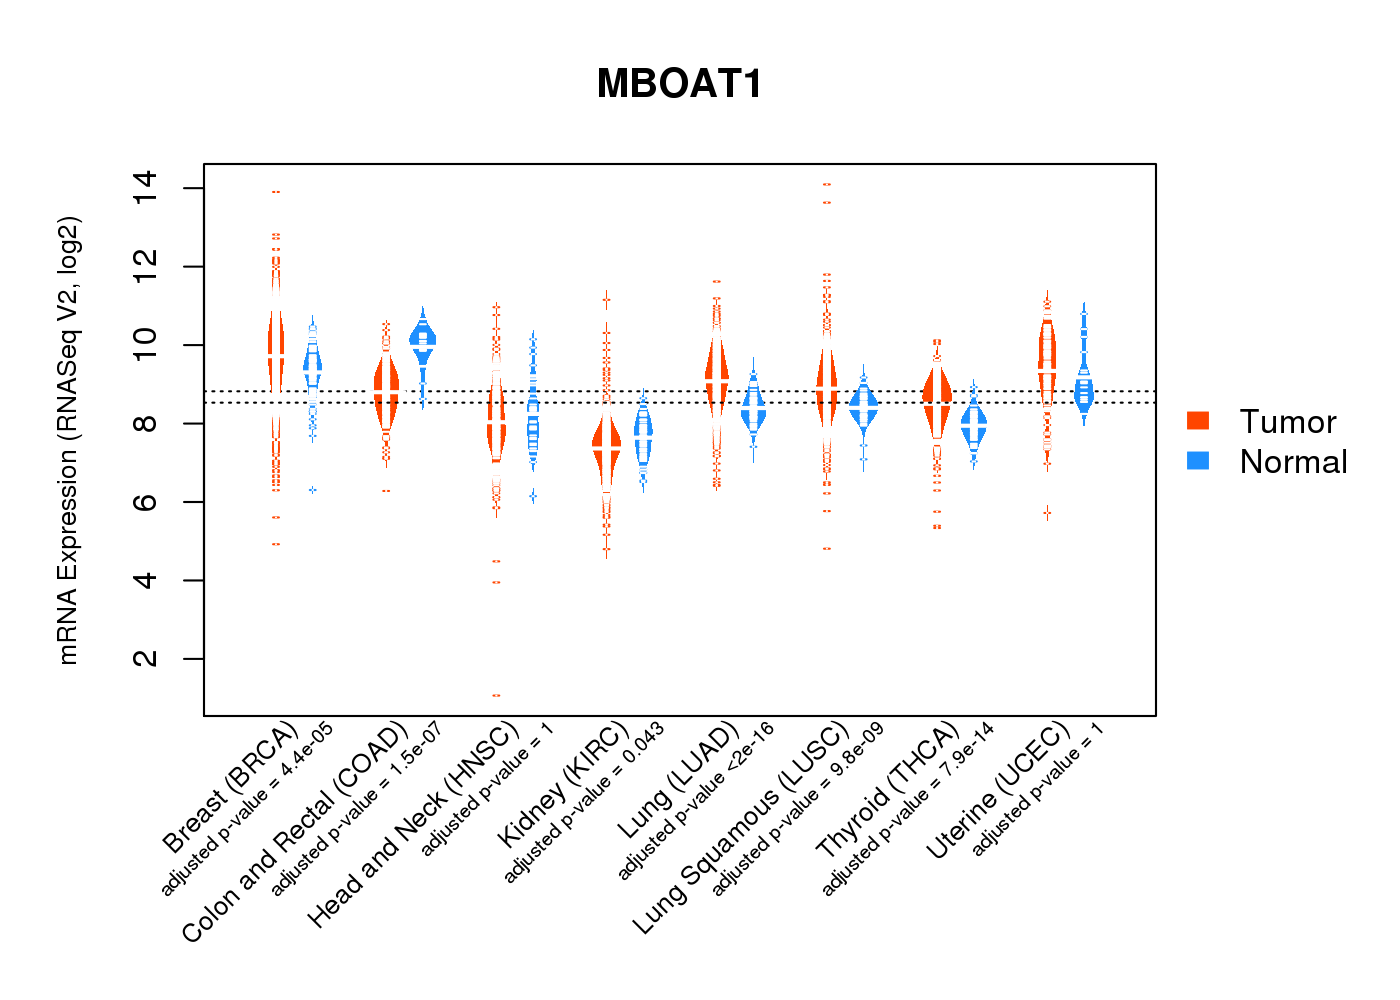
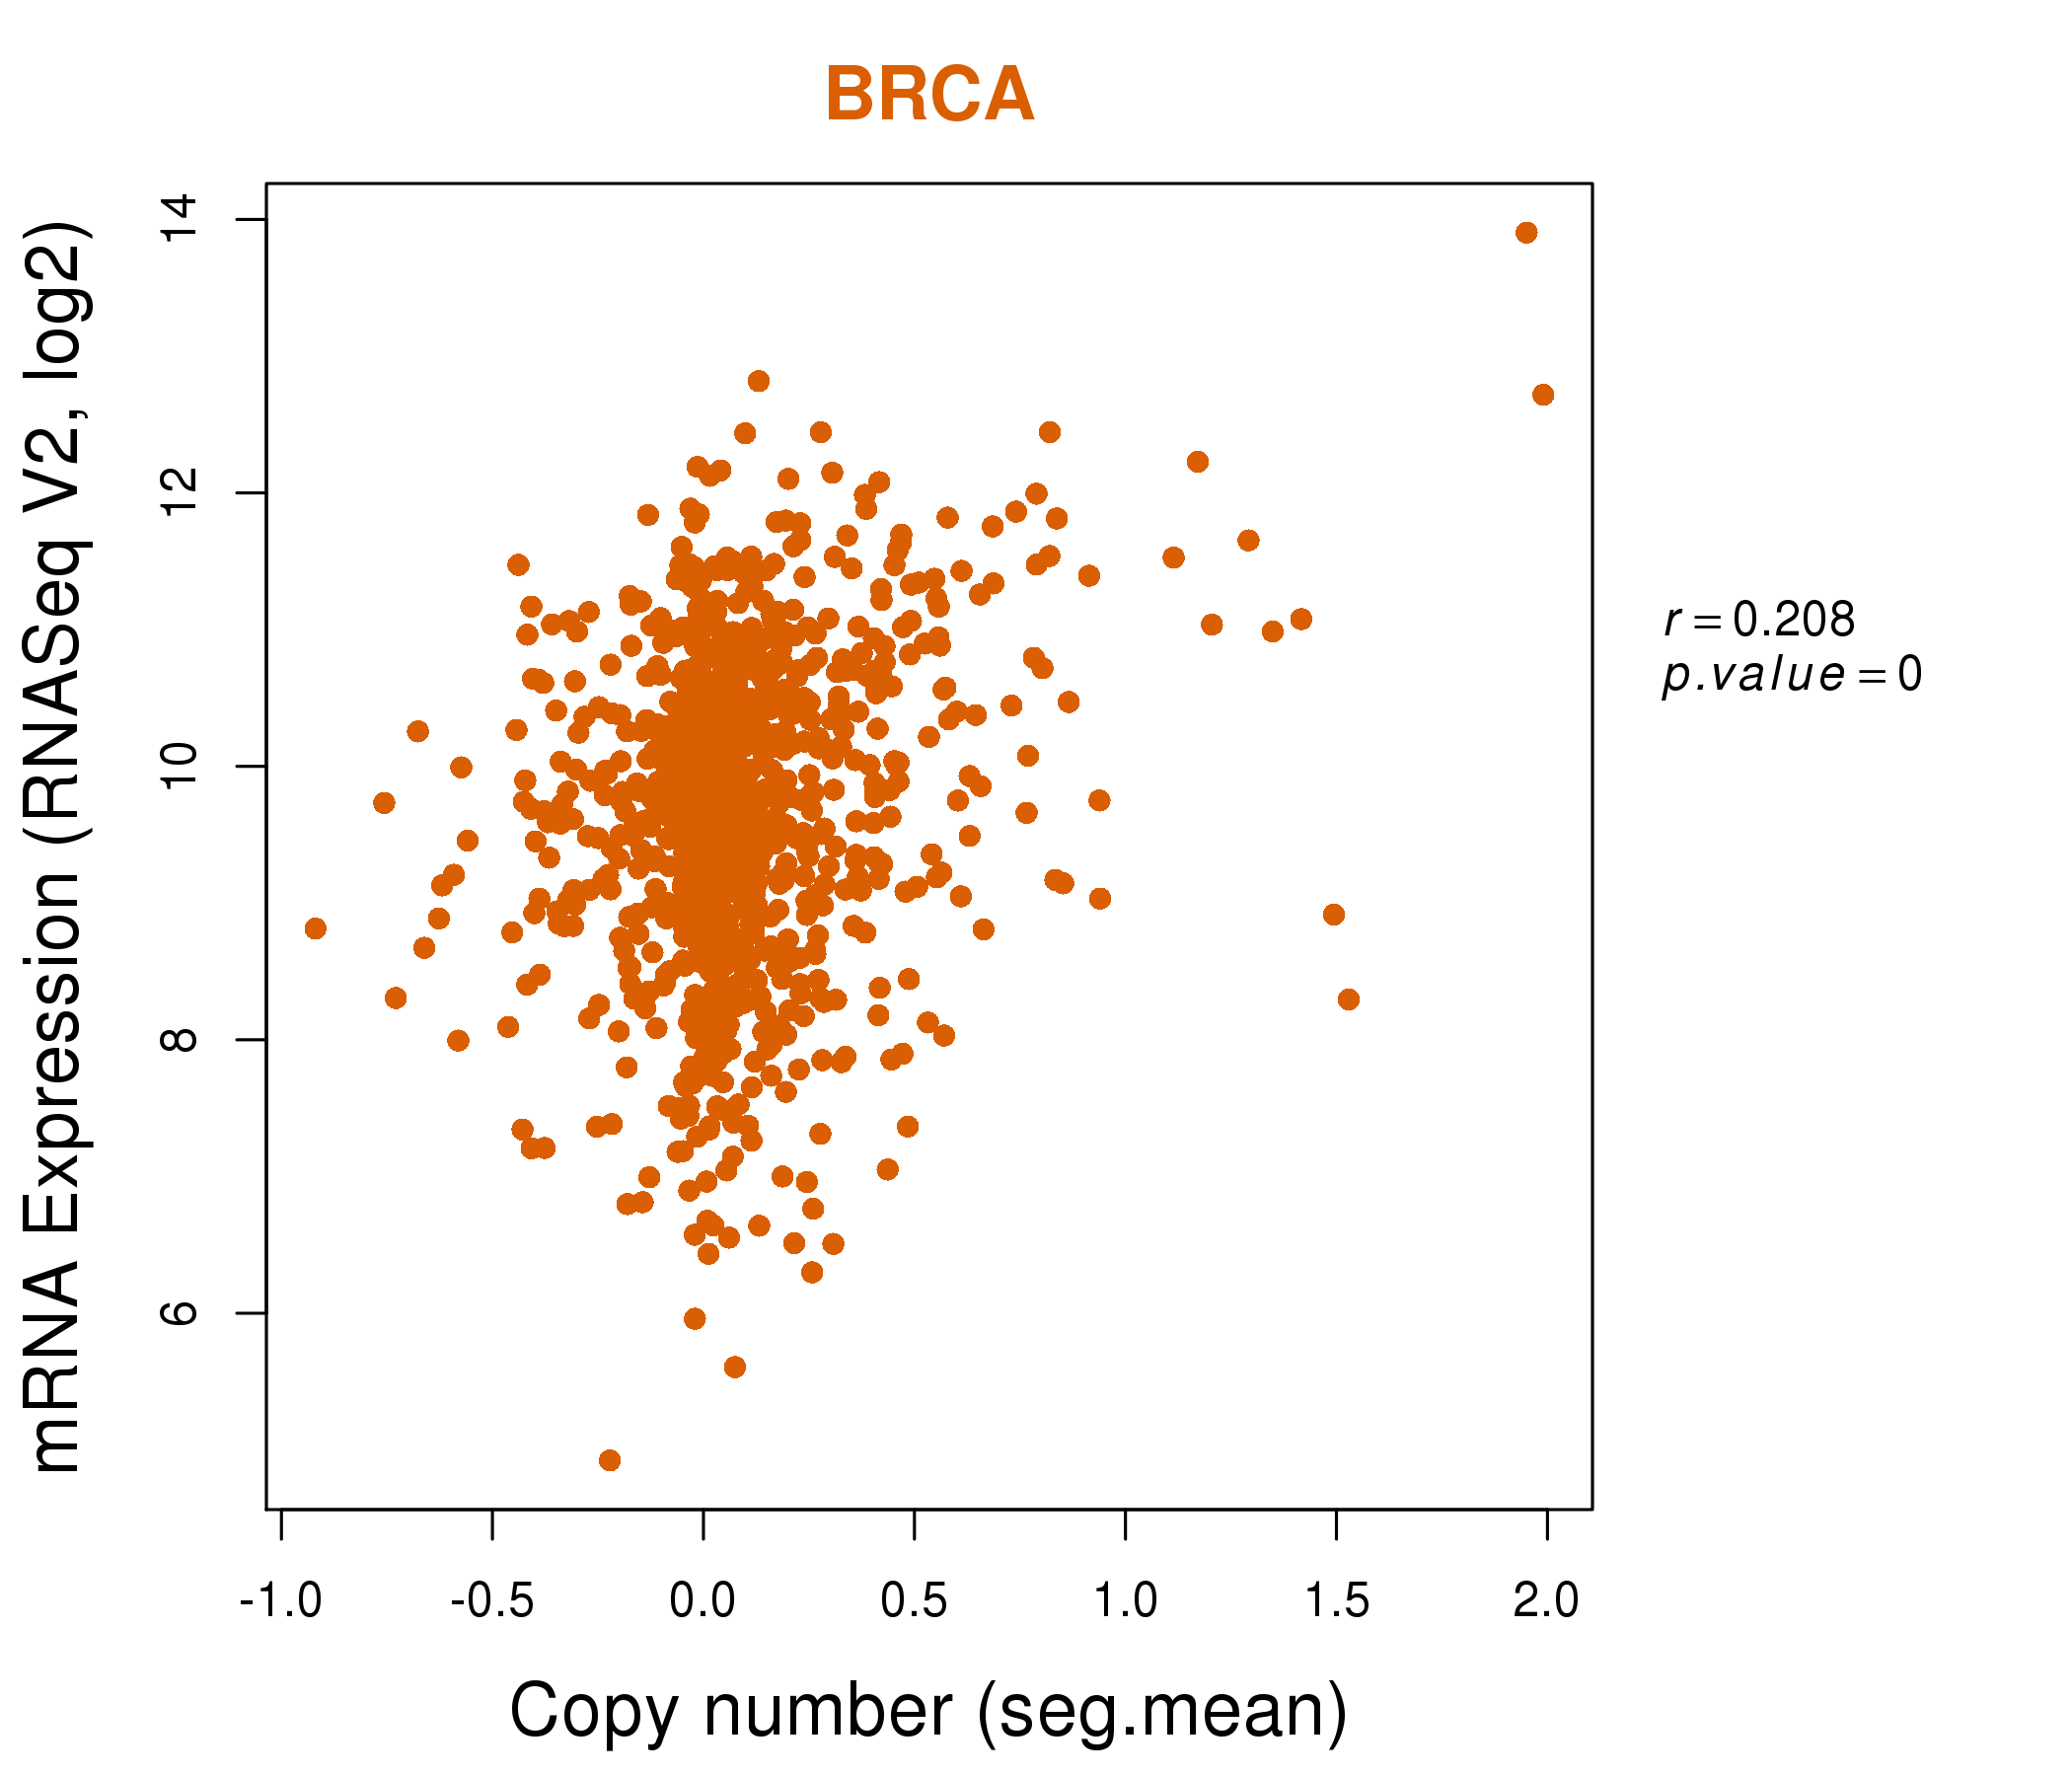
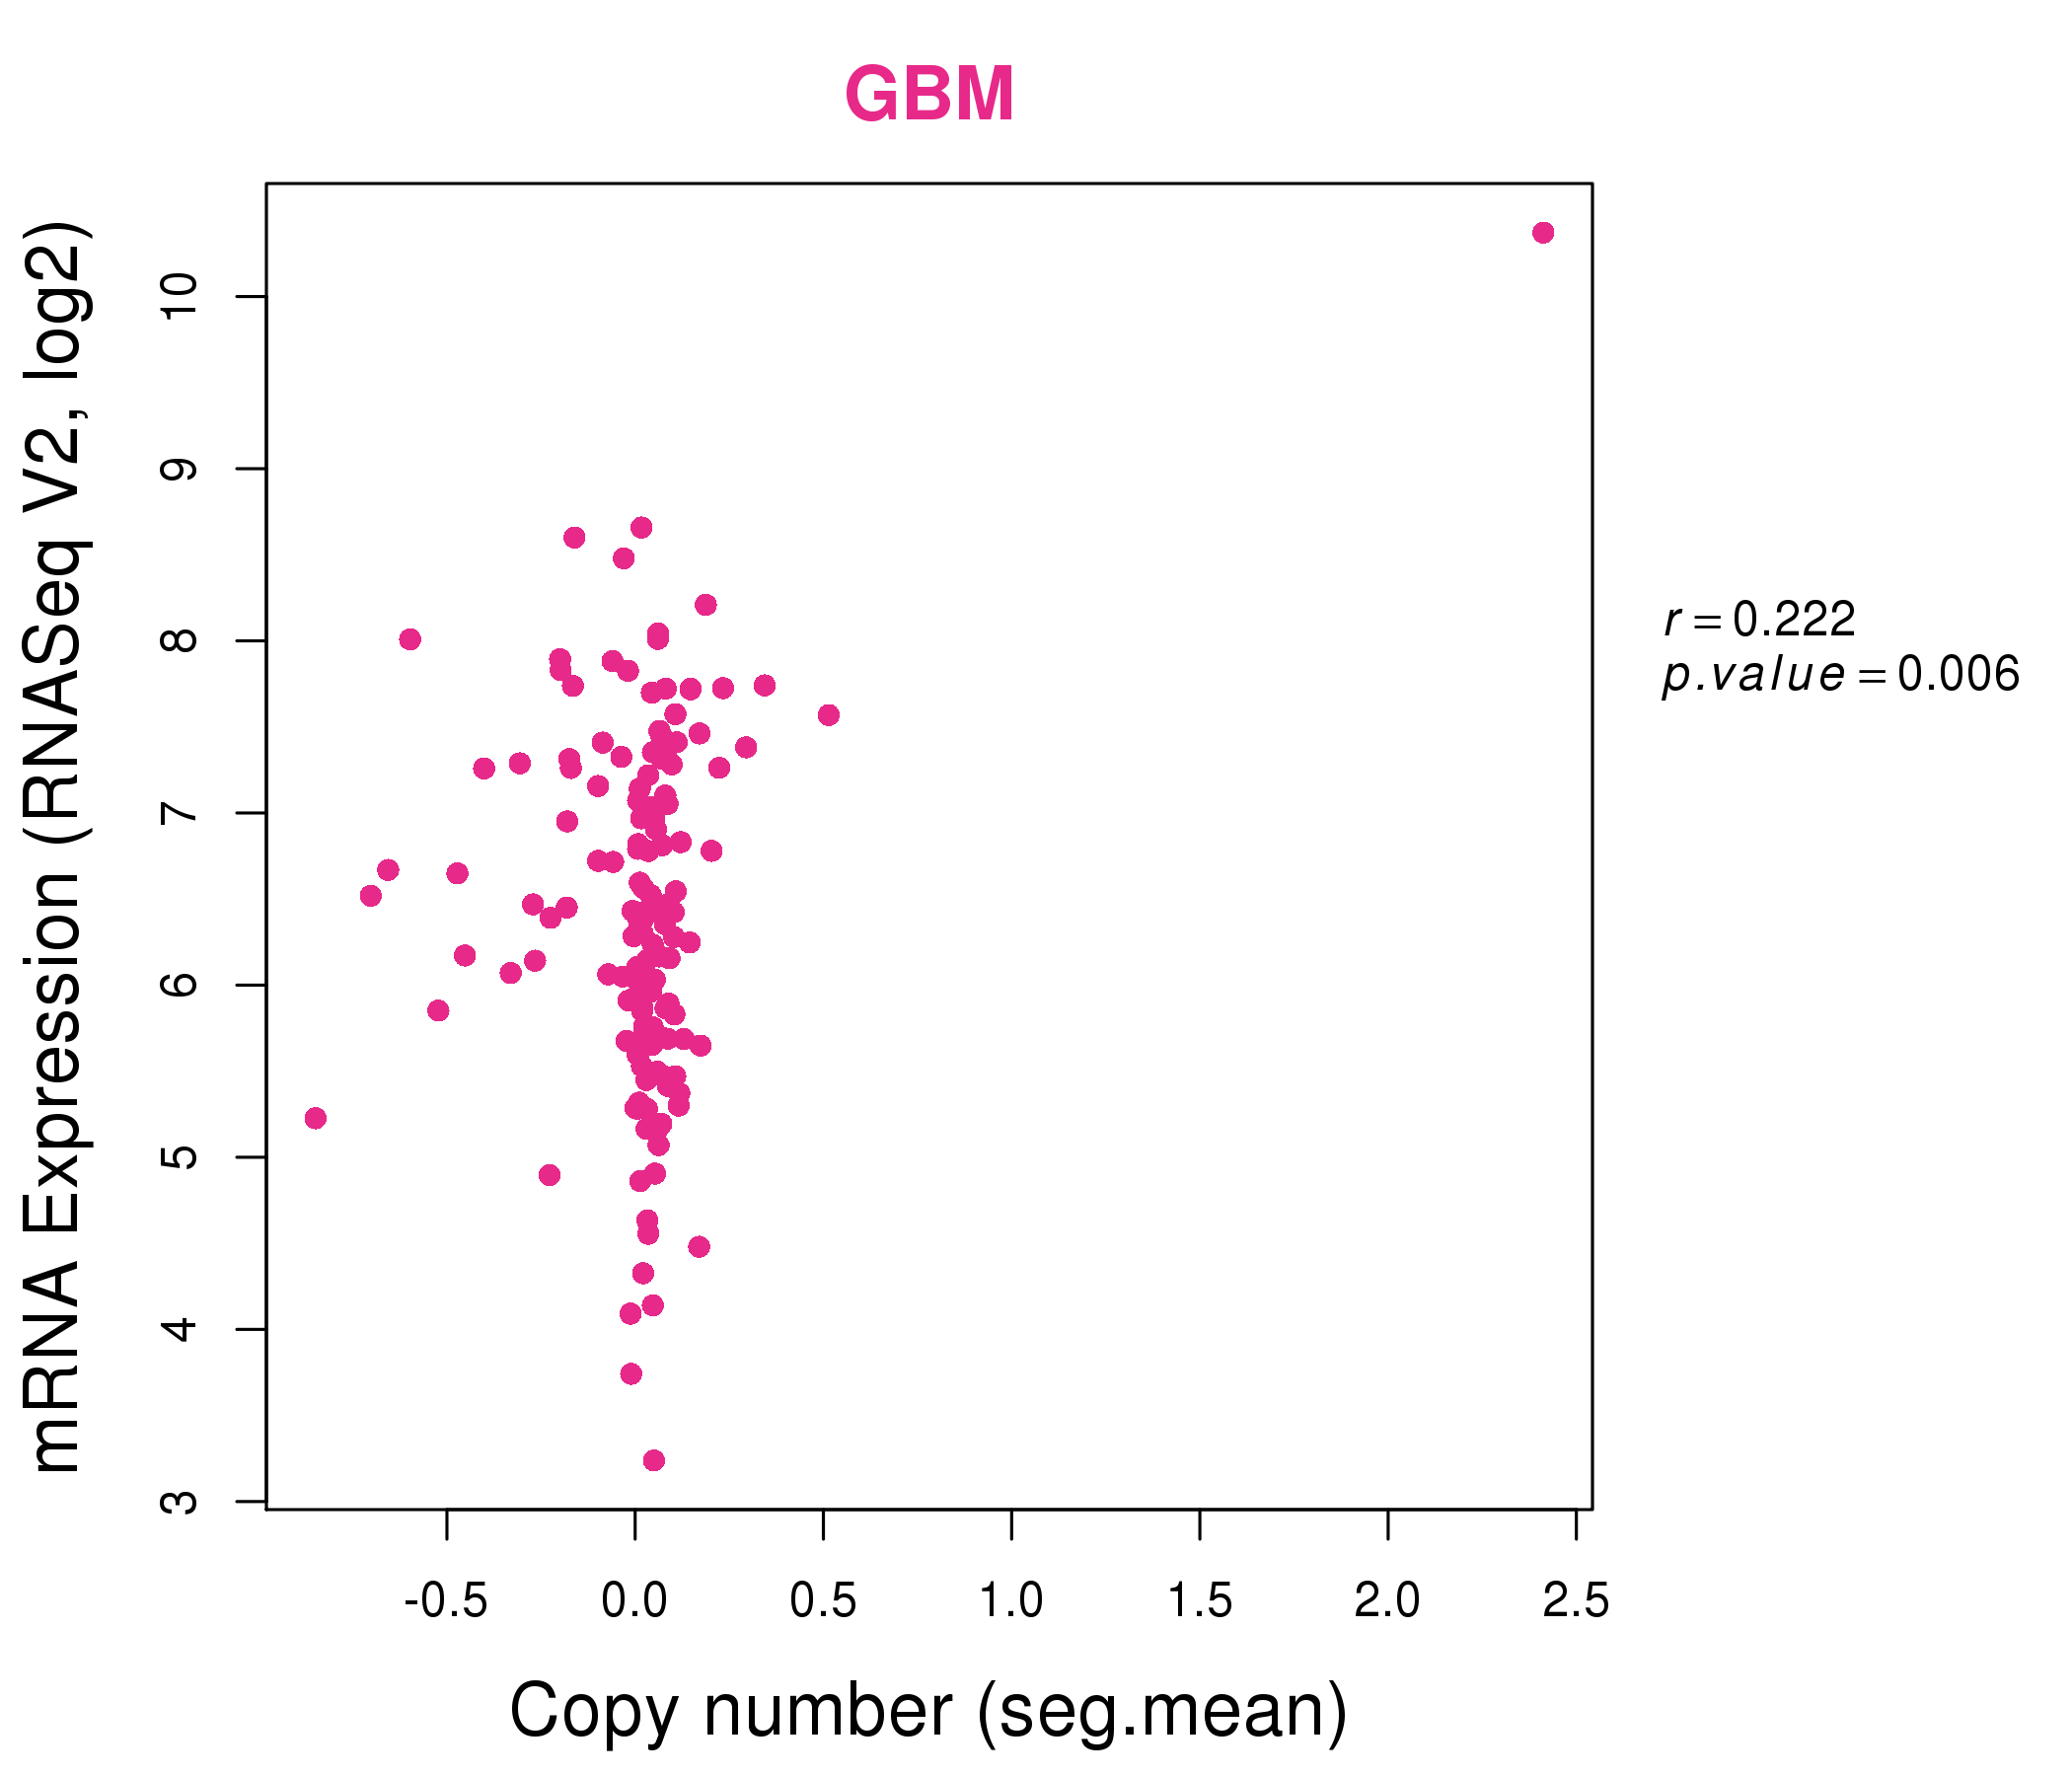
| * Normalized gene expression data of RNASeqV2 was extracted from TCGA using R package TCGA-Assembler. The URLs of all public data files on TCGA DCC data server were gathered at Jan-05-2015. Only eight cancer types have enough normal control samples for differential expression analysis. (t test, adjusted p<0.05 (using Benjamini-Hochberg FDR)) |
 |
| Top |
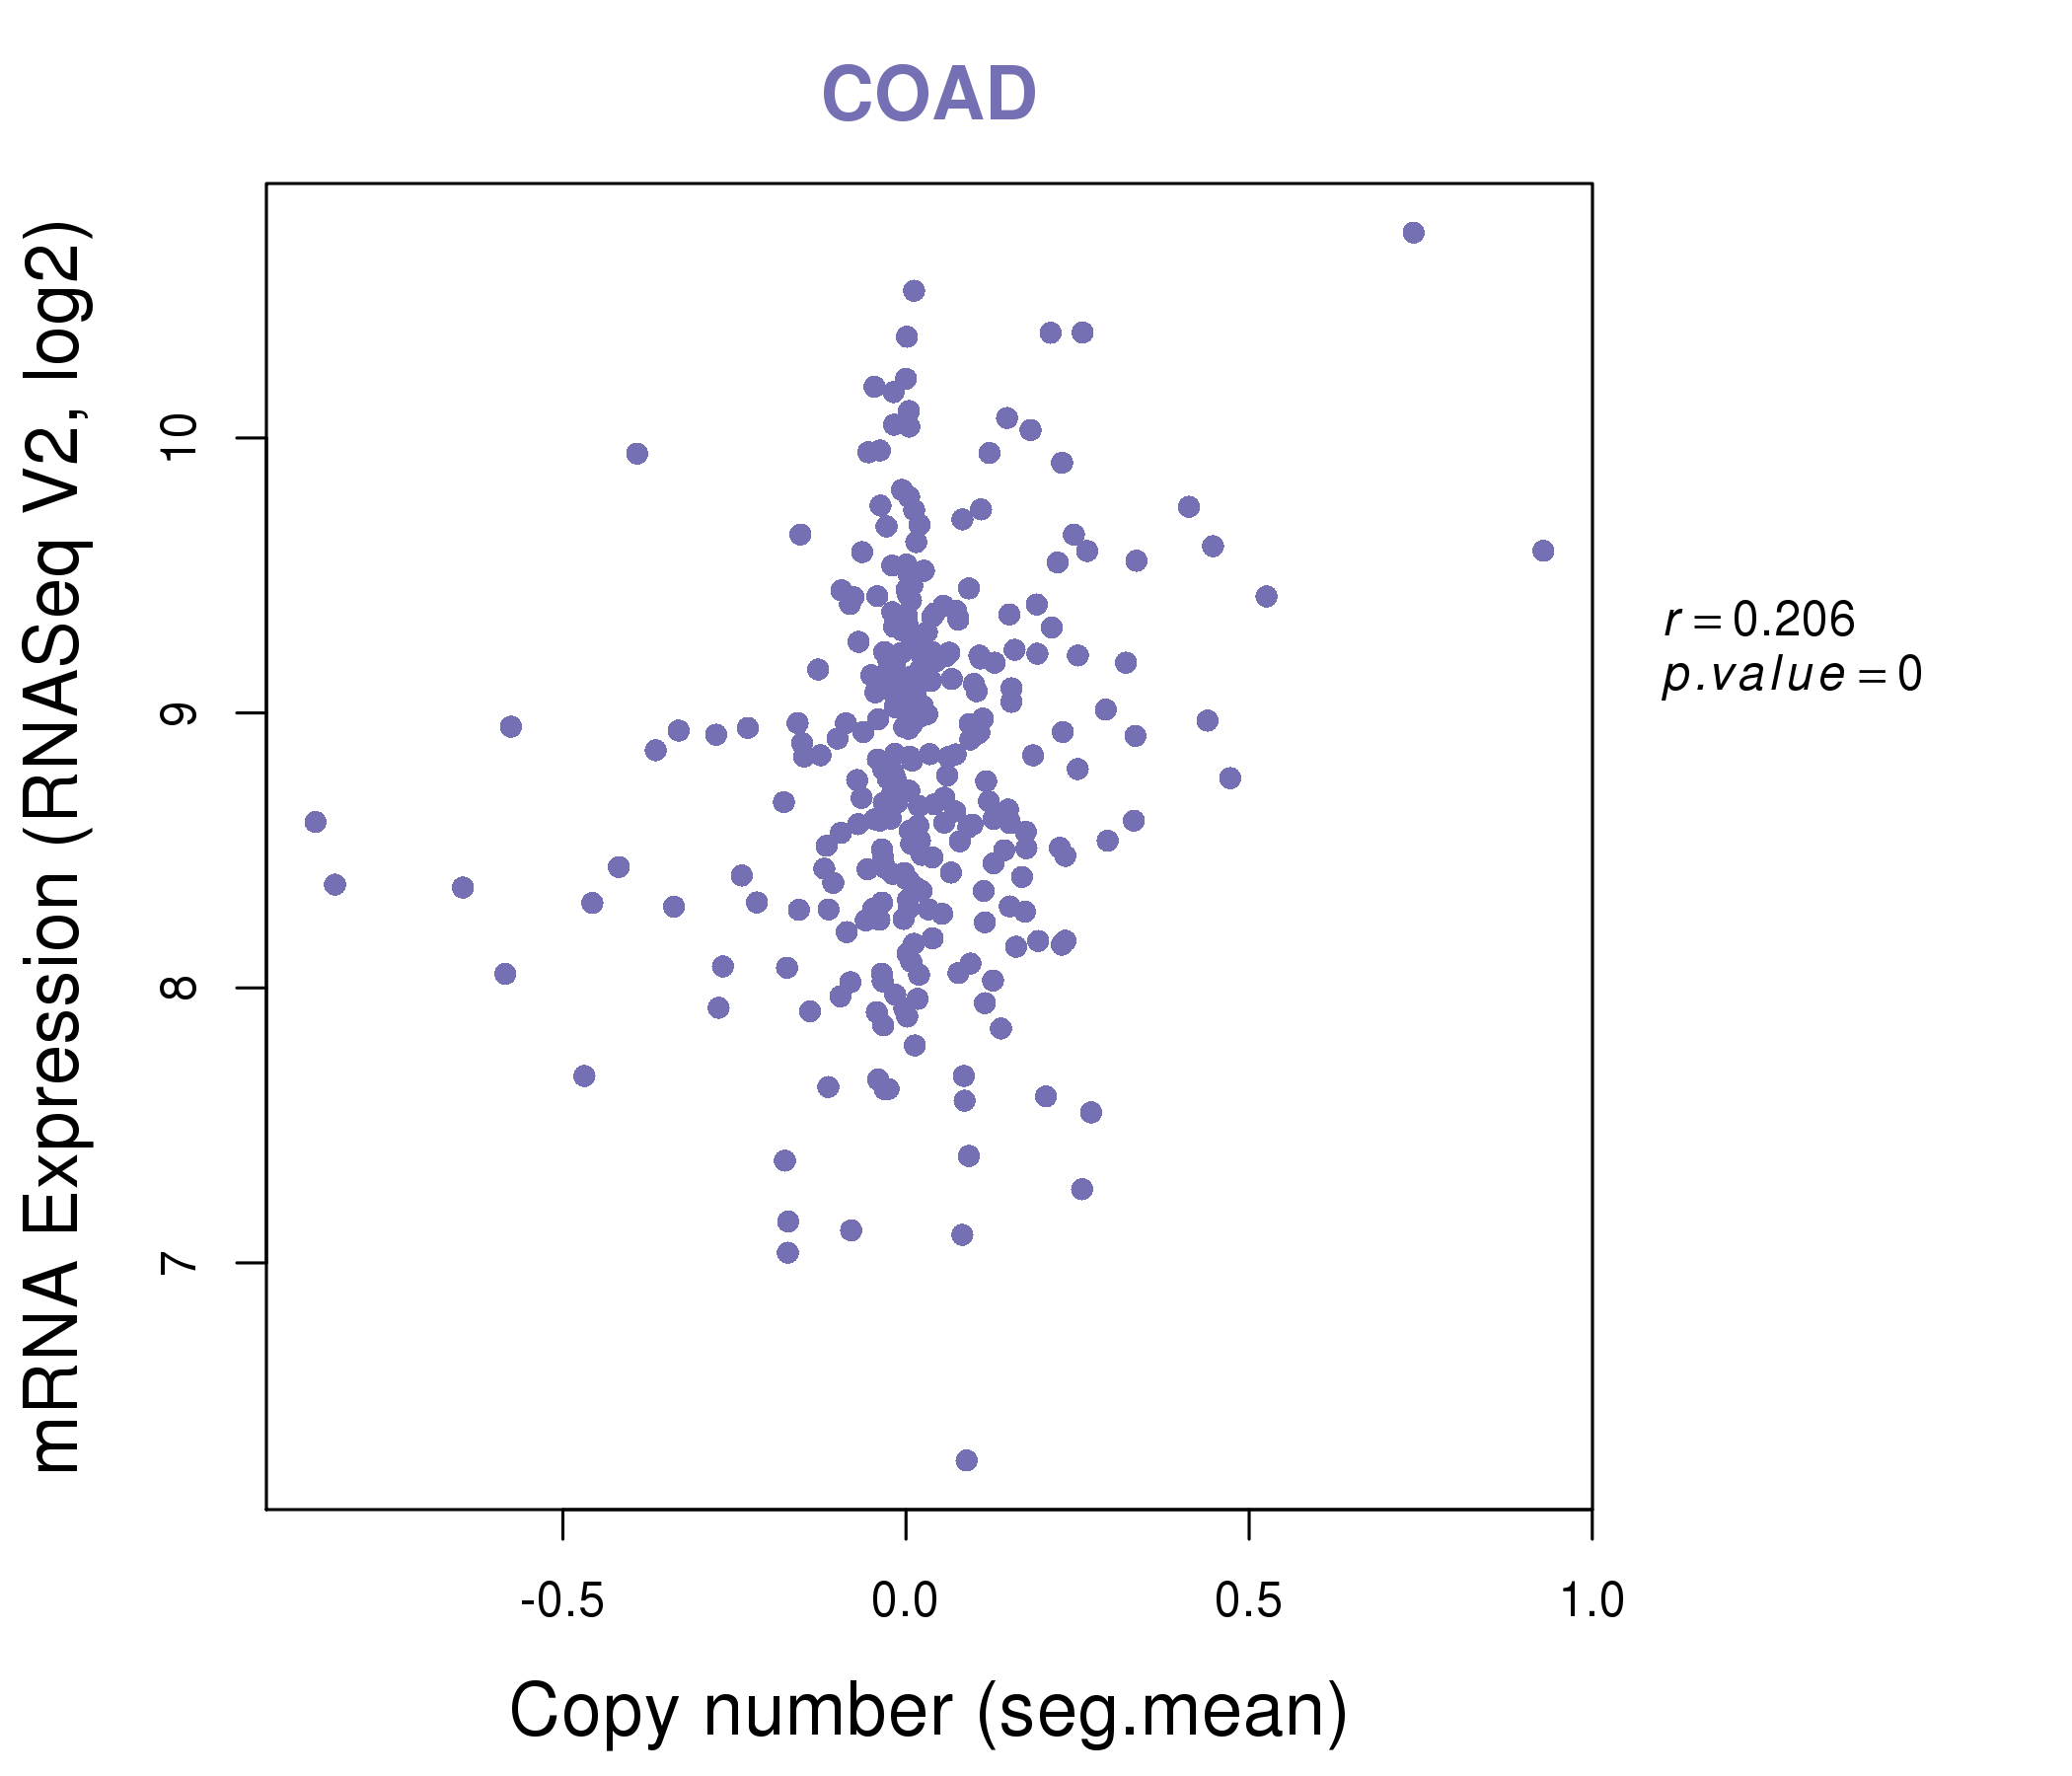
| * This plots show the correlation between CNV and gene expression. |
: Open all plots for all cancer types
 |
|
 |
|
| Top |
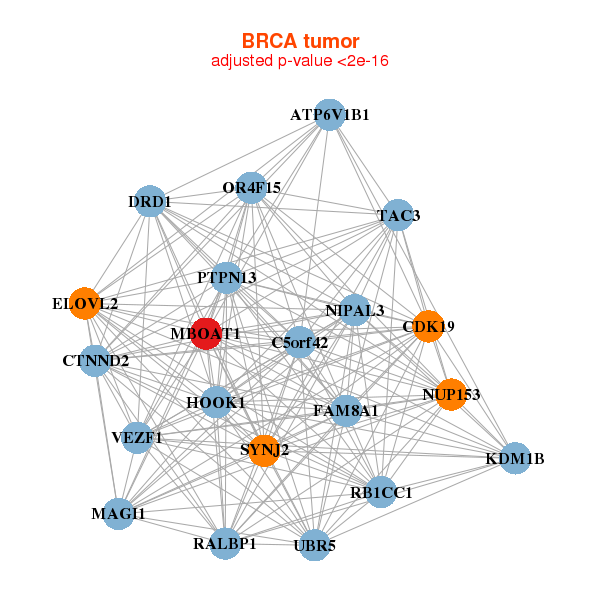
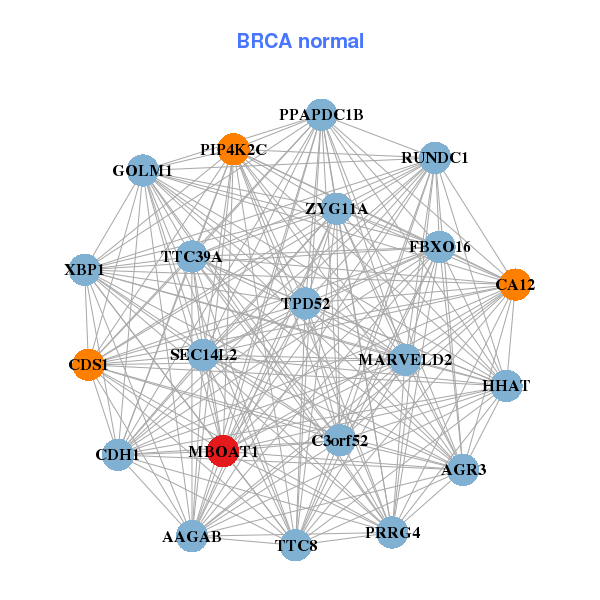
| Gene-Gene Network Information |
| * Co-Expression network figures were drawn using R package igraph. Only the top 20 genes with the highest correlations were shown. Red circle: input gene, orange circle: cell metabolism gene, sky circle: other gene |
: Open all plots for all cancer types
 |
|
| ATP6V1B1,C5orf42,CDK19,CTNND2,DRD1,ELOVL2,FAM8A1, HOOK1,KDM1B,MAGI1,MBOAT1,NIPAL3,NUP153,OR4F15, PTPN13,RALBP1,RB1CC1,SYNJ2,TAC3,UBR5,VEZF1 | AAGAB,AGR3,C3orf52,CA12,CDH1,CDS1,FBXO16, GOLM1,HHAT,MARVELD2,MBOAT1,PIP4K2C,PPAPDC1B,PRRG4, RUNDC1,SEC14L2,TPD52,TTC39A,TTC8,XBP1,ZYG11A |
 |
|
| TMEM246,CREB3L1,ERN2,GALNT12,GFI1,GRIN1,HMG20B, KCNK1,KLF4,MBOAT1,MLPH,MRAP2,SERINC4,SGSM3, SIDT1,SLC22A23,ST6GALNAC1,SYTL1,TSPAN13,VWA3B,ZBTB7C | ACSS2,AGFG2,ATP8B1,C5orf30,CCDC88C,CD24,HARS2, MARVELD2,MBOAT1,MKRN1,NSF,PIGR,PRR5L,SDHA, SH3BGRL2,SH3BP1,SH3KBP1,SLC4A4,TNK1,TRAF3IP2,ZNF217 |
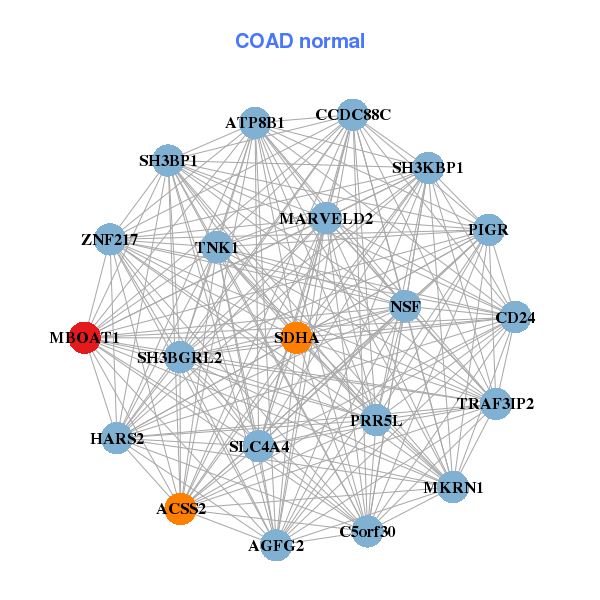
| * Co-Expression network figures were drawn using R package igraph. Only the top 20 genes with the highest correlations were shown. Red circle: input gene, orange circle: cell metabolism gene, sky circle: other gene |
: Open all plots for all cancer types
| Top |
: Open all interacting genes' information including KEGG pathway for all interacting genes from DAVID
| Top |
| Pharmacological Information for MBOAT1 |
| There's no related Drug. |
| Top |
| Cross referenced IDs for MBOAT1 |
| * We obtained these cross-references from Uniprot database. It covers 150 different DBs, 18 categories. http://www.uniprot.org/help/cross_references_section |
: Open all cross reference information
|
Copyright © 2016-Present - The Univsersity of Texas Health Science Center at Houston @ |