|
||||||||||||||||||||
| |
| Phenotypic Information (metabolism pathway, cancer, disease, phenome) |
| |
| |
| Gene-Gene Network Information: Co-Expression Network, Interacting Genes & KEGG |
| |
|


| Gene Summary for DGKA |
| Basic gene info. | Gene symbol | DGKA |
| Gene name | diacylglycerol kinase, alpha 80kDa | |
| Synonyms | DAGK|DAGK1|DGK-alpha | |
| Cytomap | UCSC genome browser: 12q13.3 | |
| Genomic location | chr12 :56324945-56347807 | |
| Type of gene | protein-coding | |
| RefGenes | NM_001345.4, NM_201444.2,NM_201445.1,NM_201554.1, | |
| Ensembl id | ENSG00000065357 | |
| Description | 80 kDa diacylglycerol kinaseDAG kinase alphadiacylglycerol kinase alphadiglyceride kinase alpha | |
| Modification date | 20141207 | |
| dbXrefs | MIM : 125855 | |
| HGNC : HGNC | ||
| Ensembl : ENSG00000065357 | ||
| HPRD : 00517 | ||
| Vega : OTTHUMG00000170109 | ||
| Protein | UniProt: P23743 go to UniProt's Cross Reference DB Table | |
| Expression | CleanEX: HS_DGKA | |
| BioGPS: 1606 | ||
| Gene Expression Atlas: ENSG00000065357 | ||
| The Human Protein Atlas: ENSG00000065357 | ||
| Pathway | NCI Pathway Interaction Database: DGKA | |
| KEGG: DGKA | ||
| REACTOME: DGKA | ||
| ConsensusPathDB | ||
| Pathway Commons: DGKA | ||
| Metabolism | MetaCyc: DGKA | |
| HUMANCyc: DGKA | ||
| Regulation | Ensembl's Regulation: ENSG00000065357 | |
| miRBase: chr12 :56,324,945-56,347,807 | ||
| TargetScan: NM_001345 | ||
| cisRED: ENSG00000065357 | ||
| Context | iHOP: DGKA | |
| cancer metabolism search in PubMed: DGKA | ||
| UCL Cancer Institute: DGKA | ||
| Assigned class in ccmGDB | A - This gene has a literature evidence and it belongs to cancer gene. | |
| References showing role of DGKA in cancer cell metabolism | 1. Dominguez CL, Floyd DH, Xiao A, Mullins GR, Kefas BA, et al. (2013) Diacylglycerol kinase alpha is a critical signaling node and novel therapeutic target in glioblastoma and other cancers. Cancer Discov 3: 782-797. doi: 10.1158/2159-8290.CD-12-0215. pmid: 3710531. go to article 2. Chauveau A, Le Floc'h A, Bantilan NS, Koretzky GA, Huse M (2014) Diacylglycerol kinase alpha establishes T cell polarity by shaping diacylglycerol accumulation at the immunological synapse. Sci Signal 7: ra82. doi: 10.1126/scisignal.2005287. go to article 3. Torres-Ayuso P, Daza-Martin M, Martin-Perez J, Avila-Flores A, Merida I (2014) Diacylglycerol kinase alpha promotes 3D cancer cell growth and limits drug sensitivity through functional interaction with Src. Oncotarget 5: 9710-9726. pmid: 4259432. go to article | |
| Top |
| Phenotypic Information for DGKA(metabolism pathway, cancer, disease, phenome) |
| Cancer | CGAP: DGKA |
| Familial Cancer Database: DGKA | |
| * This gene is included in those cancer gene databases. |
|
|
|
|
|
| . | ||||||||||||||
Oncogene 1 | Significant driver gene in | |||||||||||||||||||
| cf) number; DB name 1 Oncogene; http://nar.oxfordjournals.org/content/35/suppl_1/D721.long, 2 Tumor Suppressor gene; https://bioinfo.uth.edu/TSGene/, 3 Cancer Gene Census; http://www.nature.com/nrc/journal/v4/n3/abs/nrc1299.html, 4 CancerGenes; http://nar.oxfordjournals.org/content/35/suppl_1/D721.long, 5 Network of Cancer Gene; http://ncg.kcl.ac.uk/index.php, 1Therapeutic Vulnerabilities in Cancer; http://cbio.mskcc.org/cancergenomics/statius/ |
| KEGG_GLYCEROLIPID_METABOLISM KEGG_GLYCEROPHOSPHOLIPID_METABOLISM | |
| OMIM | 125855; gene. |
| Orphanet | |
| Disease | KEGG Disease: DGKA |
| MedGen: DGKA (Human Medical Genetics with Condition) | |
| ClinVar: DGKA | |
| Phenotype | MGI: DGKA (International Mouse Phenotyping Consortium) |
| PhenomicDB: DGKA | |
| Mutations for DGKA |
| * Under tables are showing count per each tissue to give us broad intuition about tissue specific mutation patterns.You can go to the detailed page for each mutation database's web site. |
| There's no structural variation information in COSMIC data for this gene. |
| * From mRNA Sanger sequences, Chitars2.0 arranged chimeric transcripts. This table shows DGKA related fusion information. |
| ID | Head Gene | Tail Gene | Accession | Gene_a | qStart_a | qEnd_a | Chromosome_a | tStart_a | tEnd_a | Gene_a | qStart_a | qEnd_a | Chromosome_a | tStart_a | tEnd_a |
| AW340041 | DGKA | 22 | 123 | 12 | 56347681 | 56347782 | RGS22 | 124 | 509 | 8 | 101051221 | 101059795 | |
| AI653235 | EML3 | 1 | 166 | 11 | 62369691 | 62369856 | DGKA | 163 | 391 | 12 | 56324991 | 56325219 | |
| BU948429 | NDUFB5 | 8 | 430 | 3 | 179341970 | 179342392 | DGKA | 426 | 511 | 12 | 56347720 | 56347805 | |
| AI203264 | EML3 | 1 | 166 | 11 | 62369691 | 62369856 | DGKA | 163 | 391 | 12 | 56324991 | 56325219 | |
| BE717774 | NAV2 | 21 | 263 | 11 | 19841944 | 19842188 | DGKA | 259 | 493 | 12 | 56346920 | 56347616 | |
| Top |
| There's no copy number variation information in COSMIC data for this gene. |
| Top |
|
 |
| Top |
| Stat. for Non-Synonymous SNVs (# total SNVs=55) | (# total SNVs=20) |
 |  |
(# total SNVs=3) | (# total SNVs=0) |
 |
| Top |
| * When you move the cursor on each content, you can see more deailed mutation information on the Tooltip. Those are primary_site,primary_histology,mutation(aa),pubmedID. |
| GRCh37 position | Mutation(aa) | Unique sampleID count |
| chr12:56345564-56345564 | p.G528G | 2 |
| chr12:56347164-56347164 | p.D698D | 2 |
| chr12:56334722-56334722 | p.K353K | 2 |
| chr12:56330872-56330872 | p.D46N | 2 |
| chr12:56334729-56334729 | p.D356Y | 2 |
| chr12:56346633-56346633 | p.G620E | 2 |
| chr12:56347487-56347487 | p.N715Y | 2 |
| chr12:56346661-56346661 | p.L629L | 2 |
| chr12:56336007-56336007 | p.G462G | 2 |
| chr12:56347514-56347514 | p.R726fs*9 | 2 |
| Top |
|
 |
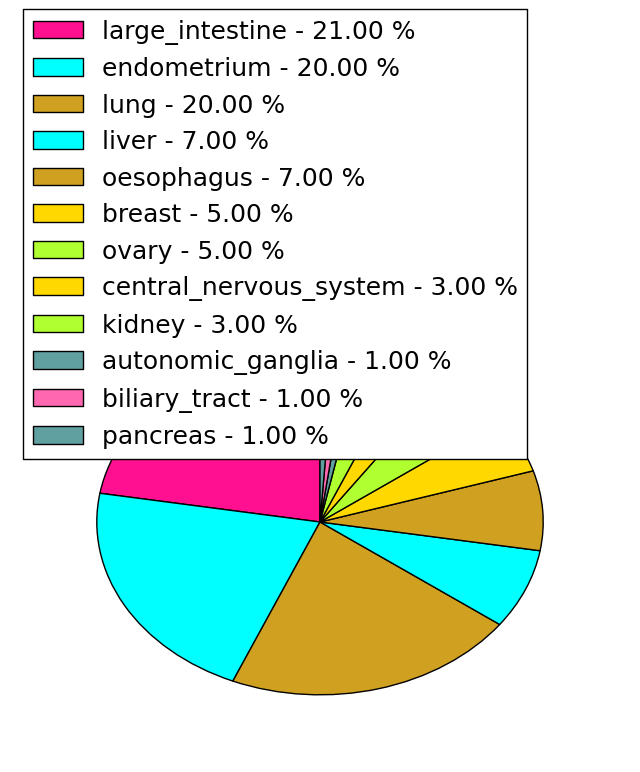
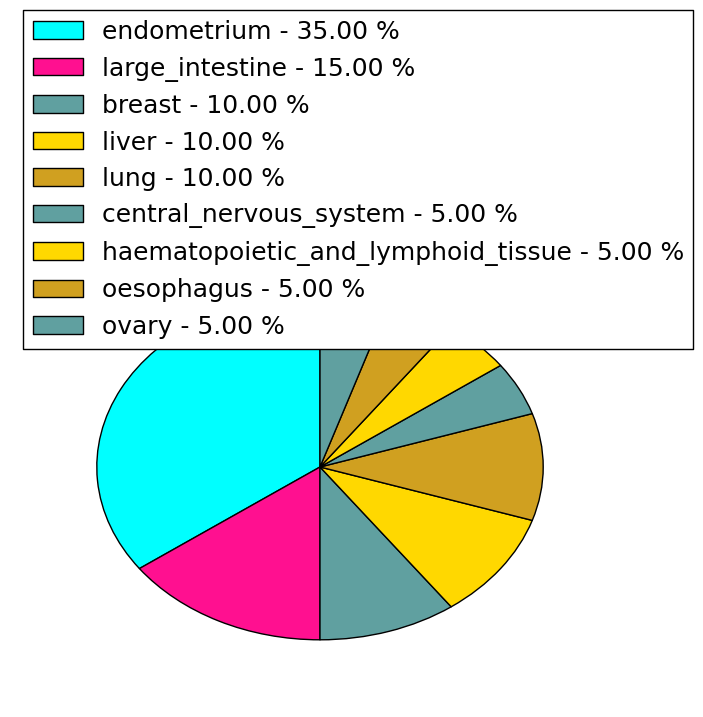
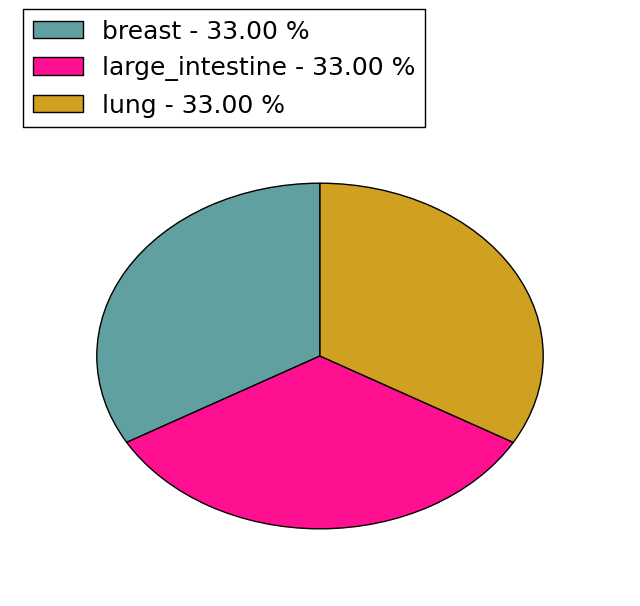
| Point Mutation/ Tissue ID | 1 | 2 | 3 | 4 | 5 | 6 | 7 | 8 | 9 | 10 | 11 | 12 | 13 | 14 | 15 | 16 | 17 | 18 | 19 | 20 |
| # sample | 4 | 2 | 10 | 1 | 1 | 1 | 1 | 9 | 4 | 4 | 6 | 9 | 10 | |||||||
| # mutation | 4 | 2 | 10 | 1 | 1 | 1 | 1 | 9 | 4 | 4 | 7 | 10 | 16 | |||||||
| nonsynonymous SNV | 1 | 2 | 7 | 1 | 1 | 1 | 8 | 3 | 3 | 3 | 3 | 9 | ||||||||
| synonymous SNV | 3 | 3 | 1 | 1 | 1 | 1 | 4 | 7 | 7 |
| cf) Tissue ID; Tissue type (1; BLCA[Bladder Urothelial Carcinoma], 2; BRCA[Breast invasive carcinoma], 3; CESC[Cervical squamous cell carcinoma and endocervical adenocarcinoma], 4; COAD[Colon adenocarcinoma], 5; GBM[Glioblastoma multiforme], 6; Glioma Low Grade, 7; HNSC[Head and Neck squamous cell carcinoma], 8; KICH[Kidney Chromophobe], 9; KIRC[Kidney renal clear cell carcinoma], 10; KIRP[Kidney renal papillary cell carcinoma], 11; LAML[Acute Myeloid Leukemia], 12; LUAD[Lung adenocarcinoma], 13; LUSC[Lung squamous cell carcinoma], 14; OV[Ovarian serous cystadenocarcinoma ], 15; PAAD[Pancreatic adenocarcinoma], 16; PRAD[Prostate adenocarcinoma], 17; SKCM[Skin Cutaneous Melanoma], 18:STAD[Stomach adenocarcinoma], 19:THCA[Thyroid carcinoma], 20:UCEC[Uterine Corpus Endometrial Carcinoma]) |
| Top |
| * We represented just top 10 SNVs. When you move the cursor on each content, you can see more deailed mutation information on the Tooltip. Those are primary_site, primary_histology, mutation(aa), pubmedID. |
| Genomic Position | Mutation(aa) | Unique sampleID count |
| chr12:56346661 | p.F730L,DGKA | 2 |
| chr12:56347534 | p.L629L,DGKA | 2 |
| chr12:56345564 | p.G528G,DGKA | 2 |
| chr12:56346939 | p.F559L,DGKA | 1 |
| chr12:56334764 | p.E664E,DGKA | 1 |
| chr12:56331219 | p.S132T,DGKA | 1 |
| chr12:56345838 | p.K349R,DGKA | 1 |
| chr12:56334110 | p.E560K,DGKA | 1 |
| chr12:56346620 | p.I668M,DGKA | 1 |
| chr12:56347147 | p.I167I,DGKA | 1 |
| * Copy number data were extracted from TCGA using R package TCGA-Assembler. The URLs of all public data files on TCGA DCC data server were gathered on Jan-05-2015. Function ProcessCNAData in TCGA-Assembler package was used to obtain gene-level copy number value which is calculated as the average copy number of the genomic region of a gene. |
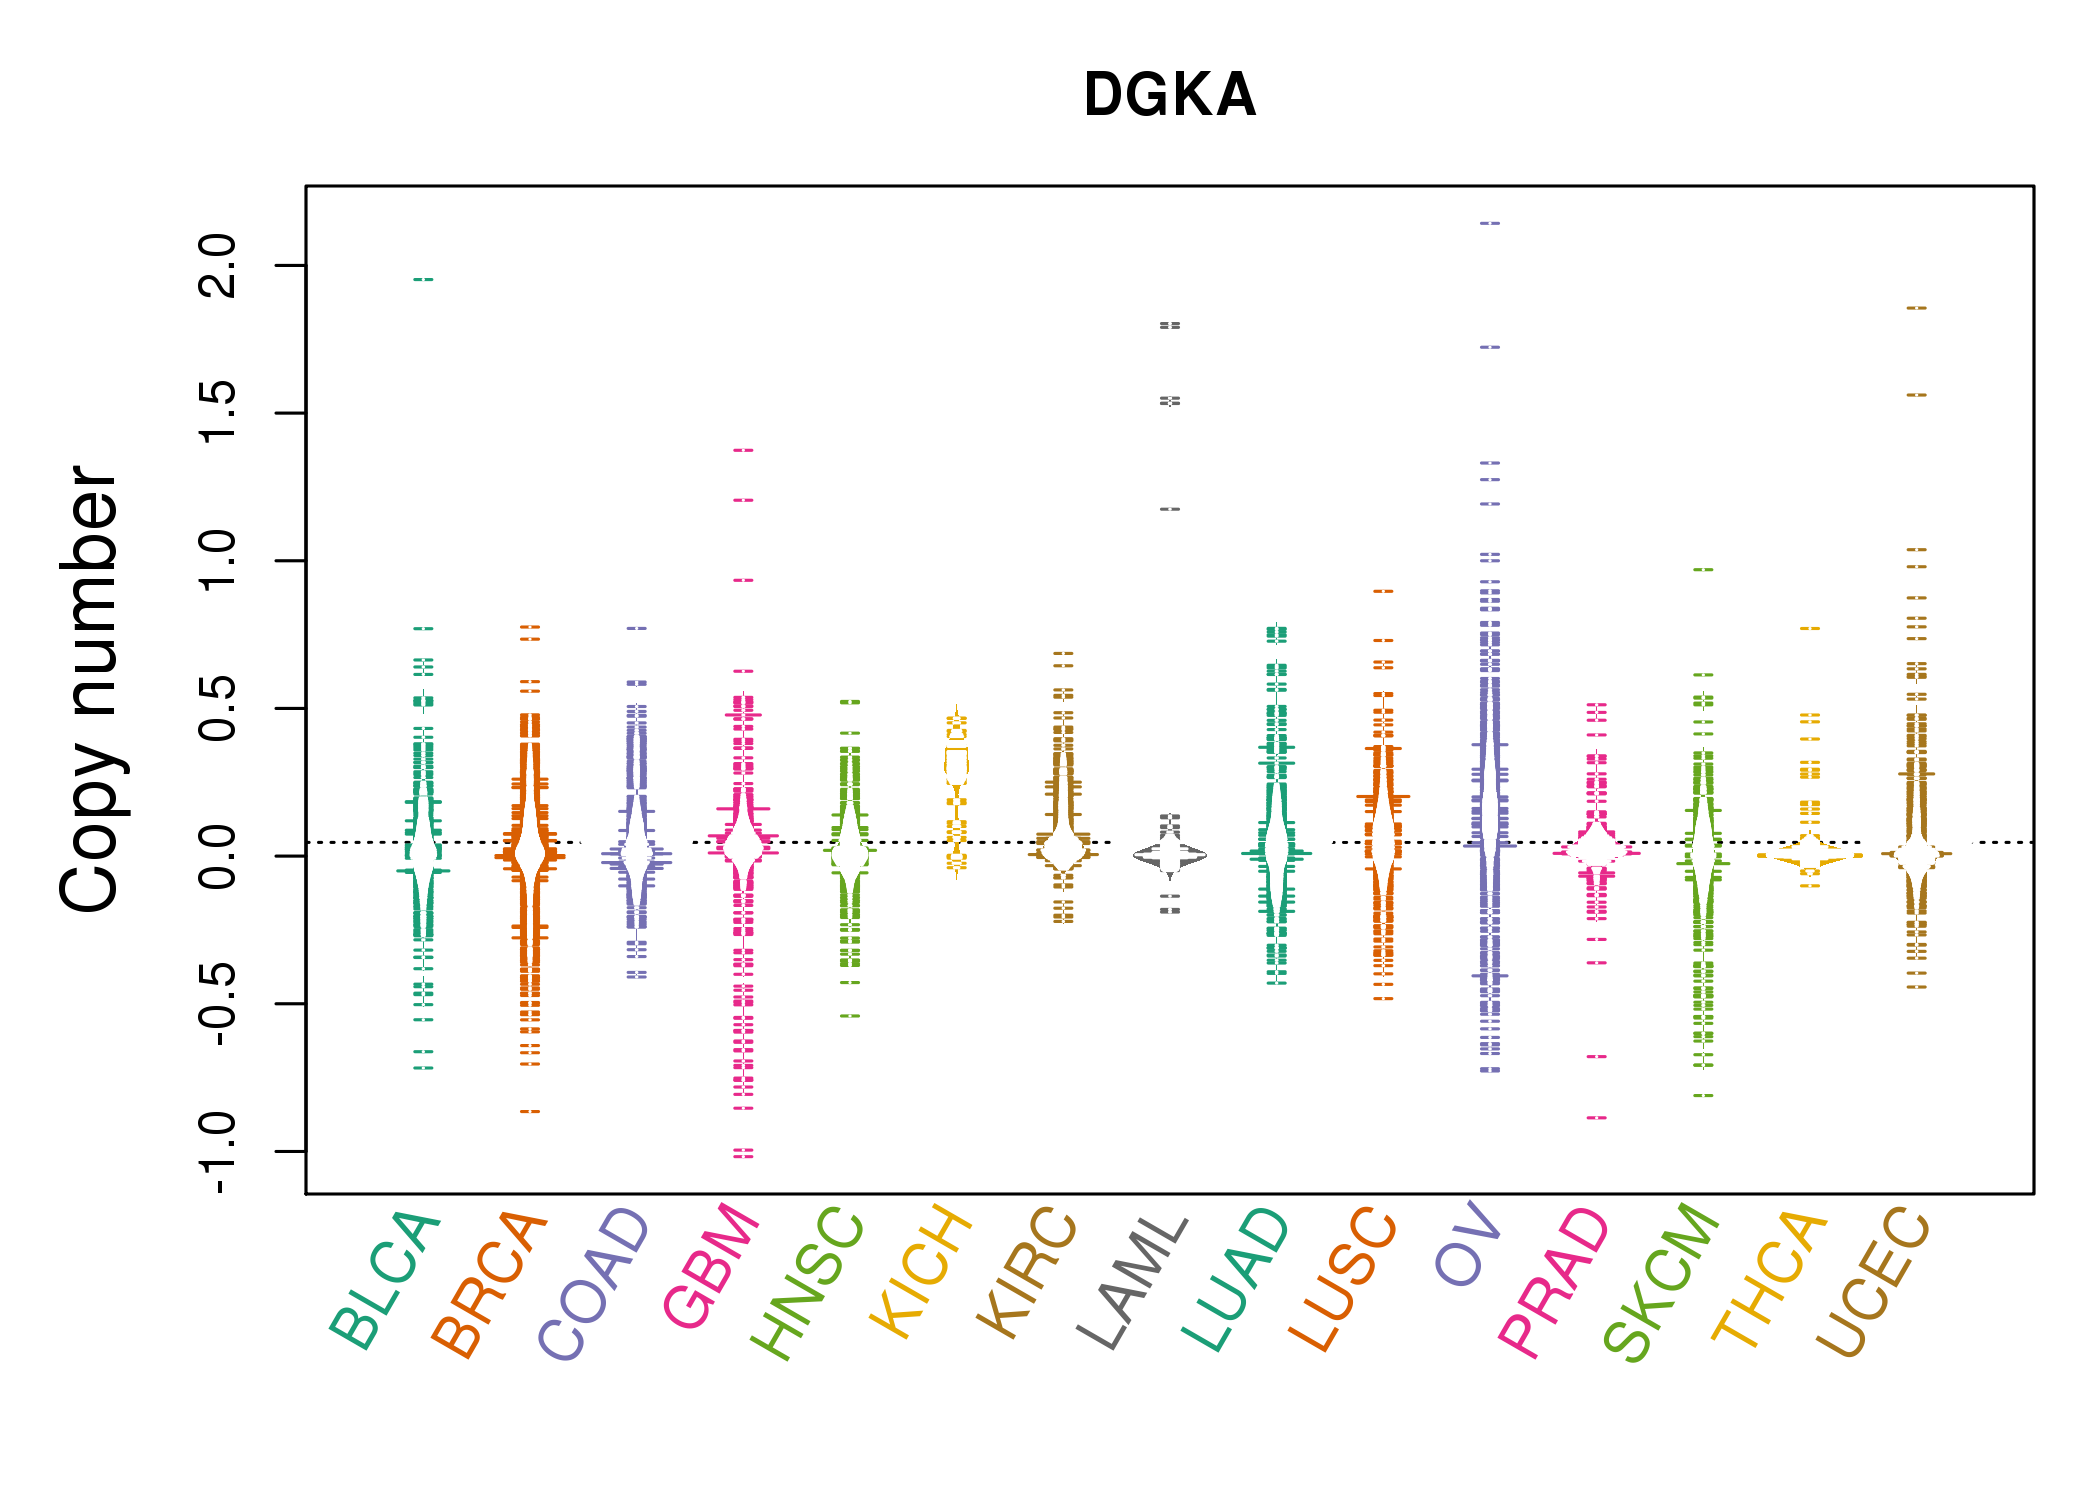 |
| cf) Tissue ID[Tissue type]: BLCA[Bladder Urothelial Carcinoma], BRCA[Breast invasive carcinoma], CESC[Cervical squamous cell carcinoma and endocervical adenocarcinoma], COAD[Colon adenocarcinoma], GBM[Glioblastoma multiforme], Glioma Low Grade, HNSC[Head and Neck squamous cell carcinoma], KICH[Kidney Chromophobe], KIRC[Kidney renal clear cell carcinoma], KIRP[Kidney renal papillary cell carcinoma], LAML[Acute Myeloid Leukemia], LUAD[Lung adenocarcinoma], LUSC[Lung squamous cell carcinoma], OV[Ovarian serous cystadenocarcinoma ], PAAD[Pancreatic adenocarcinoma], PRAD[Prostate adenocarcinoma], SKCM[Skin Cutaneous Melanoma], STAD[Stomach adenocarcinoma], THCA[Thyroid carcinoma], UCEC[Uterine Corpus Endometrial Carcinoma] |
| Top |
| Gene Expression for DGKA |
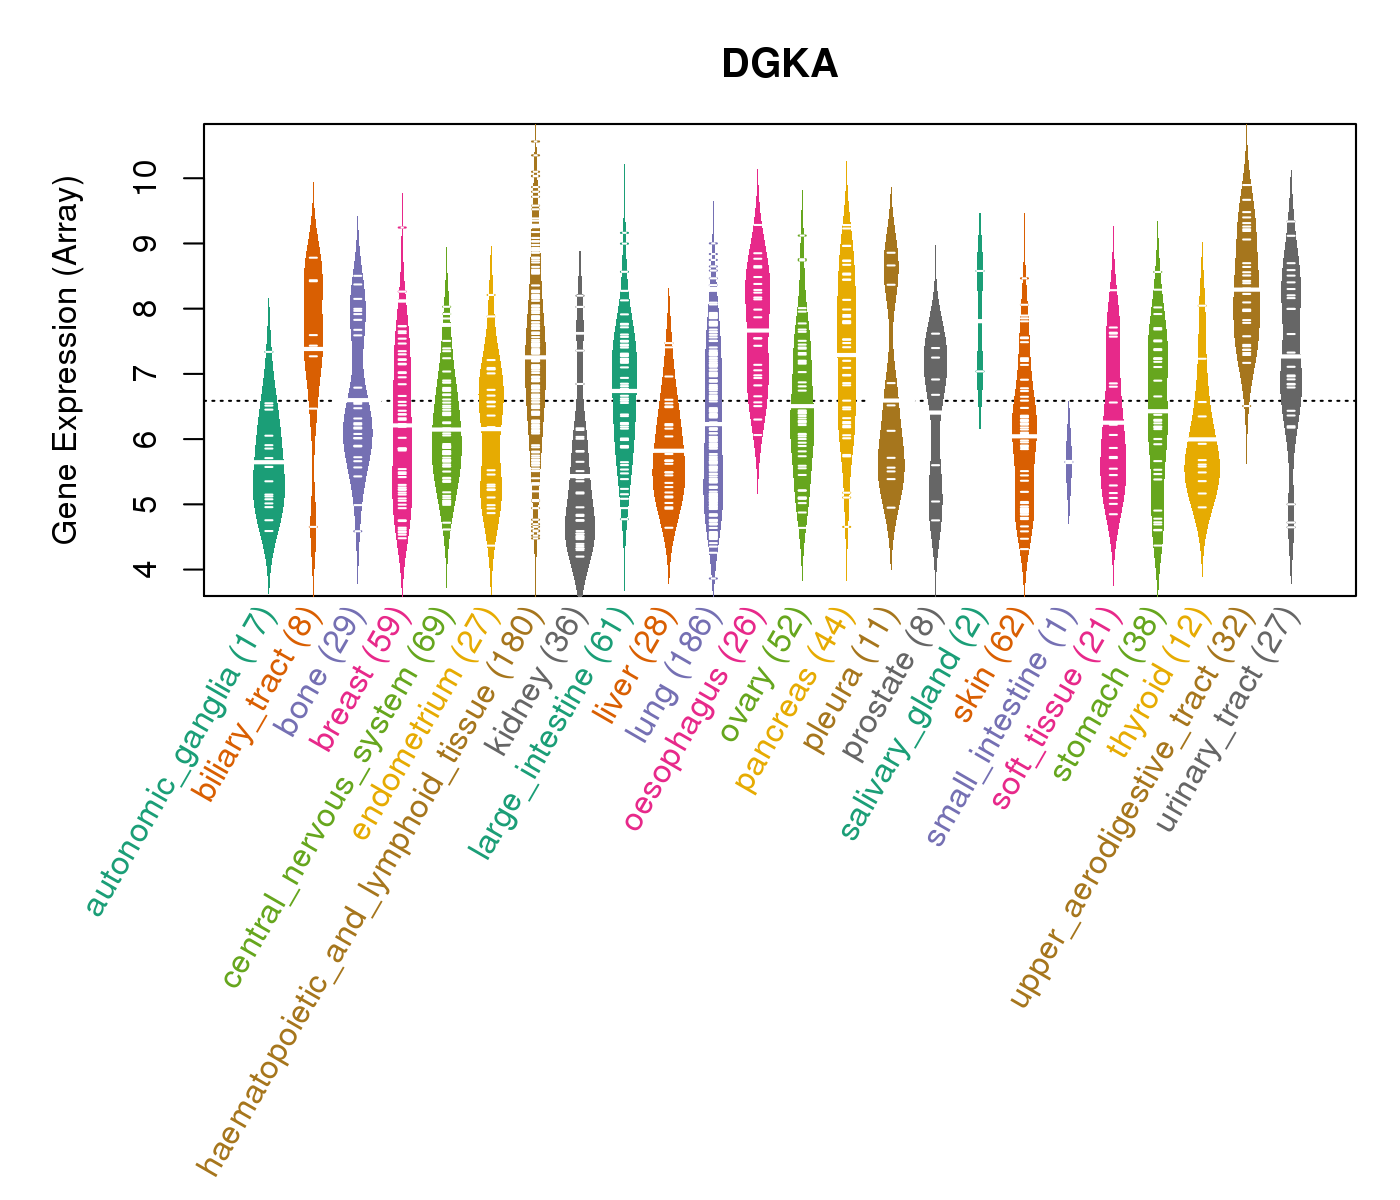
| * CCLE gene expression data were extracted from CCLE_Expression_Entrez_2012-10-18.res: Gene-centric RMA-normalized mRNA expression data. |
 |
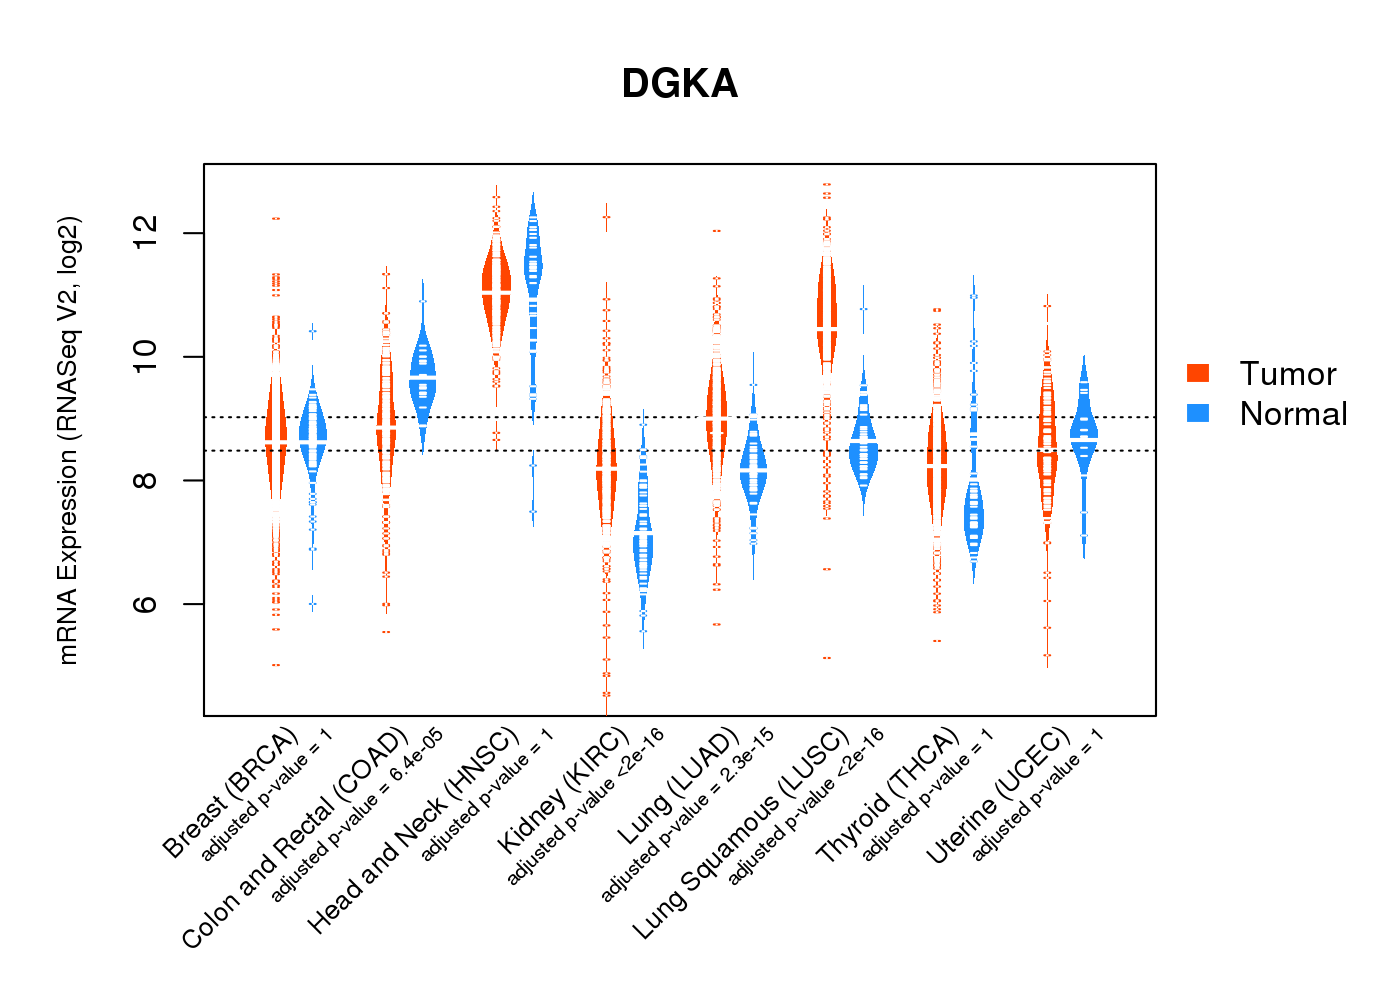
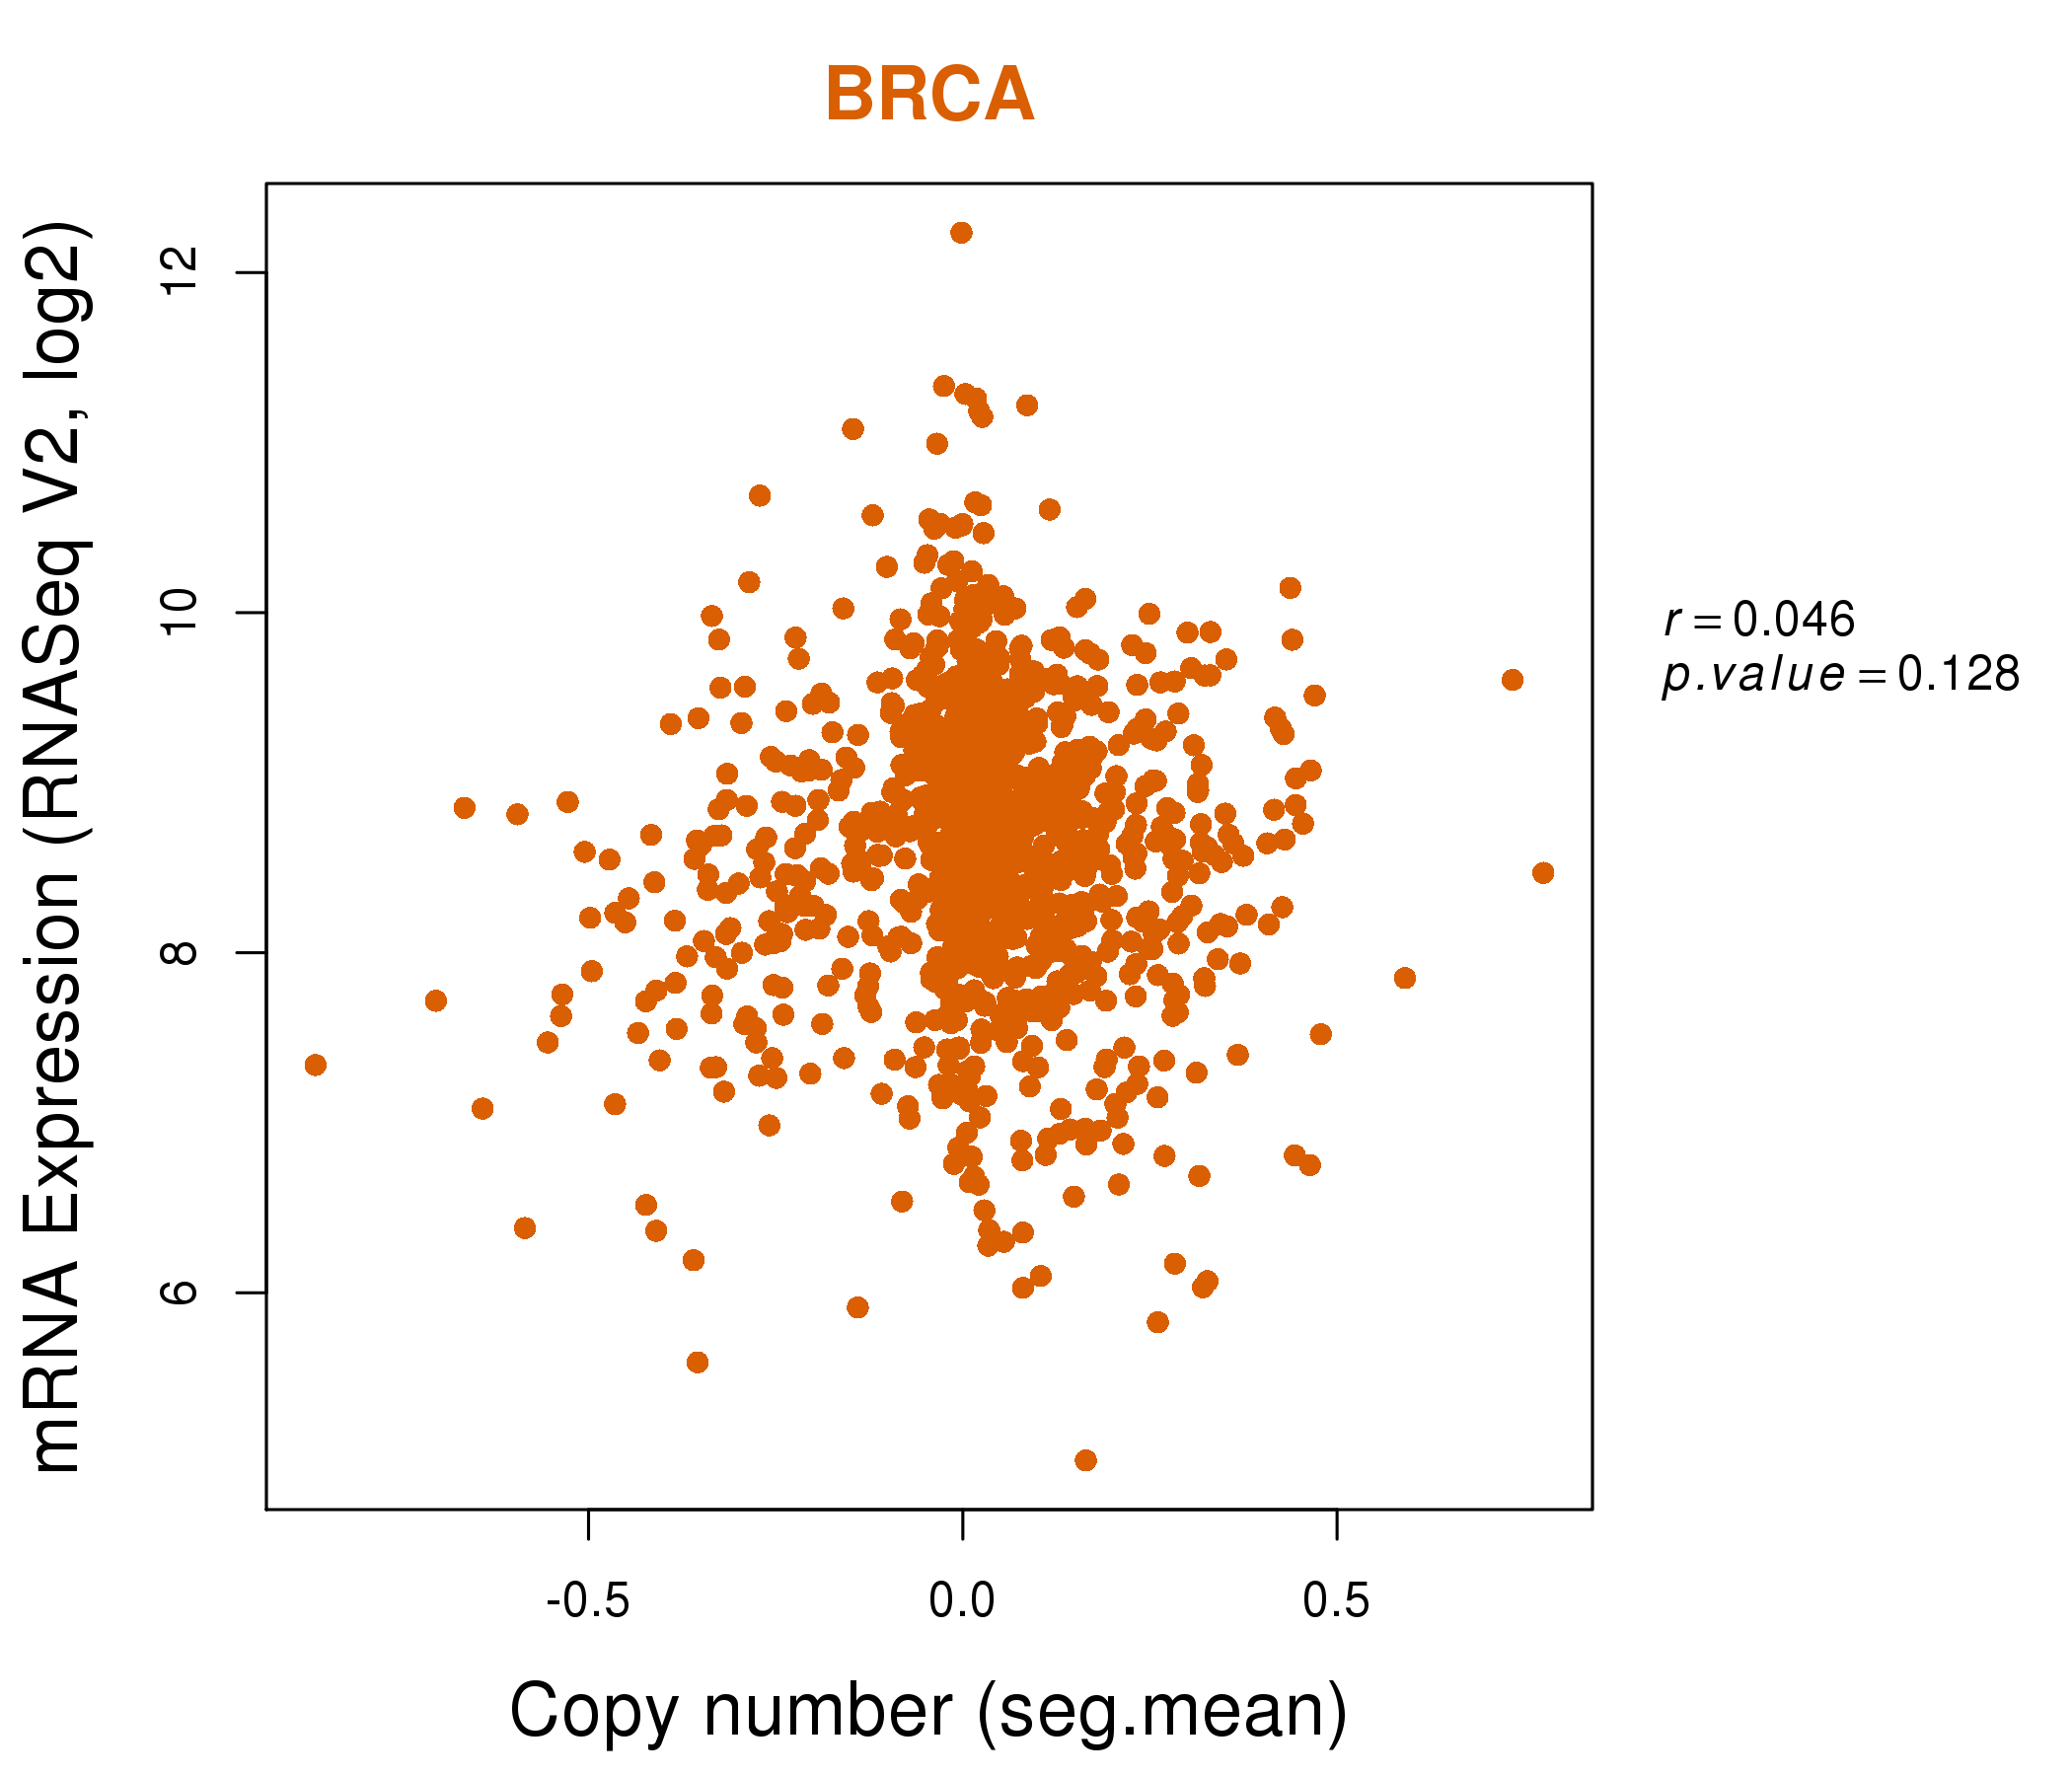
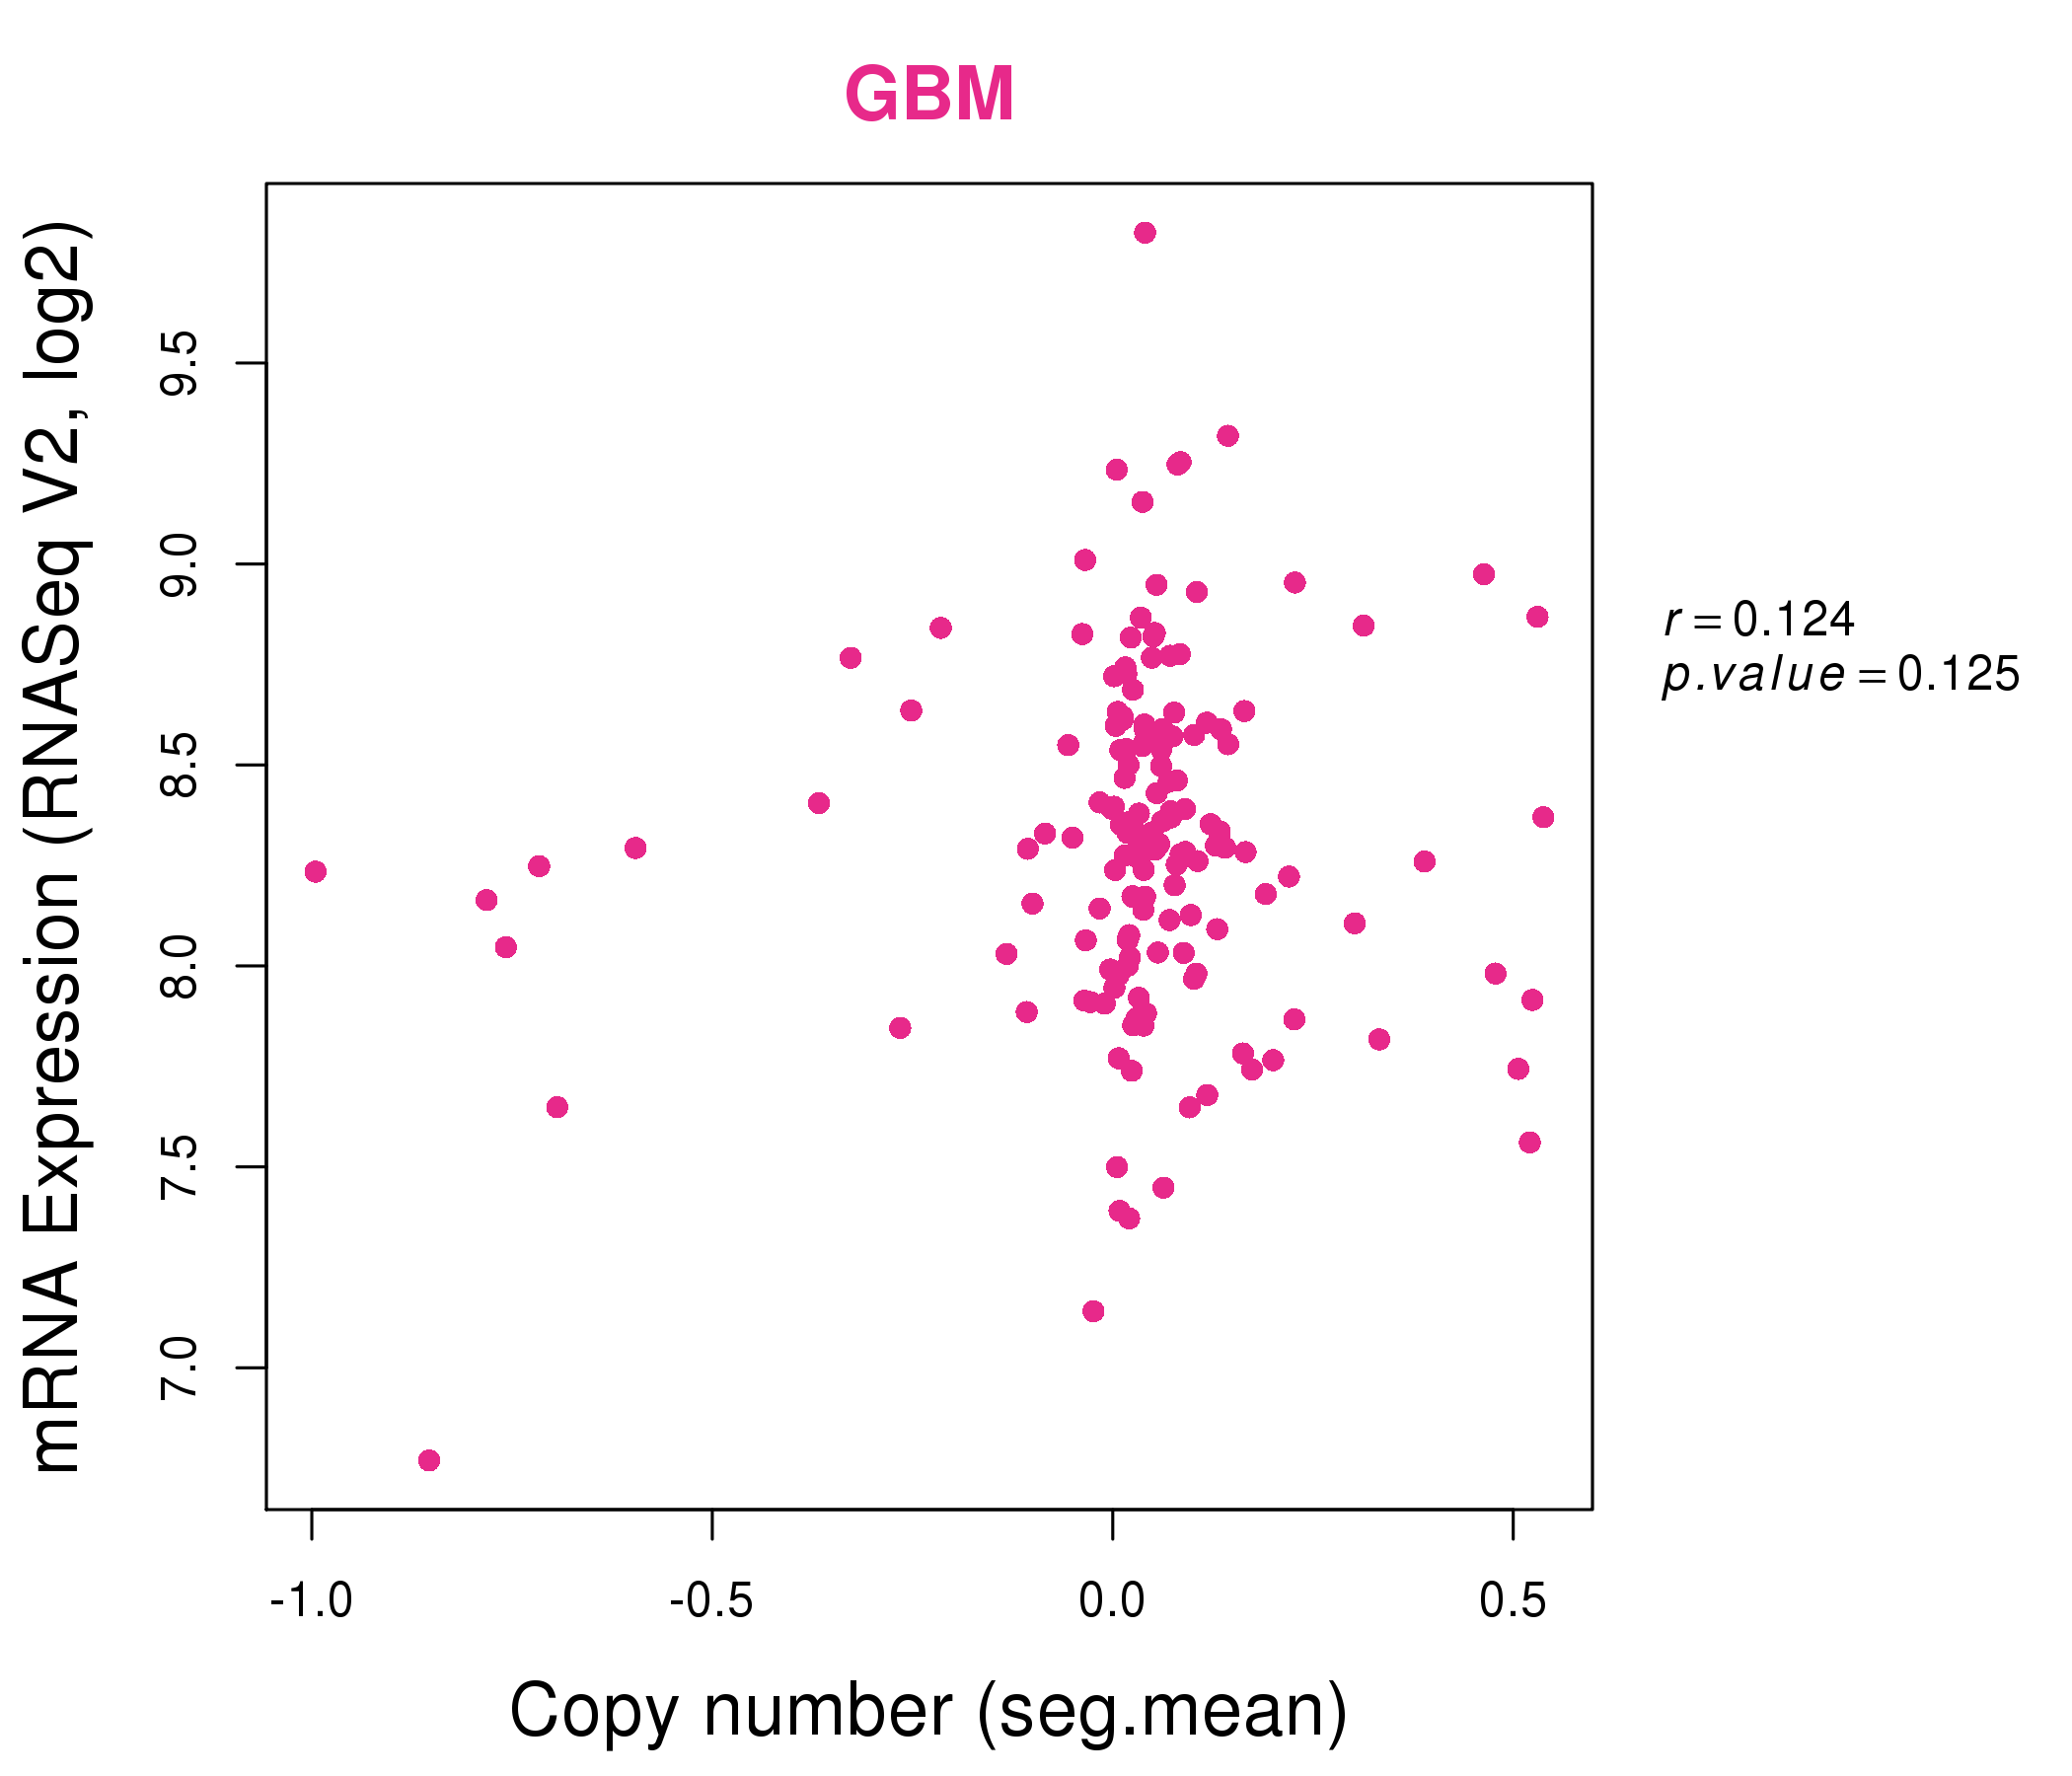
| * Normalized gene expression data of RNASeqV2 was extracted from TCGA using R package TCGA-Assembler. The URLs of all public data files on TCGA DCC data server were gathered at Jan-05-2015. Only eight cancer types have enough normal control samples for differential expression analysis. (t test, adjusted p<0.05 (using Benjamini-Hochberg FDR)) |
 |
| Top |
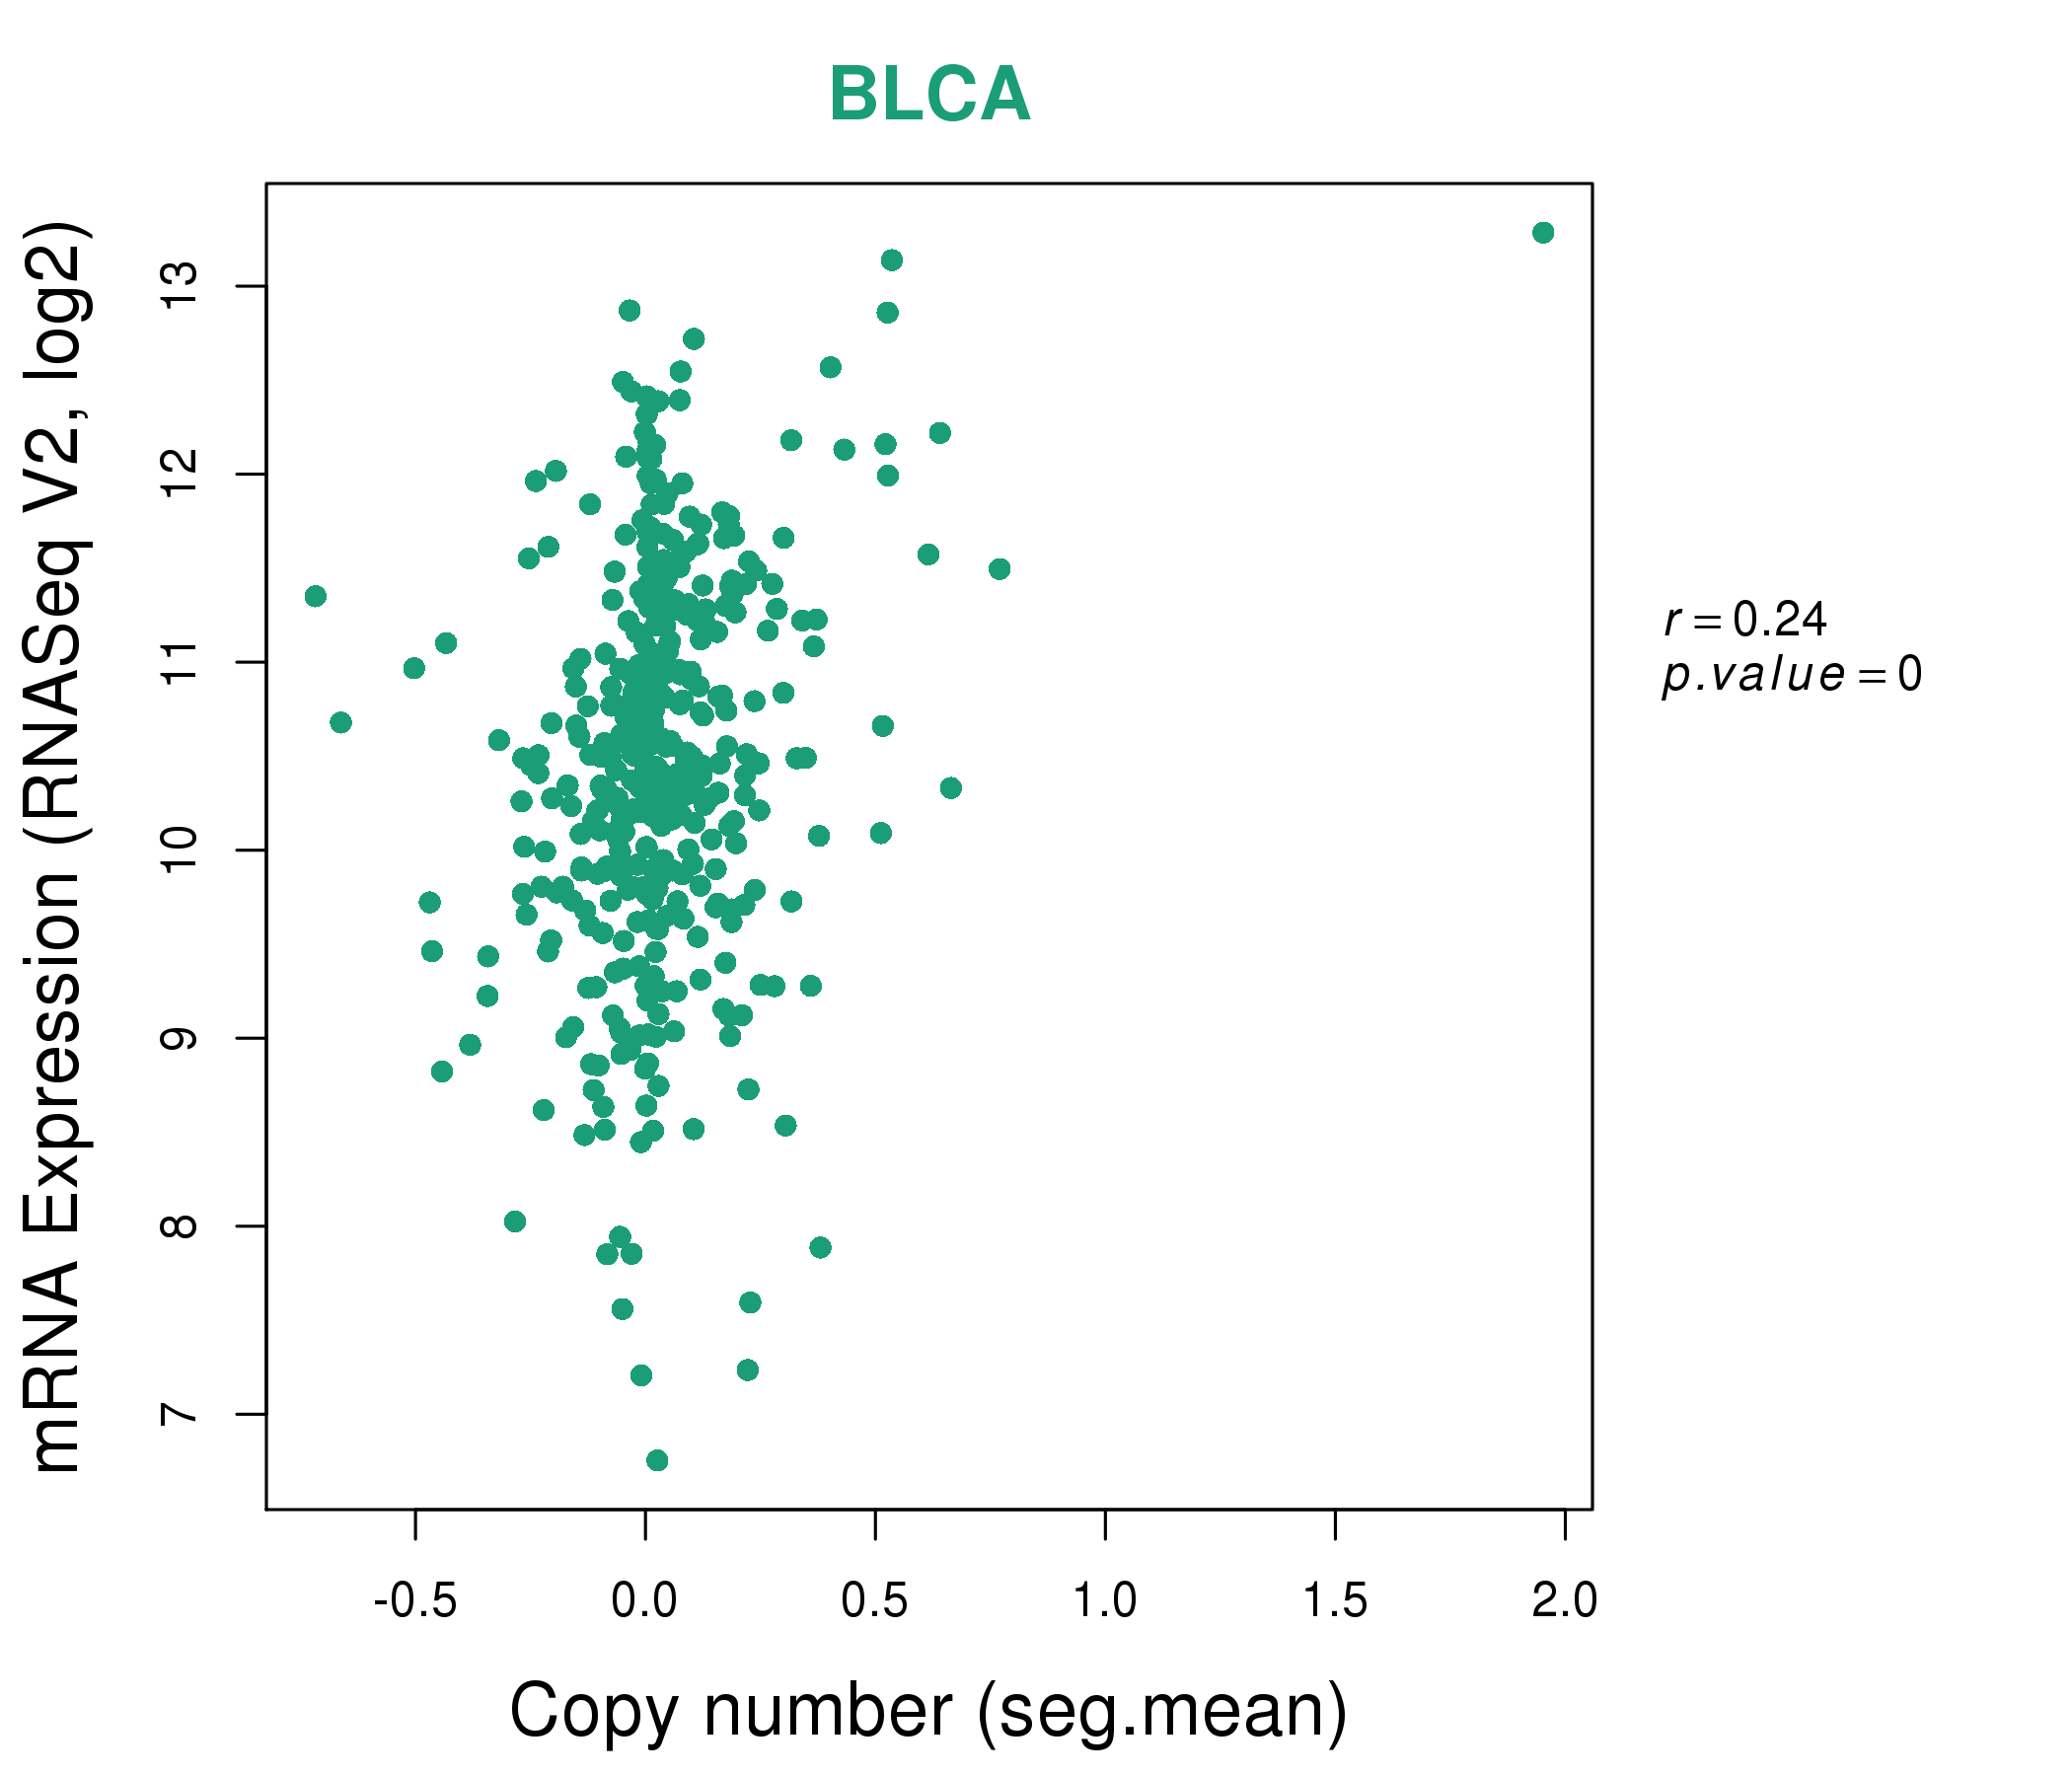
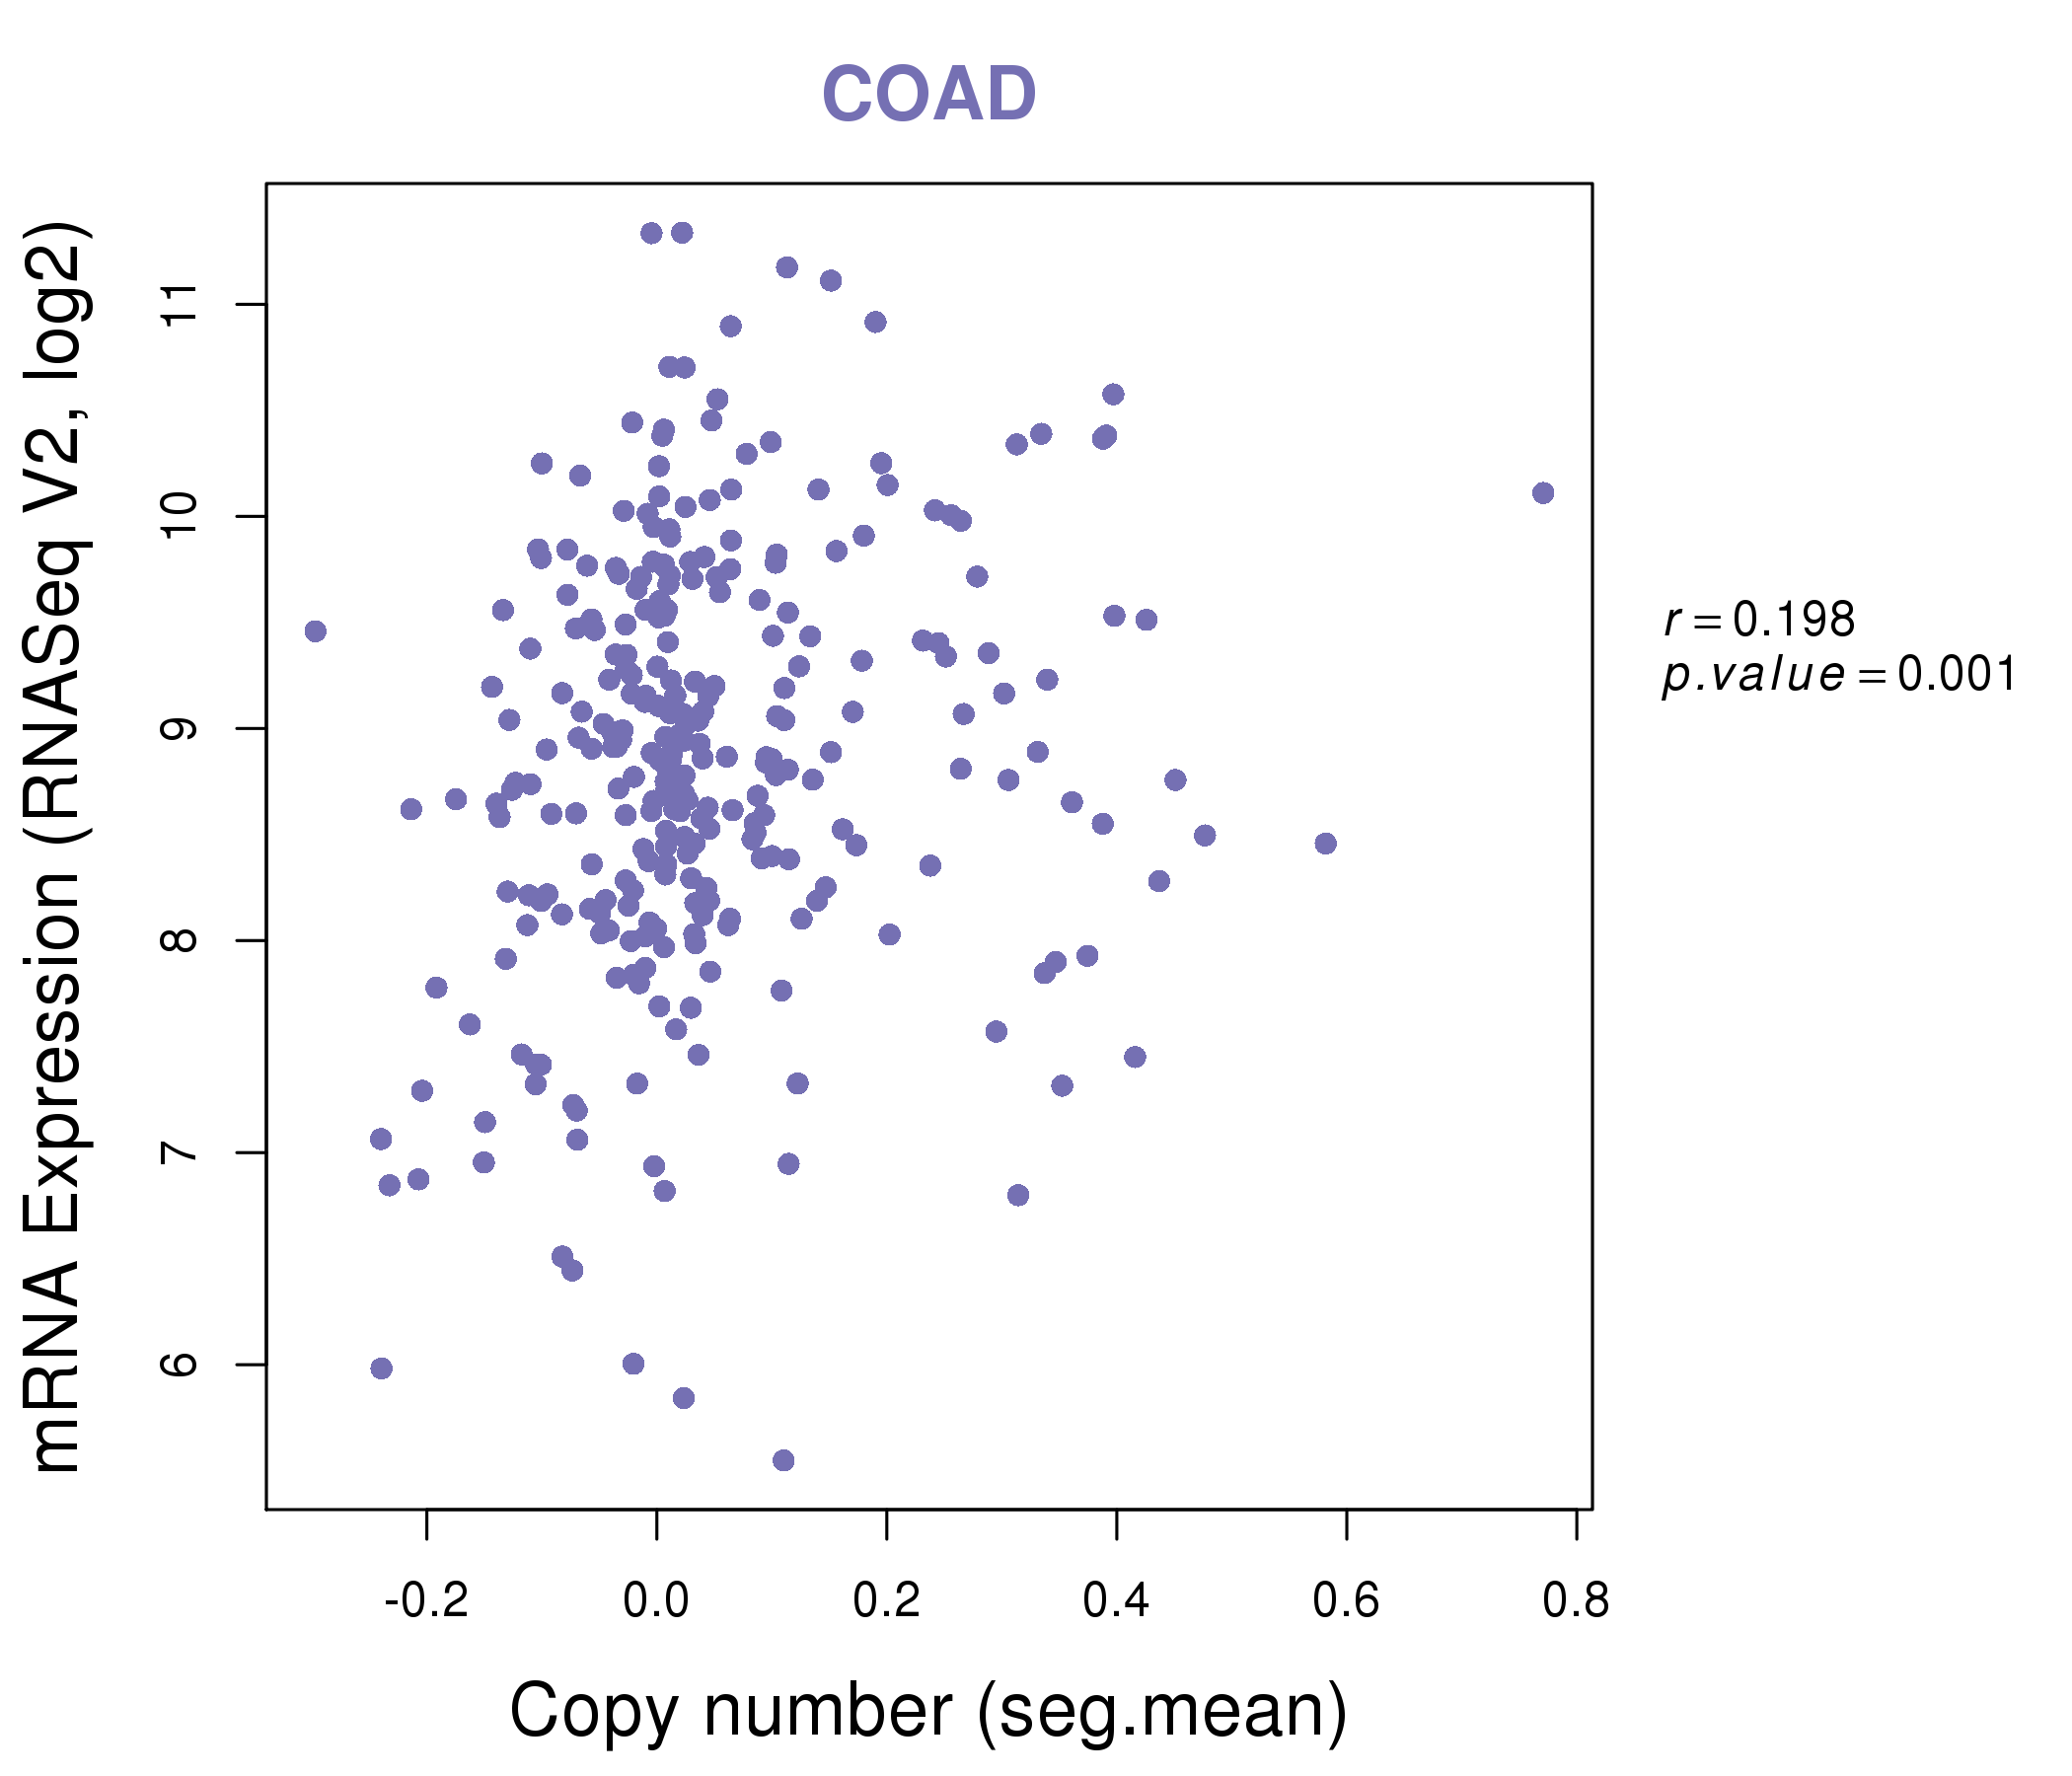
| * This plots show the correlation between CNV and gene expression. |
: Open all plots for all cancer types
 |
|
 |
|
| Top |
| Gene-Gene Network Information |
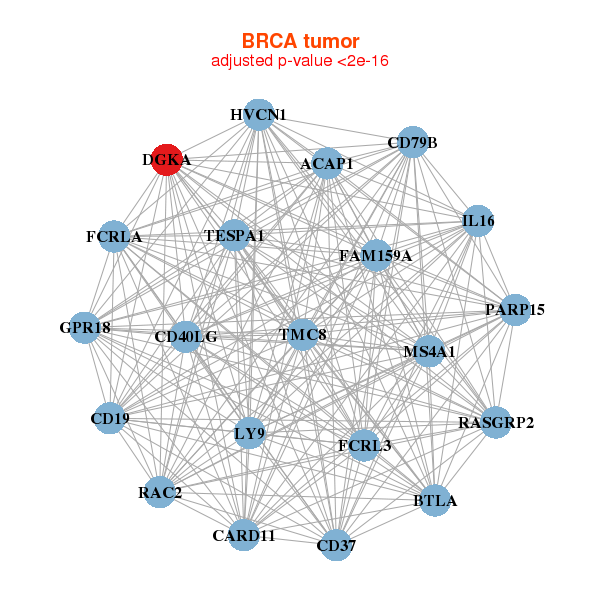
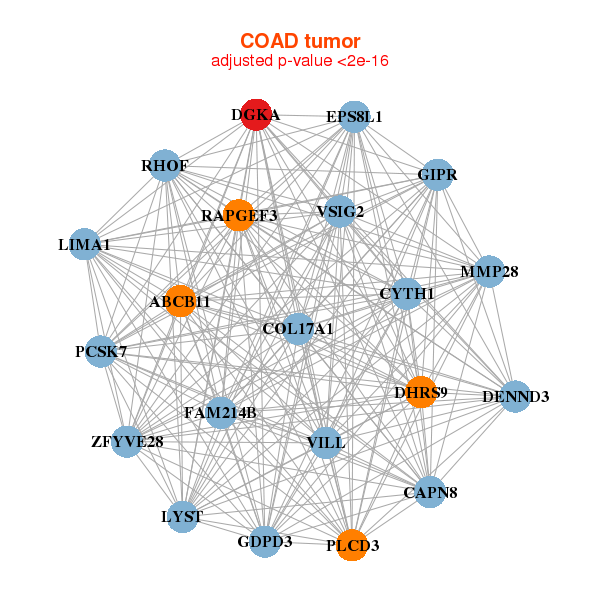
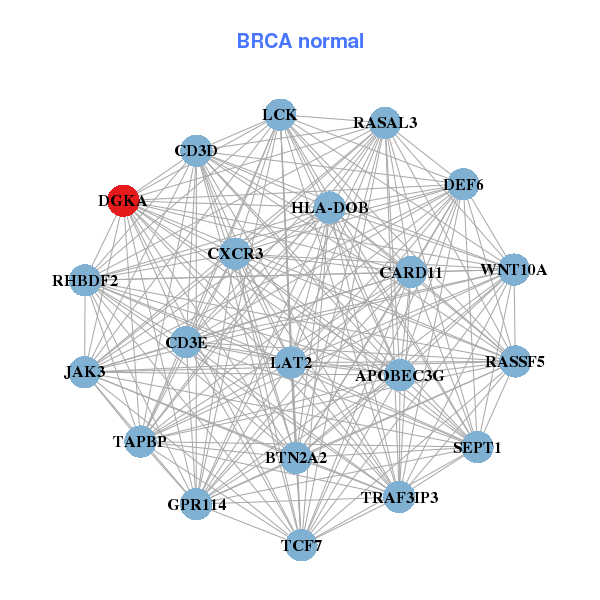
| * Co-Expression network figures were drawn using R package igraph. Only the top 20 genes with the highest correlations were shown. Red circle: input gene, orange circle: cell metabolism gene, sky circle: other gene |
: Open all plots for all cancer types
 |
| ||||
| ACAP1,BTLA,CARD11,CD19,CD37,CD40LG,CD79B, DGKA,FAM159A,FCRL3,FCRLA,GPR18,HVCN1,IL16, TESPA1,LY9,MS4A1,PARP15,RAC2,RASGRP2,TMC8 | APOBEC3G,BTN2A2,CARD11,CD3D,CD3E,CXCR3,DEF6, DGKA,GPR114,HLA-DOB,JAK3,LAT2,LCK,RASAL3, RASSF5,RHBDF2,SEPT1,TAPBP,TCF7,TRAF3IP3,WNT10A | ||||
 |
| ||||
| ABCB11,CAPN8,COL17A1,CYTH1,DENND3,DGKA,DHRS9, EPS8L1,GDPD3,GIPR,FAM214B,LIMA1,LYST,MMP28, PCSK7,PLCD3,RAPGEF3,RHOF,VILL,VSIG2,ZFYVE28 | SH3D21,C2CD2L,DAPK2,DGKA,DHRS11,EPS8L2,EPS8L3, EZR,FLVCR2,GCOM1,GRTP1,HECTD3,IFNLR1,KIAA0247, NR1I2,PDXP,PTK2B,RAB8A,RHOU,SLC9A3R1,SULT1A2 |
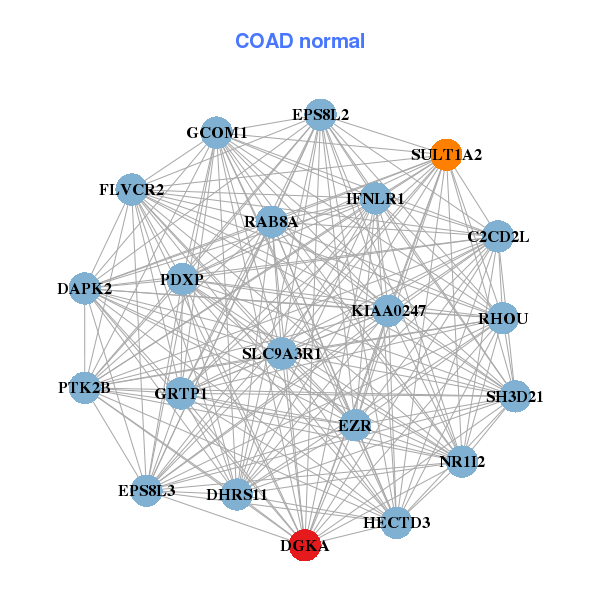
| * Co-Expression network figures were drawn using R package igraph. Only the top 20 genes with the highest correlations were shown. Red circle: input gene, orange circle: cell metabolism gene, sky circle: other gene |
: Open all plots for all cancer types
| Top |
: Open all interacting genes' information including KEGG pathway for all interacting genes from DAVID
| Top |
| Pharmacological Information for DGKA |
| DB Category | DB Name | DB's ID and Url link |
| Organism-specific databases | PharmGKB | PA27310; -. |
| Organism-specific databases | CTD | 1606; -. |
| * Gene Centered Interaction Network. |
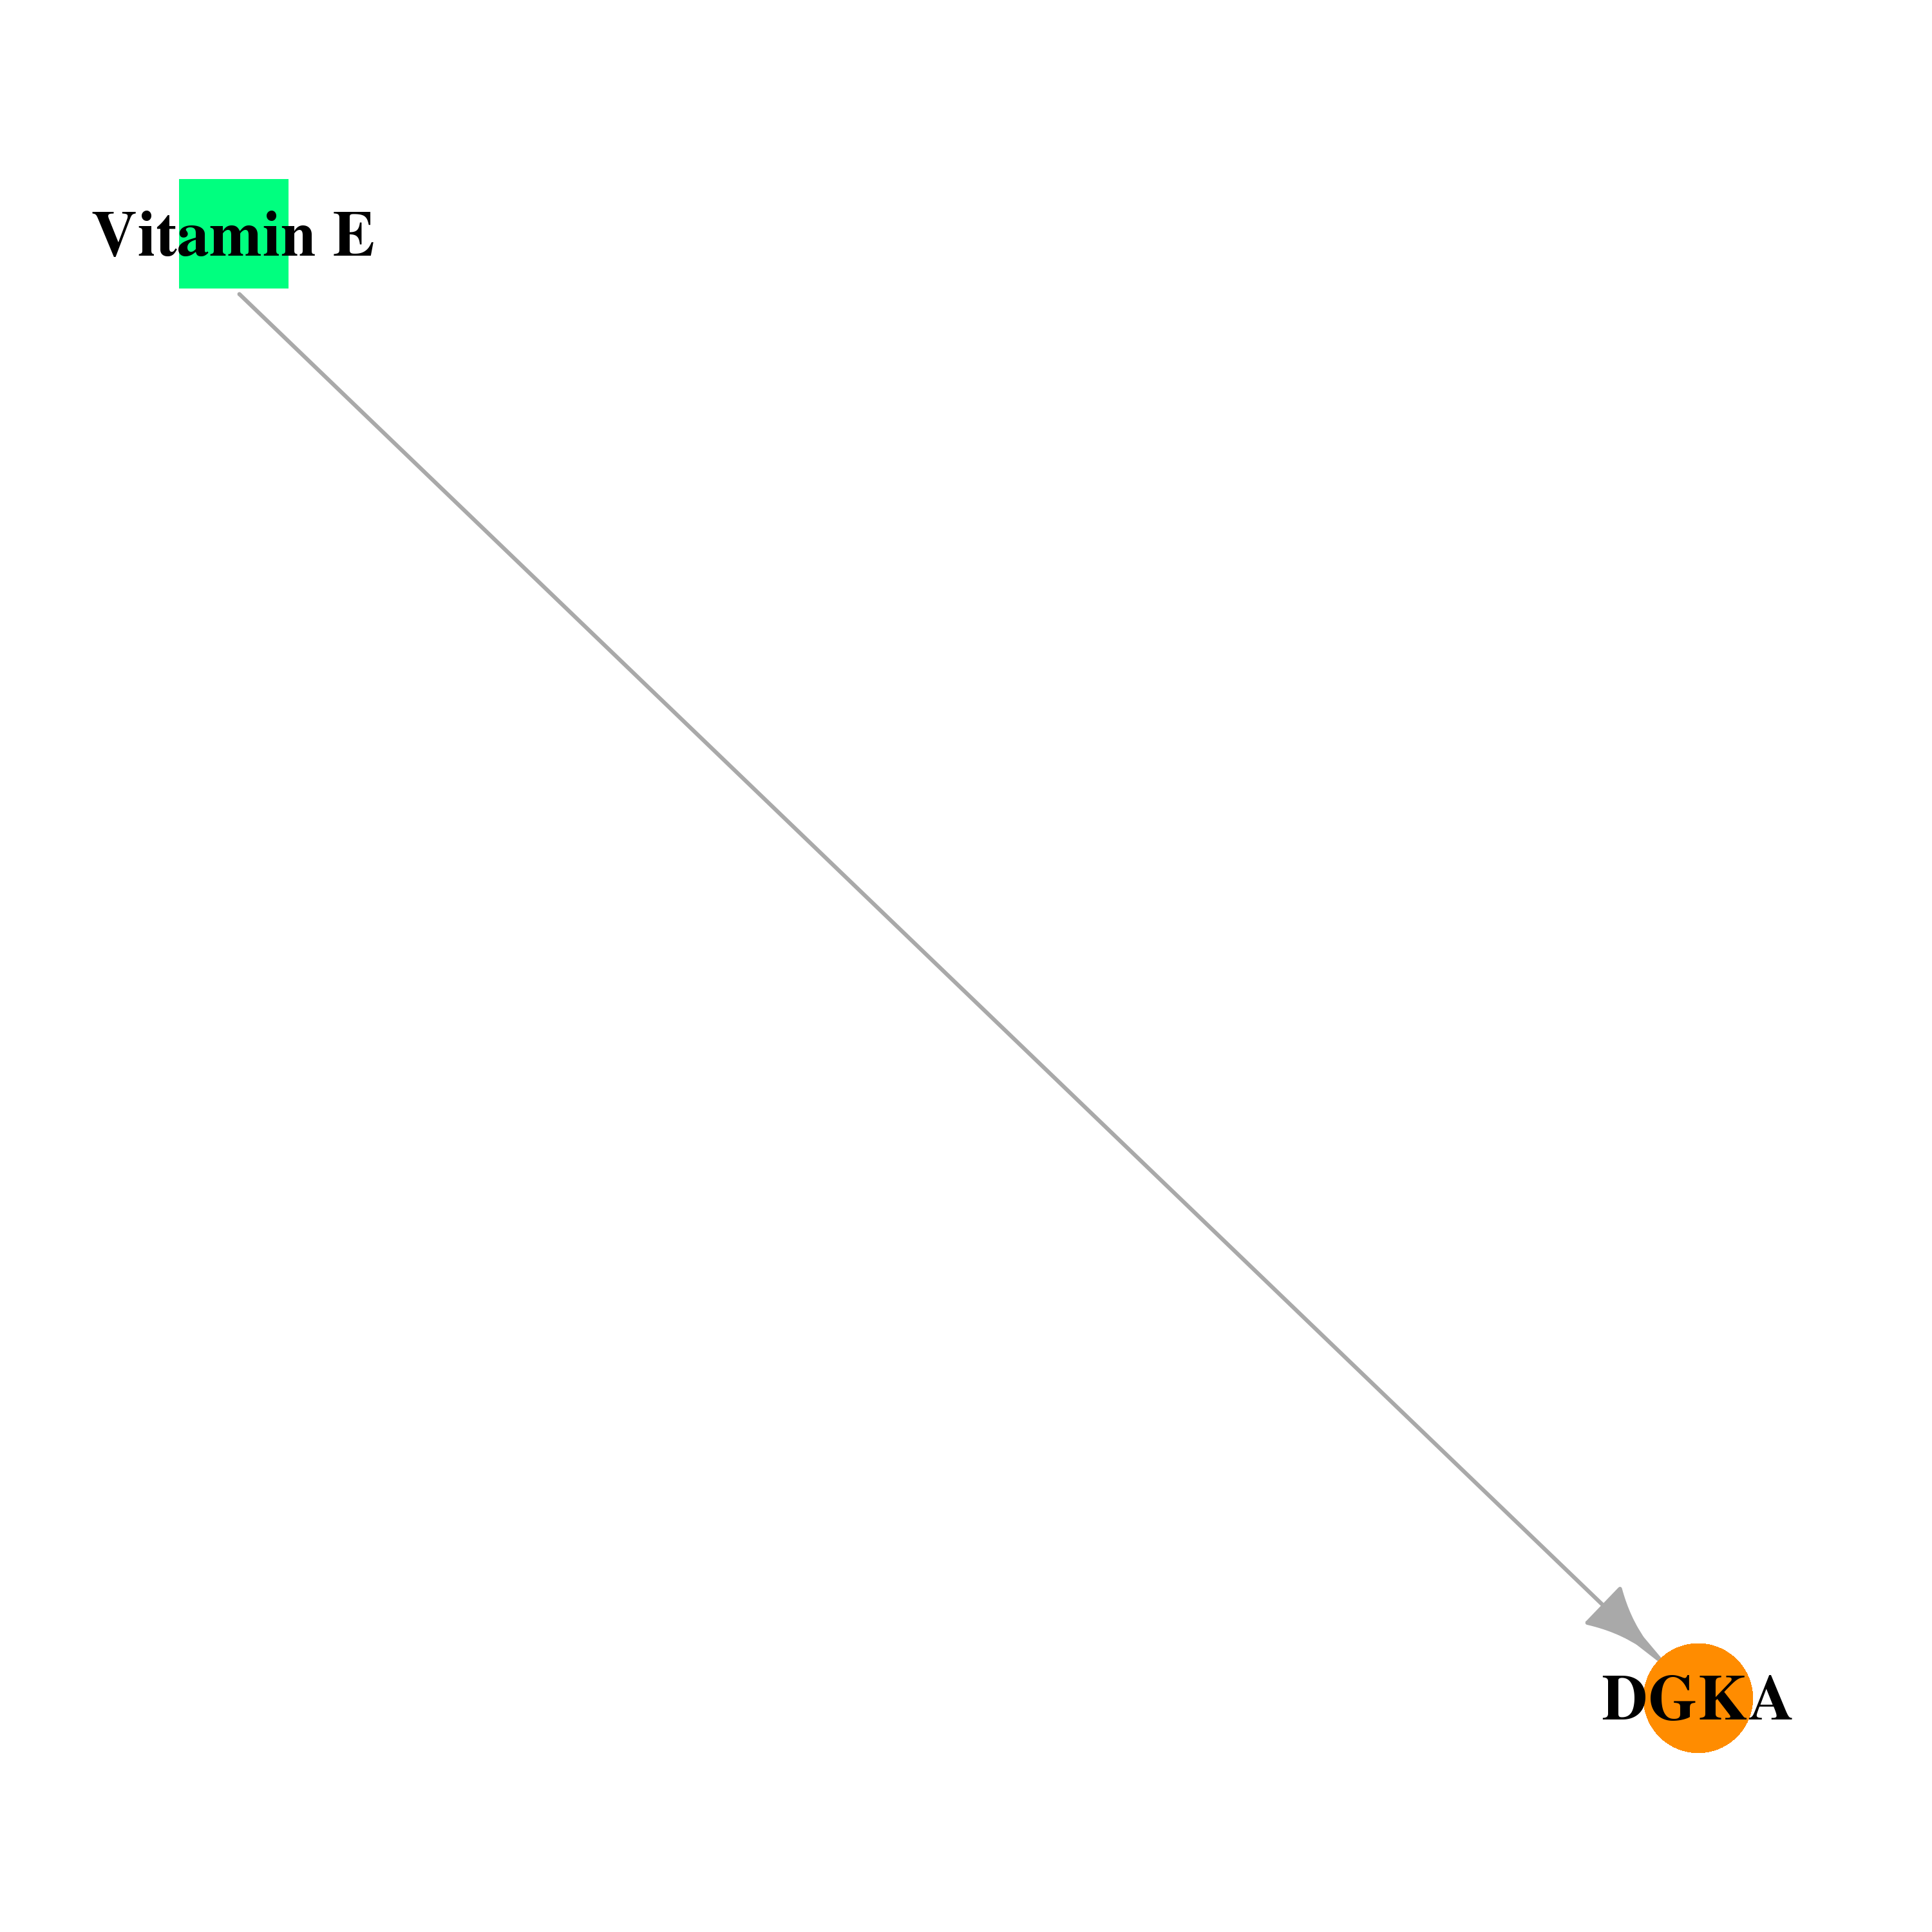 |
| * Drug Centered Interaction Network. |
| DrugBank ID | Target Name | Drug Groups | Generic Name | Drug Centered Network | Drug Structure |
| DB00163 | diacylglycerol kinase, alpha 80kDa | approved; nutraceutical | Vitamin E |  | 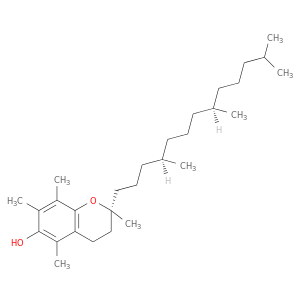 |
| Top |
| Cross referenced IDs for DGKA |
| * We obtained these cross-references from Uniprot database. It covers 150 different DBs, 18 categories. http://www.uniprot.org/help/cross_references_section |
: Open all cross reference information
|
Copyright © 2016-Present - The Univsersity of Texas Health Science Center at Houston @ |